

Abstract
Insulin is an important modulator of brain functions such as memory and appetite regulation. Besides the effect on neuronal activity, it is also possible that insulin has a direct vasodilatory effect on cerebral blood flow (CBF). We investigated the impact of increased insulin levels in the central nervous system on basal and task‐induced CBF as well as blood oxygenation level‐dependent (BOLD) response in the visual cortex using pulsed arterial spin‐labeling MRI. An intranasal insulin application was used to avoid peripheral hyperinsulinaemia, which would lead to a cascade of hormonal changes. In a control experiment, caffeine was applied due to its well‐known impact on the vasculature of the brain leading to a reliable reduction of CBF. Eight lean subjects were included in the study. On 2 separate days, intranasal human insulin or caffeine tablets were given to the subjects after fasting over night. On each day, basal CBF and task‐induced CBF were measured before and 30 min after application of insulin or caffeine in each subject. During the task condition, a flickering checkerboard was presented. Insulin had no effect on basal CBF and task‐induced CBF in comparison with drug‐free baseline measurement in the visual cortex and control regions. After caffeine application, however, there was a significant decrease of CBF during stimulation in the visual cortex. The BOLD response was not altered by insulin or caffeine between pre‐ and postdose measurements. In conclusion, we found no evidence for a direct vasodilatory effect of intranasal insulin on the cerebral vascular system in this study. Hum Brain Mapp, 2012. © 2011 Wiley Periodicals, Inc.
Keywords: glucose metabolism, central nervous system, insulin resistance, functional magnetic resonance imaging, pulsed arterial spin labeling, intranasal insulin, cerebral blood flow
INTRODUCTION
Insulin is an important regulator of neuronal function on single cell and network level in the central nervous system (CNS). Animal studies have shown that brain‐specific deletion of the insulin receptor in mice results in diet‐induced obesity and insulin resistance [Brüning et al.,2000]. Insulin is a hormone released in response to food intake and increasing glucose levels and is involved in the regulation of energy homeostasis [Schwartz et al.,2000; Woods et al.,1998]. In humans, it is hypothesized that reduced CNS insulin signaling contributes to the pathogenesis of common metabolic disorders, including diabetes and obesity [Porte et al.,2005]. Indeed, insulin resistance of the brain is associated with obesity and related metabolic diseases as well as cognitive impairments [Hallschmid and Schultes,2009; Tschritter et al.,2006].
To study the effect of insulin on the brain, insulin has been administered intravenously or intranasally (review in Hallschmid and Schultes [2009]). Intranasal insulin application, compared to intravenous systemic insulin administration, has the major advantage that insulin levels are specifically increased in the CNS. Thus, the unwanted side effects of systemic hyperinsulinaemia (e.g., hypoglycaemia, increased counterregulatory hormones, increased systemic blood flow) can be avoided.
Intranasal insulin reduces body weight and body fat mass in lean male subjects [Hallschmid et al.,2004] and improves memory function in humans [Benedict et al., 2007]. Furthermore, a reduced level of insulin action in the brain can play a role in neurodegenerative diseases [Craft and Watson,2004]. Reger et al. [2008] showed that intranasal insulin application improves memory function in Alzheimer's disease. In summary, insulin has various effects in the brain, an organ that has been considered to be insulin independent for a long time.
In addition, insulin may also affect cerebral blood flow (CBF) directly by masking insulin effects on neuronal activity. In the periphery, insulin acts as a vasoactive hormone and causes vasodilatation of peripheral tissues like skeletal muscle [Baron,1996]. Several studies investigated changes in CBF or brain activity measured by blood oxygenation level‐dependent (BOLD) signal during hyperinsulinaemic hypoglycaemic and euglycaemic conditions with positron emission tomography or functional magnetic resonance imaging (fMRI). During hypoglycaemia, it was consistently shown that basal CBF was increased [Kennan et al.,2005; Kerr et al.,1993; Powers et al.,1996]. However, it is unclear whether the increase in CBF during hypoglycaemic hyperinsulinaemia is caused by a systemic effect of peripheral vasodilatation, stress‐induced counterregulation, or specifically increased local CBF. In contrast, only two studies using systemically induced euglycaemic hyperinsulinaemia [Rotte et al.,2005; Seaquist et al.,2006] and one study using intranasal insulin application [Guthoff et al.,2010] have been performed by means of fMRI. Although Seaquist et al. [2006] reported a decrease of the BOLD response in the visual cortex during hyperinsulinaemia, Rotte et al. [2005] and Guthoff et al. [2010] did not find insulin‐induced changes in the visual cortex. However, these studies did not measure CBF.
To test whether insulin has a specific effect on CBF and BOLD response under euglycaemic conditions, we used an intranasal insulin application and simultaneously measured the corresponding BOLD and CBF responses by using arterial spin‐labeling MRI. Furthermore, we compared the insulin effect with caffeine. Caffeine is an adenosine antagonist and a well‐known vasoconstrictive agent reducing basal CBF [Liau et al.,2008; Perthen et al.,2008]. Therefore, caffeine ingestion is used as a standard approach to validate our experimental findings by measuring pharmacological‐induced changes in CBF.
We used visual stimulation, in addition to basal measurements, to elaborate the influence of insulin on both basal and task‐induced CBF, because these two measurements could be controlled via different neurochemical pathways. For example, Mintun et al. [2004] found that intravenously injected lactate does affect stimulus‐evoked CBF, but not baseline CBF. For visual stimulation, we used a flickering checkerboard, which is a passive perceptual stimulation that is not confounded by cognitive or emotional demands and a standard experimental approach to detect functional activation in the primary visual cortex.
We hypothesized that intranasal insulin will not change CBF, both during the basal and task‐induced state, in comparison with the predose measurement. Caffeine, however, as a vasoconstrictive agent should lead to a pronounced decrease in CBF in relation to the predose measurement.
MATERIALS AND METHODS
Participants
Eight healthy subjects participated in the study (five females and three males, age range, 18–34; body mass index, 20–25). The subjects had no history of psychiatric or neurologic problems. Written consent from the participants was obtained before the study, and the study protocol was approved by the local ethics committee.
For each subject, the study was conducted on two different days, starting approximately at the same time of day (see Table I). The subjects were asked to be abstinent from caffeine and food consumption for at least 12 h before the imaging sessions. Each day started with a predose CBF measurement for the two task conditions. Following the predose CBF measurement, the participants applied an intranasal insulin spray or ingested caffeine tablets outside of the scanner. About 30–40 min later, the subjects were placed again in the scanner, and the postdose CBF measurement was performed. This time interval was chosen to allow insulin as well as caffeine to reach the maximum effect in the brain [Born et al.,2002; Perthen et al.,2008]. The insulin was prepared in a nasal spray as described in Hallschmid et al. [2004]. Each puff consisted of 0.1 ml solution containing 40 IU insulin (400 IU/ml; Insulin Actrapid; Novo Nordisk, Mainz, Germany). Each subject received four doses of 0.1 ml insulin spray within 5 min. In the left and right nostril, two doses each were delivered resulting in a total insulin dose of 160 IU. Ingested caffeine tablets contained a 200 mg oral dose corresponding to a dose of two cups of coffee [Field et al.,2003; Laurienti et al.,2003]. The sequence of the insulin and caffeine application was randomized: four subjects applied insulin in the first day and ingested caffeine the second day and four subjects performed the experiments in the reversed order. Because of technical problems during scanning (artifacts during image acquisition), data of two subjects were disregarded for the analyses of the CBF data of the caffeine day, and the results for caffeine CBF measurements are presented for six subjects. After the experiments, the amount of daily/weekly caffeine intake was recorded. All participants reported a low‐to‐moderate (one to three cups of coffee, corresponding to 100–300 mg of caffeine) daily caffeine consumption.
Table I.
fMRI protocol
| fMRI protocol | ||
|---|---|---|
| Time of day | Insulin day | Caffeine day |
| 8:00 | Predose measurement | Predose measurement |
| Flickering checkerboard | Flickering checkerboard | |
| 8:30 | Intranasal insulin application (160 IU insulin) | Oral caffeine application (200 mg) |
| 9:00 | Postdose measurement | Postdose measurement |
| Flickering checkerboard | Flickering checkerboard | |
Experimental Task
A flickering radial checkerboard with full contrast alternating black and white patterns (temporal frequency of 8 Hz, inner radius 20, outer radius 200, radial square size 10, and angular square size 18 degree) with a cross hair in the center of the checkerboard was presented via a mirror mounted on the scanner head coil. A gray background, isoluminant to the average luminance of the checkerboard, with a crosshair in the middle of the screen was shown during resting phases. The stimuli were presented in a block design with six stimulation trials and seven alternating resting periods each lasting for 30 s starting and ending with a resting period [Seaquist et al.,2006]. The task lasted 390 s. The subjects were instructed to fixate the cross hair throughout the session. Imaging data during the resting phase are regarded as basal measurements and during stimulation as task‐induced measurements.
The stimulation was controlled by Cogent 2000 (http://www.vislab.ucl.ac.uk) interfaced with Matlab (MATLAB 6.5.1, The Mathworks, Natick, MA) and synchronized with the trigger from the scanner.
Data Acquisition
MR images were acquired on a 3T Siemens MAGNETOM TIM‐Trio (Erlangen, Germany) scanner using a 12‐channel trans‐receiver head coil. To improve the co‐registration between sessions, laser alignment was used to landmark the head position. For each session, the same slice positioning parameters were used.
Quantitative arterial spin labeling (ASL) images were obtained with a flow alternating inversion recovery—quantitative imaging of perfusion using a single subtraction (FAIR‐QUIPSSII) pulsed arterial spin labeling (PASL) encoding scheme with echo‐planar imaging readout. FAIR‐QUIPSSII sequence has less physiological noise contamination in both control and tag images of the ASL time course and higher signal‐to‐noise ratio compared to PICORE‐based tagging schemes [Cavusoglu et al.,2009]. A total of 24 oblique slices with slice thickness of 3.5 mm and 25% gap were acquired in a linear fashion from inferior to superior. Labeling was achieved using a hyperbolic secant inversion pulse with two presaturation pulses applied in the imaging planes immediately before the inversion tag to minimize the impact of the static tissue. Each PASL run consisted of 156 alternating tag and control images resulting in a total scan time of 390 s. Identical sequence parameters were used for all subjects (TI1 = 700 ms, TI2 = 1,400 ms, TE = 13 ms, TR = 2,500 ms, voxel size = 3.5 × 3.5 × 3.5 mm, FOV = 224 mm; FA = 90°). To determine the equilibrium magnetization for absolute CBF quantification, the same sequence parameters as above were used except that the TR and TI2 were chosen to be 10,000 ms and 4,000 ms, respectively [Cavusoglu et al.,2009].
Image Processing
Preprocessing of the ASL data was performed using FSL (FMRIB's Software Library, http://www.fmrib.ox.ac.uk/fsl) [Smith et al.,2004] and self‐written routines (MATLAB 7.4, The Mathworks, Natick, MA). Time courses of all voxels were motion‐corrected using the MCFLIRT module of FSL. The mean functional image of each session was used as reference for co‐registration. Registration of the respective mean volume images was carried out using a rigid body six parameter model and sinc interpolation. The estimated transformation parameters were then applied for all other images. Thereafter, the functional images were smoothed with a Gaussian kernel (FWHM 8 mm). CBF time series were generated by calculating control‐tag difference images using surround subtraction (i.e., computing the difference between each image and the average of its two nearest neighbors) in order to reduce the BOLD signal weighting of CBF [Wong et al.,1997]. Absolute perfusion quantification was calculated according to the formula ΔM = 2M 0B f · TI 1 e , where f denotes the CBF (ml/100 g‐min) and T 1B and M 0B are the longitudinal relaxation time and equilibrium magnetization of the arterial blood, respectively (see details for absolute quantification of CBF in Cavusoglu et al. [2009]). The value of T 1B at 3T was estimated to be 1,684 ms [Lu et al.,2004]. For determining the equilibrium magnetization of blood, we used a M 0B map instead of a global value, estimated by scaling the local tissue equilibrium magnetization taking into account the proton density and relaxation rate differences of gray matter and blood [Cavusoglu et al.,2009].
To get rid of the poststimulus undershoot effect of the previous task period, only images belonging to the second half of the resting period were used for further analyses. The end slices (the first and the last two slices) of the volumes in each run were excluded from the analyses due to possible imperfect slice profiles.
Data Analyses
To ensure that only gray matter voxels in the region‐of‐interests (ROIs) were included for the CBF quantification, the computed‐average ASL images of the basal and task‐induced measurements for both insulin and caffeine treatment conditions were intensity thresholded, because gray matter perfusion is higher than white matter perfusion [Cavusoglu et al.,2009]. Then, for each subject, the intersection of the computed gray matter masks for the predose and postdose measurements of each insulin or caffeine treatment were calculated to ascertain that only overlapping gray matter voxels were included in the statistical analyses. We defined ROIs on the thresholded ASL difference image individually for each subject. The three‐dimensional ROIs were hand drawn using the create mask option in FSLview. The mask for the checkerboard task includes the visual cortex (BA17, BA18, and BA19) encompassing seven slices (see Fig. 1). In addition to the visual cortex ROI, two control ROIs in the right anterior and left posterior part of the brain were created (Supporting Information Fig. 1) based on the study of Cavusoglu et al. [2009]. Thereafter, the average CBF of all voxels in the ROIs was computed. CBF‐values above 200 ml/g‐min were excluded from further analyses, because those high values are not in the physiologically plausible range implying artifacts due to motion or intra‐arterial signal [Wong et al.,1997].
Figure 1.
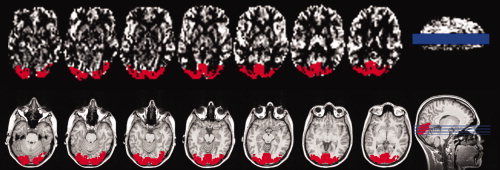
Illustration of region‐of‐interest (ROI) generation for the checkerboard task (seven continuous slices) covering the visual cortex of a representative subject. On the top, the ROI (depicted in red) is overlaid on the thresholded average ASL image. On the bottom, the ROI is shown on the coregistered anatomical image. The actual slice position can be seen on the sagital slice on the right side.
To quantify the activation maps of the BOLD signal in the ROIs, we performed a first level analysis on the preprocessed functional data using the full perfusion signal modeling in the FMRI Expert Analysis Tool implemented in FSL 4.1.1. (high‐pass filter cut off: 65 s). The mean of the control and tag images obtained from the PASL sequence were calculated and corresponded to BOLD‐weighted data. The resulting z‐statistic of the BOLD activation was multiplied with the prior computed gray matter masks of the visual cortex separately for each task. Only voxels exceeding a z‐value of three were used. The parameter estimates of each of those voxels were then converted into percent BOLD signal change, and the average signal changes during stimulation were calculated for the three ROIs.
Statistical Analyses of CBF and the BOLD Response
A two‐way repeated‐measure ANOVA was used to evaluate the effects of two within‐subjects' factors including stimulation (resting or stimulation period) and treatment (predose compared to postdose) on the CBF and BOLD response separately for the insulin and the caffeine day in the predefined ROIs.
Regression coefficients were computed using an ordinary least square fit between the CBF‐values in the same voxels before (predose measurement) and after treatment (postdose measurement) separately for condition and day. In addition, the r 2 values estimating the goodness of fit of the regression lines to the pre‐ and postdose conditions (separately for resting and stimulation periods) were computed.
The intraindividual comparison of the regression coefficients between insulin and caffeine day was performed on the six subjects participating in both treatment conditions using SPSS 13.0 statistical software (SPSS, Chicago, IL). For this analysis, a dummy variable coded with one for insulin day and 0 for caffeine day and the product of the dummy variable and the predose CBF‐values (pv) were computed and entered into a multiple regression model as predictors. The variable pv is used to test the null hypothesis that the regression coefficients are not significantly different between pre‐ and postdose measurements [Bosch,2005].
RESULTS
CBF Quantification Insulin Treatment
On the insulin day, we found a significant stimulation effect [F(1,7) = 36.55; P < 0.001] in the visual cortex with higher CBF‐values during stimulation (CBF increase 12.94%) compared to the resting period for both visits (Fig. 2, left).
Figure 2.
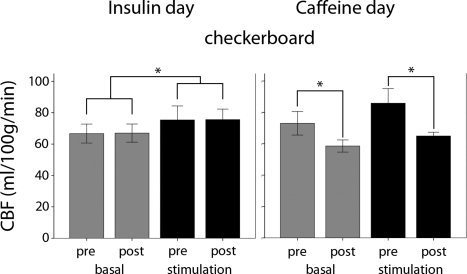
Group‐averaged basal and task‐related CBF (±SD) in the visual cortex ROI in the basal (gray bars) and task‐induced (black bars) measurements in the insulin day (left) and the caffeine day (right). Significant differences in the respective conditions are indicated with *(P < 0.05).
With respect to the treatment effect (predose compared to postdose measurement), no significant differences in baseline and task‐induced CBF before and after insulin application were found [F(1,7) = 0.018; P = 0.896] (Fig. 2, left). The mean and individual CBF‐values (±SD) for the visual cortex ROI are listed in Table II, for each condition and visit separately.
Table II.
Gray‐matter CBF‐values (ml/100 g/min) ± SD in the visual cortex on the insulin day and caffeine day
| Subject | Basal CBF | Stimulation CBF | ||
|---|---|---|---|---|
| Pre | Post | Pre | Post | |
| Insulin day | ||||
| 1 | 61.38 ± 12.40 | 62.28 ± 12.66 | 62.24 ± 11.72 | 67.57 ± 13.45 |
| 2 | 73.89 ± 13.24 | 76.45 ± 14.75 | 84.46 ± 17.34 | 84.08 ± 15.42 |
| 3 | 62.20 ± 11.62 | 67.24 ± 16.81 | 64.24 ± 12.17 | 79.68 ± 13.67 |
| 4 | 71.97 ± 14.96 | 67.41 ± 13.44 | 79.75 ± 17.88 | 69.41 ± 15.17 |
| 5 | 56.94 ± 9.58 | 57.68 ± 12.10 | 69.75 ± 17.93 | 68.60 ± 17.72 |
| 6 | 67.35 ± 15.86 | 69.00 ± 15.77 | 85.93 ± 24.21 | 82.21 ± 22.51 |
| 7 | 72.22 ± 14.27 | 71.86 ± 15.68 | 77.71 ± 17.47 | 80.56 ± 16.25 |
| 8 | 67.61 ± 11.56 | 64.14 ± 11.49 | 79.09 ± 16.84 | 72.63 ± 18.21 |
| Mean ± SD | 66.69 ± 6.03 | 67.00 ± 5.78 | 75.40 ± 8.94 | 75.59 ± 6.73 |
| Caffeine day | ||||
| 2 | 82.77 ± 11.73 | 61.28 ± 11.79 | 92.37 ± 19.70 | 67.67 ± 12.97 |
| 4 | 76.72 ± 15.47 | 61.01 ± 12.79 | 79.22 ± 15.58 | 67.41 ± 12.48 |
| 5 | 70.77 ± 12.51 | 56.64 ± 11.82 | 90.86 ± 19.22 | 62.89 ± 11.98 |
| 6 | 75.03 ± 12.00 | 56.20 ± 9.35 | 96.63 ± 22.65 | 65.64 ± 14.76 |
| 7 | 72.73 ± 16.14 | 63.25 ± 15.52 | 84.22 ± 16.45 | 64.61 ± 14.09 |
| 8 | 60.21 ± 8.45 | 53.06 ± 8.33 | 71.59 ± 16.78 | 61.68 ± 12.24 |
| Mean ± SD | 73.04 ± 7.51 | 58.57 ± 3.87 | 85.81 ± 9.31 | 64.98 ± 2.40 |
Regarding the control ROIs outside the visual cortex, we found no significant differences between treatment [anterior: F(1,7) = 0.554; P = 0.481; posterior: F(1,7) = 0.295; P = 0.604] and conditions [anterior: F(1,7) = 0.020; P = 0.892; posterior: F(1,7) = 0.233; P = 0.644]. A complete list of the individual and averaged CBF values, for the visual cortex treatment and visit separately, is provided in Supporting Information Table IIa,b.
CBF Quantification Caffeine Treatment
Caffeine, however, induced a treatment effect (predose compared to postdose measurement) with a significant reduction in baseline CBF in the visual cortex with an average decrease of 19.80% and in stimulation CBF with an average decrease of 24.8% [F(1,5) = 46.29, P = 0.001] (Fig. 2, right). This significant reduction was observed in each subject (Table II). As expected, there was also a significant main effect of stimulation compared to resting period [F(1,5) = 31.68; P = 0.002]. The individual CBF values (±SD) in the visual cortex ROI for each condition, and visit are listed in Table II.
The control ROIs showed highly significant CBF decreases in both areas after caffeine ingestion [anterior: F(1,5) = 141,488; P = 0.000; posterior: F(1,5) = 19,719; P = 0.007]. Like on the insulin day, there were no significant differences between baseline and task‐induced CBF [anterior: F(1,5) = 0.000; P = 0.996; posterior: F(1,5) 1,29; P = 0.308].
Voxel‐Wise CBF Regression Analyses
To investigate the voxel‐wise treatment effect (predose vs. postdose measurement), we performed a regression analysis using the CBF values of each voxel of the predose measurement as independent variables, and the corresponding voxels of the postdose measurement as dependent variables separately for baseline and stimulation of both tasks. Figure 3 shows voxel‐by‐voxel scatter plots and regression lines during the checkerboard task in the visual cortex ROI for the insulin (depicted in red) and caffeine treatment (depicted in blue) in a representative subject. Note that regression slopes of the CBF values for insulin treatment have a significant steeper slope compared to the caffeine administration in the basal and task‐induced state. During the insulin day, we found a strong linear relationship between the baseline CBF values of the pre‐ and postdose measurements for the checkerboard task (slope = 0.95; rank: 0.82–1.11). The regression slopes during checkerboard stimulation were slightly smaller: slope = 0.89; rank: 0.76–1.03. In comparison, the regression slopes during the caffeine day were consistently smaller (Supporting Information Table Ia). Intraindividual comparisons of the regression slopes between the insulin and caffeine day showed that all subjects exhibited a significant steeper slope after insulin compared to caffeine administration in the basal and task‐induced state (Supporting Information Table Ia). Similarly, the goodness of fit estimates (Supporting Information Table Ib) support our findings showing that significantly more variance can be explained after intranasal insulin (r 2 ranging from 0.74 to 0.83) compared to caffeine application (r 2 ranging from 0.48 to 0.65).
Figure 3.
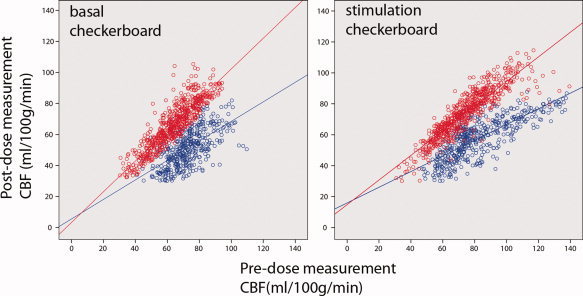
Voxel‐by‐voxel scatter plots and regression line in the visual cortex ROI for the insulin (depicted in red) and caffeine day (depicted in blue) in a representative subject. On the left, the scatter plots of the basal CBF in the checkerboard in the pre (x‐axes) and postdose (y‐axes) sessions are displayed. On the right, the scatter plots of the task‐induced changes during checkerboard (upper right) are presented. Each dot represents the gray matter CBF value (ml/100 g/min) in the same voxel in the pre‐ and postdose session. In the case with identical CBF values in each voxel in the predose and postdose measurements, the slope of the regression line is one. The regression slopes of the CBF values for insulin treatment are significant steeper compared to the caffeine treatment in the basal and task‐induced state.
BOLD Response
The BOLD response in the visual cortex was not significantly different between pre‐ and postdose measurements on the insulin day [F(1,7) = 0.018; P = 0.855; 0.45 ± 0.08 vs. 0.46 ± 0.08% signal change]. No voxel exceeded the statistical threshold (z > 3) in the two control ROIs. Similarly, caffeine ingestion showed no significant effect on the amplitude of the BOLD signal [F(1,5) = 5.892, P = 0.060; 0.50 ± 0.18 vs. 0.64 ± 0.13% signal change] when contrasted with the predose measurement.
DISCUSSION
This is the first imaging study showing that intranasally administered insulin has no direct effects on baseline and stimulus‐induced CBF measured with a noninvasive ASL MRI technique. Intranasal insulin has the advantage of showing no indirect or confounding systemic effects, which are triggered by intravenous insulin application (decrease of plasma glucose concentration and changes in peripheral hormone levels). We found similar CBF before and after intranasal insulin application for the basal and task‐induced CBF.
However, we cannot rule out that insulin has no effect on CBF in all brain areas. Furthermore, it might be that we missed a small effect of insulin on CBF because of the limited number of subjects. Another possible explanation for the negative finding in the present study may be that insulin concentration in the CNS is not increased sufficiently by the intranasal application. However, several previous studies (Born et al.,2002; Guthoff et al.,2010; Hallschmid and Schultes,2009) showed that intranasal insulin, equivalent dose as used in the present study, increases intracerebral insulin concentration and affects brain function.
In the visual cortex, we did not find a task‐induced change in the BOLD signal after intranasal insulin application compared to the predose measurement, which is in line with the studies by Guthoff et al. [2010] and Rotte et al. [2005]. In contrast, Seaquist et al. [2006] reported a profound reduction in the BOLD signal of around 16% in the visual cortex using a checkerboard task, but no changes in visual evoked potentials in the EEG (electroencephalography). However, based on the study design the authors could not rule out that this effect is mainly generated by fatigue.
The analyses of regression coefficients and the voxel‐wise CBF changes after insulin or caffeine application confirm the results using average CBF‐value. The comparison of the regression coefficients between the insulin and caffeine day revealed a significantly lower slope during caffeine administration compared to insulin. The lower slope during the caffeine day shows that the effect is detectable on the average but also on a single voxel level. Furthermore, the goodness of fit estimates revealed that significantly less variance can be explained after caffeine intake compared to insulin in relation to the respective predose measurement. This indicates a higher voxel‐to‐voxel variability after caffeine intake. It has to be mentioned that the predose CBF‐values cannot entirely predict the postdose CBF values after insulin application. Several methodological factors must be taken into account. Partial volume effects can lead to the miscalculation of the actual CBF [Chen et al., 2004] when the voxel covers not only arterial input (capillary beds) but also substantial intravascular signal as well as residual components of static magnetization from the blood. Beside these methodological issues, experimental as well as subject related factors can confound the stability of our measurements. Time‐varying effects, like fatigue and increasing hunger due to prolonged fasting, can change the blood flow. It has been shown that fasting and therefore caffeine deprivation in high‐caffeine users changes the BOLD signal and CBF differently compared to low‐caffeine users [Laurienti et al., 2002]. Further studies are required to clarify this issue.
Caffeine administration, in contrast, revealed a significant reduction in basal blood flow as well as during visual stimulation both on the group and on the individual level in all investigated cortical regions. The amount of decreases in CBF during caffeine were quite comparable with other studies [Field et al.,2003; Laurienti et al.,2003; Liau et al.,2008; Perthen et al.,2008]. Caffeine is a well‐known vasoactive agent, which leads to the constriction of the vessels and a subsequent decrease of basal CBF.
In summary, we found no evidence for a direct effect of intranasal insulin on the basal CBF as well as on task‐induced CBF changes in this study. Similarly, the BOLD signal seems to be not globally altered by insulin, although further studies are needed to resolve this issue. In contrast, caffeine as a control condition elicited pronounced decreases in CBF as a result of its vasoconstrictive effects. Although insulin seems to modify cerebral metabolism, it does not affect the vasculature in a notable manner. This is of particular relevance when using intranasal insulin as possible medication for food‐related disorders or even neurodegenerative diseases.
Supporting information
Additional Supporting Information may be found in the online version of this article.
Supporting Figure 1
Supporting Table 1
Supporting Table 2
Acknowledgements
We thank Stephanie Kullmann for their helpful comments and for help with English editing.
REFERENCES
- Baron AD ( 1996): Insulin and the vasculature—Old actors, new roles. J Investig Med 44: 406–412. [PubMed] [Google Scholar]
- Born J, Lange T, Kern W, McGregor GP, Bickel U, Fehm HL ( 2002): Sniffing neuropeptides: A transnasal approach to the human brain. Nat Neurosci 5: 514–516. [DOI] [PubMed] [Google Scholar]
- Bosch K. 2005. Elementare Einführung in die angewandte Statistik, 8th ed Wiesbaden: Germany, Vieweg. [Google Scholar]
- Brüning JC, Gautam D, Burks DJ, Gillette J, Schubert M, Orban PC, Klein R, Krone W, Müller‐Wieland D, Kahn CR ( 2000): Role of brain insulin receptor in control of body weight and reproduction. Science 289: 2122. [DOI] [PubMed] [Google Scholar]
- Cavusoglu M, Pfeuffer J, Ugurbil K, Uludag K ( 2009): Comparison of pulsed arterial spin labeling encoding schemes and absolute perfusion quantification. Magn Reson Imaging 27: 1039–1045. [DOI] [PubMed] [Google Scholar]
- Chen X‐Q, Fawcett JR, Rahman Y‐E, Ala TA, Frey WH II ( 1998): Delivery of nerve growth factor to the brain via the olfactory pathway. J Alzheimer's Dis 1: 35–44. [DOI] [PubMed] [Google Scholar]
- Craft S, Watson GS ( 2004): Insulin and neurodegenerative disease: Shared and specific mechanisms. Lancet Neurol 3: 169–178. [DOI] [PubMed] [Google Scholar]
- Guthoff M, Grichisch Y, Canova C, Tschritter O, Veit, R Hallschmid M, Häring H‐U, Preissl H, Hennige AM, Fritsche A ( 2010): Insulin modulates food‐related activity in the central nervous system. J Clin Endocrinol Metab 95: 748–755. [DOI] [PubMed] [Google Scholar]
- Hallschmid M, Schultes B ( 2009): Central nervous insulin resistance: A promising target in the treatment of metabolic and cognitive disorders? Diabetologia 52: 2264–2269. [DOI] [PubMed] [Google Scholar]
- Hallschmid M, Benedict C, Schultes B, Fehm H‐L, Born J, Kern W ( 2004): Intranasal insulin reduces body fat in men but not in women. Diabetes 53: 3024–3029. [DOI] [PubMed] [Google Scholar]
- Kennan RP, Takahashi K, Pan C, Shamoon H, Pan JW ( 2005): Human cerebral blood flow and metabolism in acute insulin‐induced hypoglycaemia. J Cereb Blood Flow Metab 25: 527–534. [DOI] [PubMed] [Google Scholar]
- Kerr D, Stanley JC, Barron M, Thomas R, Leatherdale BA, Pickard J ( 1993): Symmetry of cerebral blood flow and cognitive responses to hypoglycaemia in humans. Diabetologia 36: 73–78. [DOI] [PubMed] [Google Scholar]
- Laurienti PJ, Field AS, Burdette JH, Maldjian JA, Yen YF, Moody DM ( 2003): Relationship between caffeine‐induced changes in resting cerebral perfusion and blood oxygenation level‐dependent signal. Am J Neuroradiol 24: 1607–1611. [PMC free article] [PubMed] [Google Scholar]
- Liau J, Perthen JE, Liu TT ( 2008): Caffeine reduces the activation extent and contrast‐to‐noise ratio of the functional cerebral blood flow response but not the BOLD response. Neuroimage 42: 296–305. [DOI] [PMC free article] [PubMed] [Google Scholar]
- Lu H, Clingman C, Golay X, van Zijl PC ( 2004): Determining the longitidunal relaxation time (T1) of blood at 30 Tesla. Magn Reson Med 52: 679–682. [DOI] [PubMed] [Google Scholar]
- Mintun MA, Vlassenko AG, Rundle MM, Raichle ME ( 2004): Increased lactate/pyruvate ratio augments blood flow in physiologically activated human brain. Proc Nat Acad Sci USA 101: 659–664. [DOI] [PMC free article] [PubMed] [Google Scholar]
- Perthen JE, Lansing AE, Liau J, Liu TT, Buxton RB ( 2008): Caffeine‐induced uncoupling of cerebral blood flow and oxygen metabolism: A calibrated BOLD fMRI study. Neuroimage 40: 237–247. [DOI] [PMC free article] [PubMed] [Google Scholar]
- Porte D Jr, Baskin DG, Schwartz MW ( 2005): Insulin signaling in the central nervous system: A critical role in metabolic homeostasis and disease from C. elegans to humans. Diabetes 54: 1264–1276. [DOI] [PubMed] [Google Scholar]
- Powers WJ, Hirsch IB, Cryer PE ( 1996): Effects of stepped hypoglycemia on regional cerebral blood flow response to physiological brain activation. Am Physiol Soc 0363–6135/96. [DOI] [PubMed] [Google Scholar]
- Reger MA, Watson GS, Green PS, Baker LD, Cholerton B, Fishel MA, Plymate SR, Cherrier MM, Schellenberg GD, Frey WH II, Craft S ( 2008): Intranasal insulin administration dose‐dependently modulates verbal memory and plasma amyloid‐β in memory‐impaired older adults. J Alzheimers Dis 13: 323–331. [DOI] [PMC free article] [PubMed] [Google Scholar]
- Rotte M, Baerecke C, Pottag G, Klose S, Kanneberg E, Heinze H‐J, Lehnert H ( 2005): Insulin affects the neuronal response in the medial temporal lobe in humans. Neuroendocronology 81: 49–55. [DOI] [PubMed] [Google Scholar]
- Schwartz MW, Woods SC, Porte D Jr, Seeley RJ, Baskin DG ( 2000): Central nervous system control of food intake. Nature 404: 661–671. [DOI] [PubMed] [Google Scholar]
- Seaquist ER, Chen W, Bendedict LE, Ugurbil K, Kwag JH, Zhu XH, Nelson CA ( 2006): Insulin reduces the BOLD response but is without effect on the VEP during presentation of a visual task in humans. J Cereb Blood Flow Metab 27: 154–160. [DOI] [PubMed] [Google Scholar]
- Smith SM, Jenkinson M, Woolrich MW, Beckmann CF, Behrens TE, Johansen‐Berg H, Bannister PR, De Luca M, Drobnjak I, Filtney DE, Niazy RK, Saunders J, Vickers J, Zhang Y, De Stefano N, Brady JM, Matthews PM ( 2004): Advances in functional and structural MR image analysis and implementation as FSL. Neuroimage 23( Suppl 1): 208–219. [DOI] [PubMed] [Google Scholar]
- Tschritter O, Preissl H, Hennige AM, Stumvoll M, Porubska K, Frost R, Marx H, Klösel B, Lutzenberger W, Birbaumer N, Häring H‐U, Fritsche A ( 2006): The cerebrocortical response to hyperinsulinemia is reduced in overweight humans: A magnetoencephalographic study. Proc Natl Acad Sci USA 103: 12103–12108. [DOI] [PMC free article] [PubMed] [Google Scholar]
- Wong EC, Buxton RB, Frank LR ( 1997): Implementation of quantitative perfusion imaging techniques for functional brain mapping using pulsed arterial spin labeling. NMR Biomed 10: 237–249. [DOI] [PubMed] [Google Scholar]
- Woods SC, Seeley RJ, Porte D Jr, Schwartz MW ( 1998): Signals that regulate food intake and energy homeostasis. Science 280: 1378–1383. [DOI] [PubMed] [Google Scholar]
Associated Data
This section collects any data citations, data availability statements, or supplementary materials included in this article.
Supplementary Materials
Additional Supporting Information may be found in the online version of this article.
Supporting Figure 1
Supporting Table 1
Supporting Table 2