

Abstract
Objectives: Abnormal task‐related activation and connectivity is present in schizophrenia. The aim of this study was the analysis of functional networks in schizophrenia patients in remission after the first episode. Experimental design: Twenty‐nine male patients in remission after the first episode of schizophrenia and 22 healthy controls underwent examination by functional magnetic resonance during verbal fluency tasks (VFT). The functional connectivity of brain networks was analyzed using independent component analysis. Results: The patients showed lower activation of the salience network during VFT. They also showed lower deactivation of the default mode network (DMN) during VFT processing. Spectral analysis of the component time courses showed decreased power in slow frequencies of signal fluctuations in the salience and DMNs and increased power in higher frequencies in the left frontoparietal cortex reflecting higher fluctuations of the network activity. Moreover, there was decreased similarity of component time courses in schizophrenia—the patients had smaller negative correlation between VFT activated and deactivated networks, and smaller positive correlations between DMN subcomponents. Conclusions: There is still an abnormal functional connectivity of several brain networks in remission after the first episode of schizophrenia. The effect of different treatment modalities on brain connectivity, together with temporal dynamics of this functional abnormality should be the objective of further studies to assess its potential as a marker of disease stabilization. Hum Brain Mapp, 2013. © 2012 Wiley Periodicals, Inc.
Keywords: disconnection, remission, schizophrenia
INTRODUCTION
Schizophrenia is a chronic brain disease. Fortunately, a significant number of patients achieve remission of clinical symptoms during the course of the disease, especially after its first episode (Watt et al., 1983). However, when patients experience no symptoms in remission, they may have problems to accept the chronicity of the condition, the necessity to use antipsychotic medication for the maintenance treatment, and they may insist on the medication withdrawal. This is, especially, the case 1 year after the first episode when contemporary treatment guidelines allow for careful medication withdrawal (Falkai et al., 2006). However, the risk for relapse is still high and continuation of antipsychotic medication seems to minimize it (Leucht et al., 2003). Therefore, objective data that show existence of a brain dysfunction in clinical remission that is a subject of treatment would allow more rational discussion between physicians, patients, and their families.
On the neurobiological level, schizophrenia is linked with abnormal brain connectivity. There is evidence for altered integrity of white matter tracts (Kubicki et al., 2007), that is reflected in abnormal functional connectivity—abnormal correlations between remote neurophysiological events, or more generally, abnormal cooperation of individual networks of the brain (Calhoun et al., 2009a). Friston and Frith found abnormal correlations between the frontal and temporal areas during verbal fluency task (VFT) and coined the concept of frontotemporal disconnection as a key feature of the neurobiology of schizophrenia (Friston and Frith, 1995). Later on, abnormalities of frontotemporal cooperation were also seen during other cognitive paradigms, such as working memory tests (Meyer‐Lindenberg et al., 2005; Wolf et al., 2009), word encoding and recognition (Ragland et al., 2004), sentence completion task (Lawrie et al., 2002), and talking (Ford et al., 2002), showing that this abnormality is a generalized feature of brain functioning in schizophrenia. The question is if there is still the functional abnormality present in remission (and therefore, it can be used for above mentioned purposes) or if there is a normalization of functional connectivity together with symptom remission? The data that would allow answering these questions is scarce.
Only one study focused on brain activation during VFT in acute psychosis and in remission. Irrespective of the clinical state, schizophrenia patients showed decreased activation in frontal regions, with more pronounced effects expressed in remission (Fu et al., 2005). Several other studies have found changes in connectivity in the acute phase of the disease: altered connectivity of the anterior cingulate (Boksman et al., 2005), or failure of task related deactivation of the superior temporal gyrus (Fletcher et al., 1996). During the stable phase, however, the results were inconsistent. One small positron‐emission tomography (PET) study with six “asymptomatic” schizophrenia patients found no differences of frontotemporal covariation (Dye et al., 1999). Similarly, in a small sample of 10 clinically stable schizophrenia patients, with residual symptoms, there was no difference in functional connectivity between frontal and temporal regions during VFT, but failure to deactivate the precuneus and abnormal connectivity between the prefrontal cortex and anterior cingulate (Spence et al., 2000). Another small study in “high‐functioning” schizophrenia patients failed to find regional differences other than additional bilateral frontal activation (Weiss et al., 2004). Other studies show that the functional connectivity is linked with the magnitude of symptoms or features of psychosis: there is evidence for the effect of dopaminergic manipulation on the functional connectivity of frontotemporal regions (Fletcher et al., 1996), and correlation between the level of connectivity of frontotemporal regions and the expression of psychotic symptoms (Lawrie et al., 2002).
Although the data suggest that there is still abnormal functional connectivity in remission of schizophrenia, the definitive conclusion cannot be made since individual studies differed substantially in the definition of remission, and the power to detect significant changes due to small sample sizes. Moreover, the method used for connectivity analysis was hypothesis driven in most cases, that is, certain measure of similarity between a priori selected regions (“seeds”) was computed. If the pathological process is more widespread (as the aforementioned studies suggest), then this approach might be suboptimal for detection of changes in schizophrenia.
The aim of this study was the analysis of functional connectivity of brain networks in schizophrenia patients in remission after the first episode using Independent Component Analysis (ICA). ICA is a statistical method that is able to extract independent components from a complex mixture of signals. In the context of functional magnetic resonance imaging (fMRI), it produces a set of spatially independent and temporally synchronous brain networks; therefore, it is suitable for group functional connectivity analysis (Calhoun et al., 2001; Calhoun et al., 2004). The advantage of ICA over seed correlation is that ICA does not require a priori selection of the seed region whose connectivity profile is to be analyzed. ICA enables complex, data‐driven analysis of brain functional connectivity. The output of ICA allows for analysis of the task involvement of whole networks, their spatial distribution, spectral properties of the time course of the component signal, and the magnitude of signal similarity of individual brain networks—so called Functional Network Connectivity (Jafri et al., 2008).
To be able to study the involvement and cooperation of individual networks of the brain of schizophrenia patients we focused on the brain activity changes during VFT—the original paradigm that led to the definition of disconnectivity concept. VFT requires production of as many words as possible according to a given sorting criterion in a specified time interval. Therefore, the task requires guided retrieval of words from long‐term memory, and involves at least three accompanying cognitive functions—verbal memory, executive functions responsible for initiation, switching, or selection of sorting strategy, and psychomotor speed (van Beilen et al., 2004). Therefore, this task seems to be suitable for the analysis of cooperation of individual networks that subserves several cognitive functions involved—during the task, frontal, temporal, parietal, and cerebellar regions are activated, with concurrent deactivation of precuneus (Amunts et al., 2004; Costafreda et al., 2006; Frith et al., 1991; Fu et al., 2002; Gurd et al., 2002; Pihlajamaki et al., 2000). Interestingly, the involvement of temporal regions is not as clear—PET studies demonstrated consistently task related temporal deactivation, together with a negative correlation between frontal and temporal activations (Dye et al., 1999; Frith et al., 1995; Frith et al., 1991; Spence et al., 2000). However, some fMRI studies detected task related activation of temporal areas—superior, middle, and inferior temporal cortex [BA 21, 22, 37, 39; (Fu et al., 2002)], or mediotemporal regions (Pihlajamaki et al., 2000). Studies in schizophrenia (irrespective to clinical state) show abnormal VFT performance (Elvevag et al., 2001; Rossell, 2006), decreased activation of lateral prefrontal cortex, insula, and anterior cingulate (Curtis et al., 1998; Fu et al., 2005; Yurgelun‐Todd et al., 1996), increased deactivation of medial prefrontal cortex (Curtis et al., 1998), slower dynamics of the prefrontal cortex activity (Takizawa et al., 2008), and abnormal pattern of functional network connectivity (Frith et al., 1995). Based on previous findings we expected abnormal activation of prefrontal and temporal regions, abnormal functional connectivity between task modulated networks and its relationship with clinical features of in schizophrenia patients in remission.
METHODS
Subjects
Twenty‐nine male schizophrenic patients (mean age 25.0, SD 4.8 years) in remission 1 year after their first episode (that is their symptoms fulfilled the criteria for schizophrenia for the first time when admitted to the department, including the time criterion, which is duration of symptoms longer than 1 month) were included. They were recruited from a longitudinal observational study; the details can be found in previous publications (Ceskova et al., 2007; Ceskova et al., 2005). The diagnosis was established during clinical interviews guided by the International Statistical Classification of Disease and Related Health Problems (ICD‐10) research criteria. The diagnosis was established as follows. The subject underwent a clinical interview focused on information about family and personal history, somatic conditions, substance abuse, pharmacological history and current treatment, previous psychiatric conditions, and finally, on the current clinical manifestation, symptoms, duration, and functional impact. The interview was performed by a psychiatrist trained in conducting diagnostic interviews. Usually, the clinical interview lasted 60 to 90 min. When possible, information from relatives was collected as well. Next, the patients were physically examined, including blood (hematology, biochemistry) and urine analysis (biochemistry, toxicology). If abnormal findings were present, their origin was traced by additional examinations. A fully trained senior psychiatrist reviewed all information, established the diagnosis and suggested the case for inclusion in the study. An investigating senior psychiatrist again reviewed the clinical information and diagnosis, and checked for exclusion criteria. The diagnosis was reevaluated once more at the 1‐year follow‐up. The majority of patients suffered from Paranoid schizophrenia (86.2%), only a small fraction of subjects were treated for undifferentiated or simplex schizophrenia. All patients were right handed. Exclusion criteria were as follows: substance dependence detected by clinical evaluation and urine toxicology tests, neurological or systemic disease with a known relationship to brain alteration detected by clinical evaluation, physical and neurological examination, serum and urine chemistry and blood count, serological examination for neurotropic agents, clinical evaluation of MRI scans, and contraindications for MRI. The patients were readmitted 1 year after the first episode to reassess the diagnosis and to evaluate the outcome of the illness. Symptomatology was evaluated using the Positive and Negative Syndrome Scale (PANSS; Kay et al., 1987). Remission 1 year after the first episode was defined according to the following operational criteria: a score of 3 or less on items P1, G9 (delusions, unusual thought content), P2 (conceptual disorganization), P3 (hallucinatory behavior), G5 (mannerisms, posturing), N1 (blunted affect), N4 (social withdrawal), and N6 (lack of spontaneity) for 6 months (Andreasen et al., 2005). Functioning was assessed using the Global Assessment of Functioning Scale (GAF). They were also assessed with the VFT ± 1 day of MRI scanning. The performance of the patients was compared to established norms. During the year following the first episode, they were followed in community outpatient departments and treated according to the clinical judgment of their outpatient psychiatrist. At the time of scanning, 48% of the patients were treated with risperidone tablets (mean dose 2.8 mg, SD 1.3) or long‐lasting risperidone injections (all patients treated with the dose 25 mg/2 weeks), 28% with olanzapine (mean dose 11.6 mg, SD 5.5), the rest were treated with amisulpride (2 patients, mean dose 400 mg, SD 283), quetiapine (2 patients, mean dose 400 mg, SD 283), clozapine (1 patient, 300 mg), or oxyprothepine decanoate (1 patient, 25 mg/4 weeks). Only one subject had been withdrawn from antipsychotic medication.
Twenty‐two healthy subjects (mean age 24.2, SD 1.8) without any neurological, psychiatric, or systematic condition affecting the brain, as assessed during a clinical interview performed by a trained psychiatrist, and matched for age, sex, and handedness were recruited as controls.
The study was approved by the local ethics committee and all participants signed an informed consent before entering the study.
Functional Paradigm
In a block design, the task and the rest conditions were switched regularly. The duration of a block was 31.5 s. The task condition was covert free paced visually presented phonological VFT. That is, the subjects were asked to produce silently, using their inner voice as many words beginning with a letter presented on the screen. During the rest condition, subjects were required to watch the screen with a black asterisk presented steadily, remain silent, without repetition of any words.
MR Imaging
All subjects were scanned using 1.5 T Siemens scanner. Functional data were obtained using echo planar imaging (EPI) in the axial plane repetition time (TR) = 4.52 s, echo time (TE) = 40 ms, flip angle (FA) = 90°, 64 × 64 matrix, 32 slices, slice thickness 3.5 mm, in‐plane resolution 3.44 mm), seven scans per block, together 71 scans for the whole fMRI scanning. Moreover, whole head T1 weighted images were obtained using 3D acquisition (TR 1,700 ms, TE 3.93 ms, inversion time (TI) 1,100 ms, flip angle 15°, 160 slices, voxel size 1.17 × 0.48 × 0.48 mm).
Image Preprocessing
The first seven EPI scans (the first task block) were removed to reduce the saturation effect. This resulted in four task and five rest blocks with the first block in the fMRI sequence being the rest condition. All the images were processed using SPM5 software (http://www.fil.ion.ucl.ac.uk/spm/). The images were realigned to correct for slice timing differences and motion artifacts, coregistered to the high‐resolution structural image, and normalized to the Montreal Neurological Institute (MNI) stereotactic space. The normalized images were resliced to 3 × 3 × 3 mm resolution and smoothed with a 8‐mm full‐width half‐maximum (FWHM) Gaussian kernel.
Group ICA
We performed a group spatial ICA using the infomax algorithm implemented in the Group ICA of fMRI (GIFT) toolbox (http://icatb.sourceforge.net). The number of components to be extracted (after three principal component analysis reduction steps) was estimated before running the ICA analysis using a modified minimum description length algorithm (Li et al., 2007). To test the stability of the ICA results, we performed an ICASSO analysis (Himberg et al., 2004). This algorithm runs ICA several times (20 iteration in our analysis) and returns the degree to which the extracted components vary. The ICA algorithm outputs a set of components consisting of their spatial maps and corresponding time courses—a composite set extracted from the data of all subjects, and components for all individual subjects. The spatial maps and time courses were calibrated using z‐scores. The spatial maps belonging to associated time‐course is composed of voxels that code their contribution to the time course—the higher the z‐score, the greater the contribution. To determine the regions that are associated with each component, we performed voxelwise one‐sample t test on the spatial maps, with resulting statistical parametrical maps thresholded at P < 0.05 FWE corrected. Anatomical labels were determined using the Talairach Daemon utility (Lancaster et al., 2000).
For group analysis, we determined several components of interest. First, components that contained artifacts and nonreliable components detected using ICASSO were removed. Then we determined the components that were modulated by the VFT, which we selected for further analysis. To detect components that contained artifacts, signals in white matter or Cerebrospinal fluid (CSF), we computed spatial correlations between individual component maps and maps of prior probability of white matter or CSF as implemented in SPM5. The criteria for artifacts detection were set to r 2 > 0.05 for correlations with CSF priors and r 2 > 0.02 for correlations with white matter priors (Kim et al., 2009). To determine the modulation of time courses of components by VFT, we performed a regression analysis on the ICA time courses with a design matrix describing the fMRI paradigm. The resulting regression parameters (β weights) represent the degree of task modulation of individual components. The significance of this association between networks and conditions of the functional paradigm was determined using a one‐sample t test.
Statistical Analysis
To compare the spatial structure of independent components we performed a voxelwise two‐sample t test on the reconstructed spatial maps of individual subjects using SPM5. Individual voxels in the spatial component maps represent regional functional connectivity strength. The level of significance was set to P < 0.05 Family‐wise errors (FWE) corrected to control for multiple comparison in a voxelwise analysis. For comparison of component time courses, we performed analysis on the β weights from regression analysis, and an analysis of the spectral power of time courses (Calhoun et al., 2009b). The β weights were used for group analysis using the nonparametric Mann‐Whitney U test (for non‐normal distribution of β weights). The level of significance was set to P < 0.05. Frequency distribution of the time courses was evaluated by computing the power spectral density of each subject's time course. The spectral power of each time course was combined into six equally spaced frequency bins. Group differences for each bin were compared using two‐sample t tests, the level of significance was set to P < 0.05.
To analyze the connectivity between independent components—functional network connectivity (Jafri et al., 2008)—we analyzed the similarity of time courses of the signal in individual components. To prevent the confounding effect of physiological noise, we first orthogonalized the components of interest with the components containing noise signal in CSF and white matter. We then computed correlations between the component time courses in every subject. These correlations reflect the temporal dependency of two networks. The group differences in the between network correlations were then tested using a two‐sample t test (level of significance P < 0.05).
Finally, to test the connection between functional connectivity parameters and clinical status of the patients, we computed the Spearman correlations between the temporal correlations between the components, β weights, and PANSS and GAF scales. We performed 60 correlation analyses in total. To correct for multiple comparisons, we performed Bonferroni correction with the level of significance set to P < 0.00083.
RESULTS
The mean positive PANSS subscale was 8.9 (SD 3.3), negative 14.5 (SD 5.7), general 25.6 (SD 7.4), and the total PANSS score was 49.0 (SD 14.7) at the time of 1‐year follow‐up. The mean GAF score at the 1‐year follow‐up was 74.6 (SD 14.9). The mean group performance of schizophrenia patients on the VFT task was at the 41.9th percentile (SD 23.7). The performance of nine subjects (31%) was in the defective range, four patients (13.8%) were subnormal, eight patients (27.5%) were average, and eight patients (27.5%) were above average.
Independent Components
On the basis of the results of the modified minimum description length algorithm, we extracted 16 components; all but one (c16) of the components showed high reliability based on the ICASSO estimation. Another three components (c5, c10, and c11) were excluded, because they met the criteria for artifacts in the correlation analysis of component spatial maps with maps of white matter and cerebrospinal liquid. The regression analysis of component time courses with the design matrix detected the strongest positive task modulation for component 1 (β = 0.43). Component 4 was the most negatively modulated by the task (β = −0.29), followed by component 3 (β = −0.26). Finally, component 9 was the second most positively modulated (β = 0.20). These components were selected for further group analysis.
For a detailed list of anatomic regions contained in the components of interest, see Tables I and II, and Figure 1. Component 1 represents a lateralized (82% voxels in the left hemisphere) network of frontoparietal regions positively linked with VFT task—that is, the activity of these areas increased during VFT. Component 9 was positively modulated by VFT, its time course, however, stretched into the Rest condition. It consisted of a large cluster in the frontal lobe, large clusters in the temporal insular and cingular cortex; this component corresponds to the salience network. Component 4 was the most negatively modulated network; its activity decreased during VFT, and includes clusters in the precuneus, posterior cingulate, medial frontal cortex, together with large clusters in the bilateral temporal cortex (superior and middle temporal gyrus, parahippocampal gyrus). The second deactivated component, component 3, consisted of large clusters in precuneus, inferior and superior parietal cortex, and cuneus. Both deactivated components belong to the default mode network (DMN).
Table I.
Anatomical regions contained in task‐activated components
| Components | Area | Broadman area | R/L volume (cc) |
|---|---|---|---|
| C1—Left frontoparietal network | Middle frontal gyrus | 6, 8, 9, 10, 46 | 0.0/4.9 |
| Inferior frontal gyrus | 9, 44, 45, 46, 47 | 0.0/7.4 | |
| Superior frontal gyrus | 6 | 0.1/0.3 | |
| Medial frontal gyrus | 0.0/0.1 | ||
| Precentral gyrus | 6, 9 | 0.0/0.3 | |
| Superior parietal lobule | 7 | 0.0/0.4 | |
| Inferior parietal lobule | 40 | 0.0/0.2 | |
| Precuneus | 7 | 0.0/0.3 | |
| Superior temporal gyrus | 0.0/0.1 | ||
| C9—Salience network | Inferior frontal gyrus | 45, 47 | 3.6/6.2 |
| Medial frontal gyrus | 6, 9 | 0.3/0.0 | |
| Superior frontal gyrus | 6 | 0.1/0.1 | |
| Superior temporal gyrus | 22, 38 | 1.2/1.3 | |
| Middle temporal gyrus | 21, 22 | 0.0/0.8 | |
| Insula | 13, 47 | 0.5/1.1 | |
| Cingulate gyrus | 32 | 1.0/0.4 | |
| Anterior cingulate | 32 | 0.3/0.0 |
Table II.
Anatomical regions contained in task‐deactivated components
| Components | Area | Broadman area | R/L volume (cc) |
|---|---|---|---|
| C3—DMNa | Precuneus | 7, 19 | 5.6/6.7 |
| Superior parietal lobule | 7 | 3.5/3.6 | |
| Inferior parietal lobule | 7, 39, 40 | 1.4/1.5 | |
| Cuneus | 19 | 0.1/0.4 | |
| C4—DMNb | Posterior cingulate | 23, 29, 30, 31 | 3.3/3.7 |
| Cingulate gyrus | 31 | 1.8/1.5 | |
| Precuneus | 7, 19, 23, 31, 39 | 4.8/5.3 | |
| Angular gyrus | 39 | 0.1/1.2 | |
| Supramarginal gyrus | 0.1/0.6 | ||
| Inferior parietal lobule | 39 | 0.0/0.3 | |
| Cuneus | 7 | 0.3/0.2 | |
| Superior temporal gyrus | 22, 39 | 0.5/1.1 | |
| Medial frontal gyrus | 9, 10 | 2.2/1.5 | |
| Middle temporal gyrus | 19, 39 | 0.5/1.7 | |
| Parahippocampal gyrus | 0.0/0.1 | ||
| Superior frontal gyrus | 9 | 0.1/0.0 | |
| Anterior cingulate | 32 | 0.1/0.1 |
Figure 1.
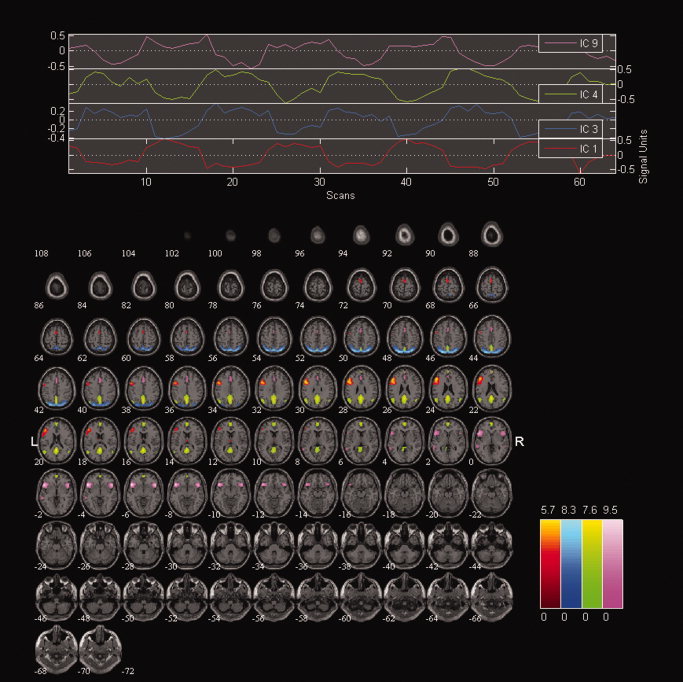
Components of interest. Overlay of spatial maps together with time courses of individual components of interest.
Group Comparison of Functional Connectivity Parameters
There were no group differences in the spatial pattern of the extracted components at the specified level of significance (P < 0.05 FWE corrected). There were also no significant differences at a lower threshold (P < 0.05 false discovery rate (FDR) corrected)—a threshold used in some previous studies (Garrity et al., 2007).
Analysis of component time courses showed several significant results. The Mann‐Whitney U test found significant differences in the regression parameters (β weights) of component time courses for the salience component 9 (Z = −2.94, P = 0.003), the second most positively modulated network, and for all negatively task‐modulated default mode components 3 (Z = −2.41, P = 0.02), 4 (Z = −2.04, P = 0.04). All were decreased in schizophrenia patients. There were no differences in time‐series of the positively task‐modulated component 1. Schizophrenia patients had also significantly lower power in the slowest frequency band (0–0.018Hz) in the left frontal network (component 1), and DMN (components 3 and 4) (P < 0.05), and significantly higher power in 0.037–0.055 Hz band in the left frontal network (component 1) (P < 0.05). No differences in the spectral power were detected for component 9.
Moreover, schizophrenia patients had smaller negative correlations between the left frontal network (component 1) and DMN (components 4) time courses (t = 2.9, P < 0.005), and smaller positive correlations between default mode subcomponents (components 3 and 4) (t = −3.7, P < 0.001)—see Figure 2. For convenience, the findings in schizophrenia group are summarized in Table III.
Figure 2.
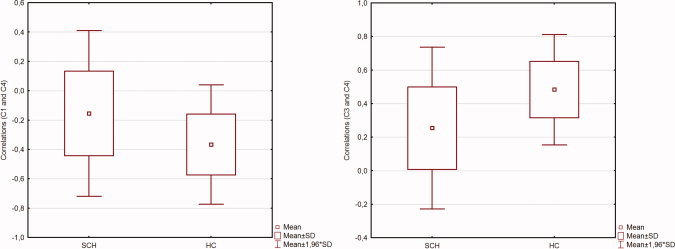
Component time course correlations. Figure shows the results of functional network analysis. Left: group differences in correlations between the left frontoparietal (c1) and default mode network (c4) time courses. Right: group differences in correlations between two subcomponents of the default mode networks (c3, c4) time courses. [Color figure can be viewed in the online issue, which is available at wileyonlinelibrary.com.]
Table III.
Summary of the results
| Spatial extent of components |
| No group differences |
| Network activation: Task modulation of component time courses |
| Smaller positive task‐modulation of the salient network (c9)—smaller activation during VFT processing |
| Smaller negative task‐modulation of DMN network (c3, c4)—smaller deactivation during VFT |
| Spectral analysis of component time courses |
| Lower power in lower frequencies (0–0.018 Hz) in the left frontopariental and default mode networks—first harmonic frequency of fMRI paradigm—correlate of lower activation and deactivation of these networks |
| Higher power in higher frequencies (0.037–0.055 Hz) in the left frontopariental network—higher fluctuations with period of 11 s—higher irregularities in network activation? |
| Functional network connectivity: Between‐network time course correlations |
| Smaller negative correlation between signal time courses in left frontopariental network and default mode network (activated and deactivated networks)—hypoconnectivity between task oriented and default mode regions |
| Smaller positive correlation between default mode subcomponents c3 and c4 (deactivated networks)—hypoconnectivity in DMN |
Relationship Between Functional Connectivity and Clinical Parameters
We found no significant correlations between functional connectivity parameters and the clinical features of the schizophrenia patients after the multiple comparisons correction.
DISCUSSION
We performed several measures of the function of brain networks (including functional network connectivity) in schizophrenia patients in remission 1 year after the first episode. The patients showed lower activation of the networks implicated in VFT processing, consisting of the frontotemporo‐parietal cortex, lower deactivation of the medial frontal cortex, temporal neocortex, parahippocampal gyrus, posterior cingulate, precuneus, and lateral parietal cortex during VFT processing, lower power in slow‐component time course frequencies in the left frontoparietal and DMNs, and higher power in higher frequencies in the left frontoparietal network. Moreover, there was abnormal signal similarity between individual networks—the patients had a lower anticorrelation between VFT activated and deactivated networks, and lower connectivity between deactivated networks.
The pattern of activated regions during VFT in our study is consistent with previous functional imaging studies: activation of the inferior frontal gyrus (BA 45, 46) (Amunts et al., 2004; Costafreda et al., 2006; Gurd et al., 2002), the dorsolateral prefrontal cortex (BA 9, 46) in the middle frontal gyrus (Frith et al., 1991; Fu et al., 2002; Gurd et al., 2002), precentral gyrus (Fu et al., 2002; Pihlajamaki et al., 2000), anterior cingulate (Fu et al., 2002; Gurd et al., 2002), the superior (Pihlajamaki et al., 2000) and inferior (Fu et al., 2002) parietal cortex, and cerebellum (Fu et al., 2002; Gurd et al., 2002) were reported. The results of our study show that the activated regions form two distinct network—the left frontopariental network and more widely distributed salience network. This is consistent with the nature of the VFT that requires involvement of several cognitive functions (van Beilen et al., 2004). Interestingly, patients and healthy controls did not differ in the spatial extent of individual networks. This is consistent with findings of previous studies that employed group spatial ICA (Camchong et al., 2011; Jafri et al., 2008). Schizophrenia patients use the same brain networks as healthy controls, the activity of the networks is, however, different in the patient and healthy subject groups.
The temporal regions both activated and deactivated during VFT processing (temporal regions were included in both activated and deactivated components). This is an interesting pattern of activity that may reflect dynamic changes in activation–deactivation of temporal cortex during selection of appropriate words with concurrent inhibition of irrelevant ones. This may be behind the findings of both temporal deactivation—mainly in PET studies (Dye et al., 1999; Frith et al., 1995; Frith et al., 1991; Spence et al., 2000)—and activation (mainly fMRI studies (Fu et al., 2002; Pihlajamaki et al., 2000)) during VFT processing.
We found decreased activation of the salience network consisting of anterior cingulate, insula, dorsolateral prefrontal cortex, and temporal neocortex in schizophrenia patients in remission. Reduced activation of the left dorsolateral prefrontal cortex, the left inferior frontal gyrus, anterior cingulate, and the insula were already described in schizophrenia patients (Curtis et al., 1998; Fu et al., 2005; Yurgelun‐Todd et al., 1996). Together with decreased activation of the salience network, the patients in our study showed decreased deactivation of the DMN during VFT. Similar findings of increased activation of DMN regions in schizophrenia patients were reported: Curtis et al. found increased activation of the medial parietal cortex, anticorrelated to the activation of frontal regions (Curtis et al., 1998). Changes of the temporal cortex activity were also noted: a small PET study found that in five chronic schizophrenia patients, an abnormal positive correlation between frontal and temporal activity was present, whereas in healthy controls, there was a negative correlation between these two regions (Frith et al., 1995). Increased temporal activation when compared with healthy controls was also found in a small fMRI study (Yurgelun‐Todd et al., 1996). Task‐related network activation and deactivation abnormalities analyzed using ICA in schizophrenia seen in our study have been already noted in previous studies during working memory paradigms (Kim et al., 2009; Meda et al., 2009).
The regions deactivated during VFT correspond to the so‐called DMN (Raichle et al., 2001). The activity of DMN decreases during performance of tasks; this deactivation is negatively correlated with activity in regions engaged in task performance (Greicius et al., 2003; Hampson et al., 2006). The level of deactivation has behavioral significance—the greater the deactivation, the better the cognitive performance (Weissman et al., 2006). This may have direct importance to schizophrenia, where abnormal cognition is a key feature. Moreover, DMN may be involved in self‐reflection, mental imagery, and episodic memory retrieval, which again is relevant to schizophrenia. The finding of inappropriate deactivation of the DMN network has already been found in previous VFT studies (Curtis et al., 1998; Spence et al., 2000), as well as during other cognitive paradigms (Meda et al., 2009; Whitfield‐Gabrieli et al., 2009), or at rest (Zhou et al., 2007). We also found abnormal connectivity between task‐activated and task‐deactivated networks; there is a smaller negative correlation in patients in remission. It has been suggested that this pattern reflects a competitive relationship with behavioral impact and relevance to cognitive, emotional, or perceptive abnormalities in schizophrenia (Pomarol‐Clotet et al., 2008; Whitfield‐Gabrieli et al., 2009).
Schizophrenia patients had lower power in the 0.0–0.018 Hz frequency band in both activated and deactivated networks. This finding is of interest as the first harmonic component of the functional block design (0.0158 Hz) lies in this frequency band. The results of the spectral analysis may, therefore, indicate lower activation and deactivation of particular networks. This interpretation is supported by the results of β‐weights analysis. One report of slower and reduced increase in prefrontal activation in schizophrenia patients compared to healthy controls from a near‐infrared spectroscopy study (Takizawa et al., 2008) may conform to our findings of slow fluctuations changes. Further, the patients had higher power in higher frequencies (0.037–0.055 Hz) in the left frontoparietal network (component 1) time course. This finding indicates that patients had higher fluctuations of time course with the period around 11 s. This may mean a more irregular pattern of activity in a task‐activated network. As it was shown that the variability in behavior linked with brain activation is explained in large portion by fluctuations in the network activity (Fox et al., 2007), we may speculate that the irregular pattern of activity in schizophrenia patients may have consequences for their performance. The results of spectral power differences are consistent with a previous study (Garrity et al., 2007) that found lower power in the slowest frequencies and higher power in higher frequencies in schizophrenia patients.
Finally, we also performed the analysis of functional network connectivity (Jafri et al., 2008). We analyzed the similarity of time courses between individual components using correlation measures. We found that the patients exhibit lower negative correlation between the activated left frontoparietal network and deactivated DMN, and lower positive correlation between DMN subcomponents. This finding of altered similarity of the signal between individual networks has its counterpart in the spectral analysis (see above): the signal of the left frontoparietal network shows more frequent fluctuations in schizophrenia patients. Unfortunately, it is not possible to determine if the group differences in functional network connectivity in our study reflect abnormal baseline “resting” connectivity (similarity of the time course of bold signal fluctuations in individual networks) or abnormal network cooperation during task performance. There might be another explanation for reduced similarity of network signals—for example, patients may pay less attention (see the reduced activation of the salience network), or less effort than healthy subjects that may lead to reduced redistribution of brain activity between individual networks and therefore to different pattern of between‐network signal similarity. However, abnormal functional connectivity of frontal and DMN areas has already been found in resting state studies (Camchong et al., 2011; Jafri et al., 2008; Zhou et al., 2007).
There are no other studies that have analyzed functional connectivity in remission. Studies that focused on similar populations analyzed only selected regions, had limited power to detect changes, and the remission was not rigorously determined (Dye et al., 1999; Spence et al., 2000); they, however, provide some support for abnormal functional connectivity even in clinically stable patients. The clinical significance of the disconnection comes from the fact that the parameters of functional connectivity correlate with the level of clinical symptoms, which has been noted in other patient populations in different phases of the disease (Lawrie et al., 2002; Rotarska‐Jagiela et al., 2010; Whitfield‐Gabrieli et al., 2009; Wolf et al., 2009). Unfortunately, in contrast to our expectations and aforementioned studies, we were not able to find any correlations between the brain function measures and clinical features of the schizophrenia patients. However, this was basically the point we wanted to make—asymptomatic patients in remission still exhibit functional abnormality of the brain. Although there is still a functional brain abnormality present in remission, at present, we cannot conclude that the normalization of functional connectivity should be the target of schizophrenia treatment and a marker of disease stabilization. These findings may reflect other than causative relations. They may reflect adaptive compensatory processes or irrelevant epiphenomena. However, there are some hints that this is not the case and that functional disconnection is a neurobiological correlate of brain dysfunctions and clinical manifestation of schizophrenia. There is evidence that antipsychotic medication may improve the connectivity, to a certain extent (Sambataro et al., 2010; Stephan et al., 2001). Similarly, repetitive transcranial magnetic stimulation (rTMS) treatment led to increase of connectivity, although not in expected networks (Vercammen et al., 2010). In an animal model, there are findings of concurrent emergence of brain disconnection and cognitive dysfunction, with their subsiding after procognitive treatment: subchronic administration of N‐methyl‐D‐aspartate (NMDA) antagonist phencyclidine led to abnormalities of functional connectivity of prefrontal cortex and abnormalities of attention; both abnormalities were reversed by modafinil (Dawson et al. in press). It should be noted, however, that the functional network measures in our study did not correlate with the daily dose of antipsychotics expressed in chlorpromazine equivalents. Therefore, longitudinal studies demonstrating the link between clinical improvement and improvement of functional connectivity are needed. One such study was published recently showing correlated increase of functional connectivity of frontotemporo‐parietal and subcortical regions and reduction of clinical symptoms after short‐term treatment with antipsychotics (Lui et al., 2010).
There are several limitations of our study. No behavioral data were obtained during scanning. This is an implicit limitation of a covert VFT task, found consistently in VFT studies (Costafreda et al., 2006). We think that our study is not biased by this fact: we found a pattern of activated regions consistent with the findings of other studies. Another limitation stemming from the behavioral paradigm is that the rest condition did not contain any language related task. Therefore, the contrast between activation and rest contained low levels of language processing, not only verbal fluency‐related processes. Our goal was not, however, to study the specific neuronal substrate of verbal fluency. Rather, we wanted to engage frontal and temporal regions and to analyze their cooperation in schizophrenia. The letters for word retrieval differ in the Czech language from the ones used in English. However, there is evidence that the choice of letters do not lead to gross changes in the pattern of activated cortical regions; “harder” letters may lead to higher activation of dorsal parts of anterior cingulate (Fu et al., 2002). Another potential limitation might stem from the fMRI methodology where acquisition of functional scans with TR = 4.5 s may not be fast enough to describe brain function in detail, and may lead to decreased statistical power of the study. The images included only superior parts of cerebellum; therefore, our study was not able to analyze the involvement of this structure. Motion artifacts related to heart rate or respiration may influence covariations of brain areas (Birn et al., 2006). Although this may concern rather intrinsic connections in resting‐state studies, we tried to correct for these influences—ICA can separate physiological signals from functional connectivity maps (Kiviniemi et al., 2003; Thomas et al., 2002). Furthermore, we excluded components with unspecific widespread signal in white matter and CSF, and orthogonalized the components of interest to the artificial ones to prevent the confounding effect of artifacts to the functional network analysis. The functional network analysis was performed using correlations between component signal time course. Therefore, it provides no information about the directionality of between networks interaction or dependence of activity between different networks. Other methods, such as dynamic causal modeling should be used to answer these questions (see Friston, 2009).The subjects were not diagnosed using a structured interview; on the other hand, the diagnosis was build using all information available the longitudinal, expert, all data procedure – LEAD method, which is widely used as a “gold standard” in validation of structured interviews in different language environments. The subjects included in our study were only males, which may limit the generalization of our results. However, there are data that show no significant gender differences in brain activation during VFT in healthy volunteers (Weiss et al., 2003). The lack of baseline data from the time of the first episode prevents any conclusions about the dynamics of disconnection in schizophrenia. It is also not clear if it is possible to reverse this functional abnormality completely as a result of antipsychotic treatment. However, as there is still a significant manifestation of brain disease during remission 1 year after the first episode, we suggest considering the continuation of antipsychotic treatment even after 1 year of remission.
CONCLUSIONS
Even in remission 1 year after first‐episode schizophrenia, there is still an abnormal functional connectivity of several brain networks. However, we were not able to find significant relationships between the connectivity measures and clinical parameters. Lack of power or decreased variability of the clinical features in patients in remission may contribute to such finding. The effect of different treatment modalities on brain connectivity, together with temporal dynamics of this functional abnormality should be the objective of further studies to assess the potential application of this parameter as a marker of disease stabilization or treatment target.
REFERENCES
- Amunts K, Weiss PH, Mohlberg H, Pieperhoff P, Eickhoff S, Gurd JM, Marshall JC, Shah NJ, Fink GR, Zilles K ( 2004): Analysis of neural mechanisms underlying verbal fluency in cytoarchitectonically defined stereotaxic space—the roles of Brodmann areas 44 and 45. Neuroimage 22: 42–56. [DOI] [PubMed] [Google Scholar]
- Andreasen NC, Carpenter WT Jr, Kane JM, Lasser RA, Marder SR, Weinberger DR ( 2005): Remission in schizophrenia: Proposed criteria and rationale for consensus. Am J Psychiatry 162: 441–449. [DOI] [PubMed] [Google Scholar]
- Birn RM, Diamond JB, Smith MA, Bandettini PA ( 2006): Separating respiratory‐variation‐related fluctuations from neuronal‐activity‐related fluctuations in fMRI. Neuroimage 31: 1536–1548. [DOI] [PubMed] [Google Scholar]
- Boksman K, Theberge J, Williamson P, Drost DJ, Malla A, Densmore M, Takhar J, Pavlosky W, Menon RS, Neufeld RW ( 2005): A 4.0‐T fMRI study of brain connectivity during word fluency in first‐episode schizophrenia. Schizophr Res 75: 247–263. [DOI] [PubMed] [Google Scholar]
- Calhoun VD, Adali T, Pearlson GD, Pekar JJ ( 2001): A method for making group inferences from functional MRI data using independent component analysis. Hum Brain Mapp 14: 140–151. [DOI] [PMC free article] [PubMed] [Google Scholar]
- Calhoun VD, Adali T, Pekar JJ ( 2004): A method for comparing group fMRI data using independent component analysis: application to visual, motor and visuomotor tasks. Magn Reson Imaging 22: 1181–1191. [DOI] [PubMed] [Google Scholar]
- Calhoun VD, Eichele T, Pearlson G ( 2009a): Functional brain networks in schizophrenia: A review. Front Hum Neurosci 3: 17. [DOI] [PMC free article] [PubMed] [Google Scholar]
- Calhoun VD, Liu J, Adali T ( 2009b): A review of group ICA for fMRI data and ICA for joint inference of imaging, genetic, and ERP data. Neuroimage 45( 1 Suppl): S163–S172. [DOI] [PMC free article] [PubMed] [Google Scholar]
- Camchong J, MacDonald AW III, Bell C, Mueller BA, Lim KO ( 2011): Altered functional and anatomical connectivity in schizophrenia. Schizophr Bull 37: 640–650. [DOI] [PMC free article] [PubMed] [Google Scholar]
- Ceskova E, Prikryl R, Kasparek T, Ondrusova M ( 2005): Psychopathology and treatment responsiveness of patients with first‐episode schizophrenia. Neuropsychiatr Dis Treat 1: 179–185. [DOI] [PMC free article] [PubMed] [Google Scholar]
- Ceskova E, Prikryl R, Kasparek T, Kucerova H ( 2007): One‐year follow‐up of patients with first‐episode schizophrenia (comparison between remitters and non‐remitters): Neuropsychiatr Dis Treat 3: 153–160. [DOI] [PMC free article] [PubMed] [Google Scholar]
- Costafreda SG, Fu CH, Lee L, Everitt B, Brammer MJ, David AS ( 2006): A systematic review and quantitative appraisal of fMRI studies of verbal fluency: Role of the left inferior frontal gyrus. Hum Brain Mapp 27: 799–810. [DOI] [PMC free article] [PubMed] [Google Scholar]
- Curtis VA, Bullmore ET, Brammer MJ, Wright IC, Williams SC, Morris RG, Sharma TS, Murray RM, McGuire PK ( 1998): Attenuated frontal activation during a verbal fluency task in patients with schizophrenia. Am J Psychiatry 155: 1056–1063. [DOI] [PubMed] [Google Scholar]
- Dawson N, Thompson RJ, McVie A, Thomson DM, Morris BJ, Pratt JA (in press): Modafinil reverses phencyclidine‐induced deficits in cognitive flexibility, cerebral metabolism, and functional brain connectivity. Schizophr Bull. [DOI] [PMC free article] [PubMed] [Google Scholar]
- Dye SM, Spence SA, Bench CJ, Hirsch SR, Stefan MD, Sharma T, Grasby PM ( 1999): No evidence for left superior temporal dysfunction in asymptomatic schizophrenia and bipolar disorder. PET study of verbal fluency. Br J Psychiatry 175: 367–374. [DOI] [PubMed] [Google Scholar]
- Elvevag B, Weinstock DM, Akil M, Kleinman JE, Goldberg TE ( 2001): A comparison of verbal fluency tasks in schizophrenic patients and normal controls. Schizophr Res 51: 119–126. [DOI] [PubMed] [Google Scholar]
- Falkai P, Wobrock T, Lieberman J, Glenthoj B, Gattaz WF, Moller HJ ( 2006): World Federation of Societies of Biological Psychiatry (WFSBP) guidelines for biological treatment of schizophrenia, Part 2: Long‐term treatment of schizophrenia. World J Biol Psychiatry 7: 5–40. [DOI] [PubMed] [Google Scholar]
- Fletcher PC, Frith CD, Grasby PM, Friston KJ, Dolan RJ ( 1996): Local and distributed effects of apomorphine on fronto‐temporal function in acute unmedicated schizophrenia. J Neurosci 16: 7055–7062. [DOI] [PMC free article] [PubMed] [Google Scholar]
- Ford JM, Mathalon DH, Whitfield S, Faustman WO, Roth WT ( 2002): Reduced communication between frontal and temporal lobes during talking in schizophrenia. Biol Psychiatry 51: 485–492. [DOI] [PubMed] [Google Scholar]
- Fox MD, Snyder AZ, Vincent JL, Raichle ME ( 2007): Intrinsic fluctuations within cortical systems account for intertrial variability in human behavior. Neuron 56: 171–184. [DOI] [PubMed] [Google Scholar]
- Friston K ( 2009): Causal modelling and brain connectivity in functional magnetic resonance imaging. PLoS Biol 7: e33. [DOI] [PMC free article] [PubMed] [Google Scholar]
- Friston KJ, Frith CD ( 1995): Schizophrenia: A disconnection syndrome? Clin Neurosci 3: 89–97. [PubMed] [Google Scholar]
- Frith CD, Friston KJ, Liddle PF, Frackowiak RS ( 1991): A PET study of word finding. Neuropsychologia 29: 1137–1148. [DOI] [PubMed] [Google Scholar]
- Frith CD, Friston KJ, Herold S, Silbersweig D, Fletcher P, Cahill C, Dolan RJ, Frackowiak RS, Liddle PF ( 1995): Regional brain activity in chronic schizophrenic patients during the performance of a verbal fluency task. Br J Psychiatry 167: 343–349. [DOI] [PubMed] [Google Scholar]
- Fu CH, Morgan K, Suckling J, Williams SC, Andrew C, Vythelingum GN, McGuire PK ( 2002): A functional magnetic resonance imaging study of overt letter verbal fluency using a clustered acquisition sequence: Greater anterior cingulate activation with increased task demand. Neuroimage 17: 871–879. [PubMed] [Google Scholar]
- Fu CH, Suckling J, Williams SC, Andrew CM, Vythelingum GN, McGuire PK ( 2005): Effects of psychotic state and task demand on prefrontal function in schizophrenia: An fMRI study of overt verbal fluency. Am J Psychiatry 162: 485–494. [DOI] [PubMed] [Google Scholar]
- Garrity AG, Pearlson GD, McKiernan K, Lloyd D, Kiehl KA, Calhoun VD ( 2007): Aberrant "default mode" functional connectivity in schizophrenia. Am J Psychiatry 164: 450–457. [DOI] [PubMed] [Google Scholar]
- Greicius MD, Krasnow B, Reiss AL, Menon V ( 2003): Functional connectivity in the resting brain: A network analysis of the default mode hypothesis. Proc Natl Acad Sci USA 100: 253–258. [DOI] [PMC free article] [PubMed] [Google Scholar]
- Gurd JM, Amunts K, Weiss PH, Zafiris O, Zilles K, Marshall JC, Fink GR ( 2002): Posterior parietal cortex is implicated in continuous switching between verbal fluency tasks: An fMRI study with clinical implications. Brain 125( Pt 5): 1024–1038. [DOI] [PubMed] [Google Scholar]
- Hampson M, Driesen NR, Skudlarski P, Gore JC, Constable RT ( 2006): Brain connectivity related to working memory performance. J Neurosci 26: 13338–13343. [DOI] [PMC free article] [PubMed] [Google Scholar]
- Himberg J, Hyvarinen A, Esposito F ( 2004): Validating the independent components of neuroimaging time series via clustering and visualization. Neuroimage 22: 1214–1222. [DOI] [PubMed] [Google Scholar]
- Jafri MJ, Pearlson GD, Stevens M, Calhoun VD ( 2008): A method for functional network connectivity among spatially independent resting‐state components in schizophrenia. Neuroimage 39: 1666–1681. [DOI] [PMC free article] [PubMed] [Google Scholar]
- Kay SR, Fiszbein A, Opler LA ( 1987): The positive and negative syndrome scale (PANSS) for schizophrenia. Schizophr Bull 13: 261–276. [DOI] [PubMed] [Google Scholar]
- Kim DI, Manoach DS, Mathalon DH, Turner JA, Mannell M, Brown GG, Ford JM, Gollub RL, White T, Wible C, Belger A, Bockholt HJ, Clark VP, Lauriello J, O'Leary D, Mueller BA, Lim KO, Andreasen N, Potkin SG, Calhoun VD ( 2009): Dysregulation of working memory and default‐mode networks in schizophrenia using independent component analysis, an fBIRN and MCIC study. Hum Brain Mapp 30: 3795–3811. [DOI] [PMC free article] [PubMed] [Google Scholar]
- Kiviniemi V, Kantola JH, Jauhiainen J, Hyvarinen A, Tervonen O ( 2003): Independent component analysis of nondeterministic fMRI signal sources. Neuroimage 19( 2 Pt 1): 253–260. [DOI] [PubMed] [Google Scholar]
- Kubicki M, McCarley R, Westin CF, Park HJ, Maier S, Kikinis R, Jolesz FA, Shenton ME ( 2007): A review of diffusion tensor imaging studies in schizophrenia. J Psychiatr Res 41: 15–30. [DOI] [PMC free article] [PubMed] [Google Scholar]
- Lancaster JL, Woldorff MG, Parsons LM, Liotti M, Freitas CS, Rainey L, Kochunov PV, Nickerson D, Mikiten SA, Fox PT ( 2000): Automated Talairach atlas labels for functional brain mapping. Hum Brain Mapp 10: 120–131. [DOI] [PMC free article] [PubMed] [Google Scholar]
- Lawrie SM, Buechel C, Whalley HC, Frith CD, Friston KJ, Johnstone EC ( 2002): Reduced frontotemporal functional connectivity in schizophrenia associated with auditory hallucinations. Biol Psychiatry 51: 1008–1011. [DOI] [PubMed] [Google Scholar]
- Leucht S, Barnes TR, Kissling W, Engel RR, Correll C, Kane JM ( 2003): Relapse prevention in schizophrenia with new‐generation antipsychotics: A systematic review and exploratory meta‐analysis of randomized, controlled trials. Am J Psychiatry 160: 1209–1222. [DOI] [PubMed] [Google Scholar]
- Li YO, Adali T, Calhoun VD ( 2007): Estimating the number of independent components for functional magnetic resonance imaging data. Hum Brain Mapp 28: 1251–1266. [DOI] [PMC free article] [PubMed] [Google Scholar]
- Lui S, Li T, Deng W, Jiang LJ, Wu QZ, Tang HH, Yue QA, Huang XQ, Chan RC, Collier DA, Meda SA, Pearlson G, Mechelli A, Sweeney JA, Gong QY ( 2010): Short‐term effects of antipsychotic treatment on cerebral function in drug‐naive first‐episode schizophrenia revealed by "resting state" functional magnetic resonance imaging. Arch Gen Psychiatry 67: 783–792. [DOI] [PubMed] [Google Scholar]
- Meda SA, Stevens MC, Folley BS, Calhoun VD, Pearlson GD ( 2009): Evidence for anomalous network connectivity during working memory encoding in schizophrenia: An ICA based analysis. PLoS ONE 4: e7911. [DOI] [PMC free article] [PubMed] [Google Scholar]
- Meyer‐Lindenberg AS, Olsen RK, Kohn PD, Brown T, Egan MF, Weinberger DR, Berman KF ( 2005): Regionally specific disturbance of dorsolateral prefrontal‐hippocampal functional connectivity in schizophrenia. Arch Gen Psychiatry 62: 379–386. [DOI] [PubMed] [Google Scholar]
- Pihlajamaki M, Tanila H, Hanninen T, Kononen M, Laakso M, Partanen K, Soininen H, Aronen HJ ( 2000): Verbal fluency activates the left medial temporal lobe: A functional magnetic resonance imaging study. Ann Neurol 47: 470–476. [PubMed] [Google Scholar]
- Pomarol‐Clotet E, Salvador R, Sarro S, Gomar J, Vila F, Martinez A, Guerrero A, Ortiz‐Gil J, Sans‐Sansa B, Capdevila A, Cebamanos JM, McKenna PJ ( 2008): Failure to deactivate in the prefrontal cortex in schizophrenia: Dysfunction of the default mode network? Psychol Med 38: 1185–1193. [DOI] [PubMed] [Google Scholar]
- Ragland JD, Gur RC, Valdez J, Turetsky BI, Elliott M, Kohler C, Siegel S, Kanes S, Gur RE ( 2004): Event‐related fMRI of frontotemporal activity during word encoding and recognition in schizophrenia. Am J Psychiatry 161: 1004–1015. [DOI] [PMC free article] [PubMed] [Google Scholar]
- Raichle ME, MacLeod AM, Snyder AZ, Powers WJ, Gusnard DA, Shulman GL ( 2001): A default mode of brain function. Proc Natl Acad Sci USA 98: 676–682. [DOI] [PMC free article] [PubMed] [Google Scholar]
- Rossell SL ( 2006): Category fluency performance in patients with schizophrenia and bipolar disorder: The influence of affective categories. Schizophr Res 82: 135–138. [DOI] [PubMed] [Google Scholar]
- Rotarska‐Jagiela A, van de Ven V, Oertel‐Knochel V, Uhlhaas PJ, Vogeley K, Linden DE ( 2010): Resting‐state functional network correlates of psychotic symptoms in schizophrenia. Schizophr Res 117: 21–30. [DOI] [PubMed] [Google Scholar]
- Sambataro F, Blasi G, Fazio L, Caforio G, Taurisano P, Romano R, Di Giorgio A, Gelao B, Lo Bianco L, Papazacharias A, Popolizio T, Nardini M, Bertolino A ( 2010): Treatment with olanzapine is associated with modulation of the default mode network in patients with Schizophrenia. Neuropsychopharmacology 35: 904–912. [DOI] [PMC free article] [PubMed] [Google Scholar]
- Spence SA, Liddle PF, Stefan MD, Hellewell JS, Sharma T, Friston KJ, Hirsch SR, Frith CD, Murray RM, Deakin JF, Grasby PM ( 2000): Functional anatomy of verbal fluency in people with schizophrenia and those at genetic risk. Focal dysfunction and distributed disconnectivity reappraised. Br J Psychiatry 176: 52–60. [DOI] [PubMed] [Google Scholar]
- Stephan KE, Magnotta VA, White T, Arndt S, Flaum M, O'Leary DS, Andreasen NC ( 2001): Effects of olanzapine on cerebellar functional connectivity in schizophrenia measured by fMRI during a simple motor task. Psychol Med 31: 1065–1078. [DOI] [PubMed] [Google Scholar]
- Takizawa R, Kasai K, Kawakubo Y, Marumo K, Kawasaki S, Yamasue H, Fukuda M ( 2008): Reduced frontopolar activation during verbal fluency task in schizophrenia: A multi‐channel near‐infrared spectroscopy study. Schizophr Res 99: 250–262. [DOI] [PubMed] [Google Scholar]
- Thomas CG, Harshman RA, Menon RS ( 2002): Noise reduction in BOLD‐based fMRI using component analysis. Neuroimage 17: 1521–1537. [DOI] [PubMed] [Google Scholar]
- van Beilen M, Pijnenborg M, van Zomeren EH, van den Bosch RJ, Withaar FK, Bouma A ( 2004): What is measured by verbal fluency tests in schizophrenia? Schizophr Res 69: 267–276. [DOI] [PubMed] [Google Scholar]
- Vercammen A, Knegtering H, Liemburg EJ, den Boer JA, Aleman A ( 2010): Functional connectivity of the temporo‐parietal region in schizophrenia: Effects of rTMS treatment of auditory hallucinations. J Psychiatr Res 44: 725–731. [DOI] [PubMed] [Google Scholar]
- Watt DC, Katz K, Shepherd M ( 1983): The natural history of schizophrenia: A 5‐year prospective follow‐up of a representative sample of schizophrenics by means of a standardized clinical and social assessment. Psychol Med 13: 663–670. [DOI] [PubMed] [Google Scholar]
- Weiss EM, Siedentopf C, Hofer A, Deisenhammer EA, Hoptman MJ, Kremser C, Golaszewski S, Felber S, Fleischhacker WW, Delazer M ( 2003): Brain activation pattern during a verbal fluency test in healthy male and female volunteers: A functional magnetic resonance imaging study. Neurosci Lett 352: 191–194. [DOI] [PubMed] [Google Scholar]
- Weiss EM, Hofer A, Golaszewski S, Siedentopf C, Brinkhoff C, Kremser C, Felber S, Fleischhacker WW ( 2004): Brain activation patterns during a verbal fluency test‐a functional MRI study in healthy volunteers and patients with schizophrenia. Schizophr Res 70: 287–291. [DOI] [PubMed] [Google Scholar]
- Weissman DH, Roberts KC, Visscher KM, Woldorff MG ( 2006): The neural bases of momentary lapses in attention. Nat Neurosci 9: 971–978. [DOI] [PubMed] [Google Scholar]
- Whitfield‐Gabrieli S, Thermenos HW, Milanovic S, Tsuang MT, Faraone SV, McCarley RW, Shenton ME, Green AI, Nieto‐Castanon A, LaViolette P, Wojcik J, Gabrieli JD, Seidman LJ ( 2009): Hyperactivity and hyperconnectivity of the default network in schizophrenia and in first‐degree relatives of persons with schizophrenia. Proc Natl Acad Sci USA 106: 1279–1284. [DOI] [PMC free article] [PubMed] [Google Scholar]
- Wolf RC, Vasic N, Sambataro F, Hose A, Frasch K, Schmid M, Walter H ( 2009): Temporally anticorrelated brain networks during working memory performance reveal aberrant prefrontal and hippocampal connectivity in patients with schizophrenia. Prog Neuropsychopharmacol Biol Psychiatry 33: 1464–1473. [DOI] [PubMed] [Google Scholar]
- Yurgelun‐Todd DA, Waternaux CM, Cohen BM, Gruber SA, English CD, Renshaw PF ( 1996): Functional magnetic resonance imaging of schizophrenic patients and comparison subjects during word production. Am J Psychiatry 153: 200–205. [DOI] [PubMed] [Google Scholar]
- Zhou Y, Liang M, Tian L, Wang K, Hao Y, Liu H, Liu Z, Jiang T ( 2007): Functional disintegration in paranoid schizophrenia using resting‐state fMRI. Schizophr Res 97: 194–205. [DOI] [PubMed] [Google Scholar]