

Abstract
Although the involvement of the anterior cingulate cortex (ACC) in emotional response inhibition is well established, there are several outstanding issues about the nature of this involvement that are not well understood. The present study aimed to examine the precise contribution of the ACC to emotion‐modulated response inhibition by capitalizing on fine temporal resolution of the event‐related potentials (ERPs) and the recent advances in source localization. To this end, participants (N = 30) performed an indirect affective Go/Nogo task (i.e., unrelated to the emotional content of stimulation) that required the inhibition of a motor response to three types of visual stimuli: arousing negative (A−), neutral (N), and arousing positive (A+). Behavioral data revealed that participants made more commission errors to A+ than to N and A−. Electrophysiological data showed that a specific region of the ACC at the intersection of its dorsal and rostral subdivisions was significantly involved in the interaction between emotional processing and motor inhibition. Specifically, activity reflecting this interaction was observed in the P3 (but not in the N2) time range, and was greater during the inhibition of responses to A+ than to N and A−. Additionally, regression analyses showed that inhibition‐related activity within this ACC region was associated with the emotional content of the stimuli (its activity increased as stimulus valence was more positive), and also with behavioral performance (both with reaction times and commission errors). The present results provide additional data for understanding how, when, and where emotion interacts with response inhibition within the ACC. Hum Brain Mapp 33:2147–2160, 2012. © 2011 Wiley Periodicals, Inc.
Keywords: ACC, emotion, ERPs, response inhibition, sLORETA
INTRODUCTION
Electrophysiological and hemodynamic studies have consistently reported anterior cingulate cortex (ACC) activity during emotional response inhibition. However, the specific contribution of the ACC to emotion‐modulated response inhibition is far from clear. On the one hand, it remains to be established whether inhibition‐related ACC activation interacts with valence (varying from negative to positive) or arousal (varying from calming to arousing), two affective dimensions widely considered to explain the principal variance of the emotional meaning [Lang et al.,1993; Osgood et al.,1957; Smith and Ellsworth,1985]. Whereas some data suggest that ACC increases its activity when participants suppress responses to arousing stimuli [both positive and negative: Elliott et al.,2000; Goldstein et al.,2007; Shafritz et al.,2006], others have reported that ACC is primarily modulated by emotional valence [Albert et al.,2010; Goldstein et al.,2007; Schulz et al.,2009; Shafritz et al.,2006]. In the latter case, it is also unclear whether negative stimuli elicit greater inhibition‐related ACC activation than positive ones [Goldstein et al.,2007; Shafritz et al.,2006] or vice versa [Albert et al.,2010]. Taking both affective dimensions into account is, therefore, necessary to examine whether inhibition‐related ACC activity interacts with emotional valence or with emotional arousal.
On the other hand, it is not yet clear whether the ACC is involved in the interaction between emotional processing and the inhibitory process itself. Withholding a prepotent response is characterized by involving rapid (short latency) and brief (short duration) processes, some of the most important occurring within the first second after stimulus onset [e.g., Bokura et al.,2001; Eimer,1993; Kiefer et al.,1998]. The ACC participates in most of them, including attentional control, conflict monitoring, inhibition itself, and outcome evaluation [Braver et al.,2001; Carter et al.,1998; Garavan et al.,2002; Liddle et al.,2001; MacDonald et al.,2000; Menon et al.,2001; Nakata et al.,2005; van Veen and Carter,2002a,b]. Thus, inhibition‐related ACC activity is difficult to disentangle from, and may be confounded with, ACC activity associated with other related processes. In this sense, it is important to note that previous studies on emotion‐modulated response inhibition have been conducted almost exclusively using hemodynamic procedures, which are particularly useful for visualizing where neural activity occurs rather than for determining when activity occurs [Gratton and Fabiani,2001]. A temporally agile signal capable of detecting and distinguishing rapid and brief neural changes may be useful to untangle inhibition from other related processes within the ACC, thereby complementing the information offered by hemodynamic measures of brain activity. Because of their high temporal resolution and their capability for providing information on the origin of the recorded activity through source‐localization techniques, event‐related potentials (ERPs) are particularly well suited to the study of the timing and location within the ACC of neural activity associated with emotional response inhibition. Moreover, extending ACC‐related fMRI sources to ERPs is a reliable strategy since this paleocortical structure has open‐field architecture [Lorente de No, 1947], and therefore its activity is well reflected in the electroencephalogram.
Two fronto‐central ERP components have been consistently linked with response inhibition: N2 (200–400 ms) and P3 (300–600 ms) [Bokura et al.,2001; Eimer,1993; Kiefer et al.,1998; Pfefferbaum et al.,1985]. Both components have been associated with larger amplitudes in Nogo (response inhibition) than in Go (response execution) trials in different inhibitory tasks, the Go/Nogo paradigm being the most prominent. However, each component is considered to reflect different sub‐processes of response inhibition. In fact, data currently available indicate that the N2 predominantly represents conflict arising from competition between the execution and the inhibition of a response [Donkers and van Boxtel,2004; Enriquez‐Geppert et al.,2010; Huster et al.,2010; Nieuwenhuis et al.,2003; van Veen and Carter,2002a,b; Yeung et al.,2004], whereas the P3 primarily reflects motor inhibition [Bruin et al.,2001; Enriquez‐Geppert et al.,2010; Smith et al.,2007,2008]. Interestingly, source‐localization analyses have consistently identified the ACC as one of the most likely generators of both N2 and P3 [Beste et al.,2008; Fallgatter et al.,2002; Huster et al.,2010].
To our knowledge, only two studies have previously explored emotional response inhibition combining ERPs and source‐localization algorithms. On the one hand, Chiu et al. [2008] found no interaction between emotion and response inhibition, at either the behavioral or the neural level. This absence of interaction could be due to the use of affective words, which are probably less capable of eliciting emotion‐related responses than other types of affective stimuli [Hinojosa et al.,2009; Keil,2006; Kissler et al.,2006]. Moreover, source‐localization analyses carried out by Chiu et al. [2008] focused exclusively on N2, thus leaving unexplored other components associated with response inhibition (e.g., P3). On the other hand, Albert et al. [2010] recently examined the influence of long‐lasting affective context (negative, neutral, and positive) on response inhibition. They found that motor response suppression to neutral stimuli was modulated by the emotional context in which it occurs. This interaction was observed in both P3 amplitudes and ACC activation.
The goal of the present study was to clarify the role of the ACC in emotional response inhibition. Three issues concerning the experimental design were particularly important for this purpose. First, an implicit or indirect emotional Go/Nogo task (i.e., unrelated to the emotional content of stimulation) was employed, as recently recommended [Berkman et al.,2009; Goldstein et al.,2007]. The aim of this indirect task was two‐fold: (1) to avoid making it easy for participants to consider that some of the sitmuli were more important than others (e.g., emotional stimuli more important than neutral), to prevent the “relevance‐for‐task‐effect” described in previous studies [Duncan‐Johnson and Donchin,1977] and (2) to avoid motor inhibition being explicity associated with emotional content of stimulation and thus confounded with affect, in order to facilitate the disentangling of inhibition from emotion‐related effects on ACC activity. Second, positive stimuli symmetrical in valence and similar in arousal to negative stimuli were employed to facilitate the discrimination of valence from arousal effects. Moreover, paricipants' subjective ratings of valence and arousal of the presented stimuli were taken immediately after the recording session and then correlated with inhibition‐related ACC activity. Third, emotional stimuli other than faces and words were employed to boost affect‐related processes during the Go/Nogo task, since pictorial stimuli seem to be more powerful than verbal or facial material for inducing changes in the subjective state of emotional valence and arousal [Britton et al.,2006; Hinojosa et al.,2009; Keil,2006].
Additionally, a two‐step approach analysis was designed to improve the reliability of inverse problem solutions (i.e., computing 3D, functional images of electric neuronal activity from the scalp EEG data). First, temporal principal component analysis (tPCA) was employed to detect and quantify, in a reliable manner, those ERP components associated with response inhibition (i.e., N2 and P3). In the second step, standardized low‐resolution brain electromagnetic tomography [sLORETA: Pascual‐Marqui,2002] was applied to both N2 and P3—as defined by tPCA—in 16 regions of interest (ROIs) within the ACC and the functionally related areas of the medial wall. All these regions have been shown to be activated in emotional Go/Nogo paradigms [Albert et al.,2010; Berkman et al.,2009; Elliott et al.,2000; Goldstein et al.,2007; Hare et al.,2005; Schulz et al.,2009; Shafritz et al.,2006] and are distributed throughout the ACC, including ventral (comprising pregenual and subgenual portions of the ACC: areas 24a, 24b, 24c, 25, 32, and 33) and dorsal (comprising areas 24a′, 24b′, 24c′, 24d, 32′, and 33) subdivisions [for more detail on functional anatomy and connectivity of the ACC, see Bush et al.,2000; Etkin et al.,2011; Marguiles et al.,2007].
METHODS
Participants
Thirty right‐handed students (17 women) from the Universidad Autónoma de Madrid, with an age range of 20–32 years (Mean = 22.47; SD = 3.06), took part in this experiment. They reported normal or corrected‐to‐normal visual acuity. All participants provided informed consent for their participation. The experiment was approved by the Research Ethics Committee of the Universidad Autónoma de Madrid.
Stimuli and Procedure
Thirty different visual stimuli were presented to participants. Angle of vision for all stimuli was 75.17° (width) × 55.92° (height). These 30 pictures were of three types (n = 10 in each case): arousing negative (A−), Neutral (N), and arousing positive (A+). They were selected on the basis of their scores in arousal and valence from the International Affective Picture System [IAPS; Lang et al.,2005]. In addition, each participant filled out a bidimensional scaling test of each picture after the recording sessions, assessing its valence and arousal level. Statistical analyses were carried out on these assessments to confirm, first, that the pictures' affective valence was as assumed a priori, and second, that positive and negative pictures were balanced with respect to their arousal levels. A one‐way repeated‐measures ANOVA was computed for valence and arousal dimensions, using Emotion (three levels: A−, N, and A+) as a factor. The ANOVA yielded significant differences in both valence and arousal [F (2, 58) = 411.141, GG corrected P < 0.001 and F (2, 58) = 40.231, GG corrected P < 0.001, respectively]. Post‐hoc contrast (adjusted alpha = 0.05) indicated that A+ and A− showed different valence but not different arousal levels, and that they differed from N in both affective dimensions. Table I shows the means and standard deviations on both dimensions for each type of emotional picture.
Table I.
Means and standard deviation (in parentheses) of valence (1, negative, to 5, positive) and arousal (1, calming, to 5, arousing) assessments given by the 30 participants to the three types of emotional stimuli
| A−* | N** | A+*** | |
|---|---|---|---|
| Valence | 1.79 (0.34) | 3.07 (0.27) | 4.2 (0.42) |
| Activation | 4.02 (0.43) | 3.02 (0.29) | 3.83 (0.6) |
A−, arousing negative; N, neutral; A+, aurosing positive.
Asterisks denote the IAPS code of the pictures used, as follows:
1930, 2399, 2455, 2722, 2810, 6010, 6241, 9331, 9470, 9495.
**2190, 2493, 2575, 2880, 5510, 5900, 7036, 7095, 7224, 7491.
***1710, 2352, 4660, 5623, 7330, 7350, 8031, 8080, 8350, 8490
All pictures had a green, red, or blue frame. The color of the frame cued the participant to either press a button (e.g., red and blue: Go cues) or withhold the response (e.g., green: Nogo cues). The color of the frame indicating Nogo cues was counterbalanced across participants. The aim of this indirect task, already mentioned above, was two‐fold: (i) to avoid making it easy for participants to consider that some of the stimuli were more important than others (e.g., emotional stimuli more important than neutral), to prevent the relevance‐for‐task effect and (ii) to avoid motor inhibition being explicitly associated with emotional characteristics of the stimuli and thus confounded with affect. Three colored frames were included in the task to control for the novelty of the Nogo cues (each frame was presented in 33.33% of the trials), since possible electrophysiological differences between Go and Nogo trials may be due to novelty rather than inhibition when a single and more frequent Go cue is employed [Friedman et al.,2001; Opitz et al.,1999]. Likewise, a higher percentage of Go cues (two colored frames: 66.67%) was employed to increase the tendency to respond.
The ninety stimuli [30 pictures (10A−, 10N, 10A+) × 3 frames (red, blue, green)] were presented four times, so that the total number of presentations was 360. These 360 stimuli were presented in eight blocks of 45 trials (30 Go and 15 Nogo). Go/Nogo and A−/N/A+ conditions were presented in random order. Each trial consisted of the presentation of a framed picture for 300 ms, followed by a 1200‐ms black interval with a white central fixation‐cross, so that the SOA was 1500 ms (Fig. 1). An animation reproducing several trials of the emotional Go/Nogo task as well as their temporal characteristics can be seen at http://www.uam.es/carretie/grupo/EmoGoNogo.htm.
Figure 1.
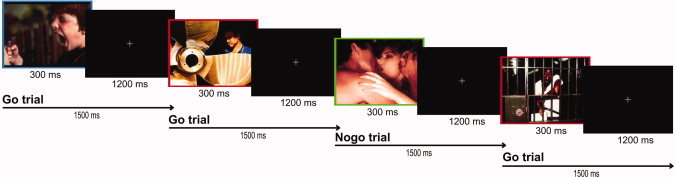
Schematic illustration of the emotional Go/NoGo task. An animation reproducing several trials of the affective Go/Nogo task as well as their temporal characteristics can be seen at http://www.uam.es/carretie/grupo/EmoGoNogo.htm. [Color figure can be viewed in the online issue, which is available at wileyonlinelibrary.com.]
Participants were placed in an electrically shielded, sound‐attenuated room. They were instructed to press a button with the thumb of their right hand, as rapidly and accurately as possible, whenever a picture with Go color frames (e.g., red and blue) was presented, and to withhold pressing when the picture's frame was Nogo colored (e.g., green). Before the begining of the experiment, participants completed a practice block of 12 trials (8 Go and 4 Nogo) to ensure they understood the task instructions. They were instructed to look continuously at the center of the screen and to refrain from blinking during block runs, to control eye‐movement interference. Between each experimental block (1 min), participants were allowed to rest. The experimental task was programmed using Inquisit Millisecond software [Millisecond Software,2006] and presented using an RGB projector on a backprojection screen.
Recording
Electroencephalographic (EEG) activity was recorded using an electrode cap (ElectroCap International) with tin electrodes. Thirty electrodes were placed at the scalp following a homogeneous distribution. All scalp electrodes were referenced to the nosetip. Electrooculographic (EOG) data were recorded supra‐ and infra‐orbitally (vertical EOG), as well as from the left versus right orbital rim (horizontal EOG). A bandpass filter of 0.3–40 Hz was applied. Recordings were continuously digitized at a sampling rate of 210 Hz throughout the recording session. The continuous recording was divided into 1000‐ms epochs for each trial, beginning 200 ms before stimulus onset. Trials for which participants responded outside the SOA (1500 ms) or erroneously were eliminated. Moreover, epochs containing eye movements or blinks over 100 μV in amplitude were deleted. For the rest of the epochs, the EOG‐artefact removal procedure described by Gratton et al. [1983] was applied whenever EOG activity was observed. The ERP averages were categorized according to the following conditions: GoA−, GoN, GoA+, NogoA−, NogoN, and NogoA+. The artefact and error rejection led to the average acceptance of 64.53 GoA− trials (standard deviation: 8.99), 62.63 GoN trials (8.024), 63.47 GoA+ trials (8.71), 30.87 NogoA− trials (3.66), 29.43 NogoN trials (3.54), and 28.23 NogoA+ trials (3.99). A minimum criterion of 20 trials per condition per subject was set to ensure an optimal signal‐to‐noise ratio of the ERP averages [Herrmann et al.,2008; Taylor et al.,2007]. Behavioral performance was recorded by means of a two‐button keypad whose electrical output was continuously digitized at a sampling rate of 840 Hz.
Data Analysis
All statistical analyses described below were performed using the SPSS software package (Version 15.0; SPSS, Chicago). In all statistical contrasts involving analyses of variance (ANOVAs), the Greenhouse–Geisser (GG) epsilon correction was applied to adjust the degrees of freedom of the F ratios, and post hoc comparisons to determine the significance of pairwise contrasts were made using the Bonferroni procedure (α < 0.05).
Behavioral Analysis
Omission and commission error rates (i.e., no responses in Go trials and button presses in Nogo trials, respectively, divided by the number of trials; these measures range from 0 to 1) and reaction times (RTs) to Go cues were analyzed. In the case of RTs, outliers, defined as responses above 1500 ms or below 150 ms, were omitted in the analyses. Repeated‐measures ANOVAs on error rates were carried out with respect to Trial type (two levels: Go and Nogo) and Emotion (three levels: A−, N, and A+). With regard to RTs, a univariate repeated‐measures ANOVA was performed using Emotion (three levels: A−, N, and A+) as a factor.
ERP Analysis
Detection and quantification of ERP components at the scalp level
With the aim of testing whether N2 and P3 components were present in the ERPs, components explaining most of the ERP variance in the temporal domain were detected and quantified through covariance‐matrix‐based temporal principal component analysis (tPCA). This strategy has been widely recommended for detection and quantification of ERP components [Chapman and McCrary,1995; Coles et al.,1986; Dien et al.,2005; Donchin and Heffley,1978]. The main advantage of tPCA is that it presents each ERP component separately and with its “clean” shape, extracting and quantifying it free of the influences of adjacent or subjacent components. Indeed, the waveform recorded at a site on the head over a period of several hundreds of milliseconds represents a complex superposition of different overlapping electrical potentials. Such recordings can stymie visual inspection. In brief, tPCA computes the covariance between all ERP time points, which tends to be high between those time points involved in the same component, and low between those belonging to different components. The solution is therefore a set of independent temporal factors made up of highly covarying time points, which ideally correspond to ERP components. Temporal factor score, the tPCA‐derived parameter in which extracted temporal factors can be quantified, is linearly related to amplitude. In this study, the decision on the number of factors to select was based on the screen test [Cliff,1987]. Extracted factors were submitted to promax rotation, as recently recommended [Dien,2010; Dien et al.,2007]. As explained in detail later, the presence of N2 and P3 were confirmed.
Analysis of the experimental effects on ERP components at the source level
To examine the role of the ACC in emotional response inhibition, sLORETA [Pascual‐Marqui,2002] was applied to both N2 and P3 temporal factor scores. sLORETA is a three‐dimensional discrete linear solution for the EEG inverse problem. Although solutions provided by EEG‐based source‐location algorithms should be interpreted with caution due to their potential error margins, LORETA solutions have shown significant correspondence with those provided by hemodynamic procedures in the same paradigms when at least 25 scalp electrodes are employed [Dierks et al.,2000; Mulert et al.,2004; Pizzagalli et al.,2003; Vitacco et al.,2002]. Moreover, the use of tPCA‐derived factor scores instead of direct voltages [which leads to more accurate source‐localization analyses: Carretié et al.,2004; Dien et al.,2003] and the relatively large sample size employed in the present study (N = 30) contribute to reducing this error margin. The sLORETA solution space is restricted to the cortical gray matter and the hippocampus in the digitized MNI atlas with a total of 6239 voxels at a spatial resolution of 5 mm. However, in the current study, we only considered sLORETA solutions in defined regions of interest (ROIs) within the ACC and the functionally related areas of the medial wall. This ROI approach was employed to increase sensitivity within ACC regions.
Coordinates for the ROIs were taken from previous studies on emotion‐modulated response inhibition (see Fig. 2). Given that the ACC is a large and heterogeneous part of the cerebral cortex that can be divided into several distinct regions based on cytoarchitecture, function, and connectivity [e.g., Beckmann et al.,2009; Bush et al.,2000; Marguiles et al.,2007; McCromick et al., 2006], this ROI selection procedure based on prior studies allowed us to select those regions especially involved in response inhibition, emotional processing, and the interaction of the two processes. Spherical ROIs (radius = 9 mm) were then created using these activation coordinates as the center. This ROI size was chosen taking into account that the ROIs must be large enough to cover the locations of activated regions in the ACC reported by previous fMRI studies of emotional response inhibition, and also small enough to guarantee fine spatial resolution (i.e., to discriminate between different regions of the ACC). ROIs with similar sizes have been employed by previous studies using literature‐based ROI analyses [e.g., Bishop et al.,2004; Kiehl et al.,2005; Thomason et al.,2008]. Finally, three‐dimensional current–density estimates for the N2 and P3 temporal factor scores within each ROI were computed for each participant and each condition.
Figure 2.
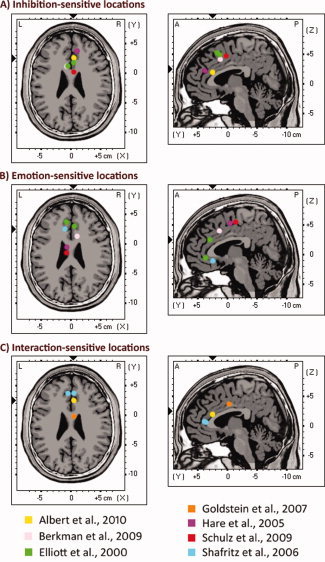
Depiction of location of MNI coordinates used to define the regions of interest (ROIs) within the ACC and the functionally related areas of the medial wall. For presentation purposes, coordinates were collapsed on a representative brain slice at Z = 25 (axial view) and Y = 4 (sagittal view). Exact coordinates are given in Table III. These coordinates represent the center of the ROIs (radius = 9 mm). All these locations have been shown to be activated in previous studies on emotional response inhibition. A: ACC locations previously associated with response inhibition. B: ACC locations previously associated with emotional processing. C: ACC locations previously associated with the interaction of emotional processing and response inhibition. An interactive animation reproducing the location of each MNI coordinate employed to define the ROIs (projected one by one on sagittal, axial, and coronal slices of the Colin brain) can be seen at http://www.uam.es/carretie/grupo/cooACC.htm. [Color figure can be viewed in the online issue, which is available at wileyonlinelibrary.com.]
Specifically, three different analyses were carried out to assess the specific contribution of the ACC to response inhibition, to emotional processing, and to the interaction of the two processes. First, ROIs previously associated with response inhibition irrespective of the emotional content of stimulation were identified. Repeated‐measures ANOVAs on mean N2 and P3 current densities within these ROIs were then carried out with respect to Trial type (two levels: Go and Nogo), to confirm that these regions were associated with response inhibition (i.e., whether they showed greater activation in Nogo than in Go trials). Second, ROIs previously associated with emotional processing but not with motor response suppression were identified. Subsequently, repeated‐measures ANOVAs on mean N2 and P3 current densities within these ROIs were carried out with respect to Emotion (three levels: A−, N, and A+), to confirm whether these regions were associated with emotional processing (i.e., whether they were sensitive to emotional content of the stimuli). Finally, ROIs sensitive to the interaction of emotion and response inhibition were identified. Repeated‐measures ANOVAs on mean N2 and P3 current densities within these ROIs were then carried out with respect to Trial type (two levels: Go and Nogo) and Emotion (three levels: A−, N, and A+), to examine the modulatory influence of emotion on response inhibition in each of these regions. All coordinates reported here represent MNI space. Studies that originally listed coordinates in Talairach space were transformed into MNI space using Matthew Brett's tal2mni script, implemented in Matlab (http://www.mrccbu.cam.ac.uk/Imaging/mnispace.html) [Brett et al.,2001].
RESULTS
Behavioral Data
Table II shows mean RTs and omission, and commission error rates in the emotional Go/Nogo task. On the one hand, a one‐way repeated measures ANOVA was performed on the RTs using Emotion as a factor. ANOVA results showed that mean RTs to GoA−, GoN, and GoA+ did not differ [F (2, 58) = 0.819, P > 0.05]. On the other hand, two‐way repeated‐measures ANOVAs on error rates with respect to Trial type and Emotion factors were carried out, as previously described. There was a main effect of both Trial type [F (1, 29) = 99.833, P < 0.001], revealing higher error rates for Nogo (i.e., commission errors) than for Go (omission errors) trials, and Emotion [F (2, 58) = 13.03, P < 0.001], post‐hoc tests showing greater error rates for A+ than for A− and N. The interaction of the two factors was also significant [F (2, 58) = 11.857, P < 0.001]: whereas error rates differed as a function of the emotional content of the stimuli in Nogo trials, no differences were observed in Go trials. Specifically, post‐hoc tests showed that commission error rates were greater for A+ than for A− and N. Additional analyses to assess the behavioral effect of the color frame of the pictures itself (which was not significant) are described in the Supporting Information available online.
Table II.
Means and standard deviations (in parentheses) of reaction times to Go stimuli and omission/commission error rates in each type of emotional condition
| A− | N | A+ | |
|---|---|---|---|
| Go RTs (ms) | 416.35 (71.87) | 413.67 (74.38) | 417.78 (73.34) |
| Omission error rates | 0.005 (0.01) | 0.0058 (0.01) | 0.0046 (0.01) |
| Commission error rates | 0.1025 (0.08) | 0.1358 (0.07) | 0.1883 (0.12) |
A−, arousing negative; N, neutral; A+, arousing positive.
ERP Data
Detection and quantification of N2 and P3 at the scalp level
Figure 3 shows a selection of grand averages once the baseline value (prestimulus recording) had been subtracted from each ERP. These grand averages correspond to the fronto‐central scalp area, where the critical ERP components (i.e., N2 and P3) were most prominent. As a consequence of the application of the tPCA, five temporal factors were extracted from the ERPs (Fig. 4). Factor peak latency and topography characteristics associate Factor 5 (peaking at 285.71 ms) with the wave labeled N2 in grand averages and Factor 3 (peaking at 519.05 ms) with that labeled P3. These labels will be employed hereafter to make the results easier to understand.
Figure 3.
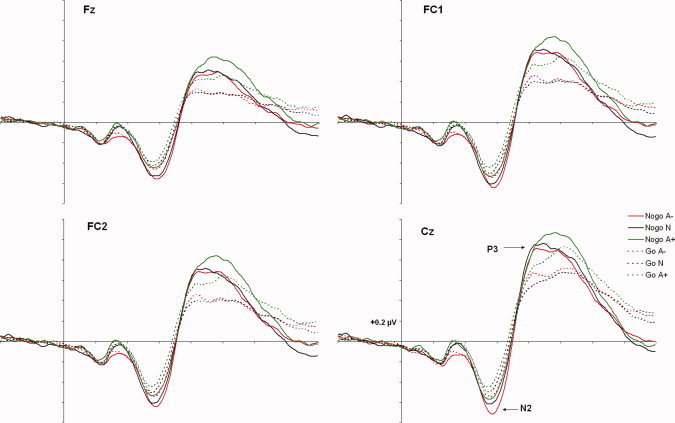
Grand averages at fronto‐central areas, where N2 and P3 are clearly visible. [Color figure can be viewed in the online issue, which is available at wileyonlinelibrary.com.]
Figure 4.
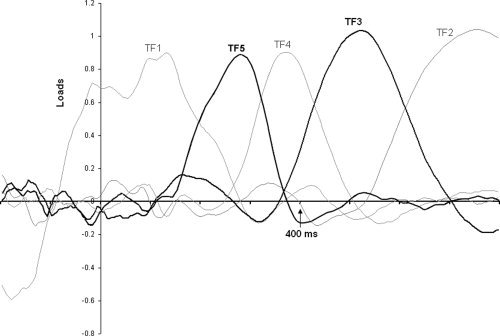
tPCA: Factor loadings after promax rotation. Temporal factors 5 (N2) and 3 (P3) are drawn in black.
Analysis of the experimental effects on N2 and P3 at the source level
As mentioned earlier, a ROI approach was performed to explore the precise contribution of the ACC to emotional response inhibition. On the one hand, Table III(A) shows regions of the ACC previously associated with response inhibition but not with emotional processing. Results of the present study showed that all ROIs had significantly greater activity during response inhibition (Nogo trials) than during response execution (Go trials), in both the N2 and P3 time ranges. On the other hand, Table III(B) shows regions of the ACC previously associated with emotional processing but not with response inhibition. With respect to N2, the effect of Emotion was significant in two ACC regions. Post hoc comparisons indicated that these ROIs showed the greatest activation in response to negative stimulation. With respect to P3, the effect of Emotion was only significant in one of these regions. In this case, post hoc comparisons indicated that this ROI showed the greatest activation in response to positive stimulation, which is in line with the findings by Elliott and colleagues [2000]. Finally, Table III(C) shows four ACC regions in which previous studies have reported an interaction between emotion and response inhibition. Only one region showed a significant trial type × emotion interaction. Post hoc comparisons indicated that whereas activation within this region differed as a function of the emotional content of the stimuli in Nogo trials, no differences were observed in Go trials. Specifically, inhibition‐related ACC activation was greater to A+ than to N and A−.
Table III.
Left (white background). A summary of the ACC locations found to be activated in emotional Go/Nogo paradigms as reported in the literature. Coordinates of these locations are reported in MNI space. Studies that originally listed coordinates in Talairach space were translated into MNI space using Matthew Brett's tal2mni script, implemented in Matlab (http://www.mrccbu.cam.ac.uk/Imaging/mnispace.html) [Brett et al.,2001]. Right (gray background). Statistical results of repeated‐measures ANOVAs with respect to Trial type (two levels: Go, Nogo), Emotion (three levels: A−, N, A+), and the interaction effect of Trial type × Emotion on mean N2 and P3 current densities within each ROI (radius = 9 mm).
| ANOVA present study's results for each ROI (radius = 9 mm) | |||||
|---|---|---|---|---|---|
| A: Inhibition‐sensitive locations | N2‐related ROI activity | P3‐related ROI activity | |||
| Study | Contrast | MNI coordinates x y z | BA | Trial type (Nogo, Go) (gl = 1, 29) | Trial type (Nogo, Go) (gl = 1, 29) |
| Albert et al.,2010 | Nogo vs. Go | 5 25 20 | 24/33 | F = 8.488, P = 0.007 | F = 9.319, P = 0.005 |
| Berkman et al.,2009 | Nogo vs. Go | −6 12 40 | 32 | F = 5.563, P = 0.025 | F = 5.924, P = 0.021 |
| Elliott et al.,2000 | All Go/Nogo vs. Rest | 3 19 53 | 8/6/32 | F = 5.476, P = 0.026 | F = 5.825, P = 0.022 |
| −3 13 50 | 6/32 | F = 8.101, P = 0.008 | F = 5.564, P = 0.025 | ||
| Hare et al.,2005 | Nogo vs. Go | 11 35 21 | 32 | F = 8.224, P = 0.008 | F = 9.201, P = 0.005 |
| Schulz et al.,2009 | Nogo vs. Go | 2 2 48 | 24/32 | F = 9.426, P = 0.005 | F = 4.977, P = 0.034 |
| B: Emotion‐sensitive locations | N2‐related ROI activity | P3‐related ROI activity | |||
|---|---|---|---|---|---|
| Study | Contrast | MNI coordinates x y z | BA | Emotion (A−, N, A+) (gl = 2, 58) | Emotion (A−, N, A+) (gl = 2, 58) |
| Berkman et al.,2009 | Pos vs. Baseline | 10 14 40 | 32 | F = 1.887, P = 0.169 | F = 0.791, P = 0.434 |
| Elliott et al.,2000 | (GoPos, GoNeg) vs. GoNeu | −6 37 −1 | 32/10 | F = 0.604, P = 0.508 | F = 0.368, P = 0.665 |
| Go Pos vs. Go Neg | 6 0 24 | 32/24 | F = 0.881, P = 0.419 | F = 4.143, P = 0.028 | |
| Hare et al.,2005 | (GoNeg, GoNeu) vs. (GoNeg, GoPos) | −7 −4 53 | 6/24 | F = 4.662, P = 0.017 | F = 0.835, P = 0.438 |
| Schulz et al.,2009 | Pos vs. Neu | −8 −14 56 | 6/31/24 | F = 3.905, P = 0.032 | F = 0.849, P = 0.427 |
| Shafritz et al.,2006 | GoNeg vs. GoPos | −13 23 −5* | 11/24 | F = 0.524, P = 0.588 | F = 2.278, P = 0.12 |
| C: Interaction‐sensitive locations | N2‐related ROI activity | P3‐related ROI activity | |||
|---|---|---|---|---|---|
| Study | Contrast | MNI coordinates x y z | BA | Trial type × Emotion (gl = 2, 58) | Trial type × Emotion (gl = 2, 58) |
| Albert et al.,2010 | Trial type (Go, Nogo) × Emotion (Neg, Neu, Pos) | 5 25 20 | 24/33 | F = 0.615, P = 0.499 | F = 3.855, P = 0.043 |
| Goldstein et al.,2007 | (Neg vs. Neu) × (Nogo vs. Go) | 9 −3 36 | 24 | F = 2.276, P = 0.117 | F = 2.487, P = 0.106 |
| Shafritz et al.,2006 | NogoNeg vs. NogoPos | 9 35 7* | 24/32 | F = 1.181, P = 0.314 | F = 2.71, P = 0.091 |
| −5 39 7* | 32/24 | F = 0.589, P = 0.549 | F = 1.743, P = 0.193 | ||
ROI, region of interest; Neg, negative; Neu, neutral; Pos, positive; BA, Brodmann's area; A−, arousing negative; N, neutral; A+, arousing positive; df, degrees of freedom.
Precise coordinates were provided directly by Keith M. Shafritz.
Relationship between emotional assessments, behavioral performance, and ACC activity
An important question was the estimation of the emotional dimension explaining the experimental effects observed in the region of the ACC sensitive to emotion × response inhibition interaction (see previous section). Although it is reasonable to deduce from the ANOVA results that valence influences ACC inhibition‐related activity to a greater extent than arousal, since A+ elicited higher activation than N and A−, additional analyses were necessary to test this hypothesis. To this end, the association between inhibition‐related ACC activation and valence and arousal ratings given by participants to each picture in the questionnaire was analyzed via multiple regression using the enter method. Inhibition‐related ACC activation was the dependent variable, and the independent variables were valence and arousal. Valence associated significantly with inhibition‐related ACC activation (R 2 = 0.11; β = 0.317, P < 0.005), while arousal did not (β = 0.150, P > 0.05). Figure 5 illustrates the linear association pattern between inhibition‐related ACC activation and valence: the higher the former, the higher the latter.
Figure 5.
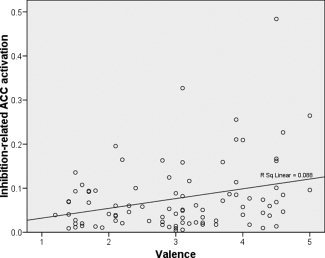
Scatter plots of valence (1, negative, to 5, positive) and inhibition‐related ACC activation (centroid coordinates of the ROI: 5 25 20) showing the regression line. Number of cases: 90 [30 participants × 3 conditions (NogoA−, NogoN, NogoA+)].
To test whether ACC and behavior were also interrelated, the association between inhibition‐related ACC activation within the same ROI and behavioral responses (commission errors and RTs) was also analyzed via multiple regression using the enter method. Inhibition‐related ACC activation was the dependent variable, and the predictor variables were mean RTs to Go stimuli and commission error rates. Inhibition‐related ACC activation was associated with commission errors (R 2 = 0.174; β = 0.279, P < 0.05) and RTs (β = −0.216, P < 0.05). Figure 6A illustrates the linear association pattern between inhibition‐related ACC activation and commission errors (the higher the former, the higher the rate of the latter), and Figure 6B shows the linear association pattern between inhibition‐related ACC activation and RTs to Go cues (the higher the former, the shorter the latter).
Figure 6.
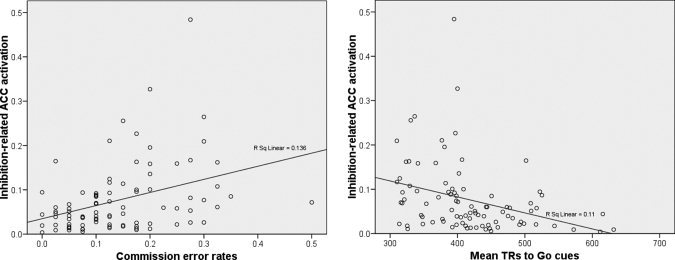
A: Scatter plots of commission error rates and inhibition‐related ACC activation (centroid coordinates of the ROI: 5 25 20) showing the regression line. B: Scatter plots of mean RTs to Go cues and inhibition‐related ACC activation (centroid coordinates of the ROI: 5 25 20) showing the regression line. In both analyses the number of cases was 90 [30 participants × 3 conditions (NogoA−, NogoN, NogoA+)].
DISCUSSION
Both behavioral and electrophysiological responses (which were significantly correlated) indicate that emotion and response inhibition constitute closely interrelated and mutually dependent processes. At the behavioral level, we found that participants made more commission errors to A+ than to N and A−, suggesting that withholding a response to positive stimuli is more difficult than withholding a response to other types of emotional stimuli. This conclusion is consistent with previous Go/Nogo studies showing that responses to happy faces are more difficult to inhibit than responses to sad and fearful faces, as indicated by a greater number of false alarms (i.e., commission errors) [Hare et al.,2005; Putman et al.,2010; Schulz et al.,2007]. It is well established that pleasant stimuli are associated with approach‐related behaviors, whereas unpleasant stimuli are associated with withdrawal‐related behaviors [e.g., Cacioppo and Gardner,1999; Lang et al.,1997]. Therefore, it is reasonable to suppose that this natural trend to approach pleasant and reward‐related events might make stopping responses to positive stimuli (whether they are faces or more complex events) more difficult than to other types of emotional stimuli.
At the neural level, results showed that a specific region of the ACC at the intersection of its dorsal and rostral subdivisions was significantly involved in the interaction between emotion and response inhibition. Specifically, activity within this region was greater during the inhibition of responses to A+ than to A− and N, suggesting that withholding motor responses to positive stimuli consumes greater inhibitory resources than to non‐positive stimuli. This conclusion is consistent with the finding of Albert et al. [2010] but inconsistent with the findings of Goldstein et al. [2007] and Shafritz et al. [2006]. The reasons for this discrepancy are not clear, but the following may be considered. First, it is possible that valence effects on inhibition‐related ACC activity might have been confounded with arousal effects, since the latter have not been taken into account. In the present study, however, regression analyses suggest that inhibition‐related ACC activation was associated with emotional valence rather than with emotional arousal. Second, the ACC plays a key role in several cognitive processes involved in the Go/Nogo task along with inhibition itself, such as attentional control, conflict monitoring and outcome evaluation [Braver et al.,2001; Carter et al.,1998; Garavan et al.,2002; MacDonald et al.,2000; Menon et al.,2001; Nakata et al.,2005; van Veen and Carter,2002a,b]. Thus, it is possible that the increased hemodynamic activity in the ACC detected during the Go/Nogo task may reflect the outcome of the interaction between emotional valence/arousal and several of the cognitive processes involved in the overcoming of a prepotent response. Indeed, the results of the present experiment suggest that conflict‐ and inhibition‐related ACC activation (reflected in N2‐ and P3‐related activity, respectively) were differently modulated by emotion (negative stimuli elicited the greatest activation in the N2 time range, whereas positive ones elicited the greatest activation in the P3 time range). Regression analyses shed some light on this issue by showing an association between emotional valence and P3‐related activation in the ACC region sensitive to emotion × response inhibition interaction. Specifically, we found that inhibition‐related activity in this region increased as emotional valence increased (i.e., stimulus valence was more positive).
The fact that emotion × response inhibition interaction was reported in the P3 time range implies that the ACC activity recorded in the present experiment was mainly associated with response inhibition. Although both N2 and P3 have traditionally been interpreted as indices of inhibition, recent evidence strengthens the assumption that the former primarily represents the detection of response conflict and the monitoring of performance rather than the inhibitory process itself [Donkers and van Boxtel,2004; Enriquez‐Geppert et al.,2010; Huster et al.,2010; van Veen and Carter,2002a,b]. By contrast, data currently available indicate that P3 is a more specific index of inhibition, predominantly reflecting motor response suppression [Bruin et al.,2001; Enriquez‐Geppert et al.,2010; Smith et al.,2007,2008]. Interestingly, regression analyses between ACC activity and behavioral performance support the critical role of this structure in motor inhibition. On the one hand, we found that faster responses to Go cues were associated with greater inhibition‐related ACC activation to Nogo cues. This means that a greater mobilization of inhibitory resources (i.e., ACC activation) is required to successfully suppress faster responses. This result is in line with previous findings showing that both the ACC and the P3 component are especially important in urgent inhibitions [Albert et al.,2010; Dimoska et al.,2006; Garavan et al.,2002]. On the other hand, we found that higher commission error rates were associated with greater inhibition‐related ACC activation. These results suggest that the participants who showed more difficulty withholding responses (i.e., those who made more commission errors) showed more ACC activity during successful response inhibitions. Taken together, these data suggest that the ACC plays a prominent role in difficult/urgent response inhibitions and, more important, that this structure seems to represent a critical interface between emotion and inhibition.
Examination of activation within each ROI during the implicit emotional Go/Nogo task also revealed the following findings. First, ROIs associated with response inhibition were primarily located in the dorsal region of the ACC, whereas ROIs associated with emotional processing were distributed throughout the ACC (see Fig. 2). Therefore, these data do not support the traditional differentiation of dorsal (dACC) and rostral (rACC) anterior cingulate cortex for cognitive and emotional function, respectively [Bush et al.,2000; Devinsky et al.,1995]. This conclusion is in line with recent evidence indicating that both subdivisions of the ACC make important contributions to emotional processing [Beckmann et al.,2009; Etkin et al.,2011; Vogt,2005]. Second, response inhibition effects on ACC activity were more extensive than emotional effects: whereas the involvement of the ACC in conflict monitoring‐ and inhibition‐related processes was observed in all ROIs, emotional effects were only shown in three specific regions (see Table III). These data suggest that the ACC is conspicuously involved in response inhibition (both in conflict monitoring and in inhibition processes), regardless of stimulus type and task characteristics. In contrast, the effects of emotion on ACC activity are less precise and probably more dependent on the task and experimental conditions, such as the emotional salience of stimuli [e.g., emotional scenes such as those employed here are considered more emotionally arousing than affective words or emotional facial expressions, two types of stimulus widely employed in previous studies on emotional response inhibition: Britton et al.,2006; Hinojosa et al.,2009]. Finally, as mentioned above, emotion × response inhibition interaction was evident in a specific region of the ACC at the intersection of its dorsal and rostral subdivisions (and also tended to be significant in a nearby region: see Table III and Fig. 2), suggesting that this area plays a major role in emotion‐modulated response inhibition [Shafritz et al.,2006]. Interestingly, this region of the ACC has strong connections with the amygdala, ventral striatum and orbitofrontal cortex [Beckmann et al.,2009; Marguiles et al.,2007], three cerebral structures that have also recently been implicated in emotional response inhibition [Berkman et al.,2009; Goldstein et al.,2007; Hare et al.,2005; Sagaspe et al.,2011]. Future studies examining the functional connectivity between these regions will be important to provide a more complete picture of the role of the ACC in emotion‐modulated response inhibition.
In conclusion, by capitalizing on the high temporal resolution of the ERPs and recent advances in the reconstruction of electrophysiological sources, the results of the present research shed light on the precise role of the ACC in emotional response inhibition. However, although the development of mathematical algorithms capable of solving the inverse problem is facilitating access to spatial information, electrophysiological measures cannot provide the same precision as hemodynamic procedures. Moreover, given the novelty of the methodology used in the present study, future studies are necessary to confirm these findings and further elucidate the most suitable methodological strategies for combining different functional neuroimaging techniques. Nevertheless, we believe that this study represents an important new step toward the integration of hemodynamic and electrophysiological information to obtain a comprehensive understanding of timing and location of brain activity underlying emotion and inhibition interaction.
Supporting information
Additional Supporting Information may be found in the online version of this article.
Supporting Information
Acknowledgements
The authors thank Keith M. Shafritz and Elliot T. Berkman for providing information on the precise ACC coordinates at which their experimental effects were most prominent.
REFERENCES
- Albert J, López‐Martín S, Carretié L ( 2010): Emotional context modulates response inhibition: Neural and behavioral data. Neuroimage 49: 914–921. [DOI] [PubMed] [Google Scholar]
- Beckmann M, Johansen‐Berg H, Rushworth MFS ( 2009): Connectivity‐based parcellation of human cingulate cortex and its relation to functional specialization. J Neurosci 29: 1175–1190. [DOI] [PMC free article] [PubMed] [Google Scholar]
- Berkman ET, Burklund L, Lieberman MD ( 2009): Inhibitory spillover: Intentional motor inhibition produces incidental limbic inhibition via right inferior frontal cortex. Neuroimage 47: 705–712. [DOI] [PMC free article] [PubMed] [Google Scholar]
- Beste C, Saft C, Andrich J, Gold R, Falkenstein M ( 2008): Response inhibition in Huntington's disease—A study using ERPs and sLORETA. Neuropsychologia 46: 129. [DOI] [PubMed] [Google Scholar]
- Bishop S, Duncan J, Brett M, Lawrence AD ( 2004): Prefrontal cortical function and anxiety: Controlling attention to threat‐related stimuli. Nat Neurosci 7: 184–188. [DOI] [PubMed] [Google Scholar]
- Bokura H, Yamaguchi S, Kobayashi S ( 2001): Electrophysiological correlates for response inhibition in a Go/NoGo task. Clin Neurophysiol 112: 2224–2232. [DOI] [PubMed] [Google Scholar]
- Braver TS, Barch DM, Gray JR, Molfese DL, Snyder A ( 2001): Anterior cingulate cortex and response conflict: Effects of frequency, inhibition and errors. Cereb Cortex 11: 825–836. [DOI] [PubMed] [Google Scholar]
- Brett M, Christoff K, Cusack R, Lancaster J ( 2001): Using the Talairach atlas with the MNI template. Neuroimage 13: 85. [Google Scholar]
- Britton JC, Taylor SF, Sudheimer KD, Liberzon I ( 2006): Facial expressions and complex IAPS pictures: Common and differential networks. Neuroimage 31: 906–919. [DOI] [PubMed] [Google Scholar]
- Bruin KJ, Wijers AA, van Staveren ASJ ( 2001): Response priming in a go/nogo task: Do we have to explain the go/nogo N2 effect in terms of response activation instead of inhibition? Clin Neurophysiol 112: 1660–1671. [DOI] [PubMed] [Google Scholar]
- Bush G, Luu P, Posner MI ( 2000): Cognitive and emotional influences in anterior cingulate cortex. Trends Cogn Sci 4: 215–222. [DOI] [PubMed] [Google Scholar]
- Cacioppo JT, Gardner WL ( 1999): Emotion. Annu Rev Psychol 50: 191–214. [DOI] [PubMed] [Google Scholar]
- Carretié L, Tapia M, Mercado F, Albert J, López‐Martín S, de la Serna JM ( 2004): Voltage‐based versus factor score‐based source localization analyses of electrophysiological brain activity: A comparison. Brain Topogr 17: 109–115. [DOI] [PubMed] [Google Scholar]
- Carretié L, Hinojosa JA, Albert J, Mercado F ( 2006): Neural response to sustained affective visual stimulation using an indirect task. Exp Brain Res 174: 630–637. [DOI] [PubMed] [Google Scholar]
- Carter CS, Braver TS, Barch DM, Botvinick MM, Noll D, Cohen JD ( 1998): Anterior cingulate cortex, error detection, and the online monitoring of performance. Science 280: 747–749. [DOI] [PubMed] [Google Scholar]
- Chapman RM, McCrary JW ( 1995): EP component identification and measurement by principal components analysis. Brain Cogn 27: 288–310. [DOI] [PubMed] [Google Scholar]
- Chiu PH, Holmes AJ, Pizzagalli DA ( 2008): Dissociable recruitment of rostral anterior cingulate and inferior frontal cortex in emotional response inhibition. Neuroimage 42: 988–997. [DOI] [PMC free article] [PubMed] [Google Scholar]
- Cliff N. (1987): Analyzing Multivariate Data. San Diego, CA: Harcourt Brace Jovanovich. [Google Scholar]
- Coles MGH, Gratton G, Kramer AF, Miller GA ( 1986): Principles of signal acquisition and analysis. Psychophysiology: Systems, processes, and applications. Amsterdam: Elsevier. p. 183–221. [Google Scholar]
- Devinsky O, Morrell M, Vogt BA ( 1995): Contributions of anterior cingulate cortex to behaviour. Brain 118: 279–306. [DOI] [PubMed] [Google Scholar]
- Dien J ( 2010): Evaluating two‐step PCA of ERP data with Geomin, Infomax, Oblimin, Promax, and Varimax rotations. Psychophysiology 47: 170–183. [DOI] [PubMed] [Google Scholar]
- Dien J, Beal DJ, Berg P ( 2005): Optimizing principal components analysis of event‐related potentials: Matrix type, factor loading weighting, extraction, and rotations. Clin Neurophysiol 116: 1808–1825. [DOI] [PubMed] [Google Scholar]
- Dien J, Khoe W, Mangun GR ( 2007): Evaluation of PCA and ICA of simulated ERPs: Promax vs. infomax rotations. Hum Brain Mapp 28: 742–763. [DOI] [PMC free article] [PubMed] [Google Scholar]
- Dien J, Spencer KM, Donchin E ( 2003): Localization of the event‐related potential novelty response as defined by principal components analysis. Cogn Brain Res 17: 637–650. [DOI] [PubMed] [Google Scholar]
- Dierks T, Jelic V, Pascual‐Marqui RD, Wahlund L, Julin P, Linden DE, Maurer K, Winblad B, Nordberg A ( 2000): Spatial pattern of cerebral glucose metabolism (PET) correlates with localization of intracerebral EEG‐generators in Alzheimer's disease. Clin Neurophysiol 111: 1817–1824. [DOI] [PubMed] [Google Scholar]
- Dimoska A, Johnstone SJ, Barry RJ ( 2006): The auditory‐evoked N2 and P3 components in the stop‐signal task: Indices of inhibition, response‐conflict or error‐detection? Brain Cogn 62: 98–112. [DOI] [PubMed] [Google Scholar]
- Donchin E, Heffley EF ( 1978): Multivariate analysis of event‐related potential data: A tutorial review. In: Otto D, editor. Multidisciplinary Perspectives in Event Related Brain Potential Research. Washington, DC: US Goverment Printing Office. p 555–572. [Google Scholar]
- Donkers FCL, van Boxtel GJM ( 2004): The N2 in go/no‐go tasks reflects conflict monitoring not response inhibition. Brain Cogn 56: 165–176. [DOI] [PubMed] [Google Scholar]
- Duncan‐Johnson CC, Donchin E ( 1977): On quantifying surprise: The variation of event‐related potentials with subjective probability. Psychophysiology 14: 456–467. [DOI] [PubMed] [Google Scholar]
- Eimer M ( 1993): Effects of attention and stimulus probability on ERPs in a Go/Nogo task. Biol Psychol 35: 123–138. [DOI] [PubMed] [Google Scholar]
- Elliott R, Rubinsztein JS, Sahakian BJ, Dolan RJ ( 2000): Selective attention to emotional stimuli in a verbal go/no‐go task: an fMRI study. Neuroreport 11: 1739. [DOI] [PubMed] [Google Scholar]
- Enriquez‐Geppert S, Konrad C, Pantev C, Huster RJ ( 2010): Conflict and inhibition differentially affect the N200/P300 complex in a combined go/nogo and stop‐signal task. Neuroimage 51: 877–887. [DOI] [PubMed] [Google Scholar]
- Etkin A, Egner T, Kalisch R ( 2011): Emotional processing in anterior cingulate and medial prefrontal cortex. Trends Cogn Sci 15: 85–93. [DOI] [PMC free article] [PubMed] [Google Scholar]
- Fallgatter AJ, Bartsch AJ, Herrmann MJ ( 2002): Electrophysiological measurements of anterior cingulate function. J Neural Transm 109: 977–988. [DOI] [PubMed] [Google Scholar]
- Friedman D, Cycowicz YM, Gaeta H ( 2001): The novelty P3: an event‐related brain potential (ERP) sign of the brain's evaluation of novelty. Neurosci Biobehav Rev 25: 355–373. [DOI] [PubMed] [Google Scholar]
- Garavan H, Ross TJ, Murphy K, Roche RA, Stein EA ( 2002): Dissociable executive functions in the dynamic control of behavior: Inhibition, error detection, and correction. Neuroimage 17: 1820–1829. [DOI] [PubMed] [Google Scholar]
- Goldstein M, Brendel G, Tuescher O, Pan H, Epstein J, Beutel M, Yang Y, Thomas K, Levy K, Silverman M, Clarkin J, Posner M, Kernberg O, Stern E, Silbersweig D ( 2007): Neural substrates of the interaction of emotional stimulus processing and motor inhibitory control: An emotional linguistic go/no‐go fMRI study. Neuroimage 36: 1026–1040. [DOI] [PubMed] [Google Scholar]
- Gratton G, Coles MG, Donchin E ( 1983): A new method for off‐line removal of ocular artifact. Electroencephalogr Clin Neurophysiol 55: 468–484. [DOI] [PubMed] [Google Scholar]
- Gratton G, Fabiani M ( 2001): Shedding light on brain function: The event‐related optical signal. Trends Cogn Sci 5: 357–363. [DOI] [PubMed] [Google Scholar]
- Hare TA, Tottenham N, Davidson MC, Glover GH, Casey BJ ( 2005): Contributions of amygdala and striatal activity in emotion regulation. Biol Psychiatry 57: 624–632. [DOI] [PubMed] [Google Scholar]
- Hariri AR, Mattay VS, Tessitore A, Fera F, Weinberger DR ( 2003): Neocortical modulation of the amygdala response to fearful stimuli. Biol Psychiatry 53: 494–501. [DOI] [PubMed] [Google Scholar]
- Herrmann MJ, Huter T, Plichta MM, Ehlis A‐C, Alpers GW, Mühlberger A, Fallgatter J ( 2008): Enhancement of activity of the primary visual cortex during processing of emotional stimuli as measured with event‐related functional near‐infrared spectroscopy and event‐related potentials. Hum Brain Mapp 29: 28–35. [DOI] [PMC free article] [PubMed] [Google Scholar]
- Hinojosa JA, Carretié L, Valcárcel MA, Méndez‐Bértolo C, Pozo MA ( 2009): Electrophysiological differences in the processing of affective information in words and pictures. Cogn Affect Behav Neurosci 9: 173. [DOI] [PubMed] [Google Scholar]
- Huster RJ, Westerhausen R, Pantev C, Konrad C ( 2010): The role of the cingulate cortex as neural generator of the N200 and P300 in a tactile response inhibition task. Hum Brain Mapp 31: 1260–1271. [DOI] [PMC free article] [PubMed] [Google Scholar]
- Keil A ( 2006): Macroscopic brain dynamics during verbal and pictorial processing of affective stimuli. Prog Brain Res 156: 217–232. [DOI] [PubMed] [Google Scholar]
- Kiefer M, Marzinzik F, Weisbrod M, Scherg M, Spitzer M ( 1998): The time course of brain activations during response inhibition: Evidence from event‐related potentials in a go/no go task. Neuroreport 9: 765–770. [DOI] [PubMed] [Google Scholar]
- Kiehl KA, Stevens MC, Laurens KR, Pearlson G, Calhourn VD, Liddle PF ( 2005): An adaptive reflexive processing model of neurocognitive function: Supporting evidence from a large scale (n = 100) fMRI study of an auditory oddball task. NeuroImage 25: 899–915. [DOI] [PubMed] [Google Scholar]
- Kissler J, Assadollahi R, Herbert C ( 2006): Emotional and semantic networks in visual word processing: Insights from ERP studies. Prog Brain Res 156: 147–183. [DOI] [PubMed] [Google Scholar]
- Lang PJ, Bradley MM, Cuthbert BN ( 1997): Motivated attention: Affect, activation and action. In: Lang PJ, Simons RF, Balaban MT(Eds.), Attention and Orienting: Sensory and Motivational Processes. Erlbaum, Hillsdale NJ, p. 97–135.
- Lang PJ, Bradley MM, Cuthbert BN ( 2005): International affective picture system (IAPS): Affective ratings of pictures and instruction manual. Technical Report A‐6. [Google Scholar]
- Lang PJ, Greenwald MK, Bradley MM, Hamm AO ( 1993): Looking at pictures: Affective, facial, visceral, and behavioral reactions. Psychophysiology 30: 261–273. [DOI] [PubMed] [Google Scholar]
- Liddle PF, Kiehl KA, Smith AM ( 2001): Event‐related fMRI study of response inhibition. Hum Brain Mapp 12: 100–109. [DOI] [PMC free article] [PubMed] [Google Scholar]
- Lorente de Nó R ( 1947): Action potential of the motoneurons of the hypoglossus nucleus. J Cell Compar Physiol 29: 207–287. [DOI] [PubMed] [Google Scholar]
- MacDonald AW, Cohen JD, Stenger VA, Carter CS ( 2000): Dissociating the role of the dorsolateral prefrontal and anterior cingulate cortex in cognitive control. Science 288: 1835–1838. [DOI] [PubMed] [Google Scholar]
- Marguiles DS, Kelly AMC, Uddin LQ, Biswal BB, Castellanos FX, Milham MP ( 2007): Mapping the functional connectivity of anterior cingulate cortex. NeuroImage 37: 579–588. [DOI] [PubMed] [Google Scholar]
- McCormick LM, Ziebell S, Nopoulos P, Cassell M, Andreasen NC, Brumm M ( 2006): Anterior cingulate cortex: An MRI‐based pacellation method. NeuroImage 32: 1167–1175. [DOI] [PubMed] [Google Scholar]
- Menon V, Adleman NE, White CD, Glover GH, Reiss AL ( 2001): Error‐related brain activation during a Go/NoGo response inhibition task. Hum Brain Mapp 12: 131–143. [DOI] [PMC free article] [PubMed] [Google Scholar]
- Millisecond Software ( 2006): Millisecond Software. Inquisit 2.0.60616 [Computer software]. Seattle, WA: Millisecond Software. [Google Scholar]
- Mulert C, Jäger L, Schmitt R, Bussfeld P, Pogarell O, Möller HJ, Juckel G, Hegerl U ( 2004): Integration of fMRI and simultaneous EEG: Towards a comprehensive understanding of localization and time‐course of brain activity in target detection. Neuroimage 22: 83–94. [DOI] [PubMed] [Google Scholar]
- Nakata H, Inui K, Wasaka T, Akatsuka K, Kakigi R ( 2005): Somato‐motor inhibitory processing in humans: A study with MEG and ERP. Eur J Neurosci 22: 1784–1792. [DOI] [PubMed] [Google Scholar]
- Nieuwenhuis S, Yeung N, Van Den Wildenberg W, Ridderinkhof KR ( 2003): Electrophysiological correlates of anterior cingulate function in a go/no‐go task: Effects of response conflict and trial type frequency. Cogn Affect Behav Neurosci 3: 17–26. [DOI] [PubMed] [Google Scholar]
- Opitz B, Mecklinger A, Friederici AD, von Cramon DY ( 1999): The functional neuroanatomy of novelty processing: Integrating ERP and fMRI results. Cereb Cortex 9: 379–391. [DOI] [PubMed] [Google Scholar]
- Osgood CE, Suci GJ, Tannenbaum PH ( 1957): The Measurement of Meaning. Urbana: University of Illinois Press. [Google Scholar]
- Pascual‐Marqui RD ( 2002): Standardized low‐resolution brain electromagnetic tomography (sLORETA): Technical details. Methods Find Exp Clin Pharmacol 24 ( Suppl D): 5–12. [PubMed] [Google Scholar]
- Pfefferbaum A, Ford JM, Weller BJ, Kopell BS ( 1985): ERPs to response production and inhibition. Electroencephalogr Clin Neurophysiol 60: 423–434. [DOI] [PubMed] [Google Scholar]
- Pizzagalli D, Oakes T, Fox A, Chung M, Larson C, Abercrombie H, Schaefer S, Benca R, Davidson R ( 2003): Functional but not structural subgenual prefrontal cortex abnormalities in melancholia. Mol Psychiatry 9: 393–405. [DOI] [PubMed] [Google Scholar]
- Putman P, van Peer J, Maimari I, van der Werff S ( 2010): EEG theta/beta ratio in relation to fear‐modulated response inhibition, attentional control, and affective traits. Biol Psychol 83: 73–78. [DOI] [PubMed] [Google Scholar]
- Sagaspe P, Schwartz S, Vuilleumier P ( 2011): Fear and stop: A role for the amygdala in motor inhibition by emotional signals. NeuroImage. DOI: 10.1016/j.neuroimage.2011.01.027. [DOI] [PubMed] [Google Scholar]
- Schulz KP, Fan JM, Olga M, David JH, Bella H, Jeffrey M ( 2007): Does the emotional go/no‐go task really measure behavioral inhibition? Convergence with measures on a non‐emotional analog. Arch Clin Neuropsychol 22: 151–160. [DOI] [PMC free article] [PubMed] [Google Scholar]
- Schulz KP, Clerkin SM, Halperin JM, Newcorn JH, Tang CY, Fan J ( 2009): Dissociable neural effects of stimulus valence and preceding context during the inhibition of responses to emotional faces. Hum Brain Mapp 30: 2821–2833. [DOI] [PMC free article] [PubMed] [Google Scholar]
- Shafritz KM, Collins SH, Blumberg HP ( 2006): The interaction of emotional and cognitive neural systems in emotionally guided response inhibition. Neuroimage 31: 468–475. [DOI] [PubMed] [Google Scholar]
- Smith CA, Ellsworth PC ( 1985): Patterns of cognitive appraisal in emotion. J Pers Soc Psychol 48: 813–838. [PubMed] [Google Scholar]
- Smith JL, Johnstone SJ, Barry RJ ( 2007): Response priming in the Go/NoGo task: The N2 reflects neither inhibition nor conflict. Clin Neurophysiol 118: 343–355. [DOI] [PubMed] [Google Scholar]
- Smith JL, Johnstone SJ, Barry RJ ( 2008): Movement‐related potentials in the Go/NoGo task: The P3 reflects both cognitive and motor inhibition. Clin Neurophysiol 119: 704–714. [DOI] [PubMed] [Google Scholar]
- Taylor PCJ, Nobre AC, Rushworth MFS ( 2007): Subsecond changes in top‐down control exerted by human medial frontal cortex during conflict and action selection: A combined transcranial magnetic stimulation‐electroencephalography study. J Neurosci 27: 11343–11353. [DOI] [PMC free article] [PubMed] [Google Scholar]
- Taylor SF, Phan KL, Decker LR, Liberzon I ( 2003): Subjective rating of emotionally salient stimuli modulates neural activity. Neuroimage 18: 650–659. [DOI] [PubMed] [Google Scholar]
- Thomason ME, Chang CE, Glover GH, Gabrieli JDE, Greicius MD, Gotlib IH ( 2008): Default‐mode function and task‐induced deactivation have overlapping brain substrates in children. NeuroImage 41: 1493–1503. [DOI] [PMC free article] [PubMed] [Google Scholar]
- van Veen V, Carter CS ( 2002a) The anterior cingulate as a conflict monitor: fMRI and ERP studies. Physiol Behav 77: 477–482. [DOI] [PubMed] [Google Scholar]
- van Veen V, Carter CS ( 2002b) The timing of action‐monitoring processes in the anterior cingulate cortex. J Cogn Neurosci 14: 593–602. [DOI] [PubMed] [Google Scholar]
- Vitacco D, Brandeis D, Pascual‐Marqui R, Martin E ( 2002): Correspondence of event‐related potential tomography and functional magnetic resonance imaging during language processing. Hum Brain Mapp 17: 4–12. [DOI] [PMC free article] [PubMed] [Google Scholar]
- Vogt BA ( 2005): Pain and emotion interactions in subregions of the cingulate gyrus. Nat Rev Neurosci 6: 533–544. [DOI] [PMC free article] [PubMed] [Google Scholar]
- Yeung N, Cohen JD, Botvinick MM ( 2004): The neural basis of error detection: Conflict monitoring and the error‐related negativity. Psychol Rev 111: 931–959. [DOI] [PubMed] [Google Scholar]
Associated Data
This section collects any data citations, data availability statements, or supplementary materials included in this article.
Supplementary Materials
Additional Supporting Information may be found in the online version of this article.
Supporting Information