

Abstract
It has recently been demonstrated that specific patterns of correlation exist in diffusion tensor imaging (DTI) parameters across white matter tracts in the normal human brain. These microstructural correlations are thought to reflect phylogenetic and functional similarities between different axonal fiber pathways. However, this earlier work was limited in three major respects: (1) the analysis was restricted to only a dozen selected tracts; (2) the DTI measurements were averaged across whole tracts, whereas metrics such as fractional anisotropy (FA) are known to vary considerably within single tracts; and (3) a univariate measure of correlation was used. In this investigation, we perform an automated multivariate whole‐brain voxel‐based study of white matter FA correlations using independent component analysis (ICA) of tract‐based spatial statistics computed from 3T DTI in 53 healthy adult volunteers. The resulting spatial maps of the independent components show voxels for which the FA values within each map co‐vary across individuals. The strongest FA correlations were found in anatomically recognizable tracts and tract segments, either singly or in homologous pairs. Hence, ICA of DTI provides an automated unsupervised decomposition of the normal human brain into multiple separable microstructurally correlated white matter regions, many of which correspond to anatomically familiar classes of white matter pathways. Further research is needed to determine whether whole‐brain ICA of DTI represents a novel alternative to tractography for feature extraction in studying the normal microstructure of human white matter as well as the abnormal white matter microstructure found in neurological and psychiatric disorders. Hum Brain Mapp, 2011. © 2011 Wiley‐Liss, Inc.
Keywords: behavior, brain, cognition, diffusion tensor imaging (DTI), human, independent component analysis, fiber tractography, white matter
INTRODUCTION
Diffusion tensor imaging (DTI) has revolutionized the scientific study and clinical assessment of white matter pathways in the human brain [Basser and Pierpaoli, 1996; Conturo et al., 1999; Mori et al., 1999]. DTI parameters such as mean diffusivity (MD), fractional anisotropy (FA), axial diffusivity (AD), and radial diffusivity (RD) are thought to reflect the microstructural organization of white matter tracts. Hundreds of prior DTI papers have demonstrated that these quantitative metrics can be used to investigate brain development and aging [Moseley, 2002; Mukherjee and McKinstry, 2006], identify white matter correlates for cognitive function [Beaulieu et al., 2005; Klingberg et al., 2000; Niogi and McCandliss, 2006; Niogi et al., 2008; Zahr et al., 2009], and characterize pathologic white matter changes in neurological and psychiatric disorders [Nucifora et al., 2007]. However, the vast majority of these studies have treated the DTI measurements from different white matter tracts as if they were independent. A recent study using reproducible quantitative fiber tracking protocols has shown that, on the contrary, specific patterns of correlation exist between DTI measurements from various association and projection tracts of the supratentorial brain across a cohort of healthy adult volunteers [Wahl et al., 2010]. These “microstructural correlations” appear to reflect phylogenetic and functional relationships among these tracts. For example, most homologous pairs of white matter tracts were more strongly correlated with each other by FA values than with other nonhomologous tracts, except in cases of known functional hemispheric asymmetry such as the arcuate fasciculus (AF) where such FA correlations between the left and right hemispheres were weaker. Furthermore, the corticospinal tracts (CSTs), which are cortical–subcortical projection pathways, showed much weaker FA correlations with association tracts than the association tracts did with each other. Hence, there are interesting large‐scale properties of the microstructural organization of white matter in the human brain that can be further elucidated using DTI.
In this study, we overcome three major limitations of the methods of Wahl et al. [2010] to accomplish a fully automated multivariate whole‐brain analysis of microstructural correlations in normal adult white matter. First, the analysis in Wahl et al. [ 2010] was restricted to only a dozen selected white matter tracts. Second, the DTI parametric measurements were averaged across whole tracts, whereas metrics such as FA are known to vary considerably along the length of single pathways. Third, only a univariate measure of correlation was used. In this investigation, we perform a multivariate whole‐brain voxel‐based study of FA correlations in normal human white matter using independent component analysis (ICA) of tract‐based spatial statistics (TBSS). The use of a voxel‐based approach enables the detection of microstructural correlations at a much smaller spatial scale than that of entire tracts. Moreover, a multivariate analysis method such as ICA is capable of identifying correlations among multiple groups of spatially distant white matter regions, and is not restricted to the pairwise inter‐tract correlations examined in Wahl et al. [ 2010], thereby extending the concept of microstructural correlations to larger‐scale networks of white matter throughout the brain.
We test three hypotheses concerning the microstructural organization of white matter using this new approach. First, we postulate that ICA can automatically extract anatomically distinct white matter tracts from the voxel‐wise group FA maps because the FA of voxels belonging to the same tract will tend to co‐vary across subjects in the group. Second, we posit that homologous white matter tracts of the left and right cerebral or cerebellar hemispheres will be assigned by the ICA algorithm to the same independent component because they are functionally similar and therefore would tend to be microstructurally correlated as well. Finally, we hypothesize that functionally specialized segments of a major white matter tract such as the corpus callosum will have distinct patterns of microstructural covariation and hence would be further parcellated into different independent components by the ICA algorithm.
MATERIALS AND METHODS
Participants
The inclusion criteria for subjects in this study were healthy volunteers ages 20–50 years. Exclusion criteria included any history of chronic medical illness, neurological or psychiatric disorder, including substance abuse, as well as any contraindications to MR imaging including pregnancy. Any brain morphological abnormalities found on structural MR imaging also constituted an exclusion criterion. Written informed consent was obtained from all participants in accordance with protocols approved by the institutional review board of the University of California, San Francisco. There were a total of 53 subjects (mean age 30.7 ± 8.8 years, 31 men and 22 women, 44 right‐handed and 9 left‐handed) enrolled who met all inclusion and exclusion criteria. Quantitative fiber tractography data from DTI scans of the first 44 of these subjects has been published previously [Wahl et al., 2010].
MRI and DTI Acquisition
Magnetic resonance imaging (MRI) and DTI acquisition methods were identical to Wahl et al. [2010]. Briefly, images were acquired on a 3T Signa EXCITE scanner (GE Healthcare, Waukesha, WI) equipped with an 8‐channel phased array head coil. Whole‐brain DTI was performed with a multislice single‐shot spin echo echoplanar pulse sequence (TE = 63 ms, TR = 14 s) using 55 diffusion‐encoding directions acquired at b = 1,000 s/mm2, 1 acquisition with b = 0 s/mm2, 72 interleaved axial slices, 1.8‐mm slice thickness with no gap between slices, a 128 × 128 matrix and a field of view (FOV) of 230 mm. Parallel imaging was employed, using the Array Spatial Sensitivity Encoding Technique (ASSET) with an acceleration factor of 2. Total acquisition time was 13.07 min. High‐resolution structural 3T MR imaging was performed using an axial 3D inversion recovery fast spoiled gradient‐recalled echo (FSPGR) T1‐weighted sequence (TE = 1.5 ms, TR = 6.3 ms, TI = 400 ms, flip angle of 15 degrees) with 230 mm FOV, 156 1.0‐mm contiguous partitions at a 256 × 256 matrix.
DTI Preprocessing and Tract‐Based Spatial Statistics
An overview of the DTI preprocessing, TBSS analysis, and ICA processing pipeline is given in Figure 1. After nonbrain tissue was removed using the Brain Extraction Tool (BET; http://www.fmrib.ox.ac.uk/analysis/research/bet/) with a fractional intensity threshold of 0.3 [Smith, 2002], the diffusion‐weighted images were corrected for motion and eddy currents using FMRIB's Linear Image Registration Tool (FLIRT; http://www.fmrib.ox.ac.uk/fsl/flirt) with 12‐parameter linear image registration [Jenkinson et al., 2002]. All b = 1,000 s/mm2 diffusion‐weighted images were registered to the b = 0 s/mm2 image. Using DTIFIT from the FMRIB's Diffusion Toolbox, a rank‐2 diffusion tensor model was fitted at each voxel and the FA value was calculated. Then, the voxel‐wise statistical analysis of DTI data was conducted with TBSS [Smith et al., 2006, 2007]. The first TBSS step identifies a chosen registration target and aligns individual whole‐brain FA volumes to this target using nonlinear registration. The target can be the FMRIB58 template, a chosen subject's FA images, or the minimum deformable template among all subjects that is identified by nonlinear registration of every subject to every other subject. We compared the FMRIB58 template to the minimum deformable template in separate TBSS analyses to determine the best registration target. Next, thinning was applied to the local tract structure of each aligned FA image to create the mean skeletonized FA image. Individual FA volumes were then projected onto the mean FA skeleton by filling the skeleton with FA values from the nearest tract center. The tract center was located via a perpendicular search for the maximum FA value within the local skeleton structure. A threshold of FA >0.2 was applied to the FA values on the skeletonized FA image to minimize inter‐subject variability and partial volume effect. Lastly, voxel‐wise FA values across subjects on the tract skeleton were calculated in the standard 1 × 1 × 1‐mm3 MNI152 atlas space.
Figure 1.

Data analysis flow chart, with boxes on the top row showing two major data processing steps: TBSS projects the FA values of each of n = M subjects onto a common white matter skeleton; ICA decomposes the group of FA skeleton maps into sparse spatial patterns reflecting FA correlations. The bottom row shows the transitions along the data processing pipeline from raw diffusion images to FA skeletons to independent component spatial maps reflecting microstructurally correlated white matter overlaid on the MNI152 3D T1 template.
DTI Independent Component Analysis
We applied independent component analysis [Hyvarinen et al., 2000] to estimate the multivariate correlations of voxel‐based values from skeletonized FA maps of the group of 53 normal volunteers after spatial normalization using TBSS. ICA is an unsupervised data‐driven analysis method that decomposes multidimensional data into a set of independent and sparsely distributed components.
To improve the signal to noise ratio (SNR), each subject's FA map was spatially smoothed along the common FA skeleton by a Gaussian kernel with full‐width‐half‐maximum (FWHM) of 9 mm. The smoothing kernel was limited to the FA skeleton only; hence there was no partial volume averaging with tissue that was not white matter, such as gray matter or cerebrospinal fluid.
To study sparse correlation structure from the skeletonized group FA maps, we assumed that these maps can be decomposed as linear combinations of a number of microstructurally correlated spatial patterns, each associated with a cross‐subject variation profile, confounded by post‐registration artifacts and noise. The generative model of the group FA dataset can be written as Eq. (1)
| (1) |
where Y is an M × N data matrix constructed from M subjects with FA values at N voxels on the common ensemble of white matter tracts, i.e., the tract skeleton. B is an M × N matrix containing the common variational trend along subject and spatial dimensions of the group dataset, i.e., the global signals. The matrix S is a K × N matrix containing K statistically independent FA patterns as its row vectors, A is an M × K mixing matrix with a cross‐subject variational profile in each column, and N (without italics) is an M × N matrix comprised of isotropic Gaussian noise.
Prior to ICA decomposition, we evaluated and removed three global signals. The first global signal is the baseline b 0, which is the overall mean of the entire FA dataset including all subjects. The second is the global signal spanned by the column mean m 1, where 1M is an M × 1 column vector of ones. The column mean m 1 is a vector containing the mean value of each column of Y, representing the mean FA value at each voxel over the group of subjects. The vector m 1 can be reshaped into a 3D skeleton that represents the spatial variation of FA averaged over all the subjects, i.e., the “global spatial variation.” The third one is the global signal spanned by the row mean m 2, a vector containing the mean value of each row of Y, representing the mean FA value of each subject over the entire skeleton. This signal indicates the variation of the spatially averaged FA level across subjects, i.e., the “global subject variation.” In the Results section, we compare the ICA results with and without these global variations to show that global variation removal improves estimation of the FA microstructural correlations.
Also prior to performing ICA, we reduced the dimension of the signal subspace, K, using principal component analysis (PCA), where the majority of the total sum of squares (SS) is kept in the signal subspace by selecting only the first 25 principal components. In the Results section, we compare the estimated ICs from this dimensionally reduced data to that from the full dimensional decomposition to demonstrate that dimension reduction improves estimation of independent FA spatial maps in the sense of better SNR and of better representation of microstructural correlations.
We applied two well‐known ICA algorithms, one based on maximization of information transfer of a nonlinear network to achieve statistical independence of its outputs, i.e., Infomax [Bell and Sejnowski, 1995], and the other based on maximization of non‐Gaussian distribution from a linear decomposition, i.e., FastICA [Hyvarinen and Oja, 2000]. Because of the sign ambiguity of the ICA decomposition, the polarity of each map was assigned such that the positive part accounts for greater data variability, as measured by the sum of squares, than the negative part.
Because both the Infomax and FastICA algorithms perform iterative optimizations of nonlinear objective functions, the solution at convergence is dependent upon the initial point. To mitigate the effect of initialization condition on the final ICA solution, we ran 30 Monte Carlo trials on each algorithm with a randomized initial point in each trial. The estimated microstructural correlation maps from all trials were clustered with a hierarchical clustering algorithm [Himberg et al., 2004] to find stable independent component estimates, i.e., the component estimates that are the most similar across the different Monte Carlo trials. The similarity between any two component estimates, A and B, was measured by the ratio of shared suprathreshold voxels calculated by Eq. (2)
| (2) |
where V(A) and V(B) are, respectively, the number of suprathreshold voxels in components A and B, and V(A ∩ B) is the number of suprathreshold voxels overlapping in A and B.
A representative component was obtained by taking the voxel‐wise average over all components in each cluster and is reported in the Results as the estimated independent component spatial map. The voxel values in each representative component map were converted into Z‐scores, i.e., the number of standard deviations, and only those voxels exceeding a threshold of Z = 2.5 are color‐mapped to the “red‐yellow” color scheme and displayed on the MNI152 T1‐weighted template. Although there are statistical models to threshold the ICA spatial maps [Beckmann and Smith, 2004], the method doesn't apply to the current case because (i) the ICA maps are averaged within each component cluster from the 30 randomized ICA trials, and (ii) the statistical distribution of the FA correlations has not been previously studied. Hence, in this work, the Z‐score threshold is set empirically based on the visibility of the tract segments.
The anatomic locations of the white matter regions corresponding to suprathreshold voxels with the highest Z‐scores were determined by reference to the Johns Hopkins University (JHU) ICBM‐DTI‐81 white‐matter labeled atlas and the JHU white‐matter tractography atlas [Mori et al., 2005, 2008], both available for MNI152 space in FSL. All white matter region identifications were verified by a board‐certified neuroradiologist with over a decade of experience in clinical and research applications of DTI.
Comparison of Different Data Processing Options
We studied the effect of different processing options on the ICA estimation of microstructural correlation maps. The processing options include: (1) spatial normalization of all subject FA images in TBSS based on the FMRIB58 FA template (the default option) or the most representative subject FA image (i.e., the minimum deformation template); (2) spatial smoothing of FA skeleton maps using a Gaussian kernel of 9 mm FWHM (default option) or performing ICA without spatial smoothing; (3) removing the global mean FA over subjects, i.e., m 1 in Eq. (2), at each voxel and the global mean FA over all voxels for each subject, i.e., m 2 in Eq. (2), (default) or removing only the global mean FA over all voxels from the dataset; (4) two different ICA algorithms: FastICA (default) or Infomax. We take the default processing options and compare the ICA estimation results by changing one of the processing options at a time for each comparison.
Two important quality assurance (QA) metrics were calculated for each independent component. The first is the reproducibility (Rep) of the IC, which denotes the number of times the component map was estimated and clustered together by the hierarchical clustering algorithm out of 30 Monte Carlo ICA trials with random initialization. Higher numbers mean greater algorithmic reproducibility of the IC, with 100% meaning that the IC is stably reproduced in all 30 trials regardless of the initial conditions of the ICA algorithm. The second metric is the percentage of explained variance (PEV), which is the proportion of the total data variance accounted for by a single IC, with greater values signifying a higher signal power of the corresponding IC. These two metrics are commonly used in the resting state functional MRI (fMRI) literature, and in widely used software such as MELODIC [Beckmann and Smith, 2004] and ICASSO [Himberg et al., 2004], to characterize the results of ICA in defining intrinsically connected cortical networks (ICNs).
RESULTS
Structural MR images of all subjects were interpreted by a board‐certified neuroradiologist as being free of any morphological abnormalities of the brain. DTI images were of good quality in all 53 subjects without significant motion or other image artifacts.
Twenty‐five independent components (ICs) were computed using the default settings of DTI preprocessing and ICA estimation documented in the Methods. One of these ICs was a “wastebasket” component consisting of all the individual Monte Carlo trials that could not be grouped into one of the other ICs by the automated template matching procedure; this wastebasket IC was not further studied. To determine if there were objective relationships between the remaining 24 ICs, the correlation matrix of their subject loadings was computed. However, data‐driven hierarchical clustering of this correlation matrix using the methods of Wahl et al. [2010] did not reveal plausible groupings. Therefore, these 24 ICs were subjectively assigned to seven distinct classes based on the dominant anatomic feature(s) of each thresholded IC spatial map, as summarized in Table I. Figures 2 to 8 show the spatial maps for Classes I–VII, respectively. For Classes I–V, which are comprised of IC spatial maps containing anatomically recognizable white matter tracts, the categorization was based on widely accepted descriptive criteria for white matter, such as location (supratentorial, thalamic, cerebellar, etc.), phylogeny (neocortical versus limbic), and pattern of fiber connectivity (“association” refers to intrahemispheric cortico‐cortical fibers, “commissural” to interhemispheric cortico‐cortical fibers and “projection” to cortical–subcortical fibers). Each IC map was assigned an index number by the hierarchical clustering algorithm, i.e., IC1 through IC25, where IC25 is the wastebasket component, and we used these index numbers in the Figures and the text solely for convenience of reference. The reproducibility index (Rep) and the PEV for each of the 24 meaningful ICs are also provided in Figures 2, 3, 4, 5, 6, 7, 8.
Table I.
List of the dominant features (i.e., regions of strongest microstructural correlation) of the independent component (IC) spatial maps, categorized by type of white matter (association, projection, commissural) and anatomic location (supratentorial, limbic, etc.)
| Group | White matter structures and their independent component (IC) index |
|---|---|
| I. Commissural tracts | Anterior commissure (IC2), Genu and anterior body of the corpus callosum (IC14), Posterior body of the corpus callosum (IC6), Splenium of the corpus callosum (IC20). |
| II. Projection tracts | Corticospinal tracts at motor cortex (IC9), Posterior thalamic radiations (IC3), Optic radiations (IC13). |
| III. Neocortical association tracts | Posterior parietal superior longitudinal fasciculi (IC10), Mid‐parietal superior longitudinal fasciculi (IC18), Central (frontoparietal) superior longitudinal fasciculi (IC15), Left superior longitudinal fasciculus and superior corona radiata (IC4), Right superior longitudinal fasciculus and superior corona radiata (IC16, IC24). |
| IV. Limbic association tracts | Dorsal posterior cingulum (IC19), Right ventral cingulum and hippocampus (IC11), Left ventral cingulum and hippocampus, anterior limbs of the internal capsule and external capsules (IC8). |
| V. Thalamus, brainstem, and cerebellum | Superior vermis of the cerebellum (IC1), Vermis of cerebellum (IC23), Deep white matter of the cerebellar hemispheres (IC12), Superior cerebellar peduncles, lower midbrain, and pons (IC7), Dorsal thalami, upper midbrain, and posterior fornices (IC5). |
| VI. Asymmetric, nonlocalized white matter | IC21 and IC22 |
| VII. Image artifacts | IC17 |
Tract and/or regional localization of each dominant feature was made by reference to the Johns Hopkins University (JHU) ICBM‐DTI‐81 white‐matter labeled atlas and the JHU white‐matter tractography atlas, both in MNI152 space.
Figure 2.
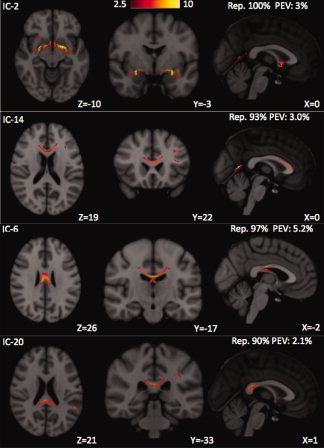
Four independent component (IC) spatial maps in which the dominant feature of each corresponds to a supratentorial commissural white matter tract, defined as Class I. From top to bottom: The strongest correlations of IC2 are in voxels of the anterior commissure and its bilateral temporal lobe projections, with suprathreshold voxels ranging from 2.5 up to 10 standard deviations above the mean, as shown on the colorbar. The strongest correlations of IC14 are in voxels of the genu and anterior body of the corpus callosum and its bilateral frontal lobe projections in the forceps minor. IC6 contains the posterior body of corpus callosum and has the highest percentage explained variance (PEV) of these four independent components. IC20 corresponds to the splenium of the corpus callosum and its bilateral occipital lobe projections in the forceps major, but has a lower PEV than the other three components. Note that all four components of Class I are highly reproducible, with 90% or greater reproducibility index (Rep.) across 30 Monte Carlo trials.
Figure 8.

The IC17 spatial pattern, displayed on the FMRIB58 FA template, reflects locations where image artifacts arise that cause template registration errors. These artifacts stem from such factors as susceptibility‐induced geometric distortion and from motion due to cerebrospinal fluid pulsatility, and occur preferentially at the skull base and posterior fossa. Therefore, IC17 is felt to represent global noise, and its segregation into a separate IC is an example of the “denoising” property of ICA. Unlike any of the other ICs, the PEV of IC17 is strongly suppressed by removal of the global spatial variation, dropping from 53.0% (i.e., over half of the total data variance) to only 4.7%.
Figure 3.

Three IC spatial maps in which supratentorial projection tracts are dominant, defined as Class II. The strongest correlations in IC9 are in voxels of the corticospinal tracts bilaterally near the upper part of the motor cortex. The main characteristics of IC3 are the retrolenticular segments of the internal capsules, which contain projection tracts of the posterior thalamic radiations such as the somatosensory radiations. IC13 corresponds to the optic radiations. The first three components of Class II are highly stable, but IC13 has an intermediate reproducibility index of 77%. Note that, although all three components show substantial bilateral symmetry, the degree of symmetry is less than for the four components of Class I.
Figure 4.
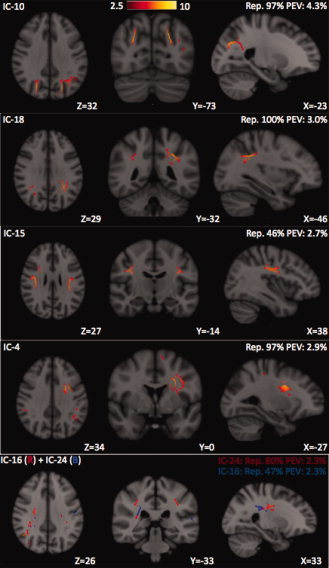
Six IC spatial maps (the last two ICs are overlaid on one map due to their overlapping) that contain a high proportion of neocortical association white matter, defined as Class III. IC10 and IC18 both include subcortical white matter of the bilateral parietal and occipital lobes. IC10, IC18, and IC15 consist largely of the central and posterior aspects of the superior longitudinal fasciculi. IC10 and IC18 are highly stable, but IC15 has a relatively low reproducibility index of 47% as well as a lower PEV than the other two ICs. IC4 shows FA correlations of the left SLF, an association tract, and the left superior corona radiata (SCR), a projection tract. IC16 and IC24 share common and neighboring regions of the right SLF and right SCR, which may be attributed to splitting of a single component in lower‐dimensional ICA estimation. ICs 4, 16, and 24 of Class III show much stronger hemispheric laterality than those of Classes I or II, or even ICs 10, 15, and 18 of Class III.
Figure 5.

Class IV: three IC spatial maps with suprathreshold FA correlations within association tracts of the limbic system. IC19 includes the dorsal cingulum bundles at the bilateral posterior cingulate gyri, left greater than right. IC11 includes the ventral cingulum bundles at the parahippocampal gyri, with a right‐sided predominance. IC8 includes the ventral cingulum bundles at the parahippocampal gyri, with a left‐side predominance.
Figure 6.

Five IC spatial maps principally consisting of white matter in the thalami, brainstem, and cerebellum, defined as Class V. IC1 is comprised of white matter in the superior vermis of the cerebellar hemispheres bilaterally. IC23 includes the posterior part of the bilateral cerebellar vermis and anterior fornices. IC12 includes the deep white matter of the cerebellar hemispheres bilaterally. The strongest FA correlations of IC7 are in voxels of the superior cerebellar peduncles bilaterally, especially at their decussation in the posterior midbrain. IC5 consists of white matter in the dorsal thalami and upper midbrain bilaterally, as well as the posterior fornices, with a left‐sided predominance.
Figure 7.

Two IC spatial maps with nonlocalized and bilaterally asymmetric patterns of microstructural correlations, defined as Class VI. These heterogeneous IC maps are not easily assigned into Classes I–V. One of these independent components is very stable, while the other demonstrates intermediate to low reproducibility.
Supratentorial Commissural Tracts (Class I)
Four IC maps in which the dominant features correspond to supratentorial commissural tracts are collected as the first class (see Fig. 2). These commissural tracts are the genu and anterior body (IC14), posterior body (IC6), and splenium (IC20) of the corpus callosum, as well as the anterior commissure (IC2). All four IC maps have high reproducibility indices of 90% or greater. IC6, which shows high Z‐scores in voxels of the posterior body of the corpus callosum, accounts for 5.2% of the data variance without the global signals. The remaining ICs of Class I have somewhat lower PEV values, ranging from 2.1% to 3.0%.
Supratentorial Projection Tracts (Class II)
The second class (see Fig. 3) contains three IC maps in which the highest Z‐scores fall within homologous pairs of supratentorial projection tracts in the left and right cerebral hemispheres. These consist of bilateral high motor projection fibers (IC9), the posterior thalamic radiations in the retrolenticular limbs of both internal capsules (IC3), and the bilateral optic radiations (IC13). As is the case for Class I, the IC spatial maps of Class II show considerable bilateral symmetry. However, since the strongest microstructural correlations of Class II correspond to projection tracts rather than commissural tracts, this bilateral symmetry is manifested as combining anatomically separate but homologous tracts of the left and right cerebral hemispheres, which is not seen with Class I.
Neocortical Association Tracts (Class III)
The third class (see Fig. 4) contains six IC maps that are dominated by homologous pairs of neocortical association fiber pathways of the left and right cerebral hemispheres. The bilateral superior longitudinal fasciculi (SLFs) are split segmentally along the anteroposterior axis into at least three independent components. These include the most posterior segments of the SLFs within the parietal lobes in IC10 and more centrally located frontoparietal SLF fibers in IC15, with IC18 containing parietal SLF fibers interposed between those of IC10 and IC15. While these three ICs share the bilateral symmetry of Classes I and II, the remaining three ICs of Class III demonstrate greater hemispheric lateralization. IC4 contains predominantly left‐sided SLF association fibers and superior corona radiata (SCR) projection fibers. Like IC4, IC16, and IC24 also contain regions of the SLF and SCR; however, both are predominantly right lateralized instead of left lateralized. IC16 and IC24 share many adjacent and overlapping voxels; hence, they may represent the splitting of a single IC into two, as occurs when the dimension of ICA parcellation increases [Kiviniemi et al., 2009; Smith et al., 2009]. This may account for why IC16 and IC24 both have lower PEV values than the other IC spatial maps of Class III.
Limbic Association Tracts (Class IV)
Figure 5 shows three IC spatial maps with the strongest FA correlations found within limbic association tracts, specifically the cingulum bundle and the fimbria/fornix. The highest Z‐scores of IC11 are in the ventral cingulum bundles within the bilateral parahippocampal gyri and, to a lesser extent, the fimbria/fornix at the hippocampus, both with a right‐sided predominance. IC8 also has its highest Z‐scores within the bilateral ventral cingulum bundles, but with a left‐sided predominance. IC19 includes the dorsal cingulum bundles at the posterior cingulate gyri, with higher Z‐scores on the left than right. All three of these IC spatial maps containing limbic tracts have good reproducibility, but less bilateral symmetry than those of Classes I or II.
Thalamus, Brainstem, and Cerebellum (Class V)
The fifth group of IC spatial maps (see Fig. 6) are marked by maximal white matter FA correlations in the thalamus, brainstem, and/or cerebellum. IC1, which is comprised of white matter in the superior vermis of the cerebellum bilaterally, has exceptionally high Z‐scores. IC23 includes the posterior part of the cerebellar vermis bilaterally as well as the anterior bodies of the fornix bilaterally. IC12 contains the central white matter of the vermis at the midline and extends to the deep white matter of the cerebellar hemispheres bilaterally. The peak Z‐scores of IC7 are in voxels of the superior cerebellar peduncles bilaterally, especially at their decussation in the posterior midbrain, and also include dorsal tracts of the midbrain and upper pons. IC5 consists of white matter in the dorsal thalami and upper midbrain, with a left‐sided predominance. IC1, IC5, and IC12 are highly reproducible, but IC7 has intermediate reproducibility, and IC23 is unstable. Like Classes I and II, there is strong bilateral symmetry of Class V except for IC5.
Nonlocalized White Matter (Class VI)
The sixth class (see Fig. 7) consists of two IC spatial maps showing bilaterally asymmetric and nonlocalized patterns. These IC maps appear to lack a dominant anatomic feature unlike the ICs in Classes I–V. IC21 has perfect reproducibility but one of the lowest PEV values of the 24 IC spatial maps. IC22 has relatively low reproducibility but an average PEV value.
Image Artifacts and Registration Errors (Class VII)
The final class (see Fig. 8) has only a single IC map that is predominantly comprised of locations at the skull base and the posterior fossa where DTI artifacts are known to occur such as from susceptibility‐induced geometric distortion and from motion due to cerebrospinal fluid pulsatility, both of which may produce errors in spatial normalization to the registration target. Therefore, IC17 may reflect spatial FA variation over all of the subjects that is due to image artifacts and template registration errors. This component has perfect reproducibility and accounts for a relatively high percentage of data variance at PEV = 4.7%, likely reflecting residual artifacts and registration errors after global signal removal. However, without removal of the global spatial variation, the PEV of this component rises to 53.0%, representing the majority of the total FA variance.
Composite Map of Independent Components in Classes I–V
There are a total of 21 IC spatial maps that contain anatomically recognizable white matter tracts and these are categorized into Classes I–V. They are presented together in the color‐coded composite map of Figure 9. The total number of voxels in the union of these 21 supra‐threshold ICs (at Z > 2.5) is 65,742, whereas the total number of voxels on the whole‐brain FA skeleton is 137,832. Therefore, the ratio of coverage by these 21 components with anatomically recognizable white matter tracts is ∼48% at the statistical threshold chosen. We note that coverage of large central white matter tracts such as the corpus callosum and optic radiations is greater than for small peripheral U‐fibers. Interestingly, coverage of the prefrontal and temporal regions was less than in other areas of the cerebral hemispheres.
Figure 9.

Composite color‐coded map of the 21 ICs that contain anatomically recognizable white matter tracts (Classes I–V). The union of these 21 IC spatial maps covers 48% of all of the voxels in the whole‐brain white matter FA skeleton.
To determine if the mixed sample of right‐ and left‐handers affected the resulting IC spatial maps, we performed a new analysis based on only the 44 right‐handed subjects in the cohort. The resulting components from 44 right‐handed subjects were very similar to the components from the total of 53 subjects, but with lower reproducibility, likely due to the decrease in sample size. Therefore, the inclusion of nine left‐handers did not significantly alter the IC spatial maps that were found.
FastICA vs. Infomax for Analysis of Microstructural Correlations
The two most widely used ICA algorithms, FastICA and Infomax, were compared for their effect on the IC spatial maps of multivariate FA correlations. The average reproducibility of the 24 meaningful IC maps (excluding IC25) was 84% ± 20% for FastICA and 80% ± 23% for Infomax. This result means that FastICA produced slightly more stable IC estimates than Infomax from the 30 Monte Carlo trials; therefore, FastICA was chosen as the default processing option, although the results were substantially similar with Infomax. The regions of strongest microstructural correlations in each IC were very similar for both algorithms, as illustrated in Figure 10 for the IC spatial map with the splenium of the corpus callosum as the dominant feature. Therefore, the same subjective categorization of the 24 meaningful ICs into 7 distinct classes shown in Figures 2, 3, 4, 5, 6, 7, 8 for FastICA could also be performed with the results from Infomax. However, there was a single IC spatial map in both the FastICA and the Infomax estimates that had no clear counterpart in the other, as displayed in Figure 11. The FastICA component shows FA correlations at the SLFs while Infomax estimates FA correlations at the temporal stems, including the bilateral inferior longitudinal fasciculi (ILFs), inferior fronto‐occipital fasciculi (IFOs), and uncinate fasciculi (UF). The reproducibility of both of these ICs is relatively low compared with components estimated similarly by both algorithms.
Figure 10.
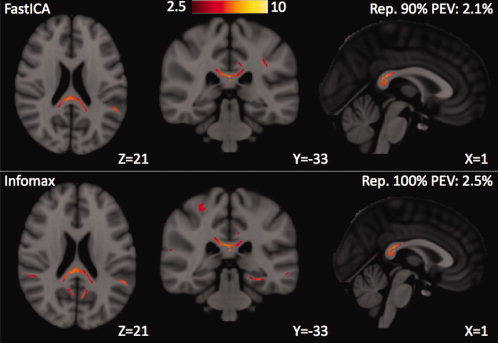
An IC spatial map estimated using (top) FastICA and (bottom) Infomax. Most IC maps were very similar between the two ICA algorithms. For this particular IC, the reproducibility and the PEV were both slightly better with Infomax. However, across all the IC maps, the performance of FastICA slightly exceeded that of Infomax in terms of reproducibility of the ICs.
Figure 11.
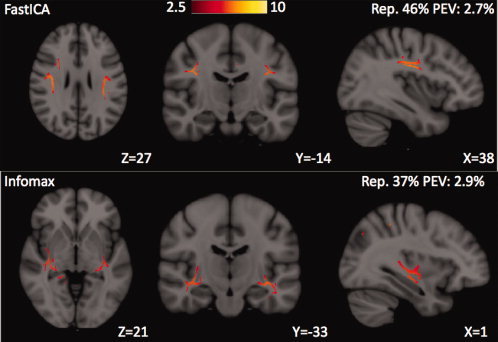
IC15 (top) was produced by FastICA but not by Infomax. In this IC, the suprathreshold FA correlations are in the bilateral SLFs. The single IC spatial map (bottom) that was estimated with Infomax but was not seen using FastICA. In this IC, the peak FA correlations are in the temporal stems bilaterally and correspond to locations of the inferior longitudinal fasciculi, inferior fronto‐occipital fasciculi, and uncinate fasciculi. It can be observed that these two ICs both have low reproducibility, which may help explain why neither was found with both ICA algorithms.
Effect of Model Order and of Spatial Smoothing on ICA of DTI
The dimension of the ICA decomposition affects the accuracy and stability of the results. The issue of dimension reduction has been studied in the fMRI literature [Li et al., 2007] using information theoretic criteria to select the optimum order of the ICA decomposition. When we applied the same method to the group FA skeletons, the order selection criteria always saturated on the full dimension of the data, indicating that the true model order of the data exceeds the maximum order of 53 that can be estimated from a sample size of 53 subjects. Figure 12 shows plots of the eigenvalue spectra from PCA of three cases: (1) data preprocessed under the default settings, (2) data without removal of global signals, and (3) data without spatial smoothing by the Gaussian kernel. For the case of no smoothing, the last eigenvalue is zero, indicating that the FA data matrix becomes rank reduced due to the removal of the global mean FA map over subjects. At the default preprocessing settings, almost three‐fourths of the data variance is kept for K = 25: 0.0272/(0.0272 + 0.0093) = 74.5% (from data in Table II). It is then straightforward to calculate the average PEV of estimated ICs at the reduced dimension of K = 25: 74.5%/25 = 2.98%. We can also calculate the average PEV of estimated ICs at the full dimension of K = 53: 100%/53 = 1.89%. Hence, dimension reduction helps to improve the PEV of the estimated ICs, as would be expected for a signal with a large mean. We compared the ICA estimation at model order 25 to model order 53 and found that the full model order produced comparable spatial IC maps to the reduced model order. However, the full dimensional analysis did not yield any additional independent components with anatomically plausible white matter tracts showing suprathreshold Z‐scores for microstructural correlation beyond those of the dimensionally reduced analysis. Moreover, the “elbow” in Figure 12 shows that a K value of ∼25 retains most of the data variance with little additional benefit of greater dimensionality. Therefore, dimension reduction to K = 25 was selected as the default.
Figure 12.

Eigenvalue spectrum of the group FA skeleton datasets with (a) default preprocessing, (b) without global signal removal, and (c) without spatial smoothing. For the default settings, the variance of the data drops steeply up to approximately order K = 5 and then levels off after K = 25. Therefore, we opt to reduce the dimension of the data to K = 25, so that the major portion of the data variance is maintained for ICA estimation in as few components as possible. [Color figure can be viewed in the online issue, which is available at wileyonlinelibrary.com.]
Table II.
Quality of estimated independent component maps with different preprocessing options
| Baseline FA | Global subject FA variance | Global spatial FA variance | Total signal variance (25 ICs) | Total noise variance | SNR (variance of 25 ICs/ variance of noise) | |
|---|---|---|---|---|---|---|
| Default settingsa | 0.4377 | 0.0002 | 0.0142 | 0.0272 | 0.0093 | 2.92 |
| Spatial smoothing by 5 mm filter | 0.4336 | 0.0002 | 0.0470 | 0.0569 | 0.0299 | 1.90 |
| No spatial smoothing | 0.4377 | 0.0002 | 0.0558 | 0.1671 | 0.1246 | 1.34 |
| Spatial normalization by minimum deformable subject | 0.4640 | 0.0002 | 0.0109 | 0.0412 | 0.0182 | 2.26 |
The default settings consist of spatial normalization using the FMRIB58 template in TBSS as well as spatial smoothing using a 9‐mm FWHM Gaussian filter (see Materials and Methods for details).
For a better understanding of the optimal level of spatial smoothing, we performed a new analysis using a filter size of FWHM = 5 mm and compared the data SNR and the average PEV of the resulting independent components to those with FWHM = 0 mm (no smoothing) and 9 mm. As expected, the SNR improved as smoothness increased, from 1.34 at 0 mm to 1.90 at 5 mm to 2.92 at 9 mm (Table II). As smoothness increased, we also observed an increase in the average IC PEV, from 2.3% at 0 mm to 2.6% at 5 mm to 3.0% at 9 mm. Empirically, the visualization of anatomically recognizable white matter tracts also improved with increasing smoothness. Although even greater degrees of spatial smoothing might have further improved these QA metrics, the resulting loss of spatial resolution was not considered desirable. Therefore, FWHM = 9 mm is used as our default smoothing kernel size.
DISCUSSION
Mapping Multivariate Microstructural Correlations of White Matter
In this work, we show that multivariate correlations of scalar DTI parameters such as FA can be used to parcellate white matter into relatively independent tracts, tract segments, and groups of tracts in the normal human brain. Using ICA, we demonstrate that it is feasible to detect microstructural correlations at the voxel level throughout the entire brain, and also that the white matter of the entire brain can thereby be decomposed at the voxel scale with this unsupervised learning algorithm into distinct microstructurally correlated spatial maps, the majority of which contain anatomically recognizable white matter tracts as their dominant features. A unique aspect of this parcellation is that it only requires scalar DTI parametric maps but no knowledge of connectivity. Hence, this decomposition based on microstructural correlations differs fundamentally from prior approaches to segmenting white matter using DTI or more complex diffusion models such as q‐ball imaging [Tuch et al., 2004], diffusion spectrum imaging [Wedeen et al., 2005], or hybrid diffusion imaging [Wu and Alexander, 2007]. Existing diffusion‐based white matter parcellation methods are all based on fiber orientation data and are usually implemented with fiber tracking methods [Conturo et al., 1999; Mori et al., 1999; Wedeen et al., 2005]. Instead of being defined purely by structural connectivity within an individual brain or a group‐averaged brain as in prior diffusion MR imaging studies, the microstructurally correlated regions revealed herein represent novel features of human brain white matter organization in which FA values are maximally correlated across individuals within each IC and maximally independent between different ICs.
Relationship to Prior Studies of White Matter Microstructural Correlations
Three recent studies have demonstrated correlations of DTI parameters such as FA across white matter tracts in the normal human brain. Wahl et al. [2010] used quantitative DTI tractography of healthy adult volunteers performed in the subjects' native space to show that specific patterns of microstructural correlation exist that appear to reflect phylogenetic and functional similarities between white matter tracts, as categorized by a hierarchical clustering analysis of the inter‐tract FA correlation matrix. All of the calculated pairwise correlation coefficients for DTI parameters between tracts were positive, indicating a globally shared variance among all tracts. However, there were also large variations in the strength of correlation, with more functionally related tracts showing higher correlation than less similar tracts.
Westlye et al. [2010] examined a large cohort of normal volunteers ages 8 to 89 years and also reported correlations of DTI parameters measured over whole tracts, but used a template‐based approach to quantify tracts after spatial normalization of all subjects to a common atlas space in TBSS. The inter‐tract correlation coefficients from this latter study were generally larger than those of Wahl et al. [ 2010], and the authors concluded that DTI parameters showed strong global correlations across all white matter tracts, but relatively little regional specificity. The difference in results and conclusions between the two studies can be attributed to the fact that Westlye et al., [ 2010] designed their investigation to examine age‐related trends in DTI parameters across the entire human lifespan, rather than to investigate microstructural correlations among white matter tracts. Therefore, the results of their correlational analysis are strongly confounded by the effects of age, which would produce strong global correlations among all tracts due to their joint maturational changes and their joint senescent changes. The subjects of Wahl et al. [ 2010] were of mean age 30.8 ± 7.8 years, at or near the plateau of age‐related changes in DTI parameters, thereby minimizing the effect of age on the observed microstructural correlations. The same group of 44 subjects, with the addition of nine more participants of the same age range, was used in the present study to also control for the effects of age.
The even more recent work of Penke et al. [2010] in 132 healthy older subjects with a very narrow age range (72 ± 0.4 years) used PCA of quantitative DTI tractography in selected supratentorial association and commissural white matter pathways to calculate the percentage of FA variance that is globally shared across the examined tracts. This shared factor of 40% was considerable and showed a statistically significant correlation with cognitive processing speed, yet it still represented only a minority of the total FA variance. Furthermore, the percentage of FA variance that is globally shared would likely have been even lower if all of the brain's white matter had been analyzed, including tracts that are more dissimilar to the examined supratentorial association and commissural tracts, such as projection pathways and infratentorial white matter.
In this study, as in the previous work of Wahl et al. [2010], we investigate the proportion of FA variance that is regionally specific. We extend this prior work in three important ways. First, we apply independent component analysis, a multivariate technique capable of identifying correlated clusters of arbitrarily large size, rather than a univariate measure examining only pairwise correlations as used in the prior study. Second, we greatly increase spatial specificity by analyzing correlations at the voxel scale rather than over whole tracts. Third, we broaden the study from a dozen selected fiber pathways to include all of the white matter of the brain.
ICA has been used previously in the diffusion MRI literature on a single‐subject basis for denoising and artifact reduction in diffusion‐weighted images [Arfanakis et al., 2002] and for recovering multiple intravoxel fibers in diffusion tractography applications [Singh and Wong, 2008]. Very recently, Groves et al. [ 2011] used a novel “linked ICA” approach, adapted to handle multiple imaging modalities, to perform joint decomposition of structural MRI and DTI parameter maps. The application of the new linked ICA method presented in this work was to a cohort of Alzheimer disease patients and an age‐matched group of older controls. Most of the results were targeted toward gray matter macrostructural and white matter microstructural features that show significant association with age and Alzheimer pathology. However, in Figure 12 of their paper, they do show a component in the MD and FA maps, after skeletonization in TBSS, that corresponds to the bilateral external/extreme capsules. They also mention, in passing, that this is one of several components in their data that correspond to bilateral white matter tracts. It is possible that these components may be similar to those we have reported in this study, albeit in a much older population. However, without more detail about this finding in the Groves et al. [ 2011] paper, it remains uncertain whether their results could corroborate the ones presented herein. The novel linked ICA method they propose may be a powerful technique for studying multivariate microstructural correlations jointly across multiple DTI parameters, including FA, MD, AD, and RD, which may yield richer features than ones derived solely from FA maps.
What is the Biological Basis for White Matter Microstructural Correlations?
The existence of multiple separable spatial maps of correlated white matter microstructure in the normal human brain raises the question of what are the factors responsible for the characteristics of these independent components. Multivariate FA correlations are undoubtedly influenced by anatomical connectivity patterns, since the microstructural properties of white matter within a single fiber tract would tend to be conserved across different individuals, whereas those of adjacent white matter regions belonging to different axonal pathways might not co‐vary as strongly across subjects. Biological forces that may drive inter‐subject differences in white matter FA values such as genetic variation and experience‐dependent neuroplasticity would be expected to act at the fiber level and not on individual voxels. This should explain why the strongest correlations within many of the independent component spatial maps localize to large segments of anatomically well‐defined tracts rather than patchy clusters of voxels that do not delineate known fiber pathways. Conversely, voxels belonging to different tracts might be expected to show lower levels of microstructural correlation than those within a tract; hence, different fiber pathways tend to belong to different IC spatial maps. Indeed, this separability allowed a subjective categorization of many of the IC spatial maps into those in which the strongest correlations embody segments of supratentorial commissural tracts (Class I), projection tracts (Class II), or association tracts (Classes III and IV). Thus, differences in the pattern of connectivity, whether interhemispheric, intrahemispheric, or cortical–subcortical, appear to be reflected in microstructural correlations across individuals.
The infratentorial white matter of Class V could not be as easily parcellated into distinct tracts or tract segments, likely because of the small size of brainstem and cerebellar pathways, worse DTI image artifacts in the posterior fossa such as magnetic field susceptibility and physiologic motion, as well as increased template registration errors. This may be improved upon in future studies through the use of DTI acquisition methods that are less sensitive to motion, to susceptibility‐induced warping, and that have better spatial resolution and anatomic fidelity [Gui et al., 2008; Tamhane and Arfanakis, 2009].
Another factor that seems to govern voxel‐level microstructural correlations is functional relatedness. This is evident from the exceptions to the general rule that voxels within tracts tend to be more highly correlated than voxels in different tracts. For example, the corpus callosum may be considered to be a single commissural tract, albeit by far the largest one in the human brain. However, the ICA algorithm performs an unsupervised segmentation of the corpus callosum into three distinct parts: the genu and anterior body of the corpus callosum (IC14), the posterior body of the corpus callosum (IC6), and the splenium of the corpus callosum (IC20). These three segments of the corpus callosum are well known to be functionally dissimilar, as the genu connects left and right prefrontal cortex, whereas much of the posterior body connects left and right primary motor and somatosensory regions, and the splenium joins left and right visual areas [Hofer and Frahm, 2006; Wahl et al., 2009]. There are also histological differences in these separate parts of the corpus callosum, such as in axon diameter and degree of myelination [Aboitiz et al., 1992], that are related to these differences in function. Another example of functional similarity driving microstructural correlations can be seen from the bilateral symmetry of most of the IC spatial maps, likely a manifestation of the homotopic organization of commissural white matter in the normal human brain (seen in the component maps of Class I) as well as of the functional relatedness of bilateral pairs of projection tracts (Class II) and association tracts (Classes III and IV). This latter result is in agreement with the findings of Wahl et al. [ 2010] who reported generally stronger tract‐level microstructural FA correlations between homologous pairs of association and projection tracts than between non‐homologous pairs.
Progress in defining the biological basis for DTI metrics such as FA in animal models [Beaulieu, 2002; Drobyshevsky et al., 2005; Song et al., 2002] will inform future investigations of the underlying factors affecting white matter microstructural correlations. Imaging genetics studies in humans are beginning to reveal the influence of specific DNA polymorphisms or of heredity on white matter microstructure [Chiang et al., 2009; McIntosh et al., 2008; Nierenberg et al., 2005] and these could be extended to the study of microstructural correlations. The recent exciting discovery that cognitive or motor training can alter white matter FA in a spatially localized manner over relatively short time intervals [Scholz et al., 2009; Keller and Just, 2009] supports the hypothesis that experience‐dependent neuroplasticity may be a strong driver of microstructurally correlated white matter networks. More generally, long‐term repetitive activation of intrinsically connected cortical and subcortical networks [Biswal et al., 1995; Fox et al., 2005; Greicius et al., 2003] subserving both task‐related cognition and behavior as well as resting state activity [Smith et al., 2009] may induce microstructural changes specific to the axonal fibers interconnecting those cortical/subcortical areas. Inter‐individual variation in this network‐based activity may thereby cause microstructural correlations across subjects in spatially disparate white matter regions.
Dimension Reduction in ICA of Voxel‐Wise DTI
The major limitation to computing voxel‐level microstructural correlations from whole‐brain DTI is the very high dimensionality of the estimation problem. We used multiple dimension reduction techniques to overcome this obstacle. First, the TBSS skeletonization process reduces the number of voxels by collapsing the cross‐section of the tracts to the center, where FA can be calculated most reliably given the limited spatial resolution of the imaging acquisition and where the tracts may be most consistently coregistered across subjects given individual variation in white matter anatomy [Smith et al., 2006]. This step has the added benefit of avoiding the confounds related to partial volume averaging (from preregistration smoothing) and to poor image registration that have plagued earlier types of voxel‐based DTI analysis.
Second, we applied spatial smoothing to the tract skeleton to further reduce dimensionality and improve SNR by more than twofold (Table II). Smoothing improved the reproducibility of the IC estimates, increased their PEV values, and permitted better identification of anatomically plausible white matter tracts in the IC spatial maps. It is important to note that smoothing was performed after group registration to the atlas space and was strictly confined to the FA skeleton; hence, it cannot interfere with spatial normalization and no partial volume effects arise from inclusion of tissue that is not white matter.
Finally, a third dimension reduction step was undertaken with PCA. Information theoretic analysis of the eigenspectrum [Li et al., 2007] of the smoothed whole‐brain FA skeletons for the entire group indicated that the dimensionality of the dataset saturates at the maximum order that could be estimated from the 53 subjects available. In our sample, we empirically chose K = 25 as the order of the ICA decomposition because the eigenspectrum leveled off after K = 25 (see Fig. 12), preserving 74.5% of the total variance of the group DTI data (Table II). Therefore K = 25 had a higher average PEV per IC than the maximum possible order of K = 53. The IC spatial maps found at K = 25 were also present at the full model order, although some tracts such as the cingulate bundle and the SLF were split across more components. No additional anatomically recognizable white matter tracts were seen at the full dimensional analysis, compared to the reduced dimension. This indicates that, for the acquisition and postprocessing parameters used in this study, the results are not greatly sensitive to dimensionality at or above K = 25.
Although the dimension reduction steps of tract skeletonization, spatial smoothing, and PCA order truncation were necessary to produce stable estimates of microstructurally correlated white matter regions with the modest sample size available, they also limit the results in several ways. The process of tract skeletonization discards voxels at the periphery of white matter tracts, constraining the evaluation to tract centers. However, acquisition methods with better DTI anatomic fidelity and spatial resolution as well as better image registration methods would need to be developed to perform accurate voxel‐wise group analysis of entire tracts. There is not yet any widely adopted voxel‐based DTI analysis method that is generally considered to be superior to TBSS. It has recently been shown that TBSS skeletonization introduces rotational dependence because the number of voxels within each tract skeleton can vary by as much as a factor of √3 depending on the orientation of the tract relative to the rectilinear voxel grid [Edden and Jones, 2010]. This rotational nonstationarity can bias statistical inferences from TBSS. For the present study, this means that statistically significant microstructural correlations might be more difficult to identify in tracts with certain orientations. Also, the precise values of the Z‐scores in tracts that do show suprathreshold correlations might be affected by rotational bias. However, the spatial smoothing we applied to the entire FA skeleton helps to compensate for orientation‐dependent variations in tract skeleton thickness by imposing a uniform spatial scale for the independent component analysis that is much larger than the skeleton thickness. This might be an additional mechanism by which smoothing improved the detection of FA correlations. Furthermore, suprathreshold microstructural correlations were found in tracts throughout the brain with a variety of different orientations, including commissural, association, and projection tracts, indicating that the strength of these correlations is greater than the effects of any residual rotational nonstationarity after smoothing. Finally, the purpose of this initial survey of voxel‐level microstructural correlations in the human brain was to establish the feasibility of mapping these correlations with ICA, rather than to calculate the exact Z‐scores in each IC spatial map. The correlation strengths are affected by many other factors such as image quality, the accuracy of spatial normalization and the degree of smoothing. Future larger‐scale investigations using DTI acquisitions with better spatial resolution and anatomic fidelity as well as more advanced voxel‐based DTI normalization methods would be able to better define the exact strength of microstructural correlations throughout the brain.
Despite the many beneficial effects of the post‐skeletonization spatial smoothing, the process does blur microstructural correlations at small spatial scales. Higher‐order ICA might detect additional correlated white matter regions as well as decompose those larger‐scale features identified with lower‐order ICA into multiple subregions, as has been found for ICNs with fMRI [Smith et al., 2009]. If a much larger set of DTI scans were available and could be accurately co‐registered without smoothing or skeletonization, then higher‐order ICA might identify many more microstructurally correlated white matter structures than those reported herein. A larger sample size would also better define the regions of weaker correlations in each IC spatial map beyond the dominant white matter tract(s) with the strongest correlations.
Sensitivity of ICA Results to Processing Factors
Global FA variations
The processing options described in the Methods affect the estimated PEV of each estimated white mater structure. The effect is summarized in Table II. In this table, each element in Eq. (1) is quantified and compared over the three different processing options. It is observed that the baseline FA and the global subject FA variation are not much affected by the different preprocessing steps. Global spatial FA variation accounts for most of the data variance, especially in the absence of smoothing. Because the global signals, including the mean FA over all subjects at each voxel and the mean FA over all voxels in each subject, do not contribute to ICA estimation, removal of these global signals is reasonable to improve the reproducibility and PEV of the ICA estimates. By removing the global signals before performing ICA, the PEV of IC17, which is thought to represent artifactual inter‐subject variation, is reduced from 53.0% to 4.7%. The PEV of many of the other ICs, which are thought to represent white matter signals of interest, rise correspondingly. This provides evidence that global mean removal is an advantageous preprocessing step for ICA of DTI.
Spatial smoothness
Table II demonstrates that the global spatial FA variance is substantially decreased by smoothing the FA skeleton maps, as would be expected. Although the total variance of the 25 ICs is reduced by smoothing, the ratio of this total signal variance to that of the noise is increased, indicating that spatial smoothing improves the signal‐to‐noise ratio (SNR) and hence is a beneficial preprocessing step prior to ICA.
Spatial normalization
We found that, in TBSS, registration to the FMRIB58 template produced better results than registration to the minimum deformable target, in terms of SNR (Table II), peak Z‐scores, reproducibility, PEV values, and also empirically based on the appearance of the IC spatial maps. This was likely due to the fact that the FMRIB58 template provided a better target for registration of the central large white matter tracts where FA could be reliably calculated and consistently normalized across subjects. Registration to the minimum deformable target was driven more by peripheral white matter tracts such as subcortical U‐fibers where accurate spatial normalization and FA measurements were not possible due to the small size of the tracts, greater variability among subjects, and intravoxel crossing fibers that violate the Gaussian model of diffusion inherent in the rank‐2 diffusion tensor [Tournier et al., 2004; Tuch et al., 2004; Wedeen et al., 2005].
FastICA vs Infomax
The multivariate FA correlations were robust to the type of ICA algorithm used for estimation, with similar dominant features extracted by both methods (see Fig. 10). Both algorithms yielded IC spatial maps with similar reproducibility and PEV values, with a slight advantage to FastICA for stability of the estimates. However, as illustrated by Figure 11, there was one IC spatial map from FastICA with no counterpart from Infomax, and vice versa. Both of these ICs had poor reproducibility, which may explain why each was not estimated by both algorithms. All of the stable IC spatial maps were estimated similarly by both FastICA and Infomax.
Future Directions
The discovery of voxel‐scale multivariate correlations of white matter microstructure in the human brain using ICA suggests possible scientific and clinical applications. In particular, the application of objective feature extraction methods such as ICA to DTI data represents a novel approach to determining group differences in white matter microstructure as well as examining whether microstructural DTI parameters correlate with cognitive and behavioral variables.
Traditionally, DTI analysis has been conducted with hypothesis‐driven region of interest (ROI) measurements in specific tracts; however, in addition to being time‐consuming and applicable only to a small subset of the brain's total white matter, this manual method suffers from intra‐rater and inter‐rater variability that compromises the generalizability of the results [Hasan and Kamali, 2009]. More recently, unbiased data‐driven whole‐brain voxel‐based analysis methods such as TBSS have been developed that overcome these limitations. Nevertheless, the large number of voxel‐wise comparisons over the entire white matter skeleton limits statistical power due to corrections for multiple comparisons. An intermediate approach between these two extremes is to perform hypothesis‐driven tract‐level measurements using quantitative tractography in the subject's native space [Danielian et al., 2010; Wakana et al., 2007] or with template‐based ROIs in a common group atlas space [Mori et al., 2008; Westlye et al., 2010]. These tract‐wise DTI analysis techniques can produce reproducible results with far fewer multiple comparisons than voxel‐wise methods, but require a priori specification of the tracts of interest based on anatomic knowledge and prior hypotheses regarding the role of the selected tracts in the effect to be studied.
Automated feature extraction methods such as ICA offer a data‐driven alternative to tract‐wise measurements for group DTI analysis in that they also greatly reduce the dimensionality of the problem compared to voxel‐wise techniques but do so in an unbiased way that does not require a priori hypotheses about specific tracts. When healthy controls and neurologic or psychiatric patients are jointly analyzed in this unsupervised framework, the variation of white matter microstructure across subjects inherent in the mixing matrix of the ICA model may provide a natural basis to determine group differences in clinical studies. These variational profiles might also prove useful in establishing associations between regions of correlated white matter microstructure and cognitive/behavioral performance in neuropsychological investigations. This would be analogous to the source based morphometry techniques recently applied to 3D structural MRI [Kasparek et al., 2010; Xu et al., 2009], which provides a potentially superior multivariate alternative to more traditional mass‐univariate approaches such as voxel based morphometry. A proof of principle that unsupervised multivariate analysis can successfully distinguish pathology on FA images from DTI was supplied by Caprihan et al.[ 2008], who used a modified PCA method called discriminant principal component analysis (DPCA) to correctly differentiate a group of schizophrenia patients from a group of age‐matched healthy controls.
As our exploratory study was limited by a modest sample size of 53 subjects, the results are focused on the strongest microstructural correlations in each IC spatial map above a cluster‐level threshold of Z = 2.5 standard deviations. These “dominant features” of each IC spatial map largely localized to single tracts or tract segments versus homologous pairs of tracts or tract segments. Relatively few microstructural correlations were found in prefrontal and temporal white matter, as well as in peripheral U‐fibers (see Fig. 9). This may be due to greater anatomic variability and poorer image registration, especially at the small U‐fibers. Furthermore, data‐driven hierarchical clustering of the correlation matrix of subject loadings did not reveal any plausible relationships among the IC spatial maps; therefore, a subjective classification scheme based on descriptive criteria was used to categorize the independent components. Finally, the true model order of the whole‐brain FA skeleton data could not be determined using the methods of Li et al., [ 2007] because the true dimension exceeded the sample size. A larger‐scale study using new advances in diffusion MR acquisition and image registration technology could potentially address all of these limitations. Larger datasets should enable the detection of weaker degrees of microstructural correlation among more disparate white matter pathways that are yet statistically significant. This may improve coverage of regions that do not show microstructural correlations in our pilot study. A larger‐scale investigation should also be capable of higher‐resolution mapping of microstructural correlations using less spatial smoothing. The increase in sample size would permit a higher‐dimensional ICA analysis, presumably at the true model order of the data, that may uncover many more white matter IC spatial maps than shown herein and which might also identify interesting correlational patterns among these IC spatial maps. Moreover, the effects of demographic variables such as age, gender, and handedness could be studied in this larger cohort. Improvements in the metric for determining the similarity of independent components as well as in clustering methods for grouping similar ICs are also avenues for further investigation.
The identification of distributed networks of white matter with microstructural properties that co‐vary across subjects could be an important new insight into the organization of the human brain, similar to the discovery of ICNs from resting state fMRI [Biswal et al., 1995; Fox et al., 2005; Greicius et al., 2003] and of cortical networks that co‐vary across individuals with regard to macrostructural properties such as cortical thickness [He et al., 2007; Lerch et al., 2006; Worsley et al., 2005]. Determining the relationships among cortical thickness from structural MRI, ICNs from fMRI, and white matter microstructure from DTI, HARDI, and DSI remains an objective for future investigation with multimodal imaging methods. An initial step in this direction was taken by Franco et al., [ 2008], who used joint ICA of resting state fMRI and DTI to show that FA of the corpus callosum and the bilateral cingulum bundles correlated with functional connectivity in the default mode network. Teipel et al., [ 2010] extended this same approach to a cohort of elderly subjects to demonstrate that FA and MD in white matter tracts underlying the default mode network were correlated with functional connectivity in this cortical network. The knowledge gained from these multimodal investigations, as well as from studies of the genetic basis and biophysical underpinnings of white matter microstructure as measured by diffusion MR imaging, may help elucidate the biological significance of white matter microstructural correlations.
CONCLUSION
The recent observation of specific correlational patterns of DTI parameters such as FA between selected pairs of tracts across normal adult subjects [Wahl et al., 2010] raised the question of whether these microstructural correlations could be mapped at the voxel scale across the entire human brain. In this initial exploration of whole‐brain voxel‐wise microstructural white matter correlations, we applied independent component analysis to spatially normalized FA skeletons derived from tract‐based spatial statistics. The resulting spatial maps of the independent components reveal clusters of white matter voxels for which the FA values co‐vary across individuals in the sample. These microstructural correlation patterns in most independent component spatial maps could be subjectively classified into supratentorial commissural, association, or projection pathways, or else representing infratentorial white matter in the brainstem or cerebellum. Hence, ICA of the FA skeleton provides an unsupervised decomposition of the normal human brain into multiple separable microstructurally correlated white matter regions, many of which contain features corresponding to anatomically familiar classes of white matter pathways.
As both TBSS and ICA are fully automated, the analysis used in the current study can be efficiently applied to large subject populations for clinical or scientific research. Further investigation with larger sample sizes is required to better delineate the full complexity of microstructurally correlated white matter networks and to determine their biological underpinnings. More research is also needed to determine if unbiased multivariate feature extraction techniques such as independent component analysis can surpass conventional mass‐univariate approaches for establishing group differences in white matter microstructure and for associating white matter integrity with cognitive and behavioral performance in clinical diffusion MR imaging studies.
Acknowledgements
The content is solely the responsibility of the authors and does not necessarily represent the official views of the National Institute of Neurological Disorders and Stroke or the National Institutes of Health. The authors would like to thank Terrence J. Sejnowski and Maurizio Corbetta for helpful discussions.
REFERENCES
- Aboitiz F, Scheibel AB, Fisher RS, Zaidel E ( 1992): Fiber composition of the human corpus callosum. Brain Res 598: 143–153. [DOI] [PubMed] [Google Scholar]
- Arfanakis K, Cordes D, Haughton VM, Carew JD, Meyerand ME ( 2002): Independent component analysis applied to diffusion tensor MRI. Magn Reson Med 47: 354–363. [DOI] [PubMed] [Google Scholar]
- Basser PJ, Pierpaoli C ( 1996): Microstructural and physiological features of tissues elucidated by quantitative diffusion tensor MRI. J Magn Reson B 111: 209–219. [DOI] [PubMed] [Google Scholar]
- Beaulieu C ( 2002): The basis of anisotropic water diffusion in the nervous system—A technical review. NMR Biomed 15: 435–455. [DOI] [PubMed] [Google Scholar]
- Beaulieu C, Pewes C, Paulson LA, Roy D, Snook L, Concha L, Phillips L ( 2005): Imaging brain connectivity in children with diverse reading ability. Neuroimage 25: 1266–1271. [DOI] [PubMed] [Google Scholar]
- Beckmann CF, Smith SM ( 2004): Probabilistic independent component analysis for functional magnetic resonance imaging. IEEE Trans Med Imaging 23: 137–152. [DOI] [PubMed] [Google Scholar]
- Bell AJ, Sejnowski TJ ( 1995): An information‐maximization approach to blind separation and blind deconvolution. Neural Comput 7: 1004–1034. [DOI] [PubMed] [Google Scholar]
- Biswal B, Yetkin FZ, Haughton VM, Hyde JS ( 1995): Functional connectivity in the motor cortex of resting human brain using echo‐planar MRI. Magn Reson Med 34: 537–541. [DOI] [PubMed] [Google Scholar]
- Caprihan A, Pearlson GD, Calhoun VD ( 2008): Application of principal component analysis to distinguish patients with schizophrenia from healthy controls based on fractional anisotropy measurements. Neuroimage 42: 675–682. [DOI] [PMC free article] [PubMed] [Google Scholar]
- Chiang MC, Barysheva M, Shattuck DW, Lee AD, Madsen SK, Avedissian C, Klunder AD, Toga AW, McMahon KL, de Zubicaray GI, Wright MJ, Srivastava A, Balov N, Thompson PM ( 2009): Genetics of brain fiber architecture and intellectual performance. J Neurosci 29: 2212–2224. [DOI] [PMC free article] [PubMed] [Google Scholar]
- Conturo TE, Lori NF, Cull TS, Akbudak E, Snyder AZ, Shimony JS, McKinstry RC, Burton H, Raichle ME ( 1999): Tracking neuronal fiber pathways in the living human brain. Proc Natl Acad Sci USA 96: 10422–10427. [DOI] [PMC free article] [PubMed] [Google Scholar]
- Danielian LE, Iwata NK, Thomasson DM, Floeter MK ( 2010): Reliability of fiber tracking measurements in diffusion tensor imaging for longitudinal study. Neuroimage 49: 1572–1580. [DOI] [PMC free article] [PubMed] [Google Scholar]
- Drobyshevsky A, Song SK, Gamkrelidze G, Wyrwicz AM, Derrick M, Meng F, Li L, Ji X, Trommer B, Beardsley DJ, Luo NL, Back SA, Tan S ( 2005): Developmental changes in diffusion anisotropy coincide with immature oligodendrocyte progression and maturation of compound action potential. J Neurosci 25: 5988–5997. [DOI] [PMC free article] [PubMed] [Google Scholar]
- Edden RA, Jones DK ( 2010): Skeleton thickness biases statistical power in skeleton‐based analyses of diffusion MRI data. Proc Int Soc Magn Reson Med 19: 110. [Google Scholar]
- Fox MD, Snyder AZ, Vincent JL, Corbetta M, Van Essen DC, Raichle ME ( 2005): The human brain is intrinsically organized into dynamic, anticorrelated functional networks. Proc Natl Acad Sci USA 102: 9673–9678. [DOI] [PMC free article] [PubMed] [Google Scholar]
- Franco AR, Ling J, Caprihan A, Calhoun VD, Jung RE, Heileman GL, Mayer AR ( 2008): Multimodal and multi‐tissue measures of connectivity revealed by joint independent component analysis. IEEE J Sel Top Signal Process 2: 986–997. [DOI] [PMC free article] [PubMed] [Google Scholar]
- Greicius MD, Krasnow B, Reiss AL, Menon V ( 2003): Functional connectivity in the resting brain: A network analysis of the default mode hypothesis. Proc Natl Acad Sci USA 100: 253–258. [DOI] [PMC free article] [PubMed] [Google Scholar]
- Groves AR, Beckmann CF, Smith SM, Woolrich MW ( 2011): Linked independent component analysis for multimodal data fusion. Neuroimage 54: 2198–2217. [DOI] [PubMed] [Google Scholar]
- Gui M, Peng H, Carew JD, Lesniak MS, Arfanakis K ( 2008): A tractography comparison between turboprop and spin‐echo echo‐planar diffusion tensor imaging. Neuroimage 42: 1451–1462. [DOI] [PMC free article] [PubMed] [Google Scholar]
- Hasan KM, Kamali A ( 2009): The need for spatially standardized methods in clinical applications of diffusion tensor imaging of white matter. Radiology 253: 571. [DOI] [PubMed] [Google Scholar]
- He Y, Chen ZJ, Evans AC ( 2007): Small‐world anatomical networks in the human brain revealed by cortical thickness from MRI. Cereb Cortex 17: 2407–2419. [DOI] [PubMed] [Google Scholar]
- Himberg J, Hyvarinen A, Esposito F ( 2004): Validating the independent components of neuroimaging time series via clustering and visualization. NeuroImage 22: 1214–1222. [DOI] [PubMed] [Google Scholar]
- Hofer S, Frahm J ( 2006): Topography of the human corpus callosum revisited—Comprehensive fiber tractography using diffusion tensor magnetic resonance imaging. Neuroimage 32: 989–994. [DOI] [PubMed] [Google Scholar]
- Hyvarinen A, Oja E ( 2000): Independent component analysis: Algorithms and applications. Neural Networks 13, 411–430. [DOI] [PubMed] [Google Scholar]
- Hyvarinen A, Karhunen J, Oja E ( 2000): Independent Component Analysis. New York: Wiley. [Google Scholar]
- Jenkinson M, Bannister P, Brady M, Smith S ( 2002): Improved optimization for the robust and accurate linear registration and motion correction of brain images. Neuroimage 17: 825–841. [DOI] [PubMed] [Google Scholar]
- Kasparek T, Marecek R, Schwarz D, Prikryl R, Vanicek J, Mikl M, Ceskova E ( 2010): Source‐based morphometry of gray matter volume in men with first‐episode schizophrenia. Hum Brain Mapp 31: 300–310. [DOI] [PMC free article] [PubMed] [Google Scholar]
- Keller TA, Just MA ( 2009): Altering cortical connectivity: Remediation‐induced changes in the white matter of poor readers. Neuron 64: 624–631. [DOI] [PMC free article] [PubMed] [Google Scholar]
- Kiviniemi V, Starck T, Remes J, Long X, Nikkinen J, Haapea M, Veijola J, Moilanen I, Isohanni M, Zang Y‐F, Tervonen O ( 2009): Functional segmentation of the brain cortex using high model order group PICA. Hum Brain Mapp 30: 3865–3886. [DOI] [PMC free article] [PubMed] [Google Scholar]
- Klingberg T, Hedehus M, Temple E, Salz T, Gabrieli JD, Moseley ME, Poldrack RA ( 2000): Microstructure of temporo‐parietal white matter as a basis for reading ability: Evidence from diffusion tensor magnetic resonance imaging. Neuron 25: 493–500. [DOI] [PubMed] [Google Scholar]
- Lerch JP, Worsley K, Shaw WP, Greenstein DK, Lenroot RK, Giedd J, Evans AC ( 2006): Mapping anatomical correlations across cerebral cortex (MACACC) using cortical thickness from MRI. Neuroimage 31: 993–1003. [DOI] [PubMed] [Google Scholar]
- Li Y‐O, Adali T, Calhoun VD ( 2007): Estimating the number of independent components for functional magnetic resonance imaging data. Human Brain Mapp 28: 1251–1266. [DOI] [PMC free article] [PubMed] [Google Scholar]
- McIntosh AM, Moorhead TW, Job D, Lymer GK, Muñoz Maniega S, McKirdy J, Sussmann JE, Baig BJ, Bastin ME, Porteous D, Evans KL, Johnstone EC, Lawrie SM, Hall J ( 2008): The effects of a neuregulin 1 variant on white matter density and integrity. Mol Psychiatry 13: 1054–1059. [DOI] [PubMed] [Google Scholar]
- Mori S, Crain BJ, Chacko VP, van Zijl PCM ( 1999): Three‐dimensional tracking of axonal projections in the brain by magnetic resonance imaging. Ann Neurol 45: 265–269. [DOI] [PubMed] [Google Scholar]
- Mori S, Wakana S, van Zijl PCM ( 2005): MRI Atlas of Human White Matter. Elsevier: Amsterdam, Netherlands. [Google Scholar]
- Mori S, Oishi K, Jiang H, Jiang L, Li X, Akhter K, Hua K, Faria AV, Mahmood A, Woods R, Toga AW, Pike GB, Neto PR, Evans A, Zhang J, Huang H, Miller MI, van Zijl P, Mazziotta J ( 2008): Stereotaxic white matter atlas based on diffusion tensor imaging in an ICBM template. Neuroimage 40: 570–582. [DOI] [PMC free article] [PubMed] [Google Scholar]
- Moseley M ( 2002): Diffusion tensor imaging and aging—A review. NMR Biomed 15: 553–560. [DOI] [PubMed] [Google Scholar]
- Mukherjee P, McKinstry RC ( 2006): Diffusion tensor imaging and tractography of human brain development. Neuroimaging Clin N Am 16: 19–43. [DOI] [PubMed] [Google Scholar]
- Nierenberg J, Pomara N, Hoptman MJ, Sidtis JJ, Ardekani BA, Lim KO ( 2005): Abnormal white matter integrity in healthy apolipoprotein E epsilon4 carriers. Neuroreport 16: 1369–1372. [DOI] [PubMed] [Google Scholar]
- Niogi SN, McCandliss BD ( 2006): Left lateralized white matter microstructure accounts for individual differences in reading ability and disability. Neuropsychologia 44: 2178–2188. [DOI] [PubMed] [Google Scholar]
- Niogi SN, Mukherjee P, Ghajar J, Johnson CE, Kolster R, Lee H, Suh M, Zimmerman RD, Manley GT, McCandliss BD ( 2008): Structural dissociation of attentional control and memory in adults with and without mild traumatic brain injury. Brain 131: 3209–3221. [DOI] [PubMed] [Google Scholar]
- Nucifora PG, Verma R, Lee SK, Melhem ER ( 2007): Diffusion‐tensor MR imaging and tractography: Exploring brain microstructure and connectivity. Radiology 245: 367–384. [DOI] [PubMed] [Google Scholar]
- Penke L, Maniega SM, Murray C, Gow AJ, Hernández MC, Clayden JD, Starr JM, Wardlaw JM, Bastin ME, Deary IJ ( 2010): A general factor of brain white matter integrity predicts information processing speed in healthy older people. J Neurosci 30: 7569–7574. [DOI] [PMC free article] [PubMed] [Google Scholar]
- Scholz J, Klein MC, Behrens TE, Johansen‐Berg H ( 2009): Training induces changes in white‐matter architecture. Nat Neurosci 12: 1370–1371. [DOI] [PMC free article] [PubMed] [Google Scholar]
- Singh M, Wong CW ( 2006): Recovery of multiple fibers per voxel by ICA in DTI tractography. Conf Proc IEEE Eng Med Biol Soc 1: 735–738. [DOI] [PubMed] [Google Scholar]
- Smith SM ( 2002): Fast robust automated brain extraction. Hum Brain Mapp 17: 143–155. [DOI] [PMC free article] [PubMed] [Google Scholar]
- Smith SM, Jenkinson M, Johansen‐Berg H, Rueckert D, Nichols TE, Mackay CE, Watkins KE, Ciccarelli O, Cader MZ, Matthews PM, Behrens TE ( 2006): Tract‐based spatial statistics: Voxelwise analysis of multi‐subject diffusion data. Neuroimage 31: 1487–1505. [DOI] [PubMed] [Google Scholar]
- Smith SM, Johansen‐Berg H, Jenkinson M, Rueckert D, Nichols TE, Miller KL, Robson MD, Jones DK, Klein JC, Bartsch AJ, Behrens TE ( 2007): Acquisition and voxelwise analysis of multi‐subject diffusion data with tract‐based spatial statistics. Nat Protoc 2: 499–503. [DOI] [PubMed] [Google Scholar]
- Smith SM, Fox PT, Miller KL, Glahn DC, Fox PM, Mackay CE, Filippini N, Watkins KE, Toro R, Laird AR, Beckmann CF ( 2009): Correspondence of the brain's functional architecture during activation and rest. Proc Natl Acad Sci USA 106: 13040–13045. [DOI] [PMC free article] [PubMed] [Google Scholar]
- Song SK, Sun SW, Ramsbottom MJ, Chang C, Russell J, Cross AH ( 2002): Dysmyelination revealed through MRI as increased radial (but unchanged axial) diffusion of water. Neuroimage 17: 1429–1436. [DOI] [PubMed] [Google Scholar]
- Tamhane AA, Arfanakis K ( 2009): Motion correction in periodically‐rotated overlapping parallel lines with enhanced reconstruction (PROPELLER) and turboprop MRI. Magn Reson Med 62: 174–182. [DOI] [PMC free article] [PubMed] [Google Scholar]
- Teipel SJ, Bokde AL, Meindl T, Amaro E Jr, Soldner J, Reiser MF, Herpertz SC, Möller HJ, Hampel H ( 2010): White matter microstructure underlying default mode network connectivity in the human brain. Neuroimage 49: 2021–2032. [DOI] [PubMed] [Google Scholar]
- Tournier JD, Calamante F, Gadian DG, Connelly A ( 2004): Direct estimation of the fiber orientation density function from diffusion‐weighted MRI using spherical deconvolution. Neuroimage 23: 1176–1185. [DOI] [PubMed] [Google Scholar]
- Tuch DS ( 2004): Q‐ball imaging. Magn Reson Med 52: 1358–1372. [DOI] [PubMed] [Google Scholar]
- Wahl M, Strominger Z, Jeremy RJ, Barkovich AJ, Wakahiro M, Sherr EH, Mukherjee P ( 2009): Variability of homotopic and heterotopic callosal connectivity in partial agenesis of the corpus callosum: A 3T diffusion tensor imaging and Q‐ball tractography study. AJNR Am J Neuroradiol 30: 282–289. [DOI] [PMC free article] [PubMed] [Google Scholar]
- Wahl M, Li Y‐O, Ng J, LaHue SC, Cooper SR, Sherr EH, Mukherjee P ( 2010): Microstructural correlations of white matter tracts in the human brain. Neuroimage 51: 531–541. [DOI] [PMC free article] [PubMed] [Google Scholar]
- Wakana S, Caprihan A, Panzenboeck MM, Fallon JH, Perry M, Gollub RL, Hua K, Zhang J, Jiang H, Dubey P, Blitz A, van Zijl P, Mori S ( 2007): Reproducibility of quantitative tractography methods applied to cerebral white matter. Neuroimage 36: 630–644. [DOI] [PMC free article] [PubMed] [Google Scholar]
- Wedeen VJ, Hagmann P, Tseng WY, Reese TG, Weisskoff RM ( 2005): Mapping complex tissue architecture with diffusion spectrum magnetic resonance imaging. Magn Reson Med 54: 1377–1386. [DOI] [PubMed] [Google Scholar]
- Westlye LT, Walhovd KB, Dale AM, Bjornerud A, Due‐Tonnessen P, Engvig A, Grydeland H, Christian CK, Ostby Y, Fjell AM ( 2010): Life‐span changes of the human brain white matter: Diffusion tensor imaging and volumetry. Cereb Cortex 20: 2055–2068. [DOI] [PubMed] [Google Scholar]
- Worsley KJ, Chen JI, Lerch J, Evans AC ( 2005): Comparing functional connectivity via thresholding correlations and singular value decomposition. Philos Trans R Soc Lond B Biol Sci 360: 913–920. [DOI] [PMC free article] [PubMed] [Google Scholar]
- Wu YC, Alexander AL ( 2007): Hybrid diffusion imaging. Neuroimage 36: 617–629. [DOI] [PMC free article] [PubMed] [Google Scholar]
- Xu L, Groth KM, Pearlson G, Schretlen DJ, Calhoun VD ( 2009): Source‐based morphometry: The use of independent component analysis to identify gray matter differences with application to schizophrenia. Hum Brain Mapp 30: 711–724. [DOI] [PMC free article] [PubMed] [Google Scholar]
- Zahr NM, Rohlfing T, Pfefferbaum A, Sullivan EV ( 2009): Problem solving, working memory, and motor correlates of association and commissural fiber bundles in normal aging: A quantitative fiber tracking study. Neuroimage 44: 1050–1062. [DOI] [PMC free article] [PubMed] [Google Scholar]