

Abstract
While schizophrenia is frequently characterized as a disorder of disturbed functional connectivity, the causes and pathophysiological origins of such disturbances remain unclear. The aim of this study was to better elucidate the mechanistic causes of abnormal functional connectivity in schizophrenia, measured as the extent of temporal correlation between endogenous fluctuations recorded at anatomically discrete brain regions during resting‐state functional MRI. An approach was developed to perform whole‐brain connectivity mapping at the resolution of individual pairs of voxels, without the need for arbitrary parcellation of the cerebrum. Between‐group connectivity reductions in 12 people diagnosed with schizophrenia and 15 age‐, IQ‐, and gender‐matched healthy volunteers were localized to a distributed network including frontoparietal and occipitoparietal connections. The gray‐matter regions comprising this disturbed network showed evidence of local reductions in both intra‐regional homogeneity (29%–33% reduction) and signal power (40%–60% reduction). The extent to which inter‐regional correlation was reduced between a pair of gray matter regions was found to be strongly correlated with the extent of local decoherence evident within the gray matter regions per se. This suggests measurement of aberrant functional connectivity in schizophrenia is both a measurement of altered coupling between regions as well as a measurement of local decoherence within regions. Hum Brain Mapp, 2012. © 2011 Wiley Periodicals, Inc.
Keywords: network mapping, functioncal connectivity mapping, schizophrenia
INTRODUCTION
The cognitive and affective disturbances of schizophrenia have long been thought to arise from improper functional integration of a distributed network of brain regions [Bullmore et al.,1997; Friston and Frith,1995; Stephan et al.,2009; Weinberger et al.,1992]. Evidence for dysfunctional integration in schizophrenia has emerged from a growing number of studies reporting aberrant functional connectivity, both when the brain is in a conscious resting state [eg. Bluhm et al.,2007; Liu et al.,2008; Lynall et al.,2010; Rotarska‐Jagiela et al.,2010] as well as when it is performing any of a variety of cognitive tasks [eg. Calhoun et al.,2004; Fornito et al., in press; Garrity et al.,2007; Meyer‐Lindenberg et al.,2001].
A pair of anatomically discrete regions are said to be functionally connected if they exhibit a high degree of temporal correlation in their activity time series acquired during functional MRI [Biswal et al.,1995; Friston,1994; Hampson et al.,2002]. Although it is well established that aberrant functional connectivity in people with schizophrenia is widespread, the underlying causes of such connectivity disturbances remain elusive.
This elusiveness is primarily due to the fact that dysfunctional connectivity can be attributed to any of a number of different causes. A reduction in inter‐regional correlation is commonly construed to mean that the oscillations at one region are fluctuating at a different frequency or phase to the oscillations at another, hence manifesting as an aberrant connection between the pair of regions (see Fig. 1). The pathophysiological mechanism driving this kind of phase or frequency difference is unclear but could be due to disrupted axonal connectivity [Konrad et al.,2008; Kubicki et al.,2005; Zalesky et al.,2011].
Figure 1.

Temporal correlation between a pair of sinusoidal oscillations corrupted with additive white Gaussian noise (a). Attributes of the signal colored green were altered separately to simulate three possible causes of aberrant functional connectivity, measured as a loss in signal correlation. The three causes simulated were: a phase difference (b), a loss in oscillation amplitude (c), a frequency difference (d). Connectivity was measured using Pearson's correlation coefficient. [Color figure can be viewed in the online issue, which is available at wileyonlinelibrary.com.]
Several causes other than a phase difference can result in reduced inter‐regional correlation, and in turn be construed as dysfunctional connectivity. In particular, pathophysiological mechanisms operating within a region per se, such as abnormal synaptic modulation and signaling [McGlashan et al.,2000; Stephan et al.,2009], can result in a loss in the amplitude of oscillations [Hoptman et al.,2010], manifesting as a reduction in inter‐regional correlation. This is because a sufficient loss in amplitude renders the low‐frequency oscillations indistinguishable from noise (see Fig. 1c). Similarly, a loss in the homogeneity of oscillations of neuronal elements comprising a regional node may also manifest as a reduction in inter‐regional correlation. Indeed, it has been recognized that both these “regional” mechanisms‐loss in oscillation amplitude [Demirci et al.,2009; Hoptman et al.,2010] and loss in intra‐regional homogeneity [Liu et al.,2006]—are evident in schizophrenia.
Using current brain imaging techniques, it is not possible to determine whether local dysfunction causes an alteration in inter‐regional functional connectivity, since synaptic architecture and dynamics can be difficult to quantify. However, if local abnormalities were found to co‐occur with altered inter‐regional connectivity, it would suggest one of two possibilities: (i) local dysfunction causes altered inter‐regional synchronization and is therefore a primary attribute; or (ii) local dysfunction is a consequence of altered inter‐regional coupling, suggesting that altered axonal connectivity can exert an effect on both distributed and local functional dynamics.
The aim of this study was to disentangle the attributes of dysfunctional connectivity in schizophrenia; in particular, to test whether the widespread reduction in inter‐regional correlation reported across numerous recent studies can be attributed to phase differences alone, or a loss in regional/nodal integrity as well. We hypothesized that if a loss in regional integrity was a factor contributing to dysfunctional connectivity in schizophrenia, then the extent to which a functional connection between two regions is affected would be directly correlated with the extent to which regional integrity is compromised.
To test our hypothesis, temporal covariation in the resting‐state functional MRI time series was computed for all possible 93.4 million pairs of cortical and subcortical voxels in each of 12 people with schizophrenia and 15 age‐ and gender‐matched controls. A new methodology was developed (see Material and Methods) to perform pairwise spatial clustering of those voxel pairs for which the difference in correlation coefficient between controls and people with schizophrenia was large. This resulted in a distributed network of voxel clusters, referred to as network nodes, interconnected via links that represented functional connections exhibiting reduced inter‐nodal correlation in patients. Associations were then tested between the extent to which inter‐nodal correlation was reduced and the extent of intra‐nodal homogeneity.
This purpose of this study was not to elucidate topological differences in network structure, such as modularity [Lynall et al.,2010] and community structure [Girvan and Newman,2002]. Rather, the objective of this study was to pinpoint brain regions in a statistically valid manner between which functional connectivity is disrupted in people with schizophrenia and to investigate whether these disruptions are coupled with other key properties of the resting‐state signal; namely, changes in signal power and regional homogeneity.
MATERIALS AND METHODS
This section is organized as follows: Key demographic characteristics of the participant sample are foremost described in Sample Characteristics section. In Acquisition and Preprocessing of MRI Data section, the resting‐state acquisition protocol is detailed, together with a summary of the very much standard data preprocessing pipeline adopted in this study. Measurement of Functional Connectivity section briefly describes how functional connectivity was measured and between which voxel pairs it was measured in each participant. We then present in detail our new pairwise clustering approach in Spatial Pairwise Clustering section, which is called spatial pairwise clustering (SPC). SPC was used in this study to pinpoint pairs of gray matter regions between which functional connectivity was disrupted in schizophrenia. To begin this section, the merits and weaknesses of our approach are discussed with respect to some common alternative methods; namely, seed correlation analysis, ICA and graph‐based analysis. From Pairwise Clusters to a Network section describes how SPC can be integrated into the network‐based statistic (NBS). Finally, the remaining sections describes the post hoc analyses undertaken, where it was tested if the connectivity disruptions identified were coupled to key properties of the resting‐state signal; namely, intra‐nodal homogeneity, oscillation amplitude, and the association between these measures. A summary of our analysis pipeline is shown in Figure 2.
Figure 2.
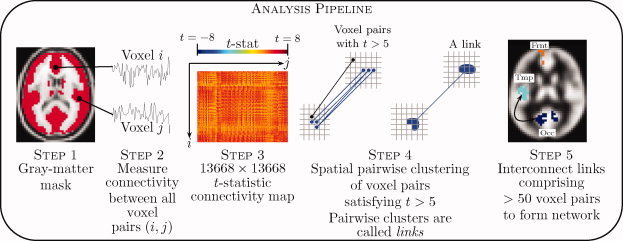
Overview of analysis pipeline. A gray‐matter mask was foremost defined (step 1). Connectivity was then measured between all possible pairs of gray matter voxels in each individual comprising a group of people diagnosed with schizophrenia and a group of controls (step 2). Each cell (i, j) comprising the t‐statistic connectivity map (step 3) tested a between‐group difference in the value of connectivity between voxels i and j. Voxel pairs with a t‐statistic exceeding 5 were clustered in a pairwise fashion to form links (step 4), after which links comprising more than 50 voxel pairs were interconnected to form a network (step 5). Statistical significance was assessed at the network level using the network‐based statistic. [Color figure can be viewed in the online issue, which is available at wileyonlinelibrary.com.]
Sample Characteristics
Fifteen healthy controls and 12 people with chronic schizophrenia were recruited from the general community. A diagnosis of schizophrenia was established according to standard operational criteria in the Diagnostic and Statistical Manual of Mental Disorders IV (American Psychiatric Association, 2000). The two groups were matched for age (age controls: 33.3 ± 9.2 years, age schizophrenia: 32.8 ± 9.2, t = 0.14, P = 0.51), gender (controls: 1 female, schizophrenia: 2 females, χ2 = 1.25, P = 0.26), years of education (education controls: 13.3 ± 6.4 years, education schizophrenia: 12.8 ± 2.4, t = 0.26, P = 0.32) and pre‐onset IQ (IQ controls: 113 ± 6, IQ schizophrenia: 112 ± 9, t = 0.35, P = 0.22). Pre‐onset IQ was estimated using the National Adult Reading Test [Nelson,1992]. All participants with schizophrenia were receiving antipsychotic drugs. Four were receiving additional psychotropic medication. To mitigate acute drug effects, medication was not administered on the day of scanning. All participants provided informed consent in writing and the protocol was approved by the Addenbrooke's NHS Trust Local Research Ethics Committee. Between‐group differences in several network and topological properties have been reported in this sample as part of an earlier publication [Lynall et al.,2010], where further clinical characteristics of the sample can be found.
Acquisition and Preprocessing of MRI Data
A 1.5T GE Signa scanner (General Electric, Milwaukee,WI) located at the BUPA Lea Hospital, Cambridge, UK, was used to acquire T ‐weighted echo‐planar images (EPI) depicting blood oxygenation level‐dependent contrast during a period of 17 min 12 s while each participant laid quietly in the scanner with eyes closed. Afterwards, participants gave verbal confirmation of not falling asleep at any time during the scan period. Imaging parameters were as follows: repetition time: 2 s, echo time: 40 ms, flip angle: 70 degrees, voxel size: 3.05 × 3.05 × 7 mm, slice gap: 0.7 mm, number of volumes: 516. The first four volumes were discarded to allow for equilibration, thus leaving 512 volumes per subject. Correction for head movement was performed with rigid‐body realignment followed by regression of motion parameters against each voxel's time series to remove any remaining movement related variance [Suckling et al.,2006]. The 512 motion‐corrected volumes were then spatially normalized to a customized EPI template in MNI stereotaxic space using a non‐linear deformation, as implemented in the SPM software package (available at: http://www.fil.ion.ucl.ac.uk). Reslicing to a resolution of 4 × 4 × 4 mm was performed as part of the normalization process. Note that spatial normalization can introduce spurious short‐range temporal correlations attributable to spatial interpolation and not functional connectivity per se [Van den Heuvel et al.,2008]. A distance constraint was imposed to guard against this kind of spurious interpolation‐driven connectivity (see Spatial Pairwise Clustering).
After normalization and reslicing, the 512‐point time series for each voxel was bandpass filtered to isolate the low‐frequency (0.01–0.1 Hz) oscillations of interest. Bandpass filtering was performed using the FSL software package (available at: http://www.fmrib.ox.ac.uk/fsl/) and minimized the influence of very low‐frequency scanner noise and high‐frequency oscillations owing to cardiac and respiratory fluctuations [Cordes et al.,2001]. Any linear trend was then removed from each bandpass filtered time series. The filtered and de‐trended time series were further corrected for nuisance fluctuations via linear regression against unfiltered reference time courses extracted from white matter and the ventricles [Fox et al.,2005]. A spherical mask of radius 6 mm located in the ventricles was used to extract a representative time course for CSF, while two spherical masks, also of radius 6 mm, located in the left and right cerebral white‐matter were used to extract a representative white‐matter time course. For all subsequent processing, the residuals of this regression were used as the time series of interest for each voxel.
To test for temporal variation, the time series for each subject was split into two halves—first 256 time points and last 256 points. A paired t‐test was then used to test for any differences between the two halves with respect to various statistical measures, including variance, maximum and minimum amplitude. No significant differences were identified, suggesting an absence of long‐term temporal variation.
Measurement of Functional Connectivity
A binary mask was created to isolate all cortical and subcortical voxels. Mask creation proceeded as follows: The probabilistic gray matter tissue template provided as part of the FSL software package was resliced to 4 × 4 × 4 mm3 and any voxel with intensity exceeding 120 (=60%) was used to create a binary mask. Due to a limited field of view in the z‐plane, poor EPI coverage was noted at some voxels comprising this binary mask, particularly within the cerebellum and at the top of the brain. A second binary mask was therefore created to isolate all voxels for which a strong EPI signal (i.e. signal > 150) was present at all 512 time points of all 27 participants. The intersection of these two binary masks comprised 13,668 voxels and served as the binary mask defining the cortex and subcortical gray matter for all subsequent processing.
For each participant, functional connectivity was measured between all possible 93.4 million pairs of cortical and subcortical voxels using Pearson's correlation coefficient. An assumption of statistic normality was never required, and thus the r to z transformation was unnecessary. The r value was merely used as a measure of variation. Moreover, the assumption of normality in r values was tested at 10,000 randomly selected voxel pairs in both the control group (15 r values per test) and schizophrenia group (12 r values per test) using the Kolmogorov‐Smirnov test. The assumption of normality was not rejected at any voxels pairs for a significance of 0.05. This provided further basis for not considering r to z transformation.
Spatial Pairwise Clustering
Methods for analyzing resting‐state functional connectivity in schizophrenia have generally followed one of three approaches [Cole et al.,2010; Fornito and Bullmore,2010a; Smith et al.,2011]:
-
1
Seed correlation analysis: connectivity is measured between a preselected seed region and all other voxels [Bluhm et al.,2007; Cordes et al.,2001; Fransson et al.,2005; Zhou et al.,2007].
-
2
Independent component analysis (ICA): spatially independent but temporally correlated components are identified using ICA [Calhoun et al.,2004; Garrity et al.,2007; Smith et al.,2009], after which connectivity can be measured between the temporal profiles of selected components of interest [e.g. Demirci et al.,2009; Jafri et al.,2008] or between the temporal profile of a selected component and all other voxels (e.g. Rotarska‐Jagiela et al.,2010].
-
3
Graph‐based analysis: the cortex is subdivided into a collection of nodes and connectivity is measured between all possible node pairs [Fornito et al., 2011; He and Evans,2010; Liang et al.,2006; Liu et al.,2008; Lynall et al.,2010; Rubinov et al.,2009; Wang et al.,2010].
A limitation common to all three approaches is that connectivity is generally measured in relation to a specific seed region, ICA component (i.e. lack of “optimal” choice for number of independent ICA components [Buckner et al.,2008; Cole et al.,2010] and artificial “splitting” into subnetworks when the model dimensionality is chosen too high), or in the case of graph‐based analysis, an arbitrary cortical subdivision [Cole et al.,2010; Fornito et al.,2010b; Hayasaka and Laurienti,2009; Smith et al.,2009; Wig al.,2011; Zalesky et al.,2010a]. This specific and possibly subjective choice of seed region, ICA component or cortical subdivision overlooks potentially crucial connectivity patterns that may become apparent only under an alternative choice and has motivated voxel‐resolution connectivity mapping [Van den Heuvel et al.,2008].
The rationale adopted in this study was therefore to measure connectivity between all possible pairs of cortical and subcortical voxels. This eliminated any subjectivity inherent to the choice of seed region, ICA dimensionality or arbitrary cortical parcellation and led to the development of a coherent, seed‐free, parcellation‐free framework for performing explicit between‐group resting‐state analyses.
To deal with the resulting statistical problem of 93.4 million multiple comparisons, a new clustering approach called spatial pairwise clustering (SPC) was developed. SPC is a pairwise clustering principle whereby pairs of voxels are clustered to form a pair of spatially distinct nodes. Nodes contain multiple voxels. A pair of nodes can incorporate a voxel pair if and only if one voxel comprising the voxel pair resides within one of the nodes and the other voxel resides in the other node.
SPC was performed only on the voxel pairs between which the difference in connectivity between controls and people with schizophrenia exceeded a predefined threshold (see below). In this way, pairs of cortical or subcortical regions between which connectivity was disrupted were pinpointed in an exclusively data‐driven manner. This is in contrast to existing approaches requiring a priori selection of a seed region or necessitating arbitrary subdivision of the cerebrum into distinct nodes. We hypothesized that regions affected by aberrant connectivity encompassed a spatially contiguous volume exceeding a single 4 × 4 × 4 mm voxel, which motivated the clustering concept.
SPC was implemented as follows: A two‐sample t‐statistic was calculated for all possible voxel pairs to test the null hypothesis of equality in the mean value of connectivity between groups. Both possible one‐tailed alternative hypotheses were tested separately. For each alternative hypothesis, any voxel pair with a t‐statistic exceeding 5 (P < 0.0001) was admitted to a set of supra‐threshold voxel pairs. To avoid spurious interpolation‐driven connectivity, any pair of voxels separated by less than 10 mm was excluded from this set a priori.
SPC was then performed on the set of supra‐threshold voxel pairs (see Fig. 3). Standard 26‐voxel neighborhoods were used to define each voxel's neighbors, and thus a pair of voxels possessed at most 27 × 27 − 1 = 728 potential neighboring pairs. SPC identified a total of eight pairwise clusters comprising 50 or more voxel pairs (see Results, Fig. 4). Each pairwise cluster comprised two spatially distinct clusters of voxels, referred to as nodes, representing pairs of regions between which functional connectivity was disrupted in people with schizophrenia. Pairwise clusters comprising less than 50 voxel pairs were considered insignificant.
Figure 3.

Spatial pairwise clustering (SPC) was performed to cluster pairs of voxels between which functional connectivity was decreased in people with schizophrenia. Two voxel pairs, denoted as (u1; v1) and (u2; v2), were clustered if and only if u1 neighbored u2 and v1 neighbored v2; or equivalently, u1 neighbored v2 and v1 neighbored u2. The three voxel pairs colored blue satisfy this criterion and therefore form a pairwise cluster. Note that a pairwise cluster comprises two spatially distinct clusters of voxels. While one of the voxels comprising the voxel pair colored black neighbors a blue voxel, the other voxel of the black pair does not, and thus the black voxel pair is not included in the blue cluster. [Color figure can be viewed in the online issue, which is available at wileyonlinelibrary.com.]
Figure 4.

Voxel pairs between which functional connectivity was reduced in people with schizophrenia were clustered using spatial pairwise clustering (see Fig. 3 for details about the clustering method). (a)–(h) The eight pairwise clusters, or links, that were identified. Only pairwise clusters comprising 50 or more voxels pairs are shown. PVC: primary visual cortex; PFC: prefrontal cortex (dorsomedial); paracentral: paracentral lobule extending to midcingulate cortex; Ins: insula (posterior); SFG: precentral gyrus extending to superior frontal gyrus. Left side corresponds to left hemisphere. [Color figure can be viewed in the online issue, which is available at wileyonlinelibrary.com.]
The clustering process underpinning SPC is a form of data reduction. Some form of data reduction is essential before inferences can be drawn from a network comprising millions of voxel level connections. Voxel clustering is an ideal data reduction strategy here, given that the spatial extent of the effects we seek to identify are at a regional level and are likely to extend beyond the confines of an isolated voxel.
From Pairwise Clusters to a Network
SPC in itself does not yield a measure of the statistical significance of a pairwise cluster. In particular, the two thresholds controlling the operation of SPC—namely the t‐statistic threshold of 5 and the pairwise cluster threshold of 50 voxel pairs—were chosen rather arbitrarily and cannot be translated to a P value that is corrected for multiple comparisons.
To determine a corrected P value, the network‐based statistic (NBS) was utilized [Zalesky et al.,2010b]. The NBS seeks to interconnect pairwise clusters identified by SPC to form an interconnected network. A corrected P value can then be ascribed to any resulting network based on its size. In the context of the NBS, each pairwise cluster identified by SPC corresponds to a link, while each cluster of voxels residing at either end of such a link corresponds to a node.
The NBS was implemented as follows: SPC identified a total of eight links (see Results, Fig. 4). Given each link necessarily comprised two nodes, a total of 16 nodes were present. Expectedly, it was observed that many of these 16 nodes overlapped spatially namely, many nodes shared a common set of voxels. Note that spatial overlap was only possible between nodes associated with different links. Therefore, any spatial overlap indicated the presence of a region from which multiple aberrant connections originated. The union was taken between any groups of overlapping nodes (see Supporting Information, Fig. S1). A pair of nodes was deemed to overlap if at least a single voxel was common to both nodes. The overlap was much greater in practice.
After the union was taken between any groups of overlapping nodes, a set of 8 spatially distinct nodes remained. Nodes resulting after the union were called merged nodes. Each merged node inherited the links of the overlapping nodes from which it was established. Therefore, if a union was taken over n spatially overlapping nodes, the resulting merged node was necessarily associated with n links and was thus of degree n.
The eight merged nodes together with their 8 inherited links formed a connected network (see Results, Fig. 5). Note that a network is said to be connected if a path exists between all possible node pairs. Permutation testing [Nichols and Holmes,2001] was used to determine the probability of finding a connected network of eight or more links as a matter of chance under the null hypothesis. In particular, participants were randomly exchanged between the schizophrenia and control groups to generate 2,000 independent permutations. The entire processing pipeline was then repeated for each permutation from the stage of SPC (functional connectivity need not be recomputed for each new permutation). For each permutation, the number of links comprising the largest network component was stored and constituted a sample from the null distribution. A corrected P value for the observed network was then calculated as the proportion of permutations for which the number of links comprising the largest network component was greater than or equal to the number of links comprising the observed network.
Figure 5.

Each of the eight links shown in Figure 4 consists of two spatially distinct clusters of voxels, referred to as nodes. Significant spatial overlap was noted between subsets of these nodes, indicating the presence of a network. Spatially overlapping nodes were merged, yielding a network of eight distinct nodes interconnected via eight links. Finding a connected network comprising eight links as a matter of chance was assessed using the network‐based statistic (NBS) and was found to be P = 0.02 (corrected). PFC: prefrontal cortex (dorsomedial); Ins: posterior insula and parietal operculum; SFG: precentral gyrus extending to superior frontal gyrus; Para: paracentral lobule extending to midcingulate cortex; PreC: precuneus (dorsal); PVC: primary visual cortex; Occ: occipital cortex (dorsal). Left side corresponds to the left hemisphere. The slight variation in nodal diameter does not reflect any particular nodal property. [Color figure can be viewed in the online issue, which is available at wileyonlinelibrary.com.]
In summary, three levels of resolution were considered in our entire analysis, from finest to coarsest
-
1
Voxel level: voxel pairs (most basic unit of connectivity);
-
2
Link level: pairwise clusters of supra‐threshold voxel pairs; and
-
3
Network level: networks formed by interconnected pairwise clusters.
Statistical significance was tested at the network level using the NBS. Note that it was not possible to declare significant any specific pairwise cluster in isolation, it was only possible to reject the null hypothesis at the level of the network to which a pairwise cluster belonged. An overview of our analysis pipeline is shown in Figure 2.
Intra‐Nodal Homogeneity
A node comprised a group of spatially contiguous voxels. The temporal correlation was measured between all possible pairs of voxels comprising a node using Pearson's correlation coefficient. Intra‐nodal homogeneity was then defined as the average correlation coefficient across all possible voxel pairs within a node. A two‐sample t‐statistic was calculated for each node to test the null hypothesis of equality in the mean value of intra‐nodal homogeneity between groups. In a previous study, Kendall's coefficient of concordance was used to demonstrate a loss in regional homogeneity in schizophrenia [Liu et al.,2006; Zang et al.,2004]. More recently, in childhood onset schizophrenia, reductions in regional homogeneity were identified in almost every region comprising a 111‐region subdivision of the cerebrum [Alexander et al.,2010].
Oscillation Amplitude
A loss in the amplitude of low‐frequency oscillations is a second “regional/nodal” mechanism, additional to reductions in intra‐nodal homogeneity, which has been noted in schizophrenia [Hoptman et al.,2010]. Loss in oscillation amplitude is a possible cause of functional dysconnectivity due to the fact that it can manifest as a reduction in inter‐nodal correlation. Oscillation amplitude was measured separately for each node using the more general measure of power spectral density (PSD). The node‐averaged time series was computed for each node by averaging across the time courses of all voxels comprising a node. A one‐sided PSD was estimated for the node‐averaged time series using the periodogram spectral estimator with a Hamming window. The area under the PSD curve was then computed over the frequency interval of interest (0.01–0.1 Hz), which provided an estimate of average signal power. A two‐sample t‐statistic was calculated for each node to test the null hypothesis of equality in the mean value of average signal power measured in units of dB between groups. While we use the terms signal power and oscillation amplitude interchangeably, it is important to note that amplitude is in fact proportional to the square root of power [Zang et al.,2007].
Association Between Attributes
We tested whether the extent of loss in the integrity of a node was associated with the extent of disruption to the functional connections that originate from it. In particular, for the people with schizophrenia, the existence of a linear association was tested using Pearson's correlation coefficient between all three possible pairings of: functional connectivity (i.e. inter‐nodal correlation), intra‐nodal homogeneity and oscillation amplitude. This was repeated separately for each node.
RESULTS
Functional connectivity was measured between all possible 93.4 million pairs of cortical and subcortical voxels in each participant. For each voxel pair, a two‐sample t‐test was performed to test the null hypothesis of equality in the mean value of connectivity between controls and people with schizophrenia. The null hypothesis was not rejected for any voxel pairs for a false discovery rate threshold of 5%. A total of 8,205 voxel pairs survived the t‐statistic threshold, of which 6,620 were separated by at least 10 mm. SPC (see Materials and Methods) was used to cluster these 6,620 supra‐threshold voxel pairs for which connectivity was significantly reduced in people with schizophrenia. A total of eight pairwise clusters were identified comprising 50 or more voxel pairs (see Fig. 4). Each pairwise cluster represented a pair of regions between which functional connectivity was reduced in people with schizophrenia. The sign of the correlation was positive for each of the eight pairwise clusters identified.
No pairwise clusters were identified in which functional connectivity was increased in schizophrenia. While the absence of increased functional connectivity is consistent with the majority of graph‐based studies in schizophrenia [He and Evans,2010; Liang et al.,2006; Liu et al.,2008; Lynall et al.,2010; Wang et al.,2010], some studies using seed correlation analyses have reported increases in functional connectivity with the seed region as well as increases in connectivity between particular ICA components [Whitfield‐Gabrieli et al.,2009; Zhou et al.,2007]. See Fornito and Bullmore [2010a], for a review.
Network Formation
Each of the eight pairwise clusters identified consisted of a pair of spatially distinct nodes and therefore defined a total of 16 nodes. Spatial overlap was noted between some subsets of these 16 nodes. The extent of spatial overlap between groups of overlapping nodes was between 40 and 90%, except for the insula/operculum node. Overlapping subsets of nodes were merged to form a single node. Each merged node inherited the links of the overlapping nodes from which it was established, which resulted in a network of eight merged nodes interconnected via eight links (see Fig. 5). With a degree of 4, the visual (PVC) and insula/operculum (Ins) nodes were the origin of the greatest number of dysfunctional connections, followed by nodes at the paracentral lobule (Para) and the node representing the left precentral gyrus extending to the superior frontal gyrus (SFG), both with a degree of 2.
The network shown in Figure 5 is connected in the sense that a path can be found between any pair of nodes. The probability of finding a connected network comprising eight links as a matter of chance under the null hypothesis was found to be P = 0.02, corrected with the NBS.
Intra‐Nodal Homogeneity
Intra‐nodal homogeneity as well as the amplitude of oscillations was calculated separately for each of the eight nodes shown in Figure 5. Intra‐nodal homogeneity was significantly reduced in schizophrenia (P < 0.05) for all nodes except the prefrontal cortex (PFC) and precuneus (PreC) nodes, which showed only a trend towards diminished homogeneity (see Fig. 6). The reduction in intra‐nodal homogeneity was between 29 and 33%.
Figure 6.

Intra‐nodal homogeneity was measured for each of the eight nodes depicted in Figure 5. Homogeneity quantified the extent of loss in synchrony between neuronal populations within a node. Intra‐nodal homogeneity was significantly reduced (P < 0.05) in people with schizophrenia for all nodes marked with a star (*). The reduction in intra‐nodal homogeneity for nodes marked with a star was between 29 and 33%. Blue boxes correspond to people with schizophrenia. The central mark is the median, the edges of the box correspond to the 25th and 75th percentile, and the whiskers extend to the most extreme data points. [Color figure can be viewed in the online issue, which is available at wileyonlinelibrary.com.]
Oscillation Amplitude
The area under the power spectral density curve was used to quantify the average signal amplitude at each node in the frequency range of interest. Amplitude was expressed in units of decibels (dB). The amplitude of low‐frequency oscillations was significantly reduced in schizophrenia (P < 0.05) for all nodes except the prefrontal cortex (PFC), insula/operculum (Ins) and dorsal occipital (Occ) nodes, which showed only a trend toward abnormally low amplitude. Controls exhibited a distinct peak in signal amplitude at a frequency of 0.02 to 0.03 Hz, whereas a commensurate peak was absent in the schizophrenia group (see Fig. 7).
Figure 7.

The power spectrum density (PSD) was computed for each of the eight nodes depicted in Figure 5. The median PSD is plotted in blue for people with schizophrenia and red for controls. The area under the PSD is the average signal power and was found to be significantly lower (P < 0.05) in the schizophrenia group for all nodes marked with a star (*). [Color figure can be viewed in the online issue, which is available at wileyonlinelibrary.com.]
Relation Between Within‐Region Deficits and Inter‐Regional Connectivity
We hypothesized that the extent of loss in the integrity of a node was related to the extent of disruption to its functional connectivity with other regions. For a node from which multiple connections originated, such as the node representing the primary visual cortex (PVC) in Figure 5, the average value of connectivity across all connections originating from it was defined to be the value of that node's functional connectivity. It was found that in the schizophrenia group: (i) the extent of reduction in a node's connectivity with other regions was positively correlated with the extent of loss in that node's homogeneity, for the precuneus (PreC), paracentral (Para), visual (PVC) and frontal (SFG) nodes; and, (ii) the extent of reduction in a node's connectivity with other regions was positively correlated with the extent of loss in oscillation amplitude in the paracentral (Para) and precuneus (PreC) nodes. Also in the schizophrenia group, for all nodes except prefrontal (PFC) and right frontal (SFG), a strong positive association (P < 0.01) was found between the reduction in intra‐nodal homogeneity and the extent of loss in oscillation amplitude (i.e. the greater the reduction in a node's intra‐nodal homogeneity, the greater the extent of loss in oscillation amplitude). See Supporting Information Table I for a detailed tabulation of these associations as well as details of similar associations identified in the control group. Scatter plots for each of the three associations tested are shown in Figure 8 for a single representative node (precuneus).
Figure 8.

Scatter plots showing the strong linear association between the extent of disruption to the functional connections originating from the precuneus (PreC) node shown in Figure 5 and the extent of decoherence within this node. Each cross represents a person with schizophrenia, while each circle represents a healthy control. [Color figure can be viewed in the online issue, which is available at wileyonlinelibrary.com.]
DISCUSSION
Functional imaging has provided ample support for theories purporting that schizophrenia is a disorder of abnormal functional connectivity [Bluhm et al.,2007; Calhoun et al.,2004; Fornito et al., in press; Garrity et al.,2007; Liu et al.,2008; Lynall et al.,2010; Meyer‐Lindenberg et al.,2001; Rotarska‐Jagiela et al.,2010]. In many of these studies, functional connectivity has been measured as the extent of temporal correlation between the oscillatory fluctuations recorded during functional MRI at anatomically distinct brain regions. A loss in functional connectivity has been quantified by a loss of inter‐regional correlation.
Our finding of reduced functional connectivity in prefrontal and insula/opercular regions accords well with structural imaging and neuropathological evidences implicating these areas in the pathophysiology of schizophrenia [Ellison‐Wright et al.,2009,2008; Fornito et al.,2009a,b; Harrison,1999; Takahashi et al.,2009] The fact that our analysis, which made no prior assumptions about the regional distribution of connectivity changes in patients, also found evidence of disrupted connectivity in these areas supports this earlier work and provides strong evidence for the involvement of these systems in the disorder's pathophysiology. Together, these results suggest that grey matter reductions in the disorder may be related to functional connectivity abnormalities, as recently demonstrated in neurodegenerative conditions [Seeley et al.,2009]. Understanding genetic contributions to these brain changes [Fornito et al., 2011; Glahn et al.,2010] will be an important goal for future research.
In addition, we found altered connectivity of posterior regions, particularly in occipitoparietal cortices. Interestingly, we have also found evidence for reduced anatomical connectivity of posterior cortical regions in schizophrenia [Zalesky et al.,2011], suggesting an anatomical basis for these functional connectivity abnormalities. Abnormalities in the visual cortex have been reported in schizophrenia [Yoon et al.,2010], including reduced fractional anisotropy [Agartz et al.,2001; White et al.,2011], as well as links to fronto‐temporal dysfunction [Sehatpour et al.,2010], although they are seldom focused on in imaging studies [Onitsuka et al.,2007]. This may reflect the fact that most methods for analyzing functional connectivity require a priori definition of the regions‐of‐interest, and most investigators choose to focus on frontal and temporal regions. One advantage of our approach is that it examines connectivity deficits in a regionally unbiased manner, allowing identification of potentially novel connectivity disturbances. In particular, our approach represents a coherent, seed‐free, parcellation‐free framework for performing explicit between‐group resting‐state analysis.
The possible causes of reported losses in inter‐regional correlation are many and varied, including differences in signal phase or frequency, as well as losses in signal amplitude or losses in intra‐regional signal homogeneity (see Fig. 1). These possible causes have not been quantitatively investigated. Instead, aberrant functional connectivity has generally been interpreted qualitatively and construed to mean an expression of the brain's inability to properly integrate neural processes segregated across distributed regions.
Another possibility is that aberrant connectivity has a more “local” origin, in that it reflects neuronal/synaptic dysfunction within cortical and subcortical structures per se, as opposed to reflecting disturbed interactions between structures. Understanding the mechanistic causes of aberrant functional connectivity in schizophrenia is crucial, for it may ultimately provide a means to elucidate the corresponding pathophysiological basis of aberrant connectivity, either abnormal synaptic signaling [McGlashan et al.,2000; Stephan et al.,2009], disrupted axonal connectivity [Konrad et al.,2008; Kubicki et al.,2005; Zalesky et al.,2011], or both.
A significant loss in intra‐nodal homogeneity (29%–33%) was identified within every abnormal node identified in this study, except the prefrontal cortex (PFC) and precuneus (PreC) nodes, which only showed a trend toward reduction (see Fig. 6). Intra‐nodal homogeneity quantifies the extent to which distinct anatomical locations (voxels) within a node are oscillating in synchrony. Strong intra‐nodal homogeneity is necessary to ensure the node‐averaged signal used to make connectivity measurements is coherent. In particular, if oscillations are not fluctuating in synchrony across distinct voxels within a node, taking the average across all these unsynchronized oscillations results in a node‐averaged signal that is of low amplitude and potentially indistinguishable from background noise. Indeed, this is confirmed by the fact that a significant loss in the amplitude of the node‐averaged signal (40%–60%) was identified in the schizophrenia group for every node comprising the disturbed network, except the insula/operculum (Ins), prefrontal cortex (PFC) and occipital (Occ) nodes, which only showed a trend effect (see Fig. 7). A recent study [Hoptman et al.,2010] of alterations in the amplitude of low‐frequency oscillations in schizophrenia also identified amplitude reductions within the left insula and occiptal regions as well as the right caudate, but additionally reported increased amplitude in schizophrenia within the prefrontal cortex. While we also identified reductions within the left insula and occipital regions, we did not identify any regional increases in signal amplitude. This may be due to the fact that our analysis of signal amplitude was confined to the nodes between which functional connectivity was altered, as opposed to the entire cortex, and the fact that we considered a slightly different measure of signal amplitude.
We contend that altered inter‐regional coupling and local dysfunction are related, given that altered coupling was never found in the absence of local dysfunction. There are two possible explanations for the co‐occurrence of these two abnormalities. One is that local dysfunction in a region, brought about either by altered synaptic signaling, abnormalities in short‐range dendritic or axonal branching patterns, or altered neuronal architecture, causes changes in the way that a region communicates with other areas. In this case, local dysfunction causes altered inter‐regional functional connectivity. The other potential explanation is that altered inter‐regional connectivity affects neuronal signaling within a region. Each neuron depends on inputs from its neighbors as well as other regions. Aberrant connectivity with other regions will affect the function of that neuron and its communication with adjacent elements. In this scenario, altered inter‐regional coupling, possibly caused by axonal damage, causes local dysfunction. Adjudicating between these two possibilities is very difficult using current imaging technology. Our findings however suggest two conclusions:
-
1
There is a tight link between inter‐regional connectivity changes and regionally localized function; and
-
2
For some connections, but not all, this link is expressed through local dysfunction resulting in reduced regional signal power.
To conclude, Figure 9 provides a summary of the three functional connectivity deficits identified in schizophrenia. While it was not possible to determine a chain of cause and effect, it was found that the extent to which inter‐regional correlation was reduced between a pair of nodes can be accurately predicted by the extent of local decoherence evident within the nodes per se. This suggests measurement of aberrant functional connectivity in schizophrenia is both a measurement of altered coupling between regions as well as a measurement of local decoherence within regions.
Figure 9.

Three abnormal attributes of functional connectivity were identified in people with schizophrenia: (i) a loss in intra‐nodal homogeneity (nodal/regional attribute); (ii) a loss in amplitude of low‐frequency oscillations in the band 0.02 to 0.03 Hz (nodal/regional attribute); and (iii) a reduction in inter‐nodal correlation. Note that the signals depicted are representative only. [Color figure can be viewed in the online issue, which is available at wileyonlinelibrary.com.]
Methodological Considerations
The primary limitation of this study was the relatively small sample size of schizophrenia group. In addition, all people with schizophrenia were medicated. Recent evidence suggests that antipsychotics exert a relatively rapid and reversible effect on functional brain connectivity [Tost et al.,2010], and the fact that our patients were withdrawn from medication on the day of scanning may have mitigated against such acute effects. Nonetheless, longer‐term effects cannot be ruled out [Lui et al.,2010].
While the statistical analysis used in this study eliminated all potential biases stemming from an arbitrary cortical subdivision or choice of seed region, a disadvantage of our method was the need to preselect two distinct thresholds. In particular, a t‐statistic threshold of 5 was chosen to split the set of all voxel pairs into two mutually exclusive subsets, after which a second threshold of 50 voxel pairs was chosen to split the set of all pairwise clusters. This kind of cluster formation of supra‐threshold elements is statistically valid and a relatively common strategy [Hayasaka et al.,2004; Nichols and Holmes,2001; Zalesky et al.,2010b], however, results may be contingent on the specific choice of threshold. Note that this is analogous to traditional cluster‐based thresholding techniques in voxel‐wise fMRI activation studies. In such work a primary, cluster‐forming threshold is first applied, typically P < 0.001. The size of clusters resulting from this primary threshold is then tested for significance using established multiple comparison procedures, and the null hypothesis is rejected at the level of entire activation clusters, rather than single voxels. In both this traditional application, and our network‐based extension of the methodology, the choice of the primary threshold should be based on the size and nature of the expected effects. As there is no available literature to guide this choice in our context, we arbitrarily chose t > 5 as the primary threshold.
Another limitation was the potential for a systematic reduction of brain volume in the schizophrenia group, which may have disrupted the accuracy of the spatial normalization of the patient EPI volumes. This is a limitation that is shared by most patient‐control studies relying on spatial normalization.
It was not possible to entirely exclude the existence of spurious correlations induced by structured noise, such as head movement, high‐frequency aliasing, scanner‐induced noise, etc. [Cole et al.,2010]. Various preprocessing steps were implemented to alleviate this kind of structured noise (e.g. accounting for fluctuations in ventricles and white‐matter, removal of mean global signal, etc.).
Finally, recent evidence suggests that neural dynamics may be more broadband than the typical bandpass (0.01–0.1 Hz) implemented in most resting‐state studies, including this study [Fornito et al., 2011; Smith et al.,2008]. Oscillations outside this bandpass were not considered due to concerns of susceptibility to physiological noise.
Our method is computationally demanding. However, it is important to note that the most burdensome computational tasks involved in implementing our method are parallelizable. For example, each of the millions of pairwise correlation calculations can be executed concurrently on separate processors, as with each permutation. The analysis of larger sample sizes can therefore be accomplished with adequate parallelization.
Potential associations between connectivity and clinical measures were not tested in this study primarily due to the rather small size of the schizophrenia cohort (12 patients in total), which renders the risk of false negatives high for the purpose of a correlation analysis of this sort.
Supporting information
Additional Supporting Information may be found in the online version of this article.
Supporting Information.
REFERENCES
- Agartz I, Andersson JLR, Skare S ( 2001): Abnormal brain white matter in schizophrenia: A diffusion tensor imaging study. Neuroreport 12: 2251–2254. [DOI] [PubMed] [Google Scholar]
- Alexander‐Bloch AF, Gogtay N, Meunier D, Birn R, Clasen L, Lalonde F, Lenroot R, Giedd J, Bullmore ET ( 2010): Disrupted modularity and local connectivity of brain functional networks in childhood‐onset schizophrenia. Front Syst Neurosci 4: 147. [DOI] [PMC free article] [PubMed] [Google Scholar]
- Biswal B, Yetkin FZ, Haughton VM, Hyde JS ( 1995): Functional connectivity in the motor cortex of resting human brain using echo‐planar MRI. Magn Reson Med 34: 537–541. [DOI] [PubMed] [Google Scholar]
- Bluhm RL, Miller J, Lanius RA, Osuch EA, Boksman K, Neufeld RW, Theberge J, Schaefer B, Williamson P ( 2007): Spontaneous low‐frequency fluctuations in the BOLD signal in schizophrenic patients: Anomalies in the default network. Schizophr Bull 33: 1004–1012. [DOI] [PMC free article] [PubMed] [Google Scholar]
- Buckner RL, Andrews‐Hanna JR, Schacter DL ( 2008): The brain's default network: Anatomy, function, and relevance to disease. Ann NY Acad Sci 1124: 1–38. [DOI] [PubMed] [Google Scholar]
- Bullmore ET, Frangou S, Murray RM ( 1997): The dysplastic net hypothesis: An integration of developmental and dysconnectivity theories of schizophrenia. Schizophr Res 28: 143–156. [DOI] [PubMed] [Google Scholar]
- Calhoun VD, Kiehl KA, Liddle PF, Pearlson GD ( 2004): Aberrant localization of synchronous hemodynamic activity in auditory cortex reliably characterizes schizophrenia. Biol Psychiatry 55: 842–849. [DOI] [PMC free article] [PubMed] [Google Scholar]
- Cole DM, Smith SM, Beckmann CF ( 2010): Advances and pitfalls in the analysis and interpretation of resting‐state FMRI data. Front Syst Neurosci 4: 8. [DOI] [PMC free article] [PubMed] [Google Scholar]
- Cordes D, Haughton VM, Arfanakis K, Carew JD, Turski PA, Moritz CH, Quigley MA, Meyerand ME ( 2001): Frequencies contributing to functional connectivity in cerebral cortex in “resting‐state” data. Am J Neuroradiol 22: 1326–1333. [PMC free article] [PubMed] [Google Scholar]
- Demirci O, Stevens MC, Andreasen NC, Michael A, Liu J, White T, Pearlson GD, Clark VP, Calhoun VD ( 2009): Investigation of relationships between fMRI brain networks in the spectral domain using ICA and Granger causality reveals distinct differences between schizophrenia patients and healthy controls. Neuroimage 46: 419–431. [DOI] [PMC free article] [PubMed] [Google Scholar]
- Ellison‐Wright I, Glahn DC, Laird AR, Thelen SM, Bullmore E ( 2008): The anatomy of first‐episode and chronic schizophrenia: an anatomical likelihood estimation meta‐analysis. Am J Psychiatry 165: 1015–1023. [DOI] [PMC free article] [PubMed] [Google Scholar]
- Ellison‐Wright I, Bullmore E ( 2009): Meta‐analysis of diffusion tensor imaging studies in schizophrenia. Schizophr Res 108: 3–10. [DOI] [PubMed] [Google Scholar]
- Fornito A, Yucel M, Dean B, Wood SJ, Pantelis C ( 2009a) Anatomical abnormalities of the anterior cingulate cortex in schizophrenia: Bridging the gap between neuroimaging and neuropathology. Schizophr Bull 35: 973–993. [DOI] [PMC free article] [PubMed] [Google Scholar]
- Fornito A, Yucel M, Patti J, Wood SJ, Pantelis C ( 2009b) Mapping grey matter reductions in schizophrenia: An anatomical likelihood estimation analysis of voxel‐based morphometry studies. Schizophr Res 108: 104–113. [DOI] [PubMed] [Google Scholar]
- Fornito A, Bullmore ET ( 2010a): What can spontaneous fluctuations of the blood oxygenation‐level‐dependent signal tell us about psychiatric disorders? Curr Opin Psychiatry 23: 239–249. [DOI] [PubMed] [Google Scholar]
- Fornito A, Zalesky A, Bullmore ET ( 2010b): Network scaling effects in graph analytic studies of human resting‐state FMRI data. Front Syst Neurosci 4: 22. [DOI] [PMC free article] [PubMed] [Google Scholar]
- Fornito A, Yoon J, Zalesky A, Bullmore ET, Carter CS: General and specific functional connectivity disturbances in first‐episode schizophrenia during cognitive control performance. Biol Psychiatry (in press). [DOI] [PMC free article] [PubMed] [Google Scholar]
- Fornito A, Zalesky A, Bassett DS, Meunier D, Ellison‐Wright I, Yucel M, Wood SJ, Shaw K, O'Connor J, Nertney D, Mowry BJ, Pantelis C, Bullmore ET ( 2011a) Genetic influences on cost‐efficient organization of human cortical functional networks. J Neurosci 31: 3261–3270. [DOI] [PMC free article] [PubMed] [Google Scholar]
- Fox MD, Snyder AZ, Vincent JL, Corbetta M, Van Essen DC, Raichle ME ( 2005): The human brain is intrinsically organized into dynamic, anticorrelated functional networks. Proc Natl Acad Sci USA 102: 9673–9678. [DOI] [PMC free article] [PubMed] [Google Scholar]
- Fransson F ( 2005): Spontaneous low‐frequency BOLD signal fluctuations: An fMRI investigation of resting‐state default mode of brain function hypothesis. Hum Brain Mapp 26: 15–29. [DOI] [PMC free article] [PubMed] [Google Scholar]
- Friston KJ ( 1994): Functional and effective connectivity in neuroimaging: A synthesis. Hum Brain Mapp 2: 56–78. [Google Scholar]
- Friston KJ, Frith CD ( 1995): Schizophrenia: A disconnection syndrome? Clin Neurosci 3: 89–97. [PubMed] [Google Scholar]
- Garrity AG, Pearlson GD, McKiernan K, Lloyd D, Kiehl KA, Calhoun VD ( 2007): Abberant “default mode” functional connectivity in schizophrenia. Am J Psychiatry 164: 450–457. [DOI] [PubMed] [Google Scholar]
- Girvan M, Newman MEJ ( 2002): Community structure in social and biological networks. Proc Natl Acad Sci USA 99: 7821–7826. [DOI] [PMC free article] [PubMed] [Google Scholar]
- Glahn DC, Winkler AM, Kochunov P, Almasy L, Duggirala R, Carless MA, Curran JC, Olvera RL, Laird AR, Smith SM, Beckmann CF, Fox PT, Blangero J ( 2010): Genetic control over the resting brain. Proc Natl Acad Sci USA 107: 1223–1228. [DOI] [PMC free article] [PubMed] [Google Scholar]
- Hampson M, Peterson BS, Skudlarski P, Gatenby JC, Gore JC ( 2002): Detection of functional connectivity using temporal correlations in MR images. Hum Brain Mapp 15: 247–262. [DOI] [PMC free article] [PubMed] [Google Scholar]
- Harrison PJ ( 1999): The neuropathology of schizophrenia: A critical review of the data and their interpretation. Brain 122: 593–624. [DOI] [PubMed] [Google Scholar]
- Hayasaka S, Laurienti P ( 2009): Comparison of characteristics between region‐ and voxel‐based network analyses in resting‐state fMRI data. Neuroimage 50: 499–508. [DOI] [PMC free article] [PubMed] [Google Scholar]
- Hayasaka S, Nichols TE ( 2004): Combining voxel intensity and cluster extent with permutation test framework. Neuroimage 23: 54–63. [DOI] [PubMed] [Google Scholar]
- He Y, Evans A ( 2010): Graph theoretical modeling of brain connectivity. Curr Opin Neurol 23: 341–350. [DOI] [PubMed] [Google Scholar]
- Hoptman MJ, Zuo XN, Butler PD, Javitt DC, D'Angelo D, Mauro CJ, Milham MP ( 2010): Amplitude of low‐frequency oscillations in schizophrenia: A resting‐state fMRI study. Schizophr Res 117: 13–20. [DOI] [PMC free article] [PubMed] [Google Scholar]
- Jafri MJ, Pearlson GD, Stevens M, Calhoun VD ( 2008): A method for functional network connectivity among spatially independent resting‐state components in schizophrenia. Neuroimage 39: 1666–1681. [DOI] [PMC free article] [PubMed] [Google Scholar]
- Konrad A, Winterer G ( 2008): Disturbed structural connectivity in schizophrenia‐primary factor in pathology or epiphenomenon? Schizophr Bull 34: 72–92. [DOI] [PMC free article] [PubMed] [Google Scholar]
- Kubicki M, McCarley RW, Shenton ME ( 2005): Evidence for white matter abnormalities in schizophrenia. Curr Opin Psychiatry 18: 121–134. [DOI] [PMC free article] [PubMed] [Google Scholar]
- Liu Y, Liang M, Zhou Y, He Y, Hao Y, Song M, Yu C, Liu H, Liu Z, Jiang T ( 2008): Disrupted small‐world networks in schizophrenia. Brain 131: 945–961. [DOI] [PubMed] [Google Scholar]
- Liu H, Liu Z, Liang M, Hao Y, Tan L, Kuang F, Yi Y, Xu L, Jiang T ( 2006): Decreased regional homogeneity in schizophrenia: A resting state functional magentic resonance imaging study. Neuroreport 17: 19–22. [DOI] [PubMed] [Google Scholar]
- Liang M, Zhou Y, Jiang T, Liu Z, Tian L, Liu H, Hao Y ( 2006): Widespread functional disconnectivity in schizophrenia with resting‐state functional magnetic resonance imaging. Neuroreport 17: 209–213. [DOI] [PubMed] [Google Scholar]
- Lynall ME, Bassett DS, Kerwin R, McKenna PJ, Kitzbichler M, Muller U, Bullmore E ( 2010): Functional connectivity and brain networks in schizophrenia. J Neurosci 30: 9477–9487. [DOI] [PMC free article] [PubMed] [Google Scholar]
- Lui S, Li T, Deng W, Jiang L, Wu Q, Tang H, Yue Q, Huang X, Chan RC, Collier DA, Meda SA, Pearlson G, Mechelli A, Sweeney JA, Gong Q ( 2010): Short‐term effects of antipsychotic treatment on cerebral function in drug‐naive first‐episode schizophrenia revealed by “resting state” functional magnetic resonance imaging. Arch Gen Psychiatry 67: 783–792. [DOI] [PubMed] [Google Scholar]
- McGlashan TH, Hoffman RE ( 2000): Schizophrenia as a disorder of developmentally reduced synaptic connectivity. Arch Gen Psychiatry 57: 637–648. [DOI] [PubMed] [Google Scholar]
- Meyer‐Lindenberg A, Poline JB, Kohn PD, Holt JL, Egan MF, Weinberger DR, Berman KF ( 2001): Evidence for abnormal cortical functional connectivity during working memory in schizophrenia. Am J Psychiatry 158: 1809–1817. [DOI] [PubMed] [Google Scholar]
- Nelson H ( 1992): National Adult Reading Test (NART): Test Manual. Windsor, UK: National Foundation for Educational Research. [Google Scholar]
- Nichols TE, Holmes AP ( 2001): Nonparametric permutation tests for functional neuroimaging: A primer with examples. Hum Brain Mapp 15: 1–25. [DOI] [PMC free article] [PubMed] [Google Scholar]
- Onitsuka T, McCarley RW, Kuroki N, Dickey CC, Kubicki M, Demeo SS, Frumin M, Kikinis R, Jolesz FA, Shenton ME ( 2007): Occipital lobe gray matter volume in male patients with chronic schizophrenia: A quantitative MRI study. Schizophr Res 92: 197–206. [DOI] [PMC free article] [PubMed] [Google Scholar]
- Rotarska‐Jagiela A, van de Ven V, Oertel‐Knochel V, Uhlhaas PJ, Vogeley K, Linden DEJ ( 2010): Resting‐state functional network correlates of psychotic symptoms in schizophrenia. Schizophr Res 117: 21–30. [DOI] [PubMed] [Google Scholar]
- Rubinov M, Knock SA, Stam CJ, Micheloyannis S, Harris AWF, Williams LM, Breakspear M ( 2009): Small‐world properties of nonlinear brain activity in schizophrenia. Hum Brain Mapp 30: 403–416. [DOI] [PMC free article] [PubMed] [Google Scholar]
- Seeley WW, Crawford RK, Zhou J, Miller BL, Greicius MD ( 2009): Neurodegenerative diseases target large‐scale human brain networks. Neuron 62: 42–52. [DOI] [PMC free article] [PubMed] [Google Scholar]
- Sehatpour P, Dias EC, Butler PD, Revheim N, Guilfoyle DN, Foxe JJ, Javitt DC ( 2010): Impaired visual object processing across an occipital‐frontal‐hippocampal brain network in schizophrenia: An integrated neuroimaging study. Arch Gen Psychiatry 67: 772–782. [DOI] [PMC free article] [PubMed] [Google Scholar]
- Smith S. Niazy R. Beckmann C, Miller K ( 2008): Resting state networks: Neither low‐frequency nor anti‐correlated? In: Proceedings of the 14th Annual Meeting of the Organization for Human Brain Mapping. Melbourne, Australia.
- Smith SM, Fox PT, Miller KL, Glahn DC, Fox PM, Mackay CE, Filippini N, Watkins KE, Toro R, Laird AR, Beckmann CF ( 2009): Correspondence of the brain's functional architecture during activation and rest. Proc Natl Acad Sci USA 106: 13040–13045. [DOI] [PMC free article] [PubMed] [Google Scholar]
- Smith SM, Miller KL, Salimi‐Korshidi G, Webster M, Beckmann CF, Nichols TE, Ramsey JD, Woolrich MD ( 2011): Network modelling methods for FMRI. Neuroimage 54: 875–891. [DOI] [PubMed] [Google Scholar]
- Stephan KE, Friston KJ, Frith CD ( 2009): Dysconnection is schizophrenia: From abnormal synaptic plasticity to failures of self‐monitoring. Schizophr Bull 35: 509–527. [DOI] [PMC free article] [PubMed] [Google Scholar]
- Suckling J, Long C, Triantafyllou C, Brammer M, Bullmore E ( 2006): Variable precision registration via wavelets: Optimal spatial scales for inter‐subject registration of functional MRI. Neuroimage 31: 197–208. [DOI] [PubMed] [Google Scholar]
- Takahashi T, Wood SJ, Yung AR, Phillips LJ, Soulsby B, McGorry PD, Tanino R, Zhou SY, Suzuki M, Velakoulis D, Pantelis C ( 2009): Insular cortex gray matter changes in individuals at ultra‐high‐risk of developing psychosis. Schizophr Res 111: 94–102. [DOI] [PubMed] [Google Scholar]
- Tost H, Braus DF, Hakimi S, Ruf M, Vollmert C, Hohn F, Meyer‐Lindenberg A ( 2010): Acute D2 receptor blockade induces rapid, reversible remodeling in human cortical‐striatal circuits. Nat Neurosci 13: 920–922. [DOI] [PubMed] [Google Scholar]
- Van den Heuvel MP, Stam CJ, Boersma M, Hulshoff Pol HE ( 2008): Small‐world and scale‐free organization of voxel‐based resting‐state functional connectivity in the human brain. Neuroimage 43: 528–539. [DOI] [PubMed] [Google Scholar]
- Wang J, Zuo X, He Y ( 2010): Graph‐based network analysis of resting‐state functional MRI. Front Syst Neurosci 4: 16. [DOI] [PMC free article] [PubMed] [Google Scholar]
- Weinberger DR, Berman KF, Suddath R, Torrey EF ( 1992): Evidence of dysfunction of a prefrontal‐limbic network in schizophrenia: A magnetic resonance imaging and regional cerebral blood flow study of discordant monozygotic twins. Am J Psychiatry 149: 890–897. [DOI] [PubMed] [Google Scholar]
- White T, Magnotta VA, Bockholt HJ, Williams S, Wallace S, Ehrlich S, Mueller BA, Ho BC, Jung RE, Clark VP, Lauriello J, Bustillo JR, Schulz SC, Gollub RL, Andreasen NC, Calhoun VD, Lim KO ( 2011): Global white matter abnormalities in schizophrenia: A multisite diffusion tensor imaging study. Schizophr Bull 37: 222–232. [DOI] [PMC free article] [PubMed] [Google Scholar]
- Whitfield‐Gabrieli S, Thermenos HW, Milanovic S, Tsuang MT, Faraone SV, McCarley RW, Shenton ME, Green AI, Nieto‐Castanon A, LaViolette P, Wojcik J, Gabrieli JD, Seidman LJ ( 2009): Hyperactivity and hyperconnectivity of the default network in schizophrenia and in first‐degree relatives of persons with schizophrenia. Proc Natl Acad Sci USA 106: 1279–1284. [DOI] [PMC free article] [PubMed] [Google Scholar]
- Wig GS, Schlaggar BL, Petersen SE ( 2011): Concepts and principles in the analysis of brain networks. Ann N Y Acad Sci 1224: 126–146. [DOI] [PubMed] [Google Scholar]
- Yoon JH, Maddock RJ, Rokem A, Silver MA, Minzenberg MJ, Ragland JD, Carter CS ( 2010): GABA concentration is reduced in visual cortex in schizophrenia and correlates with orientation‐specific surround suppression. J Neurosci 30: 3777–3781. [DOI] [PMC free article] [PubMed] [Google Scholar]
- Zalesky A, Fornito A, Seal ML, Cocchi L, Westin CF, Bullmore E, Egan GF, Pantelis C ( 2011): Disrupted axonal fiber connectivity in schizophrenia. Biol Psychiatry 69: 80–89. [DOI] [PMC free article] [PubMed] [Google Scholar]
- Zalesky A, Fornito A, Harding IH, Cocchi L, Yucel M, Pantelis C, Bullmore ET ( 2010a): Whole‐brain anatomical networks: Does the choice of nodes matter? NeuroImage 50: 970–983. [DOI] [PubMed] [Google Scholar]
- Zalesky A, Fornito A, Bullmore ET ( 2010b) Network‐based statistic: Identifying differences in brain networks. Neuroimage 53: 1197–1207. [DOI] [PubMed] [Google Scholar]
- Zang Y, Jiang T, Lu Y, He Y, Tian L ( 2004): Regional homogeneity approach to fMRI data analysis. Neuroimage 22: 394–400. [DOI] [PubMed] [Google Scholar]
- Zang Y‐F, He Y, Zhu C‐Z, Cao Q‐J, Sui M‐Q, Liang M, Tian L‐X, Jiang T‐Z, Wang Y‐F ( 2007): Altered baseline brain activity in children with ADHD revealed by resting‐state functional MRI. Brain Dev 29: 83–91. [DOI] [PubMed] [Google Scholar]
- Zhou Y, Liang M, Tian L, Wang K, Hao Y, Liu H, Liu Z, Jiang T ( 2007): Functional disintegration in paranoid schizophrenia using resting‐state fMRI. Schizophr Res 97: 194–205. [DOI] [PubMed] [Google Scholar]
Associated Data
This section collects any data citations, data availability statements, or supplementary materials included in this article.
Supplementary Materials
Additional Supporting Information may be found in the online version of this article.
Supporting Information.