

Abstract
This article reports an interesting link between the psychophysical property of intentional control of perceptual switching and the underlying neural activities. First, we revealed that the timing of perceptual switching for a dynamical dot quartet can be controlled by the observers' intention, without eye movement. However, there is a clear limitation to this control, such that each animation frame of the stimulus must be presented for a sufficiently long time length; in other words, the frequency of the stimulus alternation must be sufficiently slow for the control. The typical stimulus onset asynchrony for a 50% level of success was about 275 ms for an average of 10 observers. On the basis of psychophysical property, we designed three experiments for investigating the neural process with a magnetoencephalography. They revealed that: (1) a peak component occurring about 300 ms after a reversal was stronger when the direction of perceived motion was switched intentionally than when it was not switched, and (2) neural components about 30–40 ms and 240–250 ms after the reversal of the stimulus animation were stronger when perception was altered intentionally than when it was switched unintentionally. The 300 ms component is consistent with a previous study about passive perceptual switching (Struber and Herrmann [ 2002]: Cogn Brain Res 14:370–382), but the intentional effect was seemed to be a different component from the well‐known P300 component. Hum Brain Mapp, 2011. © 2010 Wiley‐Liss, Inc.
Keywords: Intentional control, magnetoencephalography, perceptual switching, dynamical dot quartet, stimulus onset asynchrony
INTRODUCTION
Perceptual switching refers to the phenomenon where the perception of an image changes even though the same stimulus was presented [Necker, 1832; Ramachandran and Antis, 1983; Rubin, 1958]. This phenomenon has often been associated with stochastic neural processes, and an attractive phenomenon for understanding the neural processes behind perception that is independent of external changes [Leopold and Logothetis, 1999; Merk and Schnakenberg, 2002]. Recently, it has been reported that the duration of a particular perceptual state can be shortened/lengthened by directing attention to it [Meng and Tong, 2004; Suzuki and Peterson, 2000]. The acceleration/deceleration effect of the “timing” of perceptual switching by the observer's attention has often been called a “bias effect.” Moreover, a recent fMRI study demonstrated that the bias effect for ambiguous perception was associated with activity in the posterior parietal cortex, a part of the frontoparietal attentional control network [Slotnick and Yantis, 2005]. However, the intentional control of the exact timing of perceptual switching have not been reported because research utilizing static stimuli such as the Necker cube or Rubin's vase, is flawed in that the exact timing of perceptual switching is difficult to define since perception changes gradually with awareness. This article challenges the current understanding of attentional control of perceptual switching by bias effect and detection of underlying neural processes.
To avoid the problem of static stimuli, we used a dynamical dot quartet (DDQ) stimulus, which consists of a pair of dots at the upper left and lower right quadrants of the visual field, and a pair of dots at its lower left and upper right points that alternate positions with time. Observers recognize horizontal or vertical motion by identifying the horizontal or vertical pair of dots [Ramachandran and Antis, 1983; Rose and Buchel, 2005; Sterzer et al., 2003; Struber and Herrmann, 2002].
In the case of DDQ, the timing of perceptual switching can be nearly locked to stimulus alternations; therefore, the exact timing of perceptual switching for DDQ is easier to define than for static ambiguous stimuli. Interestingly, Kohler et al. [ 2008] recently reported that the frequency of perceptual switching can be shortened (or lengthened) by the observers' intention in DDQ perception. This clear effect has not been reported clearly for perception of other ambiguous stimuli. We expected that DDQ would be a good technique for controlling perception. On the other hand, Maloney et al. [ 2005] reported that the perceptual state for DDQ depended strongly on the past‐perceived direction of motion, by the priming effect. This suggests that perceptual control becomes more difficult if the duration of stimulus animations significantly increases.
On the basis of the background, we once limited the number of animation frames within a single trial to smaller than 5, and we requested that observers control the patterns of apparent motion, which consisted of five vertical/horizontal apparent motion sequences. The controllable ratio (%) was then defined as the ratio of trials in which observers controlled their perception during all five presentations. Furthermore, no previous studies using DDQ have investigated the relationship between the controllability and the length of stimulus onset asynchrony (SOA).
In the past research, Struber and Hermann [ 2002] reported the enhancement of P300‐like peak for perceptual switching, which was not triggered by their intention (passive switching) by waveform analysis. Therefore, upon the psychophysical knowledge about the dependency of controllability for SOA, we designed magnetoencephalography (MEG) experiments for answering the two questions as follows: (1) Whether can we observe enhancement of the P300 component in the case of intentional perceptual switching (active switching) in comparison to the case when switching does not occur too? (2) When comparing evoked components for active switching and also for passive switching directly does the intensity of P300 component or of any other component shows any significant difference?
We designed Experiments C and D to answer the first question, and performed Experiment E to answer the second question. Their relations are summarized in Figure 1c.
Figure 1.
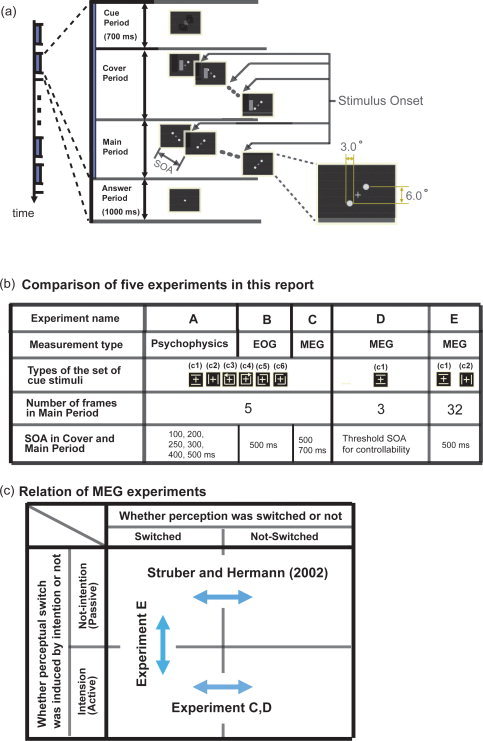
Time courses of stimuli for five independent experiments (Experiments A–E). (a) Sequence of stimulus presentation in one trial from the time course for the whole experiment is enlarged. One trial was separated into four periods (cue, cover, main, and answer periods). The lower right frame in (a) shows the size of the dots. We presented one of six types of cue stimuli in the cue period for 700 ms around the fixation point. The type of experiment (psychophysical experiment, EOG recording, or MEG recording) is shown in the second row in (b). The types of cue stimuli for Experiments A–E are shown in the third row in (b). During the cover period, an occluder masked the left or right dots and moved away gradually from the fixation point to the outside of the six animation frames. In the sixth and final frame of the cover period, the two dots were fully exposed, and in the next frame, corresponding to the first animation frame of the main period, the occluder disappeared. We refer to the timing of the alternation of the animation frame, in which a pair of dots is presented, as the stimulus onset, and we identify the time length of an animation frame in the cover period and the main period as the stimulus onset asynchrony (SOA). The numbers of the animation frames in the main periods are shown on the fourth row in (b), and the SOAs for the six experiments are shown on the fifth row. Observers were requested to perform tasks in the main period according to the cue and to respond normally by pressing a button during the answer period. In the answer period, only the fixation cross was shown for 1,000 ms. (c) The relationship between three MEG experiments and a previous work by Struber and Hermann. Here, we categorized them for four categories by whether the perceptual switches were triggered by intention or not, and by whether perception was changed or not.
In Experiment C, we measured neural activity by MEG in an experimental condition similar to Experiment A, and compared the difference in neural activities when perception was alternated and when it was not alternated, in which the SOA was tuned so that the success rate was nearly 100%. In Experiment D, we compared the difference in neural activities when the observers succeeded in switching the direction of the perceived motion and when they missed for the same stimulus, in which the SOA was tuned so that the success rate was 50%. In Experiment E, we compared the neural activity evoked when observers intended to switch their perceived motion with the neural activity occurring when the perceived motion was switched spontaneously, in which the success rate was nearly 100%.
These MEG measurements showed that: (1) the enhancement of P300 component can be observed in the case of active switching in comparison with the case when switching does not occur too (Experiments C and D) and (2) the latency of the evoked component showed a clear difference between active switching and passive switching, which was much earlier than 300 ms and the spatial map of the component was clearly different from that of the 300 ms component (Experiment E).
MATERIALS AND METHODS
Observers
Ten healthy right‐handed men (aged 23–31 years; mean 25.7, standard deviation 2.2) participated in the experiments after giving informed consent. All observers performed five experiments (one task per day), and they practiced each individual task for about 15 min just before each experiment. The time length of each task was about 20–40 min, and we divided them into sessions of 10 min each.
Visual Stimuli
We used a digital light processing projector (V‐1100Z; PLUS, Tokyo, Japan) to project visual stimuli onto a translucent screen (visual angle: 30° × 40°). Figure 1a shows the time course of the stimulus presentation. One trial consisted of four periods: cue, cover, main, and answer periods. A fixation cross (luminance: 60 cd/m2, visual angle: 3.0°) was shown at the center of the screen (Fig. 1a). The length of the cue period was 700 ms. We presented one of six cue stimuli near the fixation cross. For the cover and main periods, two white dots (luminance: 60 cd/m2, diameter: 3.0°) were presented diagonally, with respect to the fixation point in each animation frame, on a black background. We fixed the spacing between the centers of the two vertical dots at 6.0° (Fig. 1a). In addition to the two dots, we presented an occluder during the cue period. The occluder hides the left or right dot in the animation frame at the beginning of the period (Fig. 1a). After that, it moves away from the fixation cross gradually, within six animation frames. At the last of six frames, both dots appeared, and in the next frame the occluder disappeared. We told observers that the subsequent animation frame marked the beginning of the main period. During this period, it was necessary to unambiguously define the sequence and timings of perceptual switching for specific motion patterns. Therefore, the existence of the cue period was essential [Rose and Buchel, 2005; Yantis and Nakama, 1998]. As such, we provided the cover period to limit the direction of the perceived motion to a vertical one at the beginning of the main period. In this report, we refer to the timings of the alternation between animation frames as stimulus onsets (Fig. 1a). We then called the duration of an animation frame in the cover and main periods the SOA. Although we changed the SOA for each task, it stayed the same in the cover and main periods (Fig. 1b). We performed five experiments (Experiments A–E). In the main period of Experiments A–C, D, and E, we presented 5, 3, and 32 animation frames, respectively (Fig. 1b).
Task Design
The aim of Experiment A was to demonstrate the psychophysical phenomenon of intentional switching. In Experiment B, we performed EOG recordings to show whether or not intentional switching requires eye movement. In Experiments C–E, we performed MEG recordings while observers performed an expanded version of the task to identify neural processes underlying this cognitive function. In Experiment C, the task for observers was to control the sequence of apparent motions, consisting of five horizontal or vertical motions. In Experiment D, we observed differences in neural activity between when the perceived motion was switched (vertical to horizontal or horizontal to vertical) and it when it was not switched (vertical to vertical or horizontal to horizontal). In Experiment E, we measured the difference in neural activity between active and passive switching.
The more detailed description of these six experiments is as follows. As shown in the “Introduction” section, Experiments A–C are almost same except to the selection of SOA. In the three experiments, the cue stimuli indicated the sequence of (vertical or horizontal) motion, which observers had to try to perceive during the main period (Fig. 1b). The six types of cue stimuli, labeled as (c1), (c2), (c3), (c4), (c5), and (c6), indicated vertical motion, horizontal motion, clockwise and counterclockwise rotations, a combination of two lower‐left L‐shaped motions and an upper‐right inverted L‐shaped motion, and a left‐right reversed combination, respectively. Please refer to Figure 4a for clarification, noting that it is just a specific case in which the number of animation frames is 5. In Experiments A–C, we instructed observers to push the button under their forefinger when they succeeded in perfectly controlling vertical/horizontal directions of motion perceived at four stimulus onsets, and to push the button under their middle finger when they failed even once. Then, we defined the controllable ratio (%) as the ratio of trials in which the observers pushed the button under their forefinger to the total number of trials.
Figure 4.
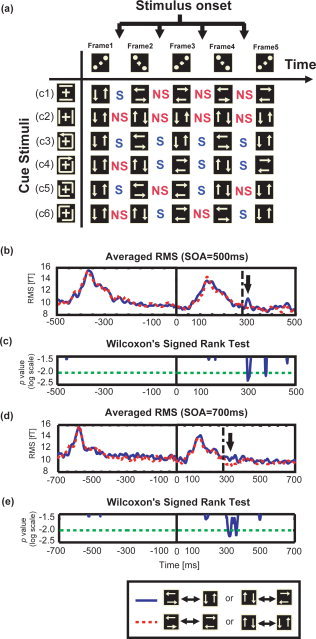
Definition of “switching” and “nonswitching” and comparison of MEG activity for both cases in Experiment C. (a) Schematic illustration of the timings of perceptual switching at four stimulus onsets in the main period for six different tasks indicated by the respective cue stimuli. Here, we arranged five stimulus animation frames horizontally in the time course and six cue stimuli vertically. S stands for switching and indicates that observers were required to switch their perceived motion from vertical (horizontal) to horizontal (vertical). NS stands for nonswitching. For the six cued motion patterns, the net number, S, was equal to NS. (b) Overall average of RMS values before and after reversal of the onset of stimuli. Here, the SOA was 500 ms. The blue solid line is the average for the switching ensemble; the red dotted line is the average for the nonswitching ensemble. (c) The results of the statistical test for the 10 pairs of RMS values. They are averages for each of the 10 observers within switching and nonswitching ensembles (two‐tailed Wilcoxon Signed rank test). The blue solid line is the time course of the P‐value; the green long dashed‐dotted line is the significance level (P < 0.01). (d, e) Results where the SOA is 700 ms is shown. They correspond to (b) and (c) where the SOA is 500 ms. Black thick arrows in (b) and (d) indicate the time latency during which the two ensembles are significantly different. Dashed‐dotted lines in (b) and (d) indicate 275 ms.
In Experiment A, to investigate the dependence of controllability on the SOA, we changed the duration of the animation frames in the cover and main periods, using SOAs of 100, 200, 250, 300, 400, and 500 ms. These six parameters were selected by preliminary psychophysical experiments of three observers with wider ranges of SOA. We focused on the time range because the controllable rate was changed within these SOAs. Experiments for these SOAs were performed within individual sessions, and the sessions for six SOAs were rearranged in different orders for each of the 10 observers. Each observer performed 20 trials for each SOA condition.
In Experiments B and C, we focused on the cases in which observers could totally control their perception. In Experiment B for EOG recordings, the SOA is 500 ms, and in Experiment C for MEG recordings, the SOAs are 500 and 700 ms (Fig. 1b).
In Experiment D, we used only (c1), and we requested the observers to always switch their perceived motion from the vertical to the horizontal direction. The number of frames in the main period was limited to three and the type of cue stimuli to the horizontal motion only (Fig. 1b) because the time length of one frame (∼275 ms) was short and we were unable to distinguish some component later than 275 ms of the second stimulus onset from an early component of the next stimulus onset. Observers noticed the disappearance of the occluder in the first frame and perceived vertical motion once at the onset of the next frame.
Then, they tried to switch the perceived motion from vertical to horizontal at the onset of the third frame. The SOA was set to a threshold value at which the controllability was 50% for each observer.
In 300 trials, observers were requested to press the button under their right forefinger in the answer period when they succeeded in switching the motion direction or the button under their middle finger when they did not. Then, we observed the difference in neural activity between when they succeeded in switching the direction of the perceived motion and when they failed. The analytical method will be explained in the “MEG Data Analysis” section.
In Experiment E, we used (c1) and (c2) as the cue stimuli. In this experiment, (c1) indicated an intentional switching task where observers showed intent to switch the perceived motion, and (c2) indicated a passive switching task where observers simply looked at the fixation point and waited for the event in which the perceived motion changed direction. Here, we needed to enable passive switching during the limited stimulus frames in the main period. Therefore, we performed additional psychophysical experiment for selecting the optimal horizontal distance between dots for each observer because the shorter distance facilitate passive switching from vertical to horizontal motion [Green, 1986]. Observers performing both tasks were requested to press a button under their right forefinger in the next animation frame after they were aware of perceptual switching.
For the optimal horizontal distance, we compared the neural activity evoked when observers intended to switch their perceived motion with the neural activity occurring when the perceived motion was switched. Each observer performed 100 trials; comprising 50 active switching trials and 50 passive‐switching trials. In the cue period, the stimuli were presented in random order. Thirty‐two frame stimuli were presented in the main period, when the SOA was 500 ms (Fig. 1b). It should be noted that although the terms used to refer to the cue stimuli in Experiment E are the same as (c2) in Experiments A–C, the meaning is quite different (Fig. 1b).
Among all experiments, observers performed tasks in the main period according to the cue and responded by pressing a button during the answer period. The time length of the answer period was 1.0 s. In the training preceding the experiment, we instructed the observers to cease all body movements to reduce potential MEG artifacts that could occur during the main period. Note that in Experiment E, we requested that the observers not wait to press the button until the start of the answer period, but rather to do at the animation frame after the next one when the direction of perceived motion switched. When the button was pressed, the stimuli were shifted from the main period to the answer period. The reason for this request was to maximize the number of trials by reducing the time length for the remaining part. However, in Experiment E, observers did not need to respond to any questions during the answer period, and we permitted blinking or minimal body movement only, to avoid MEG artifacts.
MEG Recording
Brain magnetic fields (MFs) were recorded by a whole‐head MEG system comprised of 440 gradiometers (PQ2440R, Yokogawa, Tokyo, Japan) and located in a magnetically shielded room. The superconducting quantum interference device (SQUID) gradiometers of our MEG system consisted of 300 axial gradiometers (δB z/δz) and 70 × 2 planar gradiometers (δB x/δz, δB y/δz). The sampling frequency of the MEG system was 400 Hz, and the signals were band‐pass filtered between 0.03 and 200 Hz. Here, the second Butterworth band‐pass filter [6.0 (db/oct)] was used, and the edges of frequency band were defined as 3.0 db roll off points. We analyzed trials after artifact rejection. MEG signals in the frontal sensor that exceeded the prescribed amplitude [>2.0 (pT)] in the main periods were rejected automatically, on the assumption that they were produced by blinking. We neglected the sensors in the lateral, temporal, or occipital regions if their activity exceeded the same threshold, because SQUID sensors can be unstable and noisy. However, there were few sensors in these locations.
For achieving good synchrony between visual stimulus and MEG recording, a white square was presented at one of two lower corners of the screen by a photoprojector. The square was identified by one of two photodetectors and the signal was recorded simultaneously with the MEG recording system.
Eye Movement Recording
Eye movement was recorded by electrooculography (EOG) (MME‐3116, Nihon Kohoden, Japan). We positioned four electrodes above the left and right eyebrows and under the left and right lower orbitals to record both vertical eye movements, and we placed four different electrodes at the nasal and temporal canthal regions of the left and right eyes to record both horizontal eye movements. The sampling frequency was 120 Hz, and the signals were band‐pass filtered between 0.03 and 50 Hz. In previous research, Berea et al. [ 2002] reported that the EOG voltage was proportional to the visual angle of eye movement within some proper region. Therefore, we calibrated the EOG voltage to the visual angle by measuring the EOG voltages when observers saw the right/left or up/down edge of three sizes of stimuli alternatively (visual angle: 3.0°, 4.5°, and 6.0°), and fitted one linear model by minimum square estimation for 50 samples per one visual angle. We determined that voltage 1.0 μV corresponds to 0.06 visual angle (°). Then, we requested that the observers practice minimizing their eye movements. The threshold for detecting eye movement was set to an EOG voltage of 5.0 μV. From the linear relationship between the visual angle and the EOG voltage, we estimated that the visual angle corresponding with the voltage was 0.3°.
MEG Data Analysis
Here, we used the RMS value [Nakamura et al., 2003], which characterizes the intensity of neural activity. Here, N is 440, which corresponds to the number of all SQUID sensors in our MEG system, and is the intensity of the MF measured with a kth SQUID sensor. We used the RMS value for three reasons: (1) During EEG recording, the head position was spatially locked in the sensor position. However, the head position changed during MEG recordings throughout the experiments. Therefore, spatial averaging of MEG signals is a reasonable for quantification. (2) When evaluating complex MF map patterns, the detection of sensors at a spatial peak might be difficult. However, we can use the RMS measure robustly for such cases. (3) In MF map patterns, we expect to observe a pair of positive and negative peaks simultaneously for each current dipole. Therefore, the sign does not contribute to the evaluation of current intensity, and it is reasonable to evaluate the absolute intensity of MFs by a square operation.
Although this analytical method has many good features, it is different from the waveform analysis commonly used in the EEG research field. RMS analysis utilizes the spatially averaged intensity, whereas waveform analysis uses representative sensors. Therefore, we will not refer to the 300 ms component reported in this report as P300m, but as a P300‐like peak, in order to discriminate clearly between them [Struber and Hermann, 2002].
To increase the signal‐to‐noise ratio, the RMS values were band‐pass filtered between 3.0 and 45 Hz. We conducted a two‐tailed Wilcoxon Signed rank test of the 10 sets of paired data from the 10 observers to test the differences between RMS values under the two conditions for each experiment. We determined that the two signals were significantly different when P < 0.01.
To estimate the location of cortical activities, dipole estimation with the equivalent current dipole (ECD) model were conducted on the MF. Three hundred axial z‐sensor, 70 of which were in vector sensors, were used for the analysis. The following criteria were adopted for the acceptance of the estimation: (1) the goodness of fit (GOF) should be above 85% and (2) the dipole should be in the cerebral cortex.
First, a one‐dipole model was applied, and the dipole was adopted if the aforementioned criteria were satisfied. When the criteria were not satisfied with one‐dipole model, the two‐dipole model was applied [Amano et al., 2005]. The estimated dipoles were superimposed on three‐dimensional MR images of each observer. The head coordinate was defined as follows. The origin was defined as the midpoint between the preauricular points. The positive y‐axis extended from the origin to the nasion. The positive y‐axis extended from the origin to the left to be perpendicular to the x‐axis on the plane made by the nasion and preauricular points. The z‐axis extended to the vertex in a direction perpendicular to the x–y plane. We used MATLAB (Cybernet Systems, USA) to analyze the data.
RESULTS
Experiment A (Psychophysical Experiment)
First, we examined the dependence of controllability on the SOA. The results are shown in Figure 2, as the average controllable rate (%) for the 10 observers. Note that the controllability of vertical motion was eliminated from these calculations, because control of this motion pattern remained at 100% for all SOAs. This will be addressed in the “Discussion” section.
Figure 2.
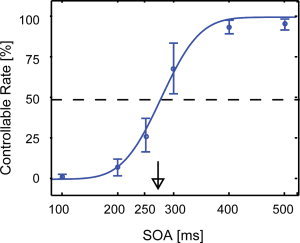
The relationship between SOA and controllable rate. Controllable rate as a function of SOA averaged across all observers in Experiment A. We fitted an accumulative density function for Gauss distribution to the average controllable rates of six SOA levels using the least‐squares method. The thick arrow indicates the threshold SOA. The error bar indicates the standard deviation (SD) for the 10 observers. The threshold SOA was 274 ms (SD: 32 ms) for all observers.
The threshold SOA for controllability was defined as the SOA at which the controllable rate was 50%. The mean threshold SOAs for 10 observers was 274 ms with a standard deviation of 32 ms. In this report, we designated the time of the threshold SOA as 275 ms. Before performing Experiment A, we expected that the controllability of the perceived motion pattern might be modified by the intensity of “perceptual inertia,” or the number of times observers switched within one motion pattern. Therefore, we also calculated the individual threshold SOA for each cue stimulus. However, significant common trends relating to the ease of controllability were not observed (figure not shown).
Experiment B (Eye Movement Recording)
Using EOG, we measured eye movements to confirm that controllability of perception was not achieved by the observers' eye movements. We requested that observers perform the same task as in Experiment A, though the SOA was fixed to 500 ms (Fig. 1b). For this SOA, all observers succeeded in more than 95% of trials. The typical time courses of EOG recordings are shown in Figure 3a.
Figure 3.
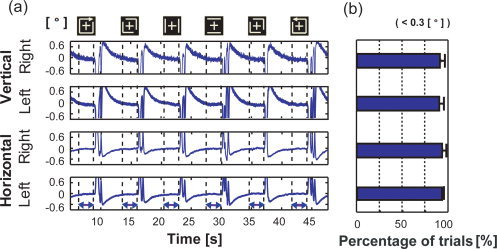
EOG signal when performing intentional control in Experiment B. (a) Typical time series of EOG. The upper two time series indicate the vertical movement of the right and left eyes, and the lower two courses indicate their horizontal movement. The x‐axis indicates time and the y‐axis indicates the visual angle [labeled on the left side of (a)], which was estimated from voltage [labeled on the right side of (a)] and measured by our EOG system (see “Eye Movement Recording” section). The horizontal double‐ended arrows denote the main periods of six trials. Cue stimuli for respective trials are drawn at the top of the time courses. (b) The percentage of trials in which the visual angle was estimated from the maximum potential difference between the paired sensors in the main periods was smaller than 0.3°. The amplitude of 0.3° is much smaller than the size of the fixation cross (3.0°). This result is the average for the 10 observers, and error bars indicate the standard deviations of their samples.
The time courses suggest that the potential amplitudes in the main period were smaller than 0.3° of the visual angle, which corresponds to 5.0 μV. This angle was much smaller than that of the fixation cross (3.0°). We also checked the percentage of trials in which the maximum visual angle in the main period was larger than 0.3°; or less than 10%. We therefore confirmed that the control of perceived motion did not depend on eye movements but was due to different neural processes (Fig. 3b). We next investigated the associated neural activity at approximately 275 ms.
Experiment C (MEG Measurement 1)
Using MEG, we measured neural activity in 10 observers as in Experiment A to investigate the dependence of perceptual switching on time. The stimulus onset at which observers were required to switch “from vertical motion to horizontal motion” or “from horizontal motion to vertical motion” was termed the switching sample, and occurred anywhere within the five frame period. The stimulus onset at which observers were not required to switch was termed the nonswitching sample. For example, when the cued motion pattern was horizontal motion [as in (c1) of Fig. 4a], we obtained one switching sample at the time of the first stimulus onset and three nonswitching samples at the other three stimulus onsets; a total of four samples from each trial. The net number of switching and nonswitching samples was equal for each of the six cued motion perceptions, and there were 100 trials for each cue stimulus; a total of 1,200 for each sample.
In this experiment, the SOA was fixed to 500 ms. At this SOA, all observers succeeded in controlling perceived motion in more than 95% of trials. In about 5.0% of trials, the MEG signal was rejected by the automatic level rejection, based on the frontal sensors' responses. This percentage was similar to the EOG results.
We compared the MF RMS values from all the SQUID sensors for successful and nonrejected trials to the averaged RMS values for switching and nonswitching samples at −500 and 500 ms of their stimulus onsets (Fig. 4b). Figure 4c shows the results for the two‐tailed Wilcoxon Signed rank test for 10 pairs of averaged RMS values across 10 observers. A prominent difference was found approximately 300 ms after the stimulus onset, when perceptual switching was required (P < 0.01).
Two questions remained: (1) was the significant difference at approximately 300 ms a spurious result? If not, (2) was the evoked activity locked at 300 ms after the stimulus onset or to 200 ms before the next stimulus onset? To answer these questions, we performed MEG measurements for all observers at an SOA of 700 ms. We were able to identify a significant difference in RMS value at 300 ms after the stimulus onset (Fig. 4d,e). These results confirmed that the latency period was reproducible and the neural activity associated with perceptual switching determined that the cued motion was time‐locked to the stimulus onset, when the perceived motion was switched. The latency after stimulus onset was 300 ms.
Experiment D (MEG Measurement 2)
In Experiment C, it was not clear whether observers held the perceived motion via top–down attention or they did not display attentional bias, during the nonswitching times. To address the question, at the SOA threshold value where controllability was 50% for each observer, we compared neural activities when they succeeded in switching the direction of perceived motion, to when they did not.
The number of frames in the main period was limited to three and the types of cue stimuli to the horizontal motion only (Fig. 1b). We then compared the MF around the onset of the third frame when they succeeded in switching, and when they did not. Figure 5a–c shows results from one observer. In this experiment, the percentage of trials rejected was about 5%. We confirmed that when observers succeeded, the 300 ms peak was observed in both the waveform and in the RMS value of each SQUID sensor (Fig. 5a,b). Furthermore, the MF map before and after 275 ms showed characteristic differences; the earlier components were limited to the occipital region, but a strong response at 296 ms was observed in the global map pattern around the frontal region (Fig. 5c). From the average RMS value for all observers, we were also able to detect a prominent 300 ms peak when observers succeeded in switching perceived motion, and this component was common to all observers (P < 0.01) (Fig. 5d,e). Figure 5e shows the map of the overall averaged result for 10 observers.
Figure 5.
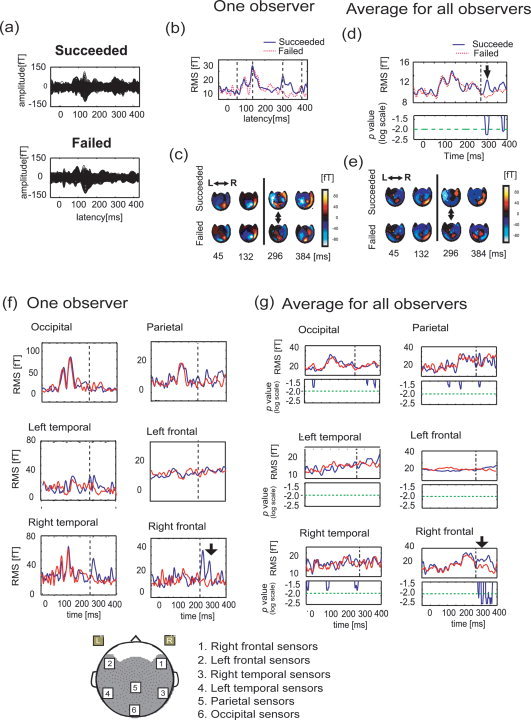
Comparison of MEG activity evoked when active switching succeeded and failed in Experiment D. (a) The waveforms produced in the successful and unsuccessful switching conditions from the observer. Here, the SOA of the stimulus was tuned to the threshold value of this observer. (b) The RMS values for the two conditions in the same observer's case. The solid blue line denotes the RMS value when the observer succeeded in switching the perceived motion; the dotted red line indicates the RMS value when the observer failed. (c) The spatial maps of MFs for one observer at four latencies, which are indicated by dotted black lines in (b) for the two conditions. The upside and downside of this map correspond to the frontal region and the occipital region, respectively. (d) Average RMS value and P‐value for two‐tailed Wilcoxon Signed rank test for all observers when we tuned the SOA to the threshold value of each observer. The solid blue line indicates the averaged RMS when observers succeeded in switching the perceived motion; the dotted red line denotes the averaged RMS when observers did not succeed. The thick black arrow indicates the latency where the two conditions are significantly different, and the dashed‐dotted black line indicates 275 ms. In the result of the two‐tailed Wilcoxon Signed rank test between the two ensembles, the solid blue line indicates the time course of the P‐value, and the long dashed‐dotted green line indicates the significance level (P < 0.01). (e) The spatial maps of MFs were averaged for 10 subjects. The selected time latencies are same as in (d). (f, g) RMS values calculated from 10 sensors in six local areas. They are occipital, parietal, left temporal, right temporal, left frontal, and right frontal sensors. The spatial map is shown below the figures of (f). Among them, (f) is the result for one observer and (g) is the RMS values for all observers and the statistical result (two‐tailed Wilcoxon Signed Rank test). The solid blue line is the time course of the P‐value; the long dashed‐dotted green line is the significance level (P < 0.01).
Furthermore, we performed two analyses to identify the related brain regions; they were (1) RMS analysis for 10 sensors around frontal, right or left temporal, occipital, and parietal regions, and (2) the neural estimation at time points when the MF showed typical peaks.
The RMS values for the limited sensors are shown in Figure 5f,g. Among them, Figure 5f indicate the results for one observer, and Figure 5g indicate results averaged across all observers. The P‐values for all observers are shown under the RMS values in Figure 5g. From the result of statistical tests, we found a significant increase in RMS value for the success group near the frontal region at 300 ms. Furthermore, a decrease in the occipital region was also observed at this time.
The aforementioned results are similar to the results of Experiment C. The evoked component at 300 ms should not correlate with the observers' intention to switch or hold perception, but only with the switching of perceived motion. At the same time, we observed that the waveform response of the sensor was located on the peak of the MF map pattern. This suggested that the component associates with P300m [Struber and Hermann, 2002]. The 300 ms component for a stimulus onset could also be interpreted as ∼25 ms difference in the component after the following stimulus onset. Thus, we stopped the stimulus just after three animation frames and then presented only a fixation point after the last animation frame, which observers used to switch perceived motion. Using this setup, we expected that the effect of the following stimulus onset after the three animation frames would be minimized.
Figure 6 shows the results for the current source estimation around 100–150 ms (early component) for both success and failure ensembles, and 300 ms (M300) for the success ensemble. The latencies were selected at which typical peaks of MF could be observed, and we selected the six observers who showed a GOF larger than 85% as determined by the estimation of single or double dipoles. Here, we found that one of dipoles of the early component was estimated around the right MT+ region for one observer (see Fig. 6). The dipoles for the individual observers that satisfied the aforementioned criteria are summarized in Table I. The 3/6 selected observers showed the activity around the right MT+ region (the first dipole of subjects 1, 2, and 4).
Figure 6.
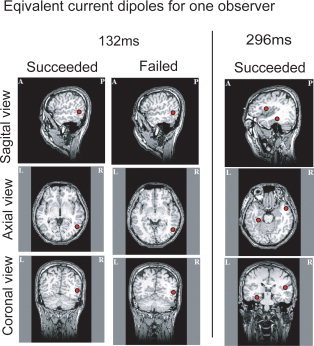
The equivalent current source estimated for one observer. Here, we show the results when typical peaks were observed; they are the results of the succeeded (controllable) and the failed (uncontrollable) case at 132 ms (early component) and the succeeded case at 296 ms (M300 component). In one observer, the estimated equivalent current dipole (ECD) values were one at 132 ms and two at 296 ms.
Table I.
Dipole locations for individual observers: The results of ECDs for the succeeded case for individual observes 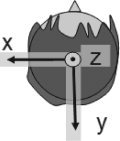
| Latency (ms) | GOF (%) | Dipole (No.) | x (mm) | y (mm) | z (mm) | Intensity (nA m) | |
|---|---|---|---|---|---|---|---|
| Succeeded case: Early component (100–150 ms) | |||||||
| Subject 1 | 115 | 89.8 | 1 | −46.9 | 37.3 | 44.7 | 3.0 |
| 2 | 10.2 | 68.9 | 32.1 | 10.7 | |||
| Subject 2 | 130 | 87.8 | 1 | −41.5 | 55.3 | 41.8 | 13.1 |
| 2 | 5.1 | 29.8 | 55.8 | 22.7 | |||
| Subject 3 | 132 | 86.3 | 1 | −48.3 | 48.2 | 38.3 | 16.1 |
| 2 | −16.1 | 23.8 | 55.9 | 21.5 | |||
| Subject 4 | 134 | 87.6 | 1 | −28.5 | 59.2 | 32.4 | 2.1 |
| 2 | 44.3 | 73.4 | 11.6 | 7.7 | |||
| Subject 5 | 126 | 85.6 | 1 | −34.3 | 49.2 | 35.0 | 6.1 |
| 2 | 20.9 | 82.1 | 40.0 | 4.1 | |||
| Subject 6 | 136 | 89.4 | 1 | −42.0 | 62.3 | 36.5 | 8.5 |
| 2 | 36.2 | 27.1 | 65.5 | 6.4 | |||
| M300 | |||||||
| Subject 1 | 300 | 89.2 | 1 | 24.6 | 6.8 | 21.3 | 12.4 |
| 2 | −46.8 | −13.1 | 58.6 | 6.4 | |||
| Subject 2 | 298 | 89.5 | 1 | 43.7 | 21.6 | 19.5 | 12.7 |
| 2 | −52.6 | −17.5 | 48.2 | 9.6 | |||
| Subject 3 | 296 | 86.4 | 1 | −0.5 | −38.7 | 26.8 | 7.5 |
| 2 | 75.7 | 32.5 | 30.7 | 3.3 | |||
| Subject 4 | 312 | 89.6 | 1 | 7.4 | 41.4 | 13.6 | 6.8 |
| 2 | −39.3 | −18.2 | 57.1 | 3.7 | |||
| Subject 5 | 308 | 89.4 | 1 | 27.6 | 42.8 | 48.3 | 7.8 |
| 2 | −34.0 | −26.3 | 40.8 | 5.6 | |||
The observers with GOFs greater than 85% were selected. The results of failed case are not shown because the early component in the case was similar to the result of succeeded cases and there were no typical peaks for p300 in the condition. The 3/6 observers showed the activity around the right MT + region (subjects 1, 2, and 4) and one of dipoles around 300 ms for 3/5 selected observes showed activation in frontal cortex (the second dipole of subjects 1, 2, and 4).
One of dipoles around 300 ms was estimated in the region of the right inferior frontal cortex for the observer (see Fig. 6), and 3/5 selected observers showed activation in frontal cortex (Table I, the second dipole of subjects 1, 2, and 4).
Experiment E (MEG Measurement 3)
Next, we compared the neural activity evoked when observers intended to switch their perceived motion with the neural activity occurring when the perceived motion was switched unwittingly, i.e., active versus passive switching. Then, we needed to enable passive switching during the limited stimulus frames in the main period. Therefore, we conducted a psychophysical experiment to choose an optimal horizontal distance for each observer, and analyzed the relationship between the vertical‐to‐horizontal ratio and the time that was required to switch the direction of perceived motion (Fig. 7a). Here, the duration time was defined as the interval between the time when an occluder disappeared and that when the observer pressed the button. We chose an optimal ratio for each observer from among five ratios of the horizontal distance to the vertical height (vertical‐to‐horizontal ratio): 1, 7/8, 3/4, 5/8, and 1/2. The optimal ratio was identified as the ratio that satisfied two conditions: (1) passive switching occurred much later than active switching and (2) more than 90% of trials in the passive switching task occurred within the main period. For example, we used 5/8 as the distance of the stimulus for the observer shown in Figure 7a. We hoped to distinguish correctly between passive and active switching based on cue stimuli only. Observers then did not need to change the button for active switching versus passive switching. We expected that neural activity related to finger movement, would not be found in the difference between the MEG signal obtained during the active switching task and that obtained during the passive switching task, because the observers' reaction time for the conditions were nearly same (∼350 ms).
Figure 7.
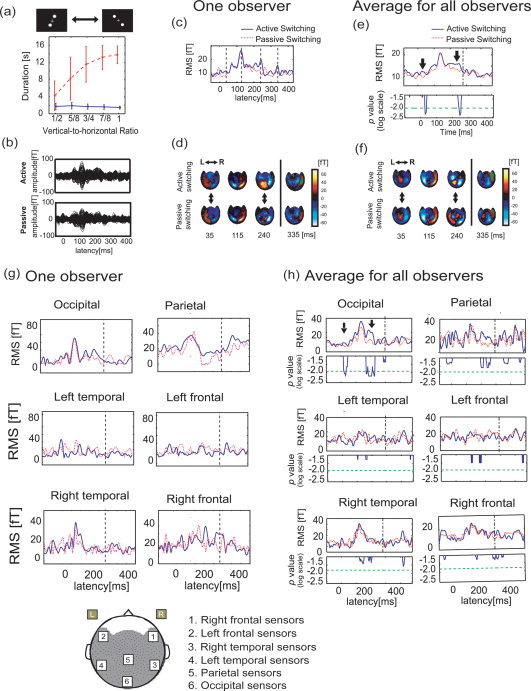
Comparison of MEG activity evoked by active and passive switching in Experiment E. (a) Relationship between the vertical‐to‐horizontal ratio of the stimulus size and the duration time of the perception of the initial vertical motion for one observer (solid blue line: average duration time for active switching ensemble; dotted red line: average duration time for passive switching ensemble). Here, the error bar indicates the standard deviation for each vertical‐to‐horizontal ratio. (b) A pair of the MEG waveforms with all 440 SQUID sensors for one observer when the observer actively switched the perceived motion and when the perceived switching occurred passively. (c) The RMS values of all sensors for the active and passive switches (solid blue line: the active switch; dotted red line: the passive switch). (d) The MF maps at four latencies, which are expressed as dotted lines in (c). Two double‐ended arrows express the latencies when a significant difference in RMS values was commonly observed for all observers. The upside and downside of this map correspond to the frontal region and the occipital region, respectively. (e) Average RMS values after stimulus onset for all observers (solid blue line: average RMS values for active switching ensemble; dotted red line: average RMS values for passive switching ensemble), and results of the two‐tailed Wilcoxon Signed rank test between the two ensembles [solid blue line: time course of P‐value; dashed‐dotted green line: significance level (P < 0.01)]. In the figure of the average RMS value, the dashed‐dotted line indicates 275 ms. Two thick arrows indicate the latencies at which a significant difference was observed between the two ensembles. (f) The MF maps at four latencies which are expressed dotted lines in (e). The figures in (g) are the RMS values of one observer for the 10 sensors of local regions. The figures in (h) are ones of the average for all observers. The spatial map is shown below the figures of (g).
We next measured neural activity with MEG when observers performed the same task for the stimulus of chosen distance. There were 200 trials for all observers, comprising 100 active switching trials and 100 passive switching trials. The percentage of trials in which the MEG signal was rejected by the automatic level rejection was ∼5%.
The results of one observer are shown in Figure 7b–d. We observed significant differences at 30–40 ms and 240–250 ms in the waveforms and in RMS values. These latencies are clearly different from the results in Experiments D and E. Furthermore, we observed that the results at 240–250 ms differed significantly, not only in the strength of the MFs but also in the map patterns (Fig. 7d). For example, the prominent MF pattern at the latency that spread from the occipital region to the parietal region during active switching was clearly different from the pattern observed during passive switching. At the same time, the map pattern at 240 ms in active switching also differed from the map pattern at 296 ms in Experiment E, which produced an observable peak near the frontal area (Figs. 5c and 7d).
We also compared the average RMS value for 10 observers around the stimulus onset when perception alternated and observed the results for two‐tailed Wilcoxon Signed rank test for the 10 pairs of RMS values (Fig. 7e). We observed significant differences at 30–40 ms and 240–250 ms and confirmed that these components were common to each observer. Furthermore, we observed the map pattern shown in Figure 7f for all observers, which exhibited properties of the observer.
For identifying the detailed brain regions involved: (1) we calculated the RMS values for 10 sensors placed at five local regions and (2) estimated the ECDs at time points of typical peaks.
Figure 7g indicates the RMS values for one observer, Figure 7h is the average and the results of statistical test for all observers.
The results of statistical tests indicated that the occipital sensors showed that the significant peak occurred during active switching. The latency was very close to the result in the analysis of all sensors.
Figure 8 shows current source estimation results for the observer at latencies when a distinct peak was observed. Table II shows the estimated positions of the dipoles for all observers in the active condition. Here, we show the results for observers whose GOF was larger than 85% for the dipole estimation with one or two dipoles.
Figure 8.
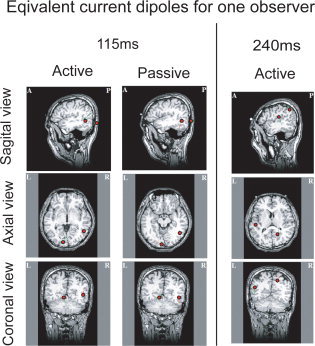
Equivalent current sources estimated for one observer. The latencies were selected when a significant peak was observed. At 115 ms (the early component), we observed a typical peak for active and passive conditions. The two ECDs were estimated near right MT+ region and near left V1/V2 region. Furthermore, the two ECDs at 240 ms was estimated in the vicinity of the right parietal region and left temporal region.
Table II.
Dipole location for individual observers: The location of ECDs for individual observers
| Latency (ms) | GOF (%) | Dipole (No.) | x (mm) | y (mm) | z (mm) | Intensity (nA m) | |
|---|---|---|---|---|---|---|---|
| Active condition: Early component (100–150 ms) | |||||||
| Subject 1 | 115 | 89.8 | 1 | −46.9 | 37.3 | 44.7 | 3.0 |
| 2 | 10.2 | 68.9 | 32.1 | 10.7 | |||
| Subject 2 | 130 | 87.8 | 1 | −41.5 | 55.3 | 41.8 | 13.1 |
| 2 | 5.1 | 29.8 | 55.8 | 22.7 | |||
| Subject 3 | 132 | 86.3 | 1 | −48.3 | 48.2 | 38.3 | 16.1 |
| 2 | −16.1 | 23.8 | 55.9 | 21.5 | |||
| Subject 4 | 134 | 87.6 | 1 | −28.5 | 59.2 | 32.4 | 2.1 |
| 2 | 44.3 | 73.4 | 11.6 | 7.7 | |||
| Subject 5 | 126 | 85.6 | 1 | −34.3 | 49.2 | 35.0 | 6.1 |
| 2 | 20.9 | 82.1 | 40.0 | 4.1 | |||
| Subject 6 | 136 | 89.4 | 1 | −42.0 | 60.3 | 36.5 | 8.5 |
| 2 | 36.2 | 27.1 | 65.6 | 6.4 | |||
| M250 | |||||||
| Subject 1 | 240 | 90.0 | 1 | −12.6 | 46.4 | 78.9 | 6.4 |
| 2 | 46.4 | 2.3 | 59.0 | 4.4 | |||
| Subject 2 | 268 | 85.7 | 1 | −15.3 | 33.9 | 67.7 | 16.8 |
| 2 | −27.0 | 25.7 | 56.3 | 13.6 | |||
| Subject 3 | 234 | 89.6 | 1 | 6.6 | 43.0 | 77.1 | 4.4 |
| 2 | 0.8 | 39.1 | 62.4 | 26.5 | |||
| Subject 4 | 254 | 87.4 | 1 | 0.4 | 17.6 | 56.2 | 20.4 |
| 2 | −15.0 | 49.3 | 1.7 | 8.6 | |||
| Subject 5 | 248 | 88.3 | 1 | 51.3 | 37.1 | 71.3 | 15.6 |
| Subject 6 | 238 | 87.9 | 1 | 64.4 | 4.5 | 84.7 | 9.8 |
| 2 | 41.8 | 10.5 | 29.6 | 14.9 | |||
Here, we limit the result for the active condition, and the GOF is larger than 85%. The early component for was estimated near a MT+ region for observers 1–5. Furthermore, one of the ECDs near 250 ms was observed in parietal region for observers 1–4.
In the observer, the two ECDs at 100–150 ms (early component) of active and passive cases were observed around right MT+ region and around a V1/V2 region, and the ECD of 240 ms of the active case was observed in parietal and left lateral regions (see Fig. 8).
By observing the ECD of the other observers, one of the ECDs of the early components were observed around right MT+ region for 5/6 of the shown observers (Table II, the first dipoles for observers 1–5), and one of the ECDs of a peak around the 250 ms was observed in parietal region for 4/6 of the observers (Table II, the first dipoles for observer 1–4).
DISCUSSION
Our study provides the clear evidence that the controllability of active switching depends strongly on the stimulus SOA. Experiment A demonstrated that as the presentation time got shorter, the ratio of controllable trials also became smaller. When the ratio was 50%, the SOA was approximately 275 ms. Furthermore, we could not detect specific eye movements while the 10 trained observers controlled their perceived motion (in Experiment B). The results suggested that the controllability is achieved by pure neural processes, and measurements of the neural activity became intrinsic for understanding the psychophysical phenomenon.
As shown in the “Introduction” section, the main issues were as follows: (1) Whether can we observe enhancement of the P300 component in the case of intentional perceptual switching (active switching) in comparison to the case when switching does not occur too? (2) When comparing evoked components for active switching and also for passive switching directly does the intensity of P300 component or of any other component shows any significant difference?
To answer the questions, we designed three experiments by changing the SOAs, the numbers of animation frames and the task. Figure 1c shows the relation of our MEG recording experiments (Experiments C–E) and the referred past research [Struber and Herrmann, 2002].
Experiment C revealed that the 300 ms component increased significantly when perceptual switching was required, relative to when it was not. In this experiment, the SOA was much longer than 275 ms (i.e., 500 and 700 ms). In Experiment D, we could also detect the apparent difference in neural activity when perceptual switching was possible and when it was impossible, for stimuli with a threshold SOA of 300 ms. Recently, the results of Experiments C and D revealed a common, prominent modulation of the P300‐like peak not only in the case of passive switching of perceived motion, but also in the case of intentional switching. In our result, the MF pattern for the 300 ms component showed global activity, which was highest at the frontal sensors. Furthermore, one of the equivalent current sources of the 300 ms component was often estimated near the right prefrontal cortex. Windmann et al. [ 2006] investigated perceptual reversals in patients with circumscribed lesions of the prefrontal cortex and reported that the prefrontal cortex is necessary for creating bias in the selection of visual representations. In fMRI research, Sterzer and Kleinschmidt [ 2006] showed that right inferior frontal region was activated to the rivalry of perception for DDQ in their fMRI research. As the answer for the question (1), these results ensured that the enhancement of P300 component can be observed in the case of active switching.
In Experiment E, we observed significant differences in neural activity at 240–250 ms between active and passive switching conditions. One of the current sources of the component was often estimated in parietal region. Slotnick and Yantis [ 2005] reported that a common activity between the attention bias effect and perceptual switching was observed in the region of the posterior parietal cortex. They are in accordance with our results. The MEG measurements showed that the component enhanced by the difference between active switching and passive switching was not 300 ms, and the spatial map seems to be different from it of P300 component. It is the answer for the question (2).
Additionally, there were some early components The equivalent current source on 100–150 ms component showed trivial result; It was commonly estimated around MT+. Previous research on neural activity relating to perceptual switching for DDQ has also discussed the importance of the MT+ region [Sterzer et al., 2003]. Although we observed significant differences in intensity at 30–40 ms between active switching and passive switching. The current source estimation for the component was difficult because of the low SN ratio in this research. However, Inui and Kakigi [ 2006] reported that MEG can also record such early components. Therefore, further analyses of the early component, based on a good noise reduction technique, might be meaningful to clarify the specific neural mechanisms.
In conclusion, our results suggest that controllability of active switching following the DDQ stimulus clearly depends on the SOA, and the SOA level at 50% controllability for perceptual switching (275 ms). By using the psychophysical property, we introduced a new experimental design for observing neural processes representing intentional control of perceptual switching (active switching).
In the time parameter 250–300 ms, there seems to be a missing link between the psychophysical property and the neural process. This might become an important remark in future works.
Acknowledgements
The authors are grateful to Drs. Eugenio Rodriguez, Sam M. Doesburg, Takashi Owaki, and Tsutomu Murata for their productive discussions.
REFERENCES
- Amano K, Kuriki I, Takeda T ( 2005): Direction‐specific adaptation of magnetic responses to motion onset. Vision Res 45: 2533–2548. [DOI] [PubMed] [Google Scholar]
- Berea R, Boquete L, Mazo M ( 2002): System for assisted mobility using eye movements based on electrooculography. IEEE Trans Neural Syst Rehab Eng 10: 209–218. [DOI] [PubMed] [Google Scholar]
- Green M ( 1986): What determines correspondence strength in apparent motion? Vision Res 26: 599–607. [DOI] [PubMed] [Google Scholar]
- Inui K, Kakigi R ( 2006): Temporal analysis of the flow from V1 to the extrastriate cortex in houmas. J Neurophysiol 96: 775–784. [DOI] [PubMed] [Google Scholar]
- Kohler A, Haddad L, Singer W, Muckli L ( 2008): Deciding what to see: The role of intention and attention in the perception of apparent motion. Vision Res 48: 1096–1106. [DOI] [PubMed] [Google Scholar]
- Leopold DA, Logothetis NK ( 1999): Multistable phenomena changing views in perception. Trends Cogn Sci 3: 254–264. [DOI] [PubMed] [Google Scholar]
- Maloney LT, Dal Martello MF, Spillmann L ( 2005): Past trials influence perception of ambiguous motion quartets through pattern completion. Proc Natl Acad Sci USA 102: 3164–3169. [DOI] [PMC free article] [PubMed] [Google Scholar]
- Meng M, Tong F ( 2004): Can attention selectively bias bistable perception? Differences between binocular rivalry and ambiguous figures. J Vision 4: 539–551. [DOI] [PMC free article] [PubMed] [Google Scholar]
- Merk I, Schnakenberg J ( 2002): A stochastic model of multistable visual perception. Biol Cybern 86: 111–116. [DOI] [PubMed] [Google Scholar]
- Nakamura H, Kashii S, Nagamine T, Matsui Y, Hashimoto T, Honda Y, Shibasaki H ( 2003): Human V5 demonstrated by magnetoencephalography using random dot kinematograms of different coherence levels. Neurosci Res 46: 423–433. [DOI] [PubMed] [Google Scholar]
- Necker LA ( 1832): Observations on some remarkable optical phaenomena seen in Switzerland; and on an optical phaenomenon which occurs on viewing a figure of a crystal or geometical solid. London Edinburgh Philos Mag J Sci 1: 329–337. [Google Scholar]
- Ramachandran VS, Antis SM ( 1983): Extrapolation of motion path in human visual perception. Vision Res 23: 83–85. [DOI] [PubMed] [Google Scholar]
- Rose M, Buchel C ( 2005): Neural coupling binds visual tokens to moving stimuli. J Neurosci 25: 10101–10104. [DOI] [PMC free article] [PubMed] [Google Scholar]
- Rubin E ( 1958): Figure and ground In: Beardslee DC. and Wertheimer M. Eds., Readings in Perception, Princeton, NJ: Van Nostrand, 194–203. [Google Scholar]
- Slotnick SD, Yantis S ( 2005): Common neural substrates for the control and effects of visual attention and perceptual bistability. Cogn Brain Res 24: 97–108. [DOI] [PubMed] [Google Scholar]
- Sterzer P, Kleinschmidt A ( 2006): A neural basis for inference in perceptual ambiguity. Proc Natl Acad Sci USA 104: 323–328. [DOI] [PMC free article] [PubMed] [Google Scholar]
- Sterzer P, Hynes J‐D, Rees G ( 2006): Primary visual cortex activation on the path of apparent motion is mediated by feedback from hMT+/V5. NeuroImage 32: 1308–1316. [DOI] [PubMed] [Google Scholar]
- Struber D, Herrmann CS ( 2002): MEG alpha activity decrease reflects destabilization of multistable percepts. Cogn Brain Res 14: 370–382. [DOI] [PubMed] [Google Scholar]
- Suzuki S, Peterson M ( 2000): Multiplicative effects of intention on the perception of bistable apparent motion. Psychol Sci 11: 202–209. [DOI] [PubMed] [Google Scholar]
- Yantis S, Nakama T ( 1998): Visual interaxtions in the path of apparent motion. Nature 1: 508–512. [DOI] [PubMed] [Google Scholar]
- Windmann S, Wehrmann M, Calabrese P, Gunturkun O ( 2006): Role of the prefrontal cortex in attentional control over bistable vision. J Cogn Neurosci 18: 456–471. [DOI] [PubMed] [Google Scholar]