

Abstract
This study investigated white matter integrity in young children with autism using diffusion tensor imaging (DTI). Twenty‐two children with autism, mean age 3:2 years, and 32 controls, mean age 3:4 years, participated in the study. Tract‐based spatial statistics (TBSS) revealed white matter abnormalities in several distinct clusters within the genu and body of the corpus callosum (CC), left superior longitudinal fasciculus (SLF) and right and left cingulum (Cg). TBSS–VOIs analysis was performed in the clusters where differences in fractional anisotropy (FA) were detected to investigate the relationship between changes in FA and diffusivity indices. In all VOIs, increase in FA was caused by a decrease in radial diffusivity (Dr), while no changes in axial diffusivity (Da) or mean diffusivity (MD) were observed. Tractography analysis was applied to further study the CC, SLF, and Cg. Witelson parcellation scheme was used for the CC. Significant increase in FA was seen in children with autism in the mid‐body of the CC as well as in the left Cg. It is suggested that such abnormal white matter integrity in young children with autism may adversely affect connectivity between different brain regions and may be linked to some of the behavioral impairments apparent in autism. Hum Brain Mapp, 2011. © 2010 Wiley‐Liss, Inc.
Keywords: DTI, autism, TBSS, tractography, corpus callosum, cingulum, superior longitudinal fasciculus
INTRODUCTION
Autism spectrum disorders (ASD) is a heterogeneous syndrome with complex neuropathology, a range of severity and a number of comorbidities. ASD is behaviorally defined based on social‐communication deficits, language deficits, and a range of stereotypic behaviors [DSM‐IV TR,1994]. Currently, there are no biologically‐based diagnostic criteria for autism.
Postmortem and structural magnetic resonance imaging (MRI) studies pointed to pathological findings in several brain regions including the limbic system, the cerebellum, and the related inferior olive [Bauman and Kemper,2005], the frontal lobes [Courchesne and Pierce,2005a,b], and the corpus callosum [CC; Boger‐Megiddo et al.,2006; Hardan et al.,2000; Stanfield et al.,2008]. In about 70% of the children with autism, the brain undergoes a period of precocious growth during early postnatal life, mainly in the frontal lobes, followed by a deceleration of brain growth in later childhood years [Courchesne,2004; Courchesne and Pierce,2005a,b; Courchesne et al.,2003; Lainhart,2006]. Morphological and volumetric studies reported differences in specific brain regions including both white and gray matter volumes [Bloss and Courchesne,2007; Courchesne et al.,2001; Girgis et al.,2007; Ke et al.,2009; McAlonan et al.,2005; Waiter et al.,2005].
Diffusion tensor imaging (DTI), offers various diffusivity indices that relate to the micro‐structural organization of brain white matter [Basser and Pierpaoli,1996; Wakana et al.,2004]. The most common indices are mean diffusivity (MD), reflecting the amplitude of water diffusion, fractional anisotropy (FA), reflecting the directionality of water diffusion, axial diffusivity (Da) which is the diffusion along the tensor ellipsoid main axis (λ// = λ1), and radial diffusivity (Dr) which is the diffusion perpendicular to that axis (λ⟂ = (λ2 + λ3)/2) [Basser and Pierpaoli,1996].
Barnea‐Goraly et al. [2004] reported reduced FA along with increased MD in cerebral white matter regions in adolescents with autism, arguing that these abnormalities were associated with deficits in social cognition and theory of mind skills. Sundaram et al. [2008] reported reduced FA and increased diffusivity of the short and long association fibers in the frontal lobes in children with ASD, age 57.5 ± 29.2 months. Lee et al. [2007] reported decreased FA and increased Dr, as well as increased MD in the temporal regions in subjects with ASD (age range: 7–33 years). Consistent reductions in FA were reported on and near the genu of the CC in high functioning subjects with autism [age range: 7–33 years; Alexander et al.,2007] and by Keller et al. [2007] in subjects with autism (age range: 10–35 years). Thakkar et al. [2008] showed reduced FA in white matter underlying the anterior cingulate cortex in subjects with ASD (age 30 ± 11 years). A recent study conducted with low‐functioning subjects with autism (age range: 18–27 years) showed reduced tract volume and lower mean FA values in the left orbitofrontal cortex network [Pardini et al.,2009]. The lower FA was associated with lower IQ scores. Another recent study reported decreased FA in the left hemisphere and increased FA in the right hemisphere mainly in the frontal and temporal lobes in children with autism [age: 9 ± 2 years; Ke et al.,2009]. Pugliese et al. [2009] reported higher number of streamlines in the cingulum (Cg) and in the inferior longitudinal fasciculus, in subjects with Asperger syndrome (age range: 9–54 years); however no differences between groups were detected in FA and MD values in these regions. Using high b value DWI, Ben Bashat et al. [2007] reported higher FA in toddlers with autism (age range: 1.8–3.3 years) which was more dominant in the left hemisphere and detectable in the frontal lobe [for more information on high b value DWI method see Assaf and Cohen,2000; Assaf et al.,2002; Ben Bashat et al.,2005].
The current study further explored white matter differences between young children with autism and typically developing children (TD), using a variety of methods of analysis. Various diffusivity indices were examined to better understand the changes in FA and to provide more information regarding the mechanisms underlying white matter integrity in autism.
MATERIALS AND METHODS
Subjects
Twenty‐two children diagnosed with autism, mean age 3.2 ± 1.1 years, (range 1.5–5.8 years), participated in the study. Diagnosis of autism was received at the time of the MRI. Eighteen children underwent a comprehensive diagnosis at a regional Autism Center. The diagnosis interview‐revised [ADI‐R1; Lord et al.,1994] and the autism diagnosis observation schedule [ADOS2; Lord et al.,1989,1999] were used. Participants met the cut‐off points for autism on the ADI and ADOS as well as the clinical criteria for autism of the DSM‐IV TR [1994]. All the professionals involved in the diagnosis process established reliability as required. A clinical evaluation by a pediatric neurologist was performed as well. Additional four children were diagnosed by a general pediatric neurology clinic. These children met criteria for autism based on the DSM‐IV TR [1994].
Ten participants had complex medical histories and underwent a comprehensive genetic work‐up, obtained metabolic tests as well as EEG. The evaluations did not yield a diagnosis of specific genetic syndromes or specific metabolic disorder. Epilepsy was ruled out. A neurological follow‐up, 1–2 years after obtaining the MRI did not identify specific comorbidities in this cohort. The remaining 12 participants had uncomplicated clinical history and normal physical and neurological examinations on the initial and on subsequent assessments. In all subjects conventional MRI was without gross abnormalities. Diagnoses of autism were reconfirmed for all the participants, 1–2 years after the initial diagnosis and the MRI.
Thirty‐two typically developing (TD) children, mean age 3.4 ± 1.3 years, (range 1.5–5.8 years), served as controls. Subjects were referred for various indications, including febrile convulsion, intermittent torticollis, suspected endocrine abnormalities, and suspected brain abnormalities on prenatal ultrasound. Requirements for eligibility were: no brain anomalies on conventional MRI, normal developmental history, attendance of an age‐appropriate educational facility, no prior history of head injury and no clinical evidence of neurological dysfunction.
The study was approved by the Institutional Review Board (IRB) of the Tel‐Aviv Sourasky Medical Center and the Israeli Ministry of Health. Parents or legal guardians of the participants signed an informed consent form.
Sedation Protocol
All subjects underwent sedation during the MR scans with a gas mixture of nitrous oxide in 40% or propofol oxygen enriched with halothane 0.6–0.8%. Subjects breathed spontaneously through a laryngeal mask airway. ECG, pulse oximetry, and capnography were monitored.
Data Acquisition
MRI was performed on a 1.5T (GE Signa EXCITE, MRI scanner, Milwaukee, WI). Conventional imaging included sagittal T1 weighted (T1W) FSPGR, axial T2 weighted (T2W), axial FLAIR and coronal T2W. A diffusion tensor imaging was acquired with b max = 1,000 s/mm2, acquired with 15 diffusion gradient encoding directions and 1 vol. without diffusion gradients (b = 0 s/mm2). Two repetitions were performed to increase signal to noise ratio. Other acquisition parameters included: TR/TE = 11,000/94 msec, matrix of 96 × 96, FOV = 200 mm and 3 mm slices with no gap. Axial slices were aligned along the anterior–posterior commissures (AC‐PC) axis to cover the whole brain including the cerebellum.
Image Analysis
Three methods of analysis were used to compare white matter integrity between children with autism and TD children: voxel‐based whole brain comparison, using tract‐based spatial statistics [TBSS; Smith et al.2006], volume of interest (VOI) analysis of the TBSS results, and tractography analysis, based on the TBSS results.
Tract Based Spatial Statistics (TBSS)
Twenty one children with autism, mean age 3.3 ± 1.1 years (range 1.5–5.8 years), and 26 TD children, mean age 3.3 ± 1.2 years (range 1.5–5.8 years) were included in this analysis (one child with autism and six TD children were excluded because of misalignment of their data to the mean skeleton). There was no significant age differences between the participants and the controls (t(45) = 0.19, P = 0.85).
Motion and eddy current corrections were performed using FSL software. FDT (FMRIB's Diffusion Toolbox; http://www.fmrib.ox.ac.uk/fsl) was used to fit a diffusion tensor model to the data at each voxel. Voxel‐wise values of axial and radial diffusivities (Da and Dr, respectively), mean diffusivity (MD) and fractional anisotropy (FA) were calculated. FA maps from all subjects (n = 47) were aligned to the “most representative” map. A mean FA map was created and aligned into a 1 × 1 × 1 mm3 MNI152 standard space [Focke et al.,2007; Smith et al.,2006,2007]. The mean FA map was then thinned to create a mean FA skeleton, representing the main fiber tracks, and was thresholded at FA > 0.2. Values of MD and FA of the subjects with autism were compared with those of the TD children. Two contrasts for each diffusivity index were estimated: patients greater than controls and controls greater than patients. The results included maps corrected at cluster level [threshold‐free cluster enhancement—TFCE, Smith and Nichols,2009] thresholded at a level of P < 0.05 fully corrected for multiple comparisons (TFCE‐corrected).
TBSS–VOIs analysis.
VOIs analysis was performed to further investigate the relationships between changes in FA and other diffusivity indices. The VOI masks were based on anatomical atlases (JHU ICBM DTI 81 White Matter Atlas for VOIs in the CC, JHU White Matter Tractography Atlas for VOIs in the SLF and in the Cg) and included only the voxels in which differences in FA were seen. These VOIs masks were back‐projected to the original images of each subject and mean values of the diffusion indices, Da, Dr, and MD, were calculated.
One‐way ANCOVA with group as independent variable and DTI parameters (Da, Dr, MD, and FA) as the dependent variables were performed, controlling for age of subjects (SPSS version 14.0). Bonferroni correction for multiple comparisons was used (P < 0.0025).
Tractography analysis.
Twenty two children with autism, mean age 3.2 ± 1.1 years (range 1.5–5.8 years), and 28 TD children, mean age 3.6 ± 1.2 years (range 1.5–5.8 years) were included in this analysis (four TD children were excluded since the tractography and segmentation of the CC in these subjects, were unsuccessful). There was no significant age differences between the participants and the controls (t(48) = 1.16, P = 0.25).
Motion and eddy current corrections were performed using FSL software (FSL; http://www.fmrib.ox.ac.uk/fsl/). Tractography analysis was performed using MRIStudio software (Johns Hopkins University, Baltimore, MD). The diffusion tensor (i.e., a 3 × 3 matrix) was calculated with a multivariate linear fitting algorithm for each voxel. The tensor in each voxel was spectrally decomposed to obtain its eigenvalues and eigenvectors, and the fiber direction at each voxel was assumed to be the eigenvector corresponding to the tensor's largest eigenvalue. This vector was color‐coded (blue for superior–inferior, red for left–right, and green for anterior–posterior). Da, Dr, MD, and FA maps were generated from the eigenvalues.
Three major fiber bundles were extracted based on the TBSS results: the corpus callosum (CC), the superior longitudinal fasciculus (SLF), and the cingulum (Cg). Streamline fiber tracking method using fiber assignment by continuous tracking (FACT) algorithm [Mori et al.,1999], and a brute‐force reconstruction approach were used. Fiber tracking was terminated when it reached a pixel with an FA value lower then 0.25, or when the turning angle was >70°.
The CC was extracted using a single region of interest (ROI) defined on a color‐coded mid‐sagittal map [Mori and van Zijl,2007; Mori et al.,1999; Wakana et al.,2004]. Further segmentation of the CC followed Witelson [1989] parcellation scheme (see Fig. 1). This method defines five vertical callosal segments based on specific arithmetic fractions of the maximum anterior–posterior extent. The CC is subdivided into regions comprising the anterior third (CC‐w1), the anterior and posterior midbody (CC‐w2‐w3), the posterior third (CC‐w4), and the posterior one‐fifth (CC‐w5). In the current study, the CC‐w1‐w5 segments included all fibers projected from the specific seed ROI, each constituting a specific volume of interest (VOI).
Figure 1.
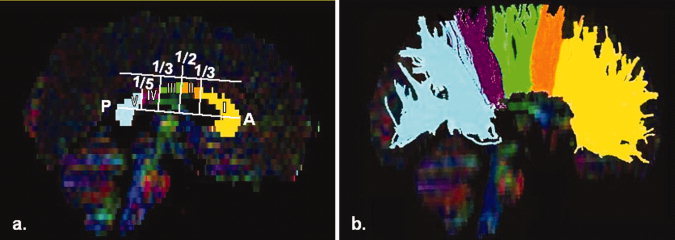
(a) Witelson segmentation‐schematic view, (b) Tractography of CC; w1‐yellow, w2‐orange, w3‐ green, w4‐ purple, and w5‐light blue.
The right and left SLF were extracted separately, through a single ROI approach [Catani et al.,2005]. The ROI was defined on a color‐coded axial map to encompass the horizontal fibers lateral to the vertical corona radiata fibers. All fibers passing through this ROI were reconstructed.
The right and left Cg were extracted separately, through a single ROI approach [Pugliese et al.,2009; Wakana et al.,2004]. The ROI was defined on a color‐coded axial map encompassing the horizontal fibers medial to the longitudinal fibers and superior to the CC. Only the anterior–superior part of the Cg was reconstructed. Artifactual (callosal) fibers were removed using an exclusion ROI defined around the corpus callosum.
Mean values of Da, Dr, MD, and FA, were calculated for each fiber/segment. A between‐group comparison of mean values of the diffusion indices was conducted, using two tailed group t‐test for independent samples (P < 0.05).
RESULTS
Tract‐Based Spatial Statistics (TBSS)
Differences were detected between children with autism and TD children in the CC, in the left SLF and in the right and left Cg as follows: Significant increase in FA (P < 0.05; TFCE‐corrected) was detected in children with autism in the genu and in the midbody of the CC. In addition, increased FA was detected in only two other regions, the left SLF and the right and left Cg, though it did not reach significance when corrected for multiple comparisons. No significant differences in MD were detected between groups. Figure 2 shows increased FA in the genu and in the midbody of the CC (Fig. 2a,b), in the left SLF (Fig. 2c), and in the right Cg (Fig. 2d). No reduction in FA values was seen in any brain region in children with autism compared to TD controls.
Figure 2.
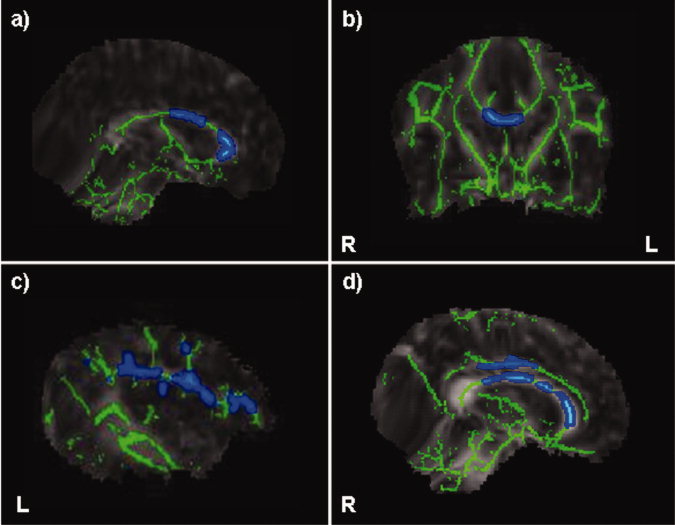
Elevated FA in genu and body of the CC (a,b: P < 0.05, TFCE‐corrected), in the left SLF (c: P < 0.05, TFCE‐uncorrected for multiple comparisons) and in the right Cg (d: 0 < 0.05, TFCE‐uncorrected for multiple comparison) in children with autism vs. TD controls.
TBSS–VOIs
Based on results from TBSS analysis five VOIs were defined: the genu and body of the CC, the left SLF and the right and left Cg. Mean values and statistical results for the diffusivity indices in these VOIs are presented in Table I. In all VOIs a significant increase in FA and decrease in Dr values were detected in children with autism compared to TD controls (P < 0.0025). No significant differences were detected in Da and in MD in any of the VOIs. Figure 3 shows the distribution of FA and Dr relative to age of the children in the body of the CC (Fig. 3a,b), in the left SLF (Fig. 3c,d) and in the left Cg (Fig. 3e,f), demonstrating an overall increase of FA with age and a decrease of Dr with age in both groups in all VOIs.
Table I.
Statistics for group differences in diffusivity indices from TBSS VOIs (corrected for age)
| Da (×10−3 mm2/s) | Dr (×10−3 mm2/s) | MD (×10−3 mm2/s) | FA (a.u.) | |||||||||
|---|---|---|---|---|---|---|---|---|---|---|---|---|
| TD | AUT | F | TD | AUT | F | TD | AUT | F | TD | AUT | F | |
| CC‐G | 1.61 ± 0.20 | 1.73 ± 0.15 | 4.43 | 0.50 ± 0.09 | 0.40 ± 0.08 | 29.28* | 0.87 ± 0.08 | 0.84 ± 0.08 | 3.17 | 0.63 ± 0.08 | 0.73 ± 0.06 | 21.73* |
| CC‐B | 1.60 ± 0.16 | 1.71 ± 0. 12 | 6.55 | 0.76 ± 0.12 | 0.65 ± 0.10 | 15.10* | 1.04 ± 0.11 | 1.00 ± 0.09 | 1.90 | 0.46 ± 0.07 | 0.56 ± 0.06 | 31.99* |
| L‐SLF | 1.18 ± 0.06 | 1.21 ± 0.06 | 3.74 | 0.69 ± 0.04 | 0.65 ± 0.05 | 12.39* | 0.85 ± 0.05 | 0.84 ± 0.05 | 1.20 | 0.35 ± 0.03 | 0.40 ± 0.04 | 40.49* |
| L‐Cg | 1.13 ± 0.11 | 1.14 ± 0.00 | 4.03 | 0.60 ± 0.00 | 0.54 ± 0.00 | 22.04* | 0.86 ± 0.00 | 0.84 ± 0.00 | 3.04 | 0.48 ± 0.06 | 0.55 ± 0.06 | 20.74* |
| R‐Cg | 1.22 ± 0.10 | 1.28 ± 0.00 | 7.78 | 0.70 ± 0.00 | 0.66 ± 0.00 | 11.84* | 0.87 ± 0.00 | 0.87 ± 0.00 | 0.38 | 0.35 ± 0.04 | 0.40 ± 0.05 | 20.47* |
P < 0.0025; Genu of the CC (CC‐G), Body of the CC (CC‐B), Left‐SLF (L‐SLF), Left Cg (L‐Cg), Right Cg (R‐Cg).
Figure 3.
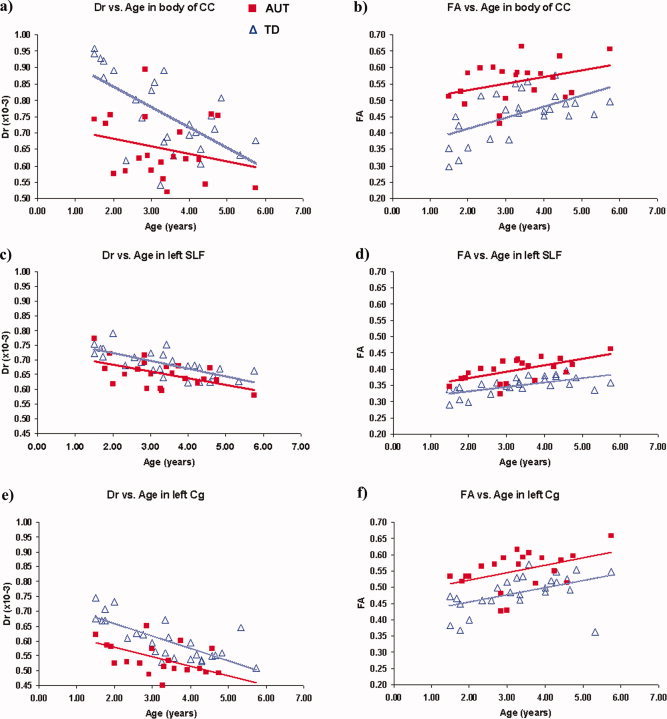
Distribution of FA and Dr relative to age of the children in the body of the CC (a,b), in the left SLF (c,d), and in the left Cg (e,f).
Tractography‐Based Analysis
Between judges inter and intra‐reliability of the diffusivities indices were determined on a randomly‐selected sample that constituted one third of the data. The correlation coefficient for the measurements were 0.93 (P < 0.05) and 0.91 (P < 0.05), respectively.
Mean values and statistical results for all diffusivity indices in all measured fiber tracts, are presented in Table II. Significant increase in FA was seen in children with autism (AUT) when compared with TD controls in the mid‐body of the CC, i.e., Witelson segment III (AUT = 0.50 ± 0.04, TD = 0.47 ± 0.05; P = 0.032) and in the left Cg (AUT = 0.42 ± 0.04, TD = 0.40 ± 0.026; P = 0.017). No significant differences were detected in other diffusion indices, or in any VOIs.
Table II.
Statistics for group differences in diffusivity indices from tractography
| Da (×10−3 mm2/s) | Dr (×10‐3 mm2/s) | MD (×10−3 mm2/s) | FA (a.u.) | |||||||||
|---|---|---|---|---|---|---|---|---|---|---|---|---|
| TD | AUT | t | TD | AUT | t | TD | AUT | t | TD | AUT | t | |
| CC‐w1 | 1.47 ± 0.14 | 1.52 ± 0.10 | −1.34 | 0.60 ± 0.05 | 0.59 ± 0.05 | 0.42 | 0.89 ± 0.07 | 0.89 ± 0.05 | −0.50 | 0.53 ± 0.03 | 0.54 ± 0.04 | −1.14 |
| CC‐w2 | 1.48 ± 0.14 | 1.49 ± 0.10 | −0.29 | 0.63 ± 0.08 | 0.62 ± 0.06 | 0.86 | 0.92 ± 0.09 | 0.91 ± 0.06 | 0.37 | 0.51 ± 0.03 | 0.52 ± 0.04 | −1.17 |
| CC‐w3 | 1.53 ± 0.20 | 1.55 ± 0.14 | −0.36 | 0.71 ± 0.15 | 0.68 ± 0.10 | 0.95 | 0.98 ± 0.16 | 0.97 ± 0.10 | 0.44 | 0.47 ± 0.05 | 0.50 ± 0.04 | −2.21* |
| CC‐w4 | 1.55 ± 0.15 | 1.56 ± 0.12 | −0.37 | 0.69 ± 0.11 | 0.67 ± 0.07 | 0.70 | 0.98 ± 0.12 | 0.97 ± 0.08 | 0.27 | 0.49 ± 0.04 | 0.50 ± 0.04 | −0.99 |
| CC‐w5 | 1.56 ± 0.15 | 1.63 ± 0.11 | −1.79 | 0.57 ± 0.07 | 0.59 ± 0.05 | −0.75 | 0.90 ± 0.09 | 0.93 ± 0.06 | −1.39 | 0.58 ± 0.03 | 0.58 ± 0.02 | −0.54 |
| CC‐all | 1.49 ± 0.13 | 1.56 ± 0.10 | −1.63 | 0.58 ± 0.05 | 0.59 ± 0.04 | −0.56 | 0.88 ± 0.07 | 0.91 ± 0.05 | −1.29 | 0.51 ± 0.05 | 0.55 ± 0.03 | −1.05 |
| SLF‐l | 1.22 ± 0.09 | 1.25 ± 0.07 | −1.20 | 0.62 ± 0.05 | 0.65 ± 0.04 | −1.18 | 0.82 ± 0.06 | 0.85 ± 0.05 | −1.65 | 0.43 ± 0.03 | 0.43 ± 0.02 | 0.51 |
| SLF‐r | 1.24 ± 0.09 | 1.24 ± 0.07 | −0.23 | 0.62 ± 0.05 | 0.64 ± 0.05 | −1.08 | 0.82 ± 0.06 | 0.84 ± 0.05 | −0.77 | 0.44 ± 0.03 | 0.43 ± 0.03 | 0.83 |
| Cg‐l | 1.23 ± 0.09 | 1.26 ± 0.08 | −1.20 | 0.66 ± 0.05 | 0.64 ± 0.04 | 1.18 | 0.85 ± 0.06 | 0.85 ± 0.05 | 0.07 | 0.40 ± 0.03 | 0.42 ± 0.04 | −2.48* |
| Cg‐r | 1.26 ± 0.10 | 1.31 ± 0.10 | −1.78 | 0.63 ± 0.05 | 0.63 ± 0.05 | 0.31 | 0.84 ± 0.06 | 0.86 ± 0.05 | −0.92 | 0.43 ± 0.04 | 0.45 ± 0.06 | −1.80 |
P < 0.05; Witelson segments 1–5 (CC‐w1‐5), Left/Right‐SLF (L‐SLF/R‐SLF), Left/Right Cg (L‐Cg/R‐Cg).
DISCUSSION
The results of the current study point to white matter differences between young children with autism and TD children. TBSS and TBSS‐VOIs analyses showed increased anisotropy as reflected by increased FA, and decreased radial diffusivity in the genu and the midbody of the CC, in the left SLF and in the right and left Cg. Tractography analysis showed increased FA only in the midbody of the CC and in the left Cg. Importantly, reduced FA was not detected in any brain region in any analysis.
These results are in line with our previous work in which using high b value DWI, elevated FA values in toddlers with autism have been reported in selected brain regions including the genu of the CC (forceps minor) and the left SLF [Ben Bashat et al.,2007]. However, these results contrast with studies of older children and adults with autism, which reported of reduced FA in several regions including the CC [Alexander et al.,2007; Barnea‐Goraly et al.,2004; Keller et al.,2007]. Similarly, Lee et al. [2007] reported reduced FA in the superior temporal gyrus in adolescents and young adults with autism. Yet note that a consideration of the data points presented in Fig. 2 [Lee et al.,2007] suggests that in younger ages there could be a reversal of this trend and FA may be increased relative to normal controls. If so then these conflicting results may be a function of the age of the patients. A similar concern relating to the possibility of age dependency of imaging measurements has been raised in a recent metaanalysis of studies that report amigdalea volumes in autism [Stanfield et al.,2008]. The inconsistent results turned out to be a factor of age of the patients. Thus, while enlargement of amigdalea was found in young children with autism, it was not present in older subjects.
Changes in FA can have multiple causes. They may come about through factors such as myelination, axon size and density, path geometry, and the presence of crossing fiber pathways [Snook et al.,2005; Suzuki et al.,2003]. In the current study, VOIs analysis based on the TBSS results was performed to provide better insight to the microstructural changes that underlie the increase in FA values. In normal development, different patterns of diffusivity indices represent various normal maturational stages that reflect microstructural changes, such as changes in water content and membrane density [Dubois et al.,2008]. The pattern of changes in diffusivity indices reported here indicating no change in MD and Da, increased FA and decreased Dr may represent abnormal maturation. This may be related to minicolumnar abnormalities, reduced cell size, and increased cell density which have been previously reported in several brain regions in subjects with autism [Casanova and Trippe,2009; Casanova et al.,2006].
To the best of our knowledge, ours is the first TBSS study reported for young children with autism. TBSS has been applied however, to study white matter pathology and development in other syndromes [Arnone et al.,2008; Ciccarelli et al.,2008; Hoeft et al.,2007]. Indeed TBSS seems a worthwhile method because it offers a solution to the problem of aligning images from multiple subjects and avoids the arbitrariness of the choice of spatial smoothing that is characteristic of other methods, such as voxel‐based morphometry [Smith et al.,2006]. The fact that the invariant tract representation is the group mean of the white matter skeletons, and no external templates are necessary, is especially important in the study of young children, since in other methods most templates and alignment are based on adults [Wilke et al.,2003].
In the current study, TBSS analysis showed significant differences in several regions, whereas most of these differences failed to show up in the tractography analysis. These seeming inconsistencies may be a reflection of the fact that TBSS is based on voxel to voxel comparison of the entire white matter skeleton, while tractography looks at specific fiber tracts, chosen according to a‐priori hypothesis. Since tractography analysis yields an average value of the diffusion parameter across the entire tract, it might occlude localized differences in specific regions. Voxel‐based whole brain comparison may thus be a better method of analysis in cases of localized differences.
In the tractography analysis we chose to parcel the CC according to Witelson's segmentation [Witelson,1989]. While there are other options for CC segmentation, some taking into consideration the functional aspects of these fibers [Hofer and Frahm,2006], Witelson method of segmentation has been previously used in several volumetric studies of patients with autism. These studies reported differences in the posterior region of the CC [Just et al., 2007; Piven,1997; Vidal et al.,2006], as well as in other subregions of the CC when adjusting for cerebral volume [Boger‐Megiddo et al.,2006]. Volumetric differences in the anterior part of the CC [Hardan et al.,2000; Just et al., 2007, Vidal et al.,2006] as well as in the body of the CC [Piven,1997], were likewise detected. These locations are similar to those reported in the current study.
The CC is the principal white matter fiber bundle connecting neocortical areas of the two hemispheres and is topographically organized. The anterior part of the CC represents fibers from prefrontal cortices and the midbody regions are composed of fibers from the premotor, motor, and superior temporal cortices. Abnormal findings in these areas in subjects with autism have been related to several hypothesis such as the reduced functional output of the mirror neurons [Oberman and Ramachandran,2007] and the aberrant connectivity theory [Courchesne et al.,2005b]. Our findings provide neuroanatomical evidence of abnormal integrity of white matter in these regions, already apparent at young ages.
Abnormal white matter integrity was detected in the TBSS–VOIs analysis in the left SLF at a very young age. Further confirmation of this finding is important since structural changes in the left SLF may be implicated in the language deficits that are common in autism. In a case study of four toddlers with autism the abnormal structure in this fiber was correlated with language acquisition later in life [Levy et al., in press]. Earlier work has shown that white matter integrity in the SLF is correlated with language deficits in patients with schizophrenia [Karlsgodt et al.,2008] and with reading abilities in typically developing children [Beaulieu et al.,2005; Deutsch et al.,2005].
The abnormal integrity seen in the Cg may be of particular relevance to the behavioral outcome of autism. The Cg is part of the limbic fibers involved in emotions, motivation, and emotional association with memory. It is a medial associative bundle that runs within the cingulate gyrus all around the corpus callosum. Previously, Barnea‐Goraly et al. [2004] reported significantly reduced FA values in the anterior cingulate, in high functioning adolescents with autism. In a recent study by Pugliese et al. [2009], a higher number of streamlines were detected in the right and left cingulum in subjects with Asperger syndrome (mean age 23 ± 12 years) compared to controls, although no differences were detected in FA and MD values. Abnormal volumes of several structures within the limbic system have likewise been reported [Stanfield et al.,2008; Verhoeven et al.,2009]. All of these results may point to abnormal connectivity between the frontal cortex and the limbic systems which likely relate to the social, emotional, and communication abnormalities typically found in autism.
Importantly, findings in the current study may result from several other factors that are not directly related to autism such as IQ and type of intervention. In the current study both groups did not undergo IQ assessment. In future studies the possible roles of IQ and other behavioral parameters should be investigated.
In sum, current theories of neural deficiencies in autism emphasize the first few years of life as a key period when abnormalities in the development of neural circuitry occur, along with the first behavioral signs of autism. Detection of brain abnormalities at this time of development is, therefore, of utmost importance as they may be related to the basic neural defects that are implicated in autism. Abnormal white matter structure, already apparent in young ages, may lead to abnormal connectivity which has been suggested as the neural basis of altered cognition in autism [Hughes,2007; Just et al.,2004; Koshino et al.,2007; Luna et al.,2002; Muller,2007].
Acknowledgements
The authors are grateful to the children and families who so willingly participated in this study.
Footnotes
ADI‐R is a semi‐structured parental interview that follows DSM‐IV criteria for autism [Lord et al.,1994].
ADOS is a semi‐structured, interactive schedule designed to assess social, communication, play, and stereotyped behavior and interests. The original ADOS diagnostic algorithm classifies children into categories of autism, ASD, or nonspectrum, based on items scores derived from the communication and reciprocal social interaction domains [Lord et al.,1989,1999].
REFERENCES
- Alexander AL,Lee JE,Lazar M,Boudos R,DuBray MB,Oakes TR,Miller JN,Lu J,Jeong EK,McMahon WM,Bigler ED,Lainhart JE ( 2007): Diffusion tensor imaging of the corpus callosum in Autism. Neuroimage 34: 61–73. [DOI] [PubMed] [Google Scholar]
- Arnone D,Barrick TR,Chengappa S,Mackay CE,Clark CA,Abou‐Saleh MT ( 2008): Corpus callosum damage in heavy marijuana use: Preliminary evidence from diffusion tensor tractography and tract‐based spatial statistics. Neuroimage 41: 1067–1074. [DOI] [PubMed] [Google Scholar]
- Assaf Y,Cohen Y ( 2000): Assignment of the water slow‐diffusing component in the central nervous system using q‐space diffusion MRS: Implications for fiber tract imaging. Magn Reson Med 43: 191–199. [DOI] [PubMed] [Google Scholar]
- Assaf Y,Ben Bashat D,Chapman J,Peled S,Biton IE,Kafri M,Segev Y,Hendler T,Korczyn AD,Graif M,Cohen Y ( 2002): High b‐value q‐space analyzed diffusion‐weighted MRI: Application to multiple sclerosis. Magn Reson Med 47: 115–126. [DOI] [PubMed] [Google Scholar]
- Barnea‐Goraly N,Kwon H,Menon V,Eliez S,Lotspeich L,Reiss AL ( 2004): White matter structure in autism: Preliminary evidence from diffusion tensor imaging. Biol Psychiatry 55: 323–326. [DOI] [PubMed] [Google Scholar]
- Basser PJ,Pierpaoli C ( 1996): Microstructural and physiological features of tissues elucidated by quantitative‐diffusion‐tensor MRI. J Magn Reson B 111: 209–219. [DOI] [PubMed] [Google Scholar]
- Bauman ML,Kemper TL ( 2005): Neuroanatomic observations of the brain in autism: A review and future directions. Int J Dev Neurosci 23: 183–187. [DOI] [PubMed] [Google Scholar]
- Beaulieu C,Plewes C,Paulson LA,Roy D,Snook L,Concha L,Phillips L ( 2005): Imaging brain connectivity in children with diverse reading ability. Neuroimage 25: 1266–1271. [DOI] [PubMed] [Google Scholar]
- Ben Bashat D,Ben Sira L,Graif M,Pianka P,Hendler T,Cohen Y,Assaf Y ( 2005): Normal white matter development from infancy to adulthood: Comparing diffusion tensor and high b value diffusion weighted MR images. J Magn Reson Imaging 21: 503–511. [DOI] [PubMed] [Google Scholar]
- Ben Bashat D,Kronfeld‐Duenias V,Zachor DA,Ekstein PM,Hendler T,Tarrasch R,Even A,Levy Y,Ben Sira L ( 2007): Accelerated maturation of white matter in young children with autism: A high b value DWI study. Neuroimage 37: 40–47. [DOI] [PubMed] [Google Scholar]
- Bloss CS,Courchesne E ( 2007): MRI neuroanatomy in young girls with autism: A preliminary study. J Am Acad Child Adolesc Psychiatry 46: 515–523. [DOI] [PubMed] [Google Scholar]
- Boger‐Megiddo I,Shaw DW,Friedman SD,Sparks BF,Artru AA,Giedd JN,Dawson G,Dager SR ( 2006): Corpus callosum morphometrics in young children with autism spectrum disorder. J Autism Dev Disord 36: 733–739. [DOI] [PubMed] [Google Scholar]
- Casanova MF,Trippe J ( 2009): Radial cytoarchitecture and patterns of cortical connectivity in autism. Philos Trans R Soc Lond B Biol Sci 364: 1433–1436. [DOI] [PMC free article] [PubMed] [Google Scholar]
- Casanova MF,van Kooten IA,Switala AE,van Engeland H,Heinsen H,Steinbusch HW,Hof PR,Trippe J,Stone J,Schmitz C ( 2006): Minicolumnar abnormalities in autism. Acta Neuropathol 112: 287–303. [DOI] [PubMed] [Google Scholar]
- Catani M,Jones DK,ffytche DH ( 2005): Perisylvian language networks of the human brain. Ann Neurol 57: 8–16. [DOI] [PubMed] [Google Scholar]
- Ciccarelli O,Behrens TE,Johansen‐Berg H,Talbot K,Orrell RW,Howard RS,Nunes RG,Miller DH,Matthews PM,Thompson AJ,Smith SM. ( 2008): Investigation of white matter pathology in ALS and PLS using tract‐based spatial statistics. Hum Brain Mapp 30: 615–624. [DOI] [PMC free article] [PubMed] [Google Scholar]
- Courchesne E ( 2004): Brain development in autism: Early overgrowth followed by premature arrest of growth. Ment Retard Dev Disabil Res Rev 10: 106–111. [DOI] [PubMed] [Google Scholar]
- Courchesne E,Pierce K ( 2005a): Brain overgrowth in autism during a critical time in development: Implications for frontal pyramidal neuron and interneuron development and connectivity. Int J Dev Neurosci 23: 153–170. [DOI] [PubMed] [Google Scholar]
- Courchesne E,Pierce K ( 2005b): Why the frontal cortex in autism might be talking only to itself: Local over‐connectivity but long‐distance disconnection. Curr Opin Neurobiol 15: 225–230. [DOI] [PubMed] [Google Scholar]
- Courchesne E,Karns CM,Davis HR,Ziccardi R,Carper RA,Tigue ZD,Chisum HJ,Moses P,Pierce K,Lord C,Lincoln AJ,Pizzo S,Schreibman L,Haas RH,Akshoomoff NA,Courchesne RY ( 2001): Unusual brain growth patterns in early life in patients with autistic disorder: An MRI study. Neurology 57: 245–254. [DOI] [PubMed] [Google Scholar]
- Courchesne E,Carper R,Akshoomoff N ( 2003): Evidence of brain overgrowth in the first year of life in autism. JAMA 290: 337–344. [DOI] [PubMed] [Google Scholar]
- Deutsch GK,Dougherty RF,Bammer R,Siok WT,Gabrieli JD,Wandell B ( 2005): Children's reading performance is correlated with white matter structure measured by diffusion tensor imaging. Cortex 41: 354–363. [DOI] [PubMed] [Google Scholar]
- DSM‐IV TR ( 1994): Diagnostic and Statistical Manual of Mental Disorders. Washington, DC: American Psychiatric Association. [Google Scholar]
- Dubois J,Dehaene‐Lambertz G,Perrin M,Mangin JF,Cointepas Y,Duchesnay E,Le Bihan D,Hertz‐Pannier L ( 2008): Asynchrony of the early maturation of white matter bundles in healthy infants: Quantitative landmarks revealed noninvasively by diffusion tensor imaging. Hum Brain Mapp 29: 14–27. [DOI] [PMC free article] [PubMed] [Google Scholar]
- Focke NK,Yogarajah M,Bonelli SB,Bartlett PA,Symms MR,Duncan JS ( 2007): Voxel‐based diffusion tensor imaging in patients with mesial temporal lobe epilepsy and hippocampal sclerosis. Neuroimage 40: 728–737. [DOI] [PubMed] [Google Scholar]
- Girgis RR,Minshew NJ,Melhem NM,Nutche JJ,Keshavan MS,Hardan AY ( 2007): Volumetric alterations of the orbitofrontal cortex in autism. Prog Neuropsychopharmacol Biol Psychiatry 31: 41–45. [DOI] [PMC free article] [PubMed] [Google Scholar]
- Hardan AY,Minshew NJ,Keshavan MS ( 2000): Corpus callosum size in autism. Neurology 55: 1033–1036. [DOI] [PubMed] [Google Scholar]
- Hoeft F,Barnea‐Goraly N,Haas BW,Golarai G,Ng D,Mills D,Korenberg J,Bellugi U,Galaburda A,Reiss AL ( 2007): More is not always better: Increased fractional anisotropy of superior longitudinal fasciculus associated with poor visuospatial abilities in Williams syndrome. J Neurosci 27: 11960–11965. [DOI] [PMC free article] [PubMed] [Google Scholar]
- Hofer S,Frahm J ( 2006): Topography of the human corpus callosum revisited—Comprehensive fiber tractography using diffusion tensor magnetic resonance imaging. Neuroimage 32: 989–994. [DOI] [PubMed] [Google Scholar]
- Hughes JR ( 2007): Autism: The first firm finding = underconnectivity? Epilepsy Behav 11: 20–24. [DOI] [PubMed] [Google Scholar]
- Just MA,Cherkassky VL,Keller TA,Minshew NJ ( 2004): Cortical activation and synchronization during sentence comprehension in high‐functioning autism: Evidence of underconnectivity. Brain 127 ( Part 8): 1811–1821. [DOI] [PubMed] [Google Scholar]
- Karlsgodt KH,van Erp TG,Poldrack RA,Bearden CE,Nuechterlein KH,Cannon TD ( 2008): Diffusion tensor imaging of the superior longitudinal fasciculus and working memory in recent‐onset schizophrenia. Biol Psychiatry 63: 512–518. [DOI] [PubMed] [Google Scholar]
- Ke X,Tang T,Hong S,Hang Y,Zou B,Li H,Zhou Z,Ruan Z,Lu Z,Tao G,Liu Y ( 2009): White matter impairments in autism, evidence from voxel‐based morphometry and diffusion tensor imaging. Brain Res 1265: 171–177. [DOI] [PubMed] [Google Scholar]
- Keller TA,Kana RK,Just MA ( 2007): A developmental study of the structural integrity of white matter in autism. Neuroreport 18: 23–27. [DOI] [PubMed] [Google Scholar]
- Koshino H,Kana RK,Keller TA,Cherkassky VL,Minshew NJ,Just MA ( 2007): fMRI investigation of working memory for faces in autism: Visual coding and underconnectivity with frontal areas. Cereb Cortex 18: 289–300. [DOI] [PMC free article] [PubMed] [Google Scholar]
- Lainhart JE ( 2006): Advances in autism neuroimaging research for the clinician and geneticist. Am J Med Genet C Semin Med Genet 142: 33–39. [DOI] [PubMed] [Google Scholar]
- Lee JE,Bigler ED,Alexander AL,Lazar M,DuBray MB,Chung MK,Johnson M,Morgan J,Miller JN,McMahon WM,Lu J,Jeong EK,Lainhart JE ( 2007): Diffusion tensor imaging of white matter in the superior temporal gyrus and temporal stem in autism. Neurosci Lett 424: 127–132. [DOI] [PubMed] [Google Scholar]
- Levy Y,Ben Bashat D,Ben Sira L,Hendler T,Ben Itzhak E,Kronfeld‐Duenias V,Zachor DA: Abnormal white matter in language‐related brain tracts in non‐verbal children with autism: A case study of four toddlers. Intl J Public Health (in press). [Google Scholar]
- Lord C,Rutter M,Goode S,Heemsbergen J,Jordan H,Mawhood L,Schopler E ( 1989): Autism diagnostic observation schedule: A standardized observation of communicative and social behavior. J Autism Dev Disord 19: 185–212. [DOI] [PubMed] [Google Scholar]
- Lord C,Rutter M,Le Couteur A ( 1994): Autism diagnostic interview‐revised: A revised version of a diagnostic interview for caregivers of individuals with possible pervasive developmental disorders. J Autism Dev Disord 24: 659–685. [DOI] [PubMed] [Google Scholar]
- Lord C,Rutter M,DiLavore PC,Risi S ( 1999): Autism Diagnostic Observation Schedule‐WPS (ADOS‐WPS). Los Angeles: Western Psychological Services. [Google Scholar]
- Luna B,Minshew NJ,Garver KE,Lazar NA,Thulborn KR,Eddy WF,Sweeney JA ( 2002): Neocortical system abnormalities in autism: An fMRI study of spatial working memory. Neurology 59: 834–840. [DOI] [PubMed] [Google Scholar]
- McAlonan GM,Cheung V,Cheung C,Suckling J,Lam GY,Tai KS,Yip L,Murphy DG,Chua SE ( 2005): Mapping the brain in autism. A voxel‐based MRI study of volumetric differences and intercorrelations in autism. Brain 128 ( Part 2): 268–276. [DOI] [PubMed] [Google Scholar]
- Mori S,van Zijl P ( 2007): Human white matter atlas. Am J Psychiatry 164: 1005. [DOI] [PubMed] [Google Scholar]
- Mori S,Crain BJ,Chacko VP,van Zijl PC ( 1999): Three‐dimensional tracking of axonal projections in the brain by magnetic resonance imaging. Ann Neurol 45: 265–269. [DOI] [PubMed] [Google Scholar]
- Muller RA ( 2007): The study of autism as a distributed disorder. Ment Retard Dev Disabil Res Rev 13: 85–95. [DOI] [PMC free article] [PubMed] [Google Scholar]
- Oberman LM,Ramachandran VS ( 2007): The simulating social mind: The role of the mirror neuron system and simulation in the social and communicative deficits of autism spectrum disorders. Psychol Bull 133: 310–327. [DOI] [PubMed] [Google Scholar]
- Pardini M,Garaci FG,Bonzano L,Roccatagliata L,Palmieri MG,Pompili E,Coniglione F,Krueger F,Ludovici A,Floris R,Benassi F,Emberti Gialloreti L. ( 2009): White matter reduced streamline coherence in young men with autism and mental retardation. Eur J Neurol 16: 1185–1190. [DOI] [PubMed] [Google Scholar]
- Piven J ( 1997): The biological basis of autism. Curr Opin Neurobiol 7: 708–712. [DOI] [PubMed] [Google Scholar]
- Pugliese L,Catani M,Ameis S,Dell'Acqua F,Thiebaut de Schotten M,Murphy C,Robertson D,Deeley Q,Daly E,Murphy DG ( 2009): The anatomy of extended limbic pathways in Asperger syndrome: A preliminary diffusion tensor imaging tractography study. Neuroimage 47: 427–434. [DOI] [PubMed] [Google Scholar]
- Smith SM,Nichols TE ( 2009): Threshold‐free cluster enhancement: Addressing problems of smoothing, threshold dependence and localisation in cluster inference. Neuroimage 44: 83–98. [DOI] [PubMed] [Google Scholar]
- Smith SM,Jenkinson M,Johansen‐Berg H,Rueckert D,Nichols TE,Mackay CE,Watkins KE,Ciccarelli O,Cader MZ,Matthews PM,Behrens TE ( 2006): Tract‐based spatial statistics: Voxelwise analysis of multi‐subject diffusion data. Neuroimage 31: 1487–1505. [DOI] [PubMed] [Google Scholar]
- Smith SM,Johansen‐Berg H,Jenkinson M,Rueckert D,Nichols TE,Miller KL,Robson MD,Jones DK,Klein JC,Bartsch AJ,Behrens TE ( 2007): Acquisition and voxelwise analysis of multi‐subject diffusion data with tract‐based spatial statistics. Nat Protoc 2: 499–503. [DOI] [PubMed] [Google Scholar]
- Snook L,Paulson LA,Roy D,Phillips L,Beaulieu C ( 2005): Diffusion tensor imaging of neurodevelopment in children and young adults. Neuroimage 26: 1164–1173. [DOI] [PubMed] [Google Scholar]
- Stanfield AC,McIntosh AM,Spencer MD,Philip R,Gaur S,Lawrie SM ( 2008): Towards a neuroanatomy of autism: A systematic review and meta‐analysis of structural magnetic resonance imaging studies. Eur Psychiatry 23: 289–299. [DOI] [PubMed] [Google Scholar]
- Sundaram SK,Kumar A,Makki MI,Behen ME,Chugani HT,Chugani DC ( 2008): Diffusion tensor imaging of frontal lobe in autism spectrum disorder. Cereb Cortex 18: 2659–2665. [DOI] [PMC free article] [PubMed] [Google Scholar]
- Suzuki Y,Matsuzawa H,Kwee IL,Nakada T ( 2003): Absolute eigenvalue diffusion tensor analysis for human brain maturation. NMR Biomed 16: 257–260. [DOI] [PubMed] [Google Scholar]
- Thakkar KN,Polli FE,Joseph RM,Tuch DS,Hadjikhani N,Barton JJ,Manoach DS ( 2008): Response monitoring, repetitive behaviour and anterior cingulate abnormalities in autism spectrum disorders (ASD). Brain 131 ( Part 9): 2464–2478. [DOI] [PMC free article] [PubMed] [Google Scholar]
- Verhoeven JS,De Cock P,Lagae L,Sunaert S ( 2009): Neuroimaging of autism. Neuroradiology 52: 3–14. [DOI] [PubMed] [Google Scholar]
- Vidal CN,Nicolson R,Devito TJ,Hayashi KM,Geaga JA,Drost DJ,Williamson PC,Rajakumar N,Sui Y,Dutton RA,Toga AW,Thompson PM. ( 2006): Mapping corpus callosum deficits in autism: An index of aberrant cortical connectivity. Biol Psychiatry 60: 218–25. [DOI] [PubMed] [Google Scholar]
- Waiter GD,Williams JH,Murray AD,Gilchrist A,Perrett DI,Whiten A ( 2005): Structural white matter deficits in high‐functioning individuals with autistic spectrum disorder: A voxel‐based investigation. Neuroimage 24: 455–461. [DOI] [PubMed] [Google Scholar]
- Wakana S,Jiang H,Nagae‐Poetscher LM,van Zijl PC,Mori S ( 2004): Fiber tract‐based atlas of human white matter anatomy. Radiology 230: 77–87. [DOI] [PubMed] [Google Scholar]
- Wilke M,Schmithorst VJ,Holland SK ( 2003): Normative pediatric brain data for spatial normalization and segmentation differs from standard adult data. Magn Reson Med 50: 749–757. [DOI] [PubMed] [Google Scholar]
- Witelson SF ( 1989): Hand and sex differences in the isthmus and genu of the human corpus callosum. A postmortem morphological study. Brain 112 ( Part 3): 799–835. [DOI] [PubMed] [Google Scholar]