

Abstract
A fundamental question with regard to perceptual development is how multisensory information is processed in the brain during the early stages of development. Although a growing body of evidence has shown the early emergence of modality‐specific functional differentiation of the cortical regions, the interplay between sensory inputs from different modalities in the developing brain is not well understood. To study the effects of auditory input during audio‐visual processing in 3‐month‐old infants, we evaluated the spatiotemporal cortical hemodynamic responses of 50 infants while they perceived visual objects with or without accompanying sounds. The responses were measured using 94‐channel near‐infrared spectroscopy over the occipital, temporal, and frontal cortices. The effects of sound manipulation were pervasive throughout the diverse cortical regions and were specific to each cortical region. Visual stimuli co‐occurring with sound induced the early‐onset activation of the early auditory region, followed by activation of the other regions. Removal of the sound stimulus resulted in focal deactivation in the auditory regions and reduced activation in the early visual region, the association region of the temporal and parietal cortices, and the anterior prefrontal regions, suggesting multisensory interplay. In contrast, equivalent activations were observed in the lateral occipital and lateral prefrontal regions, regardless of sound manipulation. Our findings indicate that auditory input did not generally enhance overall activation in relation to visual perception, but rather induced specific changes in each cortical region. The present study implies that 3‐month‐old infants may perceive audio‐visual multisensory inputs by using the global network of functionally differentiated cortical regions. Hum Brain Mapp, 2013. © 2011 Wiley Periodicals, Inc.
Keywords: audio‐visual processing, cortical development, hemodynamics, near‐infrared spectroscopy, multisensory perception, activation, deactivation
INTRODUCTION
In real‐world situations, perceptual events often occur concurrently via multiple sensory modalities, and this infers a complex brain mechanism for multisensory integration involving diverse cortical regions. Although this mechanism should develop in infancy, the manner in which the infant brain functions during multisensory perception is not clear. Previous behavioral studies have shown that infants possess a variety of multisensory perceptual abilities [Lewkowicz, 2000, 2002; Lickliter and Bahrick, 2000]. For example, infants can respond faster to audio‐visual stimuli when compared with unisensory stimuli [Castillo and Butterworth, 1981; Neil et al., 2006], and they are capable of detecting audio‐visual synchrony relations [Bahrick, 1992; Bahrick and Lickliter, 2000, 2004; Dodd, 1979; Lewkowicz, 1992, 1996; Spelke, 1976; Spelke et al., 1983] and perceiving illusions arising from audio‐visual interactions [Scheier et al., 2003]. The recent progress in near‐infrared spectroscopy (NIRS)‐based neuroimaging techniques has facilitated the observation of cortical responses in infants during visual [Blasi et al., 2007; Csibra et al., 2004; Gervain et al., 2008; Meek et al., 1998; Minagawa‐Kawai et al., 2009; Otsuka et al., 2007; Taga et al., 2003; Watanabe et al., 2008; Willcox et al., 2005] and auditory processing [Bortfield et al., 2007; Homae et al., 2006, 2007; Minagawa‐Kawai et al., 2007; Nakano et al., 2008, 2009; Peña et al., 2003; Taga et al., 2007]. In particular, the functional differentiation of the occipital and temporal cortices was revealed by investigating cortical activation in response to asynchronous presentation of unrelated visual and auditory stimuli in young infants [Taga and Asakawa, 2007; Taga et al., 2003]. Other studies focused on modality‐specific brain mechanisms involved in the processing of visual [Watanabe et al., 2008, 2010] or auditory [Bortfeld et al., 2007] stimuli in the presence of a common input from another modality. Although these studies indicate that sensory inputs from different modalities activate specific regions involved in processing the stimuli (i.e., the occipital region for visual inputs and the temporal region for auditory inputs), the interplay between sensory inputs from different modalities in the developing brain is not well understood.
Neurophysiological and neuroimaging studies with primates and human adults have shown that diverse cortical regions are implicated in the perception and integration of multisensory input [Amedi et al., 2005; Beauchamp, 2005; Calvert, 2001; Senkowski et al., 2008; Stein and Stanford, 2008]. These studies suggest that higher sensory and association regions of the occipital, temporal, and frontal cortices are involved in the perception and integration of audio‐visual multisensory inputs. In particular, the lateral occipital complex, the superior temporal sulcus, and the prefrontal cortex contribute to the integrated perception of auditory and visual information with regard to objects [Amedi et al., 2005; Beauchamp, 2005; Beauchamp et al., 2004b]. Furthermore, in contrast to traditional notions in which sensory‐specific cortices are “unisensory” areas and are insensitive to inputs from different sensory modalities, an increasing number of studies with human adults have revealed that the interplay between inputs from different modalities can affect not only the multisensory association regions but also the early sensory regions that were previously considered to be sensory specific ([Calvert et al., 1999; Giard and Peronnet, 1999; Kayser et al., 2007; Laurienti et al., 2002; Martuzzi et al., 2007]; see also Driver and Noesselt [2008] for a review). It has been found that audio‐visual multisensory inputs produced event‐related cortical activation over diverse regions such as the early visual and auditory regions, higher sensory and association regions, and prefrontal regions in young infants [Watanabe et al., 2008, 2010]. However, to the best of our knowledge, it is not clear how auditory inputs have an effect on activations in these diverse cortical regions in young infants. If young infants perceive audio‐visual multisensory inputs in the global network of functionally differentiated cortical regions, complex interplay among the diverse cortical regions might occur during multisensory processing. According to this hypothesis, the effects of sound manipulation may not be confined to auditory regions, but be pervasive throughout the diverse cortical regions. In the present study, in order to clarify multisensory interplay in the developing brain using NIRS, we investigated activation of early sensory (i.e., visual and auditory), unimodal sensory association, and multimodal sensory or higher association (e.g., prefrontal) regions, as regions of interests, in response to audio‐visual stimuli and visual stimuli without sound in 3‐month‐old infants.
Previous studies showing functional differentiation in young infants allowed us to advance with the following hypotheses. First, while stimuli with sound information may produce activation in the temporal auditory‐related regions, such as the early auditory and the unimodal auditory association regions, removal of the sound information may induce no response in these regions. Second, audio‐visual stimuli may enhance activation in the higher multimodal sensory areas in the occipito‐temporal and prefrontal regions. Thus, in these regions, audio‐visual stimulation may induce larger cortical responses than unimodal visual stimulation. Third, audio‐visual stimuli and unimodal visual stimuli may produce activation in the occipital visual‐related regions, such as the early visual and unimodal visual association regions. In addition, the visual stimuli used in the present study, which included rich information of shapes, colors, and motions, may induce activation in the visual association regions. Finally, if different sensory regions interplay in the infant brain as they do in the adult brain, auditory information will facilitate activation in the occipital visual regions during audio‐visual presentation.
Although the majority of the previous functional magnetic resonance imaging (fMRI) studies have reported spatially localized activation using the template of canonical hemodynamic responses to stimuli, the analysis of the temporal aspects of blood oxygenation‐level dependent signals provides rich information about the activation and/or deactivation flow(s) in diverse cortical regions. First, different cortical regions exhibit differences in the latency of event‐related responses depending on the perceptual and cognitive tasks [Alpert et al., 2008; Henson et al., 2002; Sridharan et al., 2007]. Second, there are variations in the hemodynamic response forms, for example, transient and sustained changes in response to sound in the auditory cortex [Seifritz et al., 2002]. Third, negative signal changes (i.e., decreases in blood oxygenation levels) in response to stimuli are pervasive [Shmuel et al., 2002, 2006]. In particular, visual stimuli activate the visual region and deactivate the auditory region during multisensory perception [Beauchamp et al., 2004b; Laurienti et al., 2002]. An fMRI study performed on 3‐month‐old infants also reported spatiotemporal characterization during the processing of auditory stimuli [Dehaene‐Lanbertz et al., 2006]. In the present study, to reveal the spatiotemporal dynamics of event‐related hemodynamic responses during multisensory perception in young infants, we used multichannel NIRS, which provides high time resolution measurements of hemodynamic responses in a quiet environment.
MATERIALS AND METHODS
Participants
Fifty full‐term healthy infants (25 girls and 25 boys; mean age, 112.36 days; age range, 101–123 days) were participated in the study. We studied 107 additional infants but excluded them from the analysis because of the following reasons: refusal during probe placement (n = 10), head movements that introduced large motion artifacts in the signals (n = 51), crying or fussiness during the measurement (n = 31), drowsiness during the measurement (n = 5), or failure to obtain adequate signals due to obstruction by hair (n = 10). Participants were recruited from the local Basic Resident Register. This study was approved by the ethics committee of the Graduate School of Education, University of Tokyo, and written informed consents were obtained from the parent(s) of all the infants before the initiation of the experiments.
Stimuli
The target stimulus comprised 5‐s video images of colorful moving objects of a mobile toy (Fig. 1A). The mobile was made up of 16 small bells and eight‐colored objects (the objects were blue, green, yellow, pink, or purple fishes, and the visual angle was set at 21.4°–28.6° for each object). The mean luminance of the mobile objects was 15.1 cd/m2 and that of the white background was 83.7 cd/m2. The mobile was not commercially available; therefore, the infants had not been previously exposed to any of these objects. The video image was the same as that used in our previous NIRS study on object perception in infants [Watanabe et al., 2008, 2010], and the real mobile objects were used in a previous behavioral study on infant memory that involved a conjugate reinforcement mobile task [Watanabe and Taga, 2006, 2009]. There were two conditions for the stimuli presentations: In the sound condition, the video image of the mobile was presented along with the sound of ringing bells, which was produced by the moving mobiles [maximum value, 37.9 dB which was measured by a sound pressure meter (NA‐26; RION Corporation, Tokyo, Japan); prominent frequency, 4,062 Hz; root mean square, 8.7 × 10⁻³ Pa; this was approximately three times that of the fireworks presented during the interstimulus periods]. The sound was considered to be sufficiently audible in a noise attenuating room. In the no‐sound condition, the same video image was presented but sounds were removed. The duration of the interstimulus interval was set at 10 s. To coax the awake infants into paying attention to the display without moving during long inter stimulus interval (ISI) periods, video images of fireworks (visual angle, ∼ 25°) with low luminance (6.4 cd/m2 for fireworks and 3.5 cd/m2 for background) and colors that were less chromatic were displayed. In our previous study, the test video image of the mobile evoked considerable visual responses when compared with the baseline activity during the presentation of the stimuli with subdued luminance and color [Watanabe et al., 2008, 2010]. Soft sounds of fireworks (maximum value, 36.6 dB) were presented during the rest periods.
Figure 1.

Experimental stimuli, procedure, and measurement channels. A: The target video image of the colorful moving mobile objects and the schematic diagram of the experimental procedure. Each 5‐s target video image with or without the sound of ringing bells was alternately presented in the course of six trials each. The sound of ringing bells was played only during the sound condition. The duration of the interstimulus interval was 10 s, and video images of fireworks with low luminance and less chromatic color were presented. AVs and Vs represent audio‐visual stimuli and visual stimuli, respectively. B: Top and left side views of the arrangement of the measurement channels. The set of probes was tightly fixed by a net bandage. C: The arrangement of the 94 measurement channels over the bilateral cortices. The red and blue filled circles indicate the incident and detection positions for NIRS, respectively. The distance between the closest incident and detection positions was ∼ 2 cm. The gray‐filled circles indicate the positions according to the international 10–20 system of electrode placement.
Procedure
We conducted the experiments in a noise attenuating and dimly lit (180 lx) room. The awake infants sat on the experimenter's lap and viewed the visual stimuli on a 50‐in. plasma display (Eizo FlexScan P 5071) at a distance of 70 cm. A speaker system (Bose MMS‐1) was positioned behind the display to deliver the sound stimuli. We prepared the video images, including 12 trials (six trials in each condition), that lasted 180 s, and infants were allowed to watch the stimuli for as long as they cooperated without much movement. The stimuli and the schematic diagrams of the procedure are illustrated in Figure 1A. Each 5‐s target video image with or without the sound of ringing bells was alternately presented in the course of six trials each. All infants began with the sound condition. The sound of ringing bells was played only during the sound condition. The duration of the ISI was 10 s, and video images of fireworks with low luminance and less chromatic color were presented. We recorded the behavior of the infants on videotape.
Data Acquisition
The multichannel NIRS instrument used in the present study (ETG‐7000; Hitachi Medical Corporation, Tokyo, Japan) can detect changes in the relative concentrations of oxygenated hemoglobin (oxy‐Hb) and deoxygenated hemoglobin (deoxy‐Hb) with 0.1‐s time resolutions at multiple measurement channels. Two NIR wavelengths (785 and 830 nm) were used in this study. The intensity of the illumination of the NIR light at each incident position was 0.6 mW. On the basis of the Lambert–Beer law, we evaluated the relative changes in the oxy‐Hb and deoxy‐Hb signals from the arbitrary zero baseline at the start of the measurement period for the 94 measurement channels [Maki et al., 1995; Reynolds et al., 1988]. Because the precise optical path length was unknown, the unit assigned to these values was derived by multiplying the molar concentration with the length (mM·mm). The 94 measurement channels were arranged over the occipital, temporal, and frontal cortices of each hemisphere (Fig. 1B,C). The set of probes for measurement was arranged as follows. Three pieces of the incident and detection fibers (hereafter, triple‐piece set) were arranged vertically, and the vertical interoptode distance between the fibers was fixed at 2.0 cm. We arranged 10 movable triple‐piece sets over each hemisphere at even horizontal distances. Because the head sizes of the infants ranged from 39.0 to 42.9 cm [mean, 41.0 cm; standard deviation (SD), 1.0 cm], the horizontal interoptode distance between the adjacent sets ranged from 1.95 to 2.15 cm (mean, 2.05 cm). Each pair of adjacent incident and detection fibers defined a single measurement channel. Taga et al. [2007] showed empirical data assessing the effects of source‐detector distances on the NIRS measurement of the cortical hemodynamic responses to auditory stimuli in 3‐month‐old infants and demonstrated that a 2‐cm source‐detector distance provided the highest sensitivity to cortical responses.
The spatial positioning of the 94 measurement channels was achieved by using the relative positions defined by the 10–20 electrode system for electroencephalography as references. In this procedure, the measurement channels were relatively positioned on the brain independent of the differences in brain size. The expected structural regions for which measurements would be obtained are as described below (see also Fig. 1C). The middle point between the measurement channel left 5 (L5) and right 5 (R5) was positioned 1 cm above the inion and that between L45 and R45 was positioned 2 cm above the nasion. The middle points between L25 and L30 and R25 and R30 were positioned on the T3 and T4, respectively. The middle point of L3 and R3 was located posterior to Pz and that of L43 and R43 was located anterior to Fz. Radially arranged columns of channels (e.g., columns consisting of two channels such as L46 and L47, and three channels such as L43, L44, and L45) were evenly arranged for each quadrant of the scalp along the horizontal reference curve (Fpz‐FP1‐F7‐T3…), except for the two radial channel columns located along the sagittal midline where optodes were not placed.
Next, we used the virtual registration [Tsuzuki et al., 2007] to register NIRS data to Montreal Neurological Institute (MNI) standard brain space (reviewed in Brett et al. [2002]), and estimate the macrostructural anatomies for channel positions (Fig. 2 and Table SI and SII in Supporting Information). It has been previously reported that young children's brains differ from adult brains in tissue composition (e.g., gray and white matters) from adult brains [Altaya et al., 2008]. Nevertheless, we adopted the adult‐brain atlas based on the assumption that the relative macrostructural anatomical pattern of young infant cortices is similar to that of adult ones. This assumption is based on the study by Hill et al. [2010], which showed that the surface‐based atlas of the cerebral cortex in term infants is similar to the adult in the pattern of individual variability. Hill et al. [2010] have established a population average surface‐based atlas of the human cerebral cortex at term gestation. This atlas was used to compare cortical shape characteristics of infants with those of adults. Cortical surface reconstructions for the hemispheres of 12 healthy term gestation infants were generated from structural MRI data. Based on these reconstructions, the authors have concluded that the cortical structure in term infants is largely similar to that in adults. Among others, similarities are observed in the pattern of individual variability and the presence of statistically significant structural asymmetries in the lateral temporal cortex, including the planum temporale and the superior temporal sulcus. This assumption should be also valid in children (7–8 years), whose atlas‐transformed brain morphology is relatively consistent with the one of adults [Burgund et al., 2002]. Briefly, the virtual registration method allows us to place a virtual probe holder on the scalp by simulating the holder's deformation and by registering probes and channels onto reference brains in place of a subject's brain. We generated a virtual holder to mimic the deformation of the 94‐channel holder using a holder deformation algorithm [Tsuzuki et al., 2007]. Then, we generated 1,000 synthetic heads and brains that represent size and shape variations among the population, using an MRI database containing structural information on head, brain, and scalp landmarks [Jurcak et al., 2005; Okamoto et al., 2004]. The sizes of head circumferences were sampled from data of 208 infants aged 3 months who visited our laboratory (109 girls and 99 boys, mean age: 109.9 days, range of age: 91–120 days). Next, we placed the virtual holders on synthetic heads and projected them on the cortical surfaces [Okamoto and Dan, 2005]. The registered positions were normalized to MNI space [Singh et al., 2005]. We performed a statistical analysis of the MNI coordinate values for the NIRS channels and the 10–20 standard positions to obtain the most likely estimate of the location of them for the group of subjects and the spatial variability associated with the estimation.
Figure 2.

Demonstration of virtual registrations. The 94 measurement channels are shown from five different angles: (A) frontal view, (B) left temporal view, (C) top view, (D) right temporal view, and (E) occipital view. Green circles indicate the positions of the measurement channels and red circles indicate locations of 10–20 cortical projection points on a brain surface. The centers of colored circles represent the locations of the most likely MNI coordinates for the measurement channels or the 10–20 cortical projection points. Axes are correspondent to those in MNI space.
For the estimation of macrostructural anatomical information, we referred to a 3D atlas constructed by Tzourio‐Mazoyer et al. [2002], which serves as a standard anatomical labeling tool of the Statistical Parametric Mapping method. We scanned anatomical labeling information for voxels located within 1 cm from a given NIRS channel and obtained the probabilistic estimation for the anatomical labels. The mode macrostructural anatomical label was selected to represent the anatomical location of each channel.
Stability of channel positioning across participants as represented by standard deviation of positional estimation in MNI space was less than 11 mm for all the channels (6 mm on average) and smaller than the interoptode distance of 20 mm and interchannel separation of 14 mm; therefore, the data obtained can be averaged across infants on a channel‐by‐channel basis. Here, it should be noted that the transformation procedure differs between the fMRI and NIRS. The former is performed tri‐dimensionally to detect Sylvian opercularization and head shape deformations. On the other hand, the latter is a two‐dimensional transformation, only dealing with the relation between head and brain surfaces, that is, relative position of the sulci with regard to the head surface landmarks, such as 10–20 positions. Thus, although the virtual registration based on cranial landmark is expected to be fairly robust against the anatomical difference between infant and adult brain surfaces at a given spatial resolution of 14–20 mm defined as a typical distance between neighboring channels in infants whose NIRS data are available, it should be noted here that the current method is only based on the assumption that registration to MNI stereotactic space is applicable to infant brain. To validate the assumption that registration to MNI stereotactic space is applicable to infant brain, we performed the virtual registration of the NIRS optode and channel locations used in the current study to neonate AAL atlas [Shi et al., 2011] transformed to the MNI space [Altaye et al., 2008]. The virtual registrations with adult and neonate brains showed that they are macroanatomically comparable (Table SIII in Supporting Information for methods and results in neonates).
Data Analysis
To obviate motion artifacts in the video recordings, data obtained when the infant did not view the visual stimuli and/or moved his/her head during the experiment were excluded from further analyses. Particularly, because inhibiting body movements are difficult for young infants [Prechtl and Hopkins, 1986; Watanabe and Taga, 2006], we carefully eliminated infants who moved greatly during measurements. To circumvent the effect of the long‐term baseline drift in the obtained data with 0.1‐s time resolution, baseline correction was performed by linear fitting to the mean signal of the 11 time points, including the onset of the target stimulus (i.e., from 0.5 s before the onset of the target stimulus to 0.5 s after the onset) and the mean signal of the next target stimulus. Next, the individual oxy‐Hb and deoxy‐Hb data were split into data blocks of 150 time points (15 s), by using the onset of each target stimulus. Good measurement data were selected on the basis of an objective criterion: detection of a change in the sum of oxy‐Hb and deoxy‐Hb signals larger than 0.15 mM·mm between the mean of four successive samples and that of the next four successive samples (during 400 ms) and elimination from subsequent analyses of the block that revealed the rapid change in Hb signals. In this way, data with motion artifacts and low signal/noise ratio due to obstruction by hair were rejected, and good measurement data blocks were selected on a channel‐by‐channel basis for each of the 50 infants. The individual measurement channels for which good measurement data from at least three trials were obtained in each stimulus condition were used for further analysis. Therefore, the number of infants whose data were used in the final analysis differed among the measurement channels in each stimulus condition. In fact, the mean number of infants across measurement channels was 46.5 [out of 50 infants (93.0%); SD, 4.5; range, 29–50] for the sound condition and 46.5 [out of 50 infants (93.0%); SD, 3.7; range, 34–50] for the no‐sound condition. For each stimulus condition, the mean number of trials that was included in the analysis across infants was 5.1 (SD, 0.7) out of the six sound trials and 5.2 (SD, 0.7) out of the six no‐sound trials. By averaging the changes in the oxy‐Hb and deoxy‐Hb signals over the data blocks for each infant in both the conditions, we obtained the individual hemodynamic responses for each measurement channel.
We assume that positive hemodynamic changes, that is, increases in the oxy‐Hb signal and decreases in the deoxy‐Hb signal indicate cortical activation, while negative hemodynamic changes, that is, decrease in the oxy‐Hb signal and increase in the deoxy‐Hb signal indicate cortical deactivation [Obrig et al., 2000; Villringer and Chance, 1997]. Although the negative response might be related to “blood stealing,” that is, the elevation of blood flow at the activated location causes reductions in blood supply in nearby areas sharing the same blood vasculature, increasing number of studies supported that a significant component of the negative hemodynamic response reflects deactivation of neural activity [Devor et al., 2007; Shmuel et al., 2002, 2006; Smith et al., 2004]. To examine the time course of the oxy‐Hb and deoxy‐Hb signals, we divided the 15‐s trial into seven time windows of 1.5 s (15 time points with a 0.1‐s time resolution) and calculated the mean signal changes for each time window. It should be noted that data for the first 3 s after the onset of the stimulus were not used for the analysis, because rapidly presented stimuli may produce apparent undershoot of the oxy‐Hb signals due to overlapping of hemodynamic responses with slow relaxation process, which is referred to as the “carry‐over” effect [Watanabe et al., 2010]. In this regard, Watanabe et al. [2010] performed a simulation that showed that the carry‐over effect occurs only during the first few seconds after the onset of the 5‐s stimulus, followed by a 10‐s interstimulus interval, based on a model of hemodynamic response function [Watanabe et al., 2010]. Furthermore, to identify the channels that recorded activation in each time window in each condition, we considered the individual data to be random effects and performed a one‐tailed t‐test using the data obtained for each channel. The t‐test for the signal changes in each condition was performed against a zero baseline. Then, we directly compared the cortical activation in each time window between the two conditions by performing a one‐tailed paired t‐test. To take into account multiple comparisons among the 94 channels, we applied the false discovery rate (FDR) procedure [Benjamini and Hochbergk, 1995; Genovese et al., 2002; Singh and Dan, 2006], where the proportion of incorrect rejections of null hypothesis was controlled at a desired level qm 0/m by the linear step‐up procedure making use of the ordered m P‐values of hypotheses. In the current study, we used the improved FDR procedure (median adaptive FDR procedure, see Benjamini et al. [2006] for details), where m 0 was estimated using the median of P‐value of m null hypotheses {m 0 = (m − m/2)/[1 − p(m/2)]}, and the hypotheses were tested using the linear step‐up procedure at level qm/m 0 (q = 0.05 was chosen). If the threshold P value based on the FDR procedures exceeds 0.05, then a threshold of P = 0.05 is set for all analyses.
The patterns of hemodynamic changes during the cyclic presentation of stimuli have considerable variation not only in the onset of the response but also in the response form. To quantify the temporal pattern of hemodynamic responses among the cortical regions, we used the analysis for the circular representation of cyclic data [Batschelet, 1981]. This analysis focused on response phases of activations independently of amplitudes of activations, and it allowed us to investigate activation flows over divers cortical regions based on phase differences. Because the stimulus presentation was cyclic (period of 15 s), the individual hemodynamic responses for the oxy‐Hb signal c i (i = 1, n) at time ith after the onset of the stimulus (n = 150 for 0.1‐s sampling) were represented as circular data for each channel. Note that only positive c i values were used, because the amplitude of the response can be defined only for positive values. Channels for which the maximum oxy‐Hb signal amplitude was less than 0.01 mM·mm were also excluded from the analysis. The mean vector (X, Y) that represents the temporal pattern of hemodynamic response for each channel was calculated for each infant using the following equations:
Next, the length r and phase θ of the vector were calculated as follows:
Here, the θ value was used as a measure of the response phase. A small value of θ indicates a response with an early onset and/or a transient response pattern, while a large value of θ indicates a response with a late onset and/or a sustained response pattern. To obtain the group mean of the response phase, we performed summation of the unit vectors with individual response phases and calculated the phase of the mean vector
 . Then, the spatial distribution of the response phase was determined for each condition.
RESULTS
Figure 3A,B illustrates the time courses of the oxy‐Hb and deoxy‐Hb signals averaged over all 50 infants for the sound and no‐sound conditions, respectively. According to the data obtained in the sound condition (Fig. 3A), event‐related increases in oxy‐Hb signals and decreases in deoxy‐Hb signals were observed for most of the channels. In the no‐sound condition, some of the channels such as those located at the early visual region (e.g., L2 and R2), the lateral occipital region (e.g., L10 and R10), the occipito‐temporal region (e.g., L17 and R17), and the prefrontal region (e.g., L36 and R36) showed event‐related increases in oxy‐Hb and decreases in deoxy‐Hb signals, whereas specific channels located at the auditory‐related regions (e.g., L24, R24, L22, and R22) showed event‐related decreases in oxy‐Hb and increases in deoxy‐Hb signals, particularly at the late period of the trial. The oxy‐Hb signal changes were generally greater than the deoxy‐Hb signal changes. These results indicate that the presence or absence of sound dramatically affects the activation and/or deactivation of the diverse cortical regions.
Figure 3.

Mean time courses of the hemodynamic responses in the sound and the no‐sound conditions. A: Mean time courses of oxy‐Hb (solid lines) and deoxy‐Hb (dashed lines) signals for all the infants in the sound condition. B: Mean time courses of the oxy‐Hb (solid lines) and deoxy‐Hb (dashed lines) signals for all the infants in the no‐sound condition. The abscissa indicates the time (s), and the ordinate indicates the signal changes in oxy‐Hb and deoxy‐Hb (mM·mm). The zero time point was set at the onset of stimulus presentation. For display purposes, the time course data were low‐pass filtered with a cut‐off frequency of 0.3 Hz.
To determine the spatiotemporal changes in the activated regions of the cortex, we evaluated the time course of the oxy‐Hb and deoxy‐Hb signals every 1.5 s during the trial. We calculated the individual mean signal changes for each of the seven consecutive 1.5‐s time windows (15 time points with a 0.1‐s time resolution) and performed a one‐tailed t‐test to identify the activated channels in each time window on a channel‐by‐channel basis for both conditions. To determine the effective threshold for multiple statistical testing, an FDR procedure was used. We assumed that positive changes in oxy‐Hb signals and negative changes in deoxy‐Hb signals indicate neural activation. Figure 4 illustrates the spatiotemporal mapping of the channels for which significant oxy‐Hb and deoxy‐Hb signals were obtained in each stimulus condition (see also Table SIV in Supporting Information for t‐values for main results). In the sound condition (Fig. 4A), the presentation of the audio‐visual stimuli induced significant positive changes in the oxy‐Hb signal in the earliest time window (3.1–4.5 s after the onset of the stimulus) in the temporal auditory regions (L24, R24, L22, and R22), following which positive changes in the oxy‐Hb signal were recorded by most channels. Although the positive changes recorded for approximately half of the channels diminished before the 13.5‐s time window, the positive signals persisted till the later time windows (12.1–13.5 s after the stimulus onset) in the early visual (e.g., L2, R2, L5, and R5), the posterior temporal (e.g., L17 and R17), and the prefrontal regions (e.g., L36 and R36). With regard to the significant negative changes in deoxy‐Hb signals, we observed similar spatiotemporal patterns as those of the oxy‐Hb signals, except that the deoxy‐Hb responses were delayed by ∼ 1.5 s (a single time window) after the oxy‐Hb responses and the number of channels that showed significant deoxy‐Hb signals was fewer due to the comparatively lower SN ratio.
Figure 4.

The spatiotemporal mappings of cortical activation in the sound and no‐sound conditions. To determine the time course of the oxy‐Hb and deoxy‐Hb signals, we divided a trial into seven time windows of 1.5 s and calculated the mean signal changes in each time window. See Figure 1C for the arrangement of the 94 measurement channels over the bilateral cortices. A: The measurement channels that showed significant increases in the oxy‐Hb signals (red circles) and significant decreases in the deoxy‐Hb signals (blue circles) in each 1.5‐s time window in the sound condition. B: The measurement channels that showed significant increases in oxy‐Hb signals (red circles) and significant decreases in deoxy‐Hb signals (blue circles) in each 1.5‐s time window in the no‐sound condition. C: A direct comparison of the channels that showed significant difference between the two conditions. The black circles indicate that the oxy‐Hb signal changes in the sound condition were greater than those in the no‐sound condition. The gray circles indicate that the negative changes in the deoxy‐Hb signals in the sound condition were greater than those in the no‐sound condition. In all the figures (A, B, and C), the large, medium, and small‐filled circles indicate the channels that surpassed P < 0.001, P < 0.01, and P < 0.05, respectively, with regard to the hemoglobin signals.
In the no‐sound condition (Fig. 4B), the presentation of unisensory visual video images first induced significant positive changes in oxy‐Hb signals in the temporal (e.g., L22 and R22) and lateral prefrontal regions (e.g., L36 and R36) during the first two time windows. Following these early responses, positive changes in oxy‐Hb signals were observed in the third time window (6.1–7.5 s) in the early visual (e.g., L2 and R2) and the lateral occipital regions (e.g., L10 and R10). In contrast to the response patterns observed for most of the activated regions, the positive signals in the temporal auditory regions (e.g., L22 and R22) dissolved in the fourth time window (7.6–9.0 s). The positive signals in the early visual region (e.g., L2 and R2) persisted until the later time windows in the no‐sound condition, similar to the case of the sound condition. With regard to the significant negative changes in the deoxy‐Hb signals, the patterns obtained were similar to those obtained for the oxy‐Hb signals, although fewer channels showed significant responses in the temporal and the occipital regions due to the comparatively lower SN ratio. The onset of the deoxy‐Hb responses was delayed when compared with that of the oxy‐Hb responses.
To evaluate the difference in the responses between the sound and no‐sound conditions, we directly compared the signal changes in the two conditions using a one‐tailed paired t‐test. Statistical analysis for the oxy‐Hb and deoxy‐Hb signal changes revealed that the activation in the sound condition was greater than that in the no‐sound condition in the temporal, early visual, and anterior prefrontal regions (Fig. 4C). There were no significant differences in activation between the two conditions in the lateral occipital and dorsolateral prefrontal regions. These results indicated that the presentation of sound stimuli during visual object presentation results in the earlier onset of cortical activation in not only the auditory region but also the visual region. Thus, the latencies of cortical activation in the auditory and visual regions were earlier during multisensory audio‐visual presentation than during unisensory visual presentation. On the other hand, the comparable responses observed in the lateral occipital and the lateral prefrontal regions under both the conditions indicated that the additional auditory stimuli during the visual object stimulation did not modulate cortical activation in these regions.
Increases in the oxy‐Hb signal and decreases in the deoxy‐Hb signal indicate cortical activation, while decrease in the oxy‐Hb signal and increase in the deoxy‐Hb signal indicate cortical deactivation [Obrig et al., 2000; Villringer and Chance, 1997]. To determine the spatiotemporal deactivation of the cortex, we evaluated the negative changes in the oxy‐Hb signal and positive changes in the deoxy‐Hb signal on a channel‐by‐channel basis using the one‐tailed t‐test for each of the time windows in each condition (Fig. 5). The results indicated that significant decreases in the oxy‐Hb signal in the later time windows (9.1–13.5 s) were observed in the channels that were possibly located in the early auditory and association auditory regions (L22, R22, L24, R24, L27, and R27) over the temporal cortex. Along with the decrease in the oxy‐Hb signal changes, significant increases in the deoxy‐Hb signal were observed for some of these channels (L27 and R25).
Figure 5.
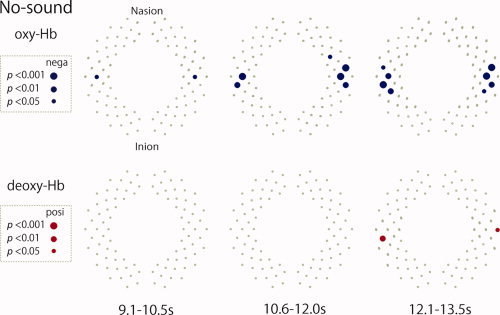
The spatiotemporal mappings of cortical deactivation in the no‐sound condition in the later time windows. The blue‐filled circles indicate the channels showing significant decreases in oxy‐Hb signals, whereas the red‐filled circles indicate those showing significant increases in deoxy‐Hb signals in the no‐sound condition in late time windows (9.1–13.5 s). The large, medium, and small‐filled circles indicate the channels that surpassed P < 0.001, P < 0.01, and P < 0.05, respectively, with regard to the hemoglobin signals.
To quantify the temporal pattern of hemodynamic responses among the cortical regions, we used the analysis for the circular representation of cyclic data [Batschelet, 1981]. The periodic stimulation allowed us to calculate a single vector, which was used to determine the mean direction of the response for the circular coordinates; the mean response phase ranged from 0 to 2π where 0 and 2π correspond to the stimulus onset and the end of 15‐s trial, respectively. We calculated the individual mean response phase for each channel in each condition. To eliminate channels that recorded no activation from the analysis, individual channels with maximum oxy‐Hb signal amplitudes that were less than 0.01 mM·mm in a 15‐s trial were excluded. The group‐averaged spatial distribution of the response phases for each condition was shown in Figure 6. Although the phase can range from 0 to 2π we only illustrated the mean phase for each channel ranging from 2.8 to 3.8 radian to focus the subtle phase differences among the channels. The phase difference with 1.0 radian corresponds to the temporal difference with 2.4 s. The phase distribution in the sound condition clearly indicated the phase gradient with earlier response phases in the temporal auditory regions. The phase distribution in the nonsound condition also indicated that temporal channels showed phase advancement, although channels of the early auditory regions were excluded from the analysis due to no positive activation.
Figure 6.

The spatial distribution of the response phase of the oxy‐Hb signals in the sound (A) and no‐sound conditions (B). In both figures (A and B), the response phase (i.e., phase angle in radians) of each channel is illustrated in gray scale. Darker circles represent channels that showed earlier response phase. The channels represented by small circles are those that showed no activation during the analysis of the amplitudes (see Fig. 4).
The salient features in the diverse brain regions under the sound and no‐sound conditions are shown in Figure 7, wherein the eight channels of interest and the mean time course of the oxy‐Hb signal changes at these channels are depicted (see Fig. S1 in the Supporting Information for individual response variations). These channels were selected based on literatures of neurophysiological and neuroimaging studies with primates and human adults, which reported functional regions in relation to audio‐visual multimodal processing. The possible cortical regions represented by these channels were estimated in reference to AAL via virtual registration to MNI space (Fig. 2 and Table SI and SII in the Supporting Information, see also the section of data acquisition in the Methods section and Tzourio‐Mazoyer et al. [2002]; Tsuzuki et al. [2007] for this estimation). The findings were as follows: (1) L24, which was estimated to be located on the superior temporal gyrus (STG) probably including the early auditory region, showed different response patterns between the conditions. This channel showed activation with large amplitudes in the sound condition, while deactivation was observed in the later time windows in the no‐sound condition. (2) L22, which was estimated to be located on the anterior part of the middle temporal gyrus (MTGa), also showed different response patterns between the conditions. This channel showed great activation in the sound condition, as observed in the case of the channel in the STG (early auditory) region. In contrast, this channel showed transient activation in the early time windows and deactivation in the late time windows in the no‐sound condition. (3) L2, which was estimated to be located on the middle occipital gyrus (MOG) probably including the early visual region, showed significant activation in both conditions, and the activation was greater in the sound condition than in the no‐sound condition. (4) L10, which was estimated to be located on the MOG referred to the lateral occipital (LO) region, showed activation of equivalent magnitudes in both conditions. (5) L17, which was estimated to be located on the posterior part of the middle temporal gyrus (MTGp), showed activation in both the conditions, with greater activation being observed in the sound condition. (6) L18, which was estimated to be located on the inferior parietal lobule, showed significant activation in both conditions, with greater activation in the sound condition than in the no‐sound condition. (7) L36, which was estimated to be located on the inferior frontal gyrus (IFG), showed equivalent activation in both conditions. (8) L44, which was estimated to be located on the superior frontal gyrus (SFG), showed activation only in the sound condition.
Figure 7.
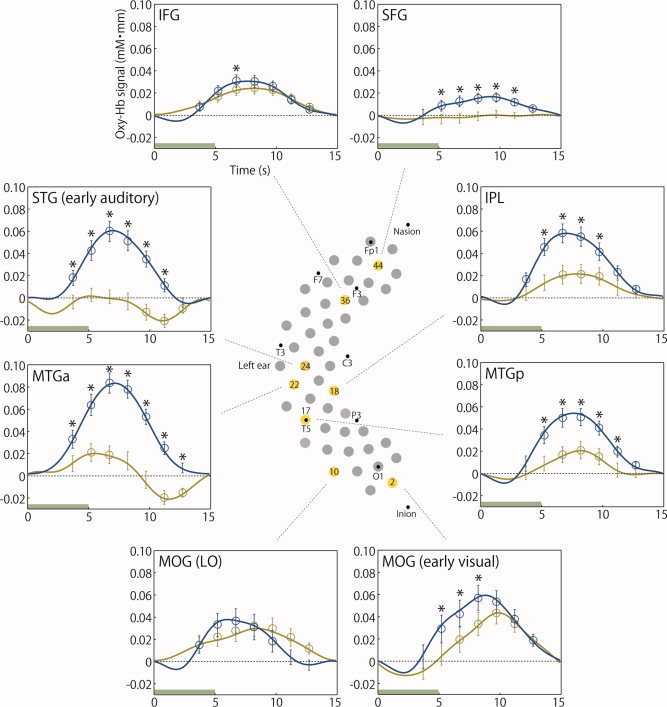
Functional organization of the cortex during object perception with and without sound information in 3‐month‐old infants. To demonstrate the typical hemodynamic changes in the oxy‐Hb signals in the sound (blue lines) and no‐sound (yellow lines) conditions, the eight channels (yellow‐filled circles) arranged in the left hemisphere are displayed in this figure. The digits within each yellow‐filled circle indicate the channel number (see Fig. 1C for the positioning of the channels). The displayed channels correspond to discrete cortical regions (see also the Supporting Information): the superior temporal gyrus (STG) including the early auditory region (L24); the anterior part of the middle temporal gyrus (MTGa) (L22); the middle occipital gyrus (MOG) including the early visual region (L2); the middle occipital gyrus (MOG) referred to as the lateral occipital (LO) region (L10); the posterior part of the middle temporal gyrus (MTGp) (L17); the inferior parietal lobule (IPL) (L18), the inferior frontal gyrus (IFG) (L36), and the superior frontal gyrus (SFG) (L44). The error bars represent the standard error of the oxy‐Hb signal changes over each 1.5‐s time window (see Fig. 3) in all infants. The open circles denote measurement channels that showed significant oxy‐Hb signals for the cortical regions in each time window as determined by the one‐tailed t‐test in each experimental condition. The asterisks (*) above the error bars indicate the results of the paired t‐test conducted to compare the cortical responses in each time window in both stimulus conditions.
Figure 8 shows the circular display of distribution for individual response phases of the oxy‐Hb signals with the vector of the group‐averaged response phase in each channel of interests in the sound condition. The response phase was defined to rotate in the counterclockwise direction. The vectorial representation of the group‐averaged response phases indicates that STG (early auditory) has the smallest phase lag and that the other channels were further delayed than STG. To confirm the phase differences, we performed statistical analysis of phase differences between response phases of channel of interests. We calculated the phase differences between each phase of the channels and that of L24 (STG, early auditory), which was chosen as a reference phase, and performed one‐sample t‐test. The result revealed that L24 showed significantly advanced phase as compared with the phase of L2 (MOG, early visual) and L 44 [SFG; t(36) = 3.338, P < 0.01 for L2 and t(36) = 3.684, P < 0.001 for L44].
Figure 8.
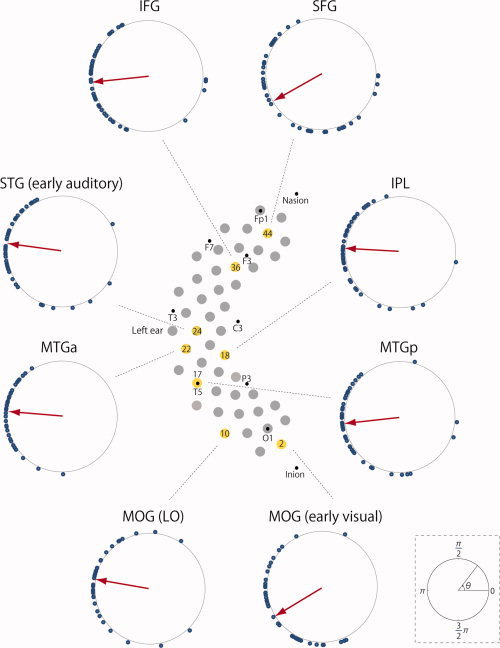
The circular display of distribution for individual response phases of the oxy‐Hb signals in each channel of interests under the sound conditions. The phase proceeds in the counterclockwise direction. Each small circle represents individual response phase. Each arrow shows vectorial representation of the group‐averaged response phase. Note that each circle starts at phase 0.0, defined as the onset of stimulation and that ends at phase 2π, defined as the end of 15‐s trial.
DISCUSSION
In this study, we used the multichannel NIRS system to observe the spatiotemporal dynamics of cortical hemodynamic responses in 3‐month‐old infants who were presented video images of visual objects with and without sound stimuli (sound and no‐sound conditions). A crucial finding is that the effects of the manipulation of sound stimuli were observed in diverse cortical regions. The significant activation/deactivation observed at the channels of interest shown in Figure 7 is summarized in Table I (left panel). Cortical responses in the temporal auditory regions including the early auditory (STG) and auditory association (MTGa) regions were sensitive to the manipulation of sound stimuli. Furthermore, audio‐visual stimulation induced large cortical responses in the higher multimodal association regions [MTGp, MOG (LO), and IPL] and prefrontal regions (IFG and SFG). Regarding the responses in the occipital regions, although the occipital visual cortex including early [MOG (early visual)] and association [MOG (LO)] regions] was activated under both conditions, auditory information facilitates response in the early visual region only [MOG (early visual)]. These results support the hypotheses listed earlier in the Introduction section. In addition, we noted unexpected response patterns in the auditory regions, deactivation in the early auditory region (STG), and dynamic response changes from transient activation to deactivation in the auditory association region (MTGa). These findings suggest that the brain of 3‐month‐old infants is sensitive to external auditory stimuli.
Table I.
Response patterns (oxy‐Hb signal changes) in the infant cortex during audio‐visual presentations
| Studies | Present study | Watanabe et al. [2008] | |||||
|---|---|---|---|---|---|---|---|
| Stimuli | Sound‐object | No‐sound | Sound‐object | No‐object | |||
| Video image Sound | Mobile Mobile | Mobile · | Mobile Mobile | Checkerboard Mobile | |||
| No. of Ch | Regions | ||||||
| L24 | STG (early auditory) | + | > | − | + | + | |
| L22 | MTGa | + | > | +/− | + | + | |
| L2 | MOG (early visual) | + | > | + | + | + | |
| L10 | MOG (LO) | + | + | + | > | · | |
| L17 | MTGp | + | > | + | + | > | + |
| L18 | IPL | + | > | + | + | > | + |
| L36 | IFG | + | + | + | > | + | |
| L44 | SFG | + | > | · | + | > | · |
Notes: The results of the present and previous studies (Watanabe et al. 2008) that used mulitchannel NIRS are summarized in this table. In both the present and previous studies, mobile objects with the sound of ringing bells produced by the moving mobiles were presented. In order to compare the effects of the sound‐objects presentation, the no‐sound stimuli (in the present study) and the no‐object stimuli (the checkerboard pattern reversal in the previous study) were presented. “Ch” means measurement channel. The characters “+”, “‐”, and “.” indicate significant activation, significant deactivation, and non‐significant response, respectively. The “+” and “‐” characters for the MTGa region in the present study indicate activation in the early time windows and deactivation in the late time windows. The inequality sign (“>”) indicates the results of the direct comparisons between the 2 conditions in each study.
The audio‐visual multisensory presentation of the video images of natural objects resulted in prominent activation over all the channels of interest, while the removal of the sound stimuli produced different effects on the cortical responses in different regions. This indicates that the auditory input did not generally enhance the overall activation in relation to visual perception but rather induced changes specific to each of the cortical regions. It should be noted that the region‐specific changes cannot be accounted for simply by the possible confounding of global hemodynamic changes due to the systemic effect. The present study also demonstrated the flows of activation over diverse cortical regions in multisensory processing as shown in Figure 8. The previous studies with young infants revealed the emergence of the modality‐specific functional differentiation [Watanabe et al., 2008, 2010] and the global network property [Homae et al., 2010] of the cortex during the first 3 months of life. The present study further provided important findings implying that multisensory interplay occurs at every hierarchical level of processing in functionally differentiated cortical regions in 3‐month‐old infants.
The region‐specific differences of the effect of the removal of sound stimuli suggest detailed mechanisms of multisensory interplay in young infants. The removal of the sound stimulus resulted in the exhibition of the following four response patterns (Table II; left panel): (1) deactivation in the STG (early auditory) and MTGa regions, indicating that the absence of auditory input did not merely produce no activation but actively suppressed the activation in these regions; (2) no activation in the SFG region, suggesting that the stimulus including sound information was essential for processing in this region; (3) reduced activations in the auditory region of MTGa and the association regions including the MTGp and IPL regions, suggesting that the sound information enhanced multisensory integration, and in the MOG (early visual) region, suggesting that sound may exert an enhanced cross‐modal effect on visual processing; and (4) no effect on activation in the MOG (LO) and IFG regions, suggesting that these regions are mostly involved in the visual object processing.
Table II.
The effect of sound removal (present study) and object removal (Watanabe et al. 2008) on cortical activation in response to the sound‐object stimuli
| No‐sound (present study) | No‐object [Watanabe et al., 2008] | |
|---|---|---|
| Response patterns Reduction | Regions | |
| Deactivation | STG (early auditory), MTGa* | · |
| No activation | SFG | MOG (LO), SFG |
| Activation | MOG (early visual), MTGp, MTGa*, IPL | MTGp, IPL, IFG |
| No difference | ||
| Activation | MOG (LO), IFG | MOG (early visual), STG (early auditory), MTGa |
Notes: The following response patterns were observed; deactivation: significant activation in the multisensory condition and significant deactivation in the condition wherein either the object or sound stimulus was removed; no activation: significant activation in the multisensory condition and no significant activation upon removal of either of the stimuli, with significant differences being observed between the 2 conditions; reduced activation: significant activation in the multisensory condition and the condition in which one of the stimuli had been removed, followed by significant reduction in activation upon removal of either of the stimuli as compared to activation in the multisensory condition and the condition in which either of the stuimuli had been removed, with no significant difference being observed between the 2 conditions. The asterisks (*) indicate that the MTGa region showed activation in the early time window and deactivation in the later time window in the no‐sound condition.
The presentation of sound information was manipulated in the present study, while visual object information was manipulated in our previous study [Watanabe et al., 2008]. In both studies, one of the experimental conditions involved the presentation of the same visual object image along with sound information, and the significant activation observed in all channels of interest was consistent between the two studies (Table I). However, the removal of the object information from the video image and replacement with black‐and‐white checkerboard pattern reversals along with the presentation of the same sound information produced different effects on activation in the different cortical regions (Tables I and II; right panel) as follows: no activation in the MOG (LO) and SFG regions; reduced activation in the MTGp, IPL, and IFG regions; and no effect on activation in the MOG (early visual), and STG (early auditory), and MTGa regions. Thus, the comparison of the results of the current and previous studies should provide additional information on the functional dissociation of each cortical region, although the paradigms in the previous and present study were not exactly complementary. Although the removal of the sound stimulus had no effect on activation in the MOG (LO) and IFG regions in the present study, the removal of the object stimulus prevented activation in the MOG (LO) region and reduced activation in the IFG region in the previous study, suggesting that these regions are involved specifically in visual object processing. The activation in the association regions (MTGp and IPL), which was reduced by the sound removal, was also reduced by the removal of the object information. The results of the present and previous studies suggest that the sound‐object compound information may have enhanced cortical responses during audio‐visual stimulation. With regard to the SFG region, the removal of both the sound and visual object information resulted in no activation, implying that the SFG region is sensitive to natural multisensory stimuli, including auditory and object information.
Here, we consider the effect of hemodynamic background oscillations. In the present study, the stimuli were presented as a 15‐s interval (5‐s target stimulus with 10‐s ISI). Yet, further studies are needed to evaluate the influence of ISI, and background oscillations may have exerted few critical effects on the present results for the following reasons. First, in a previous study that measured spontaneous fluctuations during the task‐free (resting) state in 3‐month‐old infants, no oscillation within a fixed period of 15 s was observed [Homae et al., 2010]. This observation suggests that the present results might have been eluded from a phase‐locking effect to only 15‐s period oscillations. Second, if any hemodynamic background oscillations affect the event‐related hemodynamic responses, the broad regions in the brain are equally affected by such spontaneous oscillations. However, we found functional differentiated response patterns in different cortical regions, indicating that our findings are likely to be independent of background oscillations.
In the following sections, we discuss possible neural mechanisms underlying the present results. In future studies, we should clarify the direct relationship between structural maturations (e.g., changes in brain topology and tissue composition) and functional development (e.g., cortical activations and networks in brain regions). The following sections may provide the theoretical basis for understanding these issues.
Responses to Multisensory Stimuli in the Auditory and Association Regions
Although diverse cortical regions were activated by the audio‐visual presentations, the temporal pattern of activation in these regions can be distinguished from that of other regions owing to the early onset of activation in the temporal auditory regions such as the STG (early auditory) region (L24) and the MTGa (L22) located posterior to the STG (early auditory) region. In a previous fMRI study performed in adults, however, audio‐visual information produced the earliest responses in the lateral temporal cortex, which includes primary auditory regions, followed by responses in the occipital cortex, which includes primary visual regions [Alpert et al., 2008]. Our results showing early activation in auditory regions during audio‐visual stimulation well corroborates with the previously reported observations in adults. In the present infant study, the auditory regions may be involved in bottom‐up detections of external stimuli during audio‐visual multisensory perception, and these regions may contribute as “starter” for analysis of environmental stimuli. This early bottom‐up process might enhance the subsequent automatic and/or attentive analysis of environmental events in the diverse cortical regions in infants. In the present study, however, we did not study unimodal auditory stimulation. Thus, comparison between multimodal and unimodal effects in infants should be the objective of future studies.
The notable characteristic of the auditory regions, including the STG (early auditory) (L24) and the MTGa (L22) regions, was that deactivation was observed on presentation of the visual image in the absence of sound input. This deactivation was observed in the later time windows (9.1–13.5 s); however, activation in the MOG (early visual) (L2) and MOG (LO) (L10) regions was observed in these same time windows. The antagonistic responses between the auditory and visual regions may be related to the intensive processing of visual events in the visual region. The deactivation pattern in the auditory regions observed during the presentation of visual images without sound information was consistent with that observed in a previous study with infants aged 6–9 months [Bortfeld et al., 2007]. Previous neuroimaging studies in human adults have also demonstrated that the stimulation of one sensory modality can produce deactivation responses in different sensory‐specific regions [Beauchamp et al., 2004b; Laurienti et al., 2002]. The results of the current study suggest that visual processing mechanisms may inhibit auditory processing mechanisms in 3‐month‐old infants.
As shown earlier, although the STG (early auditory) (L24) and the MTGa (L22) regions showed deactivation in the later time windows, activation was observed in the MTGa (L22) region in the earlier time windows (4.6–7.5 s); this difference in activation is consistent with the functional dissociation in the adult auditory cortex (i.e., the core and the surrounding regions) observed in an fMRI study [Lehmann et al., 2006]. The activation of the MTGa region in the present study might have been induced by the presentation of the visual stimuli. In fact, bottom‐up cortical activation in the auditory regions was observed on presentation of simple visual stimuli in a primate [Kayser et al., 2007] and a human adult fMRI study [Martuzzi et al., 2007].
Response to the Sound of Silence
In the present study, sound (i.e., visual object with an auditory input) and no‐sound (i.e., visual object without an auditory input) inputs were presented alternately. Thismode of presentation might have resulted in a situation where the removal of the auditory input in the no‐sound condition was perceived as a silent gap, thereby producing waiting or expectation for sound information. Previous fMRI studies in adults have shown that the sound of silence induced activation in the auditory cortex, suggesting that the muting short gaps trigger auditory imagery [Kraemer et al., 2005; Voisin et al., 2006]. In the present study, significant activation was observed in the MTGa region (e.g., L22), but not in the STG (early auditory) region, immediately after the onset of visual presentation in the absence of auditory input. Thus, we speculate that the activation of the MTGa region under the no‐sound condition might have resulted from “hearing of or searching for an inaudible sound” during the presentation of the visual objects. Furthermore, the activation in this region was immediately followed by deactivation. This rapid shift in the response pattern might be related to an intermodal attentional shift. Thus, a possibility is that detection of the silent gap initially attracted the auditory attention, but the absence of real auditory stimuli during the visual presentation might have redirected the attention from the auditory to visual events. Future studies are required to fully determine whether 3‐month‐old infants have the ability to generate imagery in the absence of sensory information.
Responses to Multisensory Stimuli in the Visual and Association Regions
The MOG (early visual) regions (L2) responded to video images both with and without auditory stimulation and showed greater activation in response to the audio‐visual stimuli than to the visual‐only stimuli. Recent anatomical, electrophysiological, and functional imaging studies in human adult and nonhuman primates have revealed possible mechanisms for multisensory interplay in sensory‐specific visual regions ([Driver and Noesselt, 2008; Macaluso, 2006] for a review). On the bases of these studies, we could provide several accounts for the enhanced activation in the early visual region in response to audio‐visual stimuli in the present infant study. For example, multisensory interplay may arise due to subcortical thalamic influences [Allman and Meredith, 2007] and/or direct connections between the primary regions (i.e., auditory and visual regions; [Calvagnier et al., 2004; Rockland and Ojima, 2003]). Another possibility is that the multisensory interplay may reflect the interaction between the early sensory region and higher‐level multisensory regions such as the superior temporal sulcus and prefrontal regions. A neuroimaging study in human adults showed that the interaction between auditory and visual information may occur in the posterior part of superior temporal sulcus following which feedback projections are transmitted to sensory‐specific auditory and visual regions [Noesselt et al., 2007]. Future studies would be required to clarify the interaction between different parts of the infant brain during multisensory stimulation.
Our analysis of the spatiotemporal patterns of event‐related hemodynamic responses revealed that, although activation in the MOG (early visual) regions (L2) was observed after the activation in the auditory regions (L24 and L22) in both conditions, the activation in the former persisted until the latest time window (12.1–13.5 s) during audio‐visual multisensory presentation. Furthermore, the response patterns observed in the MTGa (L22) and MOG (early visual) (L2) regions differed in the no‐sound condition. Dynamic changes in the response pattern were observed in the MTGa region, wherein activation was observed in the earlier time windows (4.6–7.5 s) and deactivation in the later time windows (10.6–13.5 s); however, the activation in the MOG (early visual) region (L2) persisted until the latest time window. These dissociated response patterns suggest a functional differentiation in transient and sustained processing during object perception in the infant cortex.
The MOG (LO) region (L10) showed comparable activation in response to visual stimulation with and without auditory stimulation. The previous neuroimaging studies in infants and adults have suggested that the region referred to as the LO is involved in object perception. For example, the previous NIRS study with 3‐month‐old infants showed that the LO region was activated by the presentation of the mobile objects but not by the checkerboard pattern reversal, suggesting that the LO region in these infants is already involved in the perception of objects in the external environment [Watanabe et al., 2008]. Many previous neuroimaging studies in adults have demonstrated that the LO region is involved in the analysis of object perception [Beauchamp et al., 2002; Grill‐Spector and Malach, 2004; Grill‐Spector et al., 1998; Kanwisher et al., 1996; Kourtzi and Kanwisher, 2001; Larsson and Heeger, 2006; Malach et al., 1995; Tootell and Hadjikhani, 2001]. In the current infant study, because the activation in the MOG (LO) region did not show the effect of multisensory enhancement, we hypothesize that this region is involved in unisensory visual processing of objects during audio‐visual perception in young infants. In a previous adult fMRI study, the unisensory sound stimulation related to visual objects did not induce activation in the LO region [Amedi et al., 2002], and this finding is consistent with the findings of our present study.
The MTGp region (L17) showed enhanced responses to multisensory audio‐visual presentation as compared to unisensory visual presentation. Because of the anatomical location of this region between the visual and auditory association regions, this region, which partly covers the posterior region around the superior temporal sulcus, is ideally suited for the integration of visual and auditory information. In adult fMRI studies, enhanced activation was observed in the posterior superior temporal sulcus during audio‐visual stimulation when compared with only auditory or visual presentation, suggesting that this region is involved in audio‐visual integration (e.g., Beauchamp et al. [2004a]; see also Amedi et al. [2005] and Beauchamp [2005] for a review). It was also shown that the functional roles of the superior temporal sulcus are involved the capture of different unisensory visual and auditory information projected from the auditory and visual association regions, the translation into a common code, and the integration of the unisensory representations into audio‐visual representations [Beauchamp et al., 2004a]. In the current study, unisensory visual presentation was also found to evoke significant activation in the MTGp, which partly covers the posterior region around the superior temporal sulcus. In addition, our previous infant NIRS study [Watanabe et al., 2008] demonstrated activation in the same region during the presentation of auditory stimuli (the same stimuli as used in the current study) with visual stimuli including no‐object (i.e., the checkerboard pattern reversal). These results suggest that this region may be involved in the processing of unisensory visual or auditory information. Furthermore, audio‐visual presentation induced enhanced activation when compared with the activation during unisensory visual presentation in the current study or during auditory presentation without any object stimuli in the previous study [Watanabe et al., 2008]. This multisensory effect suggests that the infant brain possibly integrates auditory and visual features in a natural scene that represents the same objects.
The IPL region (L18) responded to both the multisensory audio‐visual and the unisensory visual presentations, with greater activation being observed in the former condition than in the latter. The geographic features of the IPL region indicate that this region is possibly related to both visual and auditory processing. The video image used in the present study consisted of eight small objects of a mobile toy, which were scattered over the broad view on a large display, and it might afford infant scene looking. Because adult studies have suggested that the temporoparietal region is involved in the processing of visual objects with stimulus‐driven attention [Marois et al., 2000; Weissman and Woldorff, 2005], we speculate that the activation in the IPL region in both hemispheres, observed in the present infant study, might be related to the spatial attention of the infants to the objects in the visual scene. With regard to auditory processing, the previous human adult and primate studies have shown that the parietal region is sensitive to the spatial position of sound [Rauschecker and Tian, 2000; Zatorre et al., 2002]. Furthermore, some primate studies have reported that the sensory information from many different modalities is converged and transformed into information suitable for guiding gaze in the parietal region ([Stricanne et al., 1996]; see Stein and Stanford [2008] for a review). On the basis of the findings of these adult and primate studies, we speculate that the activation in the IPL regions of the infants during multisensory presentation may contribute to both visual and auditory spatial processing.
The Association of the Prefrontal Region and the Functional Network Over the Cortex in the Perception of Environmental Events
The IFG region (L36), which is located on the dorsolateral prefrontal cortex, responded to visual stimuli both with and without auditory stimuli and did not show multisensory enhancement. A similar response pattern was also observed in the MOG (LO) region (L10). On the other hand, the activation in the IFG region was reduced by the removal of the visual object information in the previous study [Watanabe et al., 2008]. We therefore speculate that the activation of the IFG region, observed in this study, might imply the processing of the object information in the visual scene. The object stimuli used in the present study included some aspects of visual information such as shapes, colors, and motion, and this rich information might have sustained the attention of the infants to the visual scenes (see Colombo [2001] for the development of attention). Because a large number of adult studies [Kanwisher and Wojciulik, 2000; Miller, 2000; Munoz and Everling, 2004; Pierrot‐Deseilligny et al. 2004; Raz and Buhle, 2006; Wood and Grafman, 2003] and the recent infant studies [Nakano et al., 2008, 2009] have suggested that attention processing occurs in the dorsolateral prefrontal cortex, we further speculate that, in the present study, the IFG region, which is located on the dorsolateral prefrontal cortex, might be involved in attentional processing of the visual objects.
In contrast to the activation patterns of the IFG region, dissociated activation patterns were observed in the SFG region (L44), which is located on the anterior prefrontal cortex, in the two stimulus conditions. The SFG region was activated in response to audio‐visual stimulation; however, no activation was observed in this region during visual stimulation without auditory information. The dissociated response patterns in both the conditions therefore suggest that the SFG region in 3‐month‐old infants is involved in audio‐visual integration. Moreover, in the previous study with 3‐month‐old infants, no activation was observed in this region after the removal of the object information [Watanabe et al., 2008]. Therefore, the lack of activation in the absence of the sound or object information implies that this region is involved in the processing of natural scenes with audio‐visual information. A number of adult imaging studies have reported the possible functional roles of the anterior prefrontal cortex, such as the coding of the positive affect information mediated by different sensory modalities [Anderson et al., 2003; Blood et al., 1999; Kawabata and Zeki, 2004] and the processing of visual facial information depicting different emotions [Adolphs, 2001, 2003; Blair et al., 1999]. A recent imaging study with older infants (12 months of age) also suggested that the processing of positive affect information occurs in the anterior prefrontal cortex [Minagawa‐Kawai et al., 2009]. Thus, we speculate that the SFG region, which is located on the anterior prefrontal cortex, might be involved in not only audio‐visual integration but also affective processing of the natural scene of the mobile objects with auditory information, which was probably attractor for the attentive infants.
In the current study, different regions of the prefrontal cortex showed different activation patterns [i.e., activation in the IFG (L36) in response to both audio‐visual and visual‐only presentations and activation in the SFG (L44) in response to the presentation of only the audio‐visual stimuli). On the basis of this result, we hypothesize that the IFG region may be involved in the attentive processing of visual objects when awake infants look at visual objects with auditory information, while the SFG region is involved in affective processing of audio‐visual multisensory events. Future investigations are required to clarify the functional activation and dissociation in the prefrontal regions.
Understanding Cortical Responses at the Individual Level in Infants
One of the critical issues in understanding developmental processes is the recognition of individual response patterns under specific conditions or tasks. We detected changes in the relative extend of the hemodynamic response. Thus, to statistically determine the individual response level, one should determine whether each channel shows repeatable responses to each stimulation. This means that multiple measurements are required to draw statistical inference at the individual level. By measuring the absolute values of the hemodynamic responses with a multichannel system, the individual characteristics can be estimated in a few trials. This issue is an important topic to be addressed in future NIRS studies.
CONCLUSION
In real‐world situations, perceptual events often occur concurrently via multiple sensory modalities, which implies the existence of a complex brain mechanism for multisensory processing involving diverse cortical regions. To determine the locus of impact of auditory input during audio‐visual processing at different levels of the cortical hierarchy in young infants, we measured the spatiotemporal cortical hemodynamic responses to visual objects with or without sound by using a multichannel NIRS system. The comparison between the two stimulus conditions revealed that the effect of sound manipulation was pervasive throughout the diverse cortical regions and the effects were specific to each cortical region. An important implication of our results is that young infants may perceive audio‐visual multisensory inputs in the global network of functionally differentiated cortical regions. The presence of multisensory interplay at every level of the cortical hierarchy as early as 3 months of age may reflect a fundamental nature of the cortical organization to process multisensory information. Recent neurophysiological and neuroimaging studies on primates and human adults have suggested that the longstanding notions of a modular and hierarchical cortical organization should be revised [Driver and Noesselt, 2008; Laurienti et al., 2002; Martuzzi et al., 2002]. Consistent with this, our findings imply that multisensory interplay occurs at every level of cortical hierarchy at as early as 3 months of age, indicating the fundamental nature of cortical organization.
Supporting information
Additional Supporting Information may be found in the online version of this article.
Supporting Information
Acknowledgements
The authors thank Kayo Asakawa for her technical and administrative assistance and Haruka Dan for her advices in data analysis.
REFERENCES
- Adolphs R ( 2001): The neurobiology of social cognition. Curr Opin Neurobiol 11: 231–239. [DOI] [PubMed] [Google Scholar]
- Adolphs R ( 2003): Cognitive neuroscience of human social behavior. Nat Rev Neurosci 4: 165–178. [DOI] [PubMed] [Google Scholar]
- Allman BL, Meredith MA ( 2007): Multisensory processing in “unimodal” neurons: Cross‐modal subthreshold auditory effects in cat extrastriate visual cortex. J Neurophysiol 98: 545–549. [DOI] [PubMed] [Google Scholar]
- Alpert GF, Hein G, Tsai N, Naumer MS, Knight RT ( 2008): Temporal characteristics of audiovisual information processing. J Neurosci 28: 5344–5349. [DOI] [PMC free article] [PubMed] [Google Scholar]
- Altaye M, Holland SK, Wilke M, Gaser C ( 2008): Infant brain probability templates for MRI segmentation and normalization. Neuroimage 43: 721–730. [DOI] [PMC free article] [PubMed] [Google Scholar]
- Amedi A, Jacobson G, Hendler T, Malach R. Zohary E ( 2002): Convergence of visual and tactile shape processing in the human lateral occipital complex. Cereb Cortex 12: 1202–1212. [DOI] [PubMed] [Google Scholar]
- Amedi A, von Kriegstein K, van Atteveldt NM, Beauchamp MS, Naumer MJ ( 2005): Functional imaging of human crossmodal identification and object recognition. Exp Brain Res 166: 559–571. [DOI] [PubMed] [Google Scholar]
- Anderson AK, Christoff K, Stappen I, Paints D, Ghahremani DG, Glover G, Gabrieli JD, Sobel N ( 2003): Dissociated neural representations of intensity and valence in human olfaction. Nat Neurosci 6: 196–202. [DOI] [PubMed] [Google Scholar]
- Bahrick LE ( 1992): Infants' perceptual differentiation of amodal and modality‐specific audio‐visual relations. J Exp Child Psychol 53: 180–199. [DOI] [PubMed] [Google Scholar]
- Bahrick LE, Lickliter R ( 2000): Intersensory redundancy guides attentional selectivity and perceptual learning in infancy. Dev Psychol 36: 190–201. [DOI] [PMC free article] [PubMed] [Google Scholar]
- Bahrick LE, Lickliter R ( 2004): Infants' perception of rhythm and tempo in unimodal and multimodal stimulation: A developmental test of the intersensory redundancy hypothesis. Cogn Affect Behav Neurosci 4: 137–147. [DOI] [PMC free article] [PubMed] [Google Scholar]
- Batschelet E ( 1981): Circular Statistics in Biology. London: Academic Press. [Google Scholar]
- Beauchamp MS ( 2005): See me, hear me, touch me: Multisensory integration in lateral occipital‐temporal cortex. Curr Opin Neurobiol 15: 145–153. [DOI] [PubMed] [Google Scholar]
- Beauchamp MS, Lee KE, Haxby JV, Martin A ( 2002): Parallel visual motion processing streams for manipulable objects and human movements. Neuron 34: 149–159. [DOI] [PubMed] [Google Scholar]
- Beauchamp MS, Argall BD, Bodurka J, Duyn JH, Martin A ( 2004a): Unraveling multisensory integration: Patchy organization within human STS multisensory cortex. Nat Neurosci 7: 1190–1192. [DOI] [PubMed] [Google Scholar]
- Beauchamp MS, Lee KE, Argall BD, Martin A ( 2004b): Integration of auditory and visual information about objects in superior temporal sulcus. Neuron 41: 809–823. [DOI] [PubMed] [Google Scholar]
- Benjamini Y, Hochberg Y ( 1995): Controlling the false discovery rate: A practical and powerful approach to multiple testing. J R Stat Soc Ser B 57: 289–300. [Google Scholar]
- Benjamini Y, Krieger AM, Yekutieli D ( 2006): Adaptive liner step‐up procedures that control the false discovery rate. Biometrika 93: 491–507. [Google Scholar]
- Blair RJR, Morris JS, Frith CD, Perrett DL, Dolan RJ ( 1999): Dissociable neural responses to facial expressions of sadness and anger. Brain 122: 883–893. [DOI] [PubMed] [Google Scholar]
- Blasi A, Fox S, Everdell N, Volein A, Tucker L ( 2007): Investigation of depth dependent changes in cerebral haemodynamics during face perception in infants. Phys Med Biol 52: 6849–6864. [DOI] [PubMed] [Google Scholar]
- Blood AJ, Zatorre RJ, Bermudez P, Evans AC ( 1999): Emotional responses to pleasant and unpleasant music correlate with activity in paralimbic brain regions. Nat Neurosci 2: 382–387. [DOI] [PubMed] [Google Scholar]
- Bortfeld H, Wruck E, Boas DA ( 2007): Assessing infants' cortical response to speech using near‐infrared spectroscopy. Neuroimage 34: 407–415. [DOI] [PMC free article] [PubMed] [Google Scholar]
- Brett M, Johnsrude IS, Owen AM ( 2002): The problem of functional localization in the human brain. Nat Rev Neurosci 3: 243–249. [DOI] [PubMed] [Google Scholar]
- Burgund ED, Kang HC, Kelly JE, Buckner RL, Snyder AZ, Petersen SE, Schlaggar BL ( 2002): The feasibility of a common stereotactic space for children and adults in fMRI studies of development. Neuroimage 17: 184–200. [DOI] [PubMed] [Google Scholar]
- Calvert GA ( 2001): Crossmodal processing in the human brain: Insights from functional neuroimaging studies. Cereb Cortex 11: 1110–1123. [DOI] [PubMed] [Google Scholar]
- Calvert GA, Brammer MJ, Bullmore ET, Campbell R, Iversen SD, David AS ( 1999): Response amplification in sensory‐specific cortices during crossmodal binding. Neuroreport 10: 2619–2623. [DOI] [PubMed] [Google Scholar]
- Castillo M, Butterworth GE ( 1981): Neonatal localisation of a sound in visual space. Perception 10: 331–338. [DOI] [PubMed] [Google Scholar]
- Colombo J ( 2001): The development of visual attention in infancy. Annu Rev Psychol 52: 337–367. [DOI] [PubMed] [Google Scholar]
- Csibra G, Henty J, Volein A, Elwell C, Tucker L, Meek J, Johnson MH ( 2004): Near infrared spectroscopy reveals neural activation during face perception in infants and adults. J Pediatr Neurol 2: 85–89. [Google Scholar]
- Dehaene‐Lambertz G, Hertz‐Pannier L, Dubois J, Mériaux S, Roche A, Sigman M, Dehaene S ( 2006): Functional organization of perisylvian activation during presentation of sentences in preverbal infants. Proc Natl Acad Sci USA 103: 14240–14245. [DOI] [PMC free article] [PubMed] [Google Scholar]
- Devor A, Tian P, Nishimura NI, Teng C, Hillman EMC, Narayanan SN, Ulbert I, Boas DA, Kleinfeld D, Dale AM ( 2007): Suppressed neuronal activity and concurrent arteriolar vasoconstriction may explain negative blood oxygenation level‐dependent signal. J Neurosci 27: 4452–4459. [DOI] [PMC free article] [PubMed] [Google Scholar]
- Dodd B ( 1979): Lip reading in infants: Attention to speech presented in‐ and out‐of‐synchrony. Cogn Psychol 11: 478–484. [DOI] [PubMed] [Google Scholar]
- Driver J, Noesselt T ( 2008): Multisensory interplay reveals crossmodal influences on ‘sensory‐specific’ brain regions, neural responses, and judgments. Neuron 57: 11–23. [DOI] [PMC free article] [PubMed] [Google Scholar]
- Genovese CR, Lazar NA, Nichols T ( 2002): Thresholding of statistical maps in functional neuroimaging using the false discovery rate. Neuroimage 15: 870–878. [DOI] [PubMed] [Google Scholar]
- Gervain J, Macagno F, Cogoi S, Peña M, Mehler M ( 2008): The neonate brain detects speech structure. Proc Natl Acad Sci USA 105: 14222–14227. [DOI] [PMC free article] [PubMed] [Google Scholar]
- Giard MH, Peronnet F ( 1999): Auditory‐visual integration during multimodal object recognition in humans: A behavioral and electrophysiological study. J Cogn Neurosci 11: 473–490. [DOI] [PubMed] [Google Scholar]
- Grill‐Spector K, Malach R ( 2004): The human visual cortex. Annu Rev Neurosci 27: 649–677. [DOI] [PubMed] [Google Scholar]
- Grill‐Spector K, Kushnir T, Edelman S, Itzchak Y, Malach R ( 1998): Cue‐invariant activation in object‐related areas of the human occipital lobe. Neuron 21: 191–202. [DOI] [PubMed] [Google Scholar]
- Henson RNA, Price CJ, Rugg MD, Turner R, Friston KJ ( 2002): Detecting latency differences in event‐related BOLD responses: Application to words versus nonwords and initial versus repeated face presentations. Neuroimage 15: 83–97. [DOI] [PubMed] [Google Scholar]
- Hill J, Dierker D, Neil J, Inder T, Knutsen A, Harwell J, Coalson T, van Essen D ( 2010): A surface‐based analysis of hemispheric asymmetries and folding of cerebral cortex in term‐born human infants. J Neurosci 30: 2268–2276. [DOI] [PMC free article] [PubMed] [Google Scholar]
- Homae F, Watanabe H, Nakano T, Asakawa K, Taga G ( 2006): The right hemisphere of sleeping infant perceives sentential prosody. Neurosci Res 54: 276–280. [DOI] [PubMed] [Google Scholar]
- Homae F, Watanabe H, Nakano T, Taga G ( 2007): Prosodic processing in the developing brain. Neurosci Res 59: 29–39. [DOI] [PubMed] [Google Scholar]
- Homae F, Watanabe H, Otobe T, Nakano T, Go T, Konishi Y, Taga G ( 2010): Development of global cortical networks in early infancy. J Neurosci 30: 4877–4882. [DOI] [PMC free article] [PubMed] [Google Scholar]
- Jurcak V, Okamoto M, Singh A, Dan I ( 2005): Virtual 10‐20 measurement on MR images for inter‐modal linking of transcranial and tomographic neuroimaging methods. Neuroimage 26: 1184–1192. [DOI] [PubMed] [Google Scholar]
- Kanwisher N, Wojciulik E ( 2000): Visual attention: Insights from brain imaging. Nat Rev Neurosci 1: 91–100. [DOI] [PubMed] [Google Scholar]
- Kanwisher N, Chun MM, McDermott J, Ledden PJ ( 1996): Functional imaging of human visual recognition. Cogn Brain Res 5: 55–67. [DOI] [PubMed] [Google Scholar]
- Kawabata H, Zeki S ( 2004): Neural correlates of beauty. J Neurophysiol 91: 1699–1705. [DOI] [PubMed] [Google Scholar]
- Kayser C, Petkov C, Augath M, Logothetis NK ( 2007): Functional imaging reveals visual modulation of specific field in auditory cortex. J Neurosci 27: 1824–1835. [DOI] [PMC free article] [PubMed] [Google Scholar]
- Kourtzi Z, Kanwisher N ( 2001): Representation of perceived object shape by the human lateral occipital complex. Science 24: 1506–1509. [DOI] [PubMed] [Google Scholar]
- Kraemer DM, Macrae CN, Green AE, Kelley WM ( 2005): Sound of silence activates auditory cortex. Nature 434: 158. [DOI] [PubMed] [Google Scholar]
- Larsson J, Heeger DJ ( 2006): Two retinotopic visual areas in human lateral occipital cortex. J Neurosci 26: 13128–13142. [DOI] [PMC free article] [PubMed] [Google Scholar]
- Laurienti PJ, Burdette JH, Wallance MT, Yen YF, Field AS, Stein BE ( 2002): Deactivation of sensory‐specific cortex by cross‐modal stimuli. J Cogn Neurosci 14: 420–429. [DOI] [PubMed] [Google Scholar]
- Lehmann C, Herdener M, Esposito F, Hubl D, Disalle F, Scheffler K, Bach D, Federspiel A, Kretz R, Dierks T ( 2006): Differential patterns of multisensory interactions in core and belt areas of human auditory cortex. Neuroimage 31: 294–300. [DOI] [PubMed] [Google Scholar]
- Lewkowicz DJ ( 1992): Infants' response to temporally based intersensory equivalence: The effect of synchronous sounds on visual preferences for moving stimuli. Infant Behav Dev 15: 297–324. [Google Scholar]
- Lewkowicz DJ ( 1996): Perception of auditory‐visual temporal synchrony in human infants. J Exp Psychol Hum Percept Perform 22: 1094–1106. [DOI] [PubMed] [Google Scholar]
- Lewkowicz DJ ( 2000): Perceptual development: Visual, auditory, and speech perception in infancy. America J Psychol 113: 488–500. [Google Scholar]
- Lewkowicz DJ ( 2002): Heterogeneity and heterochrony in the development of intersensory perception. Cogn Brain Res 14: 41–63. [DOI] [PubMed] [Google Scholar]
- Lickliter R, Bahrick LE ( 2000): The development of infant intersensory perception: Advantages of comparative convergent‐operations approach. Psychol Bull 126: 260–280. [DOI] [PubMed] [Google Scholar]
- Macaluso E ( 2006): Multisensory processing in sensory‐specific cortical areas. Neuroscientist 12: 327–338. [DOI] [PubMed] [Google Scholar]
- Maki A, Yamashita Y, Watanabe E, Miyanagi Y, Koizumi H ( 1995): Spatial and temporal analysis of human motor activity using noninvasive NIR topography. Med Phys 22: 1997–2005. [DOI] [PubMed] [Google Scholar]
- Malach R, Peppas JB, Benson RR, Kwong KK, Jiang H, Kennedy WA, Ledden PJ, Brady TJ, Rosen BR, Tootell RBH ( 1995): Object‐related activity revealed by functional magnetic resonance imaging in human occipital cortex. Proc Natl Acad Sci USA 92: 8135–8139. [DOI] [PMC free article] [PubMed] [Google Scholar]
- Marois R, Leung HC, Gore JC ( 2000): A stimulus‐driven approach to object identity and location processing in the human brain. Neuron 25: 717–728. [DOI] [PubMed] [Google Scholar]
- Martuzzi R, Murray MM, Michel CM, Thiran JP, Maeder PP, Clarke S, Meuli RA ( 2007): Multisensory interactions within human primary cortices revealed by BOLD dynamics. Cereb Cortex 17: 1672–1679. [DOI] [PubMed] [Google Scholar]
- Meek JH, Firmank M, Elwell CE, Atkinson J, Braddick O, Wyatt JS ( 1998): Regional hemodynamic responses to visual stimulation in awake infants. Pediatr Res 43: 840–843. [DOI] [PubMed] [Google Scholar]
- Miller EK ( 2000): The prefrontal cortex and cognitive control. Nat Rev Neurosci 1: 59–65. [DOI] [PubMed] [Google Scholar]
- Minagawa‐Kawai Y, Mori K, Naoi N, Kojima S ( 2007): Neural attunement processes in infants during the acquisition of a language‐specific phonemic contrast. J Neurosci 27: 315–321. [DOI] [PMC free article] [PubMed] [Google Scholar]
- Minagawa‐Kawai Y, Matsuoka S, Dan I, Naoi N, Nakamura K, Kojima S ( 2009): Prefrontal activation associated with social attachment: Facial‐emotion recognition in mothers and infants. Cereb Cortex 19: 284–292. [DOI] [PubMed] [Google Scholar]
- Munoz DP, Everling S ( 2004): Look away: The anti‐saccade task and the voluntary control of eye movement. Nat Rev Neurosci 5: 218–228. [DOI] [PubMed] [Google Scholar]
- Nakano T, Homae F, Watanabe H, Taga G ( 2008): Anticipatory cortical activation precedes auditory events in sleeping infants. PLoS ONE 3: e3912. [DOI] [PMC free article] [PubMed] [Google Scholar]
- Nakano T, Watanabe H, Homae F, Taga G ( 2009): Prefrontal cortical involvement in young infants' analysis of novelty. Cereb Cortex 19: 455–463. [DOI] [PubMed] [Google Scholar]
- Neil PA, Chee‐Ruiter C, Scheier C, Lewkowicz DJ, Shimojo S ( 2006): Development of multisensory spatial integration and perception in humans. Dev Sci 9: 454–464. [DOI] [PubMed] [Google Scholar]
- Noesselt T, Hillyard SA, Woldorff MG, Schoenfeld A, Hagner T, Jäncke L, Tempelmann C, Hinrichs H, Heinze HJ ( 2002): Delayed striate cortical activation during spatial attention. Neuron 35: 575–587. [DOI] [PubMed] [Google Scholar]
- Noesselt T, Rieger JW, Schoenfeld MA, Kanowski M, Hinrichs H, Heinze H, Driver J ( 2007): Audiovisual temporal correspondence modulates human multisensory superior temporal sulcus plus primary sensory cortices. J Neurosci 27: 11431–11441. [DOI] [PMC free article] [PubMed] [Google Scholar]
- Obrig H, Wenzel R, Kohl M, Horst S, Wobst P, Steinbrink J, Thomas F, Villringer A ( 2000): Near‐infrared spectroscopy: Does it function in functional activation studies of the adult brain? Int J Psychophysiol 35: 125–142. [DOI] [PubMed] [Google Scholar]
- Okamoto M, Dan I ( 2005): Automated cortical projection of head‐surface locations for transcranial functional brain mapping. Neuroimage 26: 18–28. [DOI] [PubMed] [Google Scholar]
- Okamoto M, Dan H, Sakamoto K, Takeo K, Shimizu K, Kohno S, Oda I, Isobe S, Suzuki T, Kohyama K, Dan I ( 2004): Three‐dimensional probabilistic anatomical cranio‐cerebral correlation via the international 10‐20 system oriented for transcranial functional brain mapping. Neuroimage 21: 99–111. [DOI] [PubMed] [Google Scholar]
- Otsuka Y, Nakato E, Kanazawa S, Yamaguchi MK, Watanabe S, Kakigi R ( 2007): Neural activation to upright and inverted faces in infants measured by near infrared spectroscopy. Neuroimage 34: 399–406. [DOI] [PubMed] [Google Scholar]
- Peña M, Maki A, Kovacic D, Dehaene‐Lambertz G, Koizumi H, Bouquet F, Mehler J ( 2003): Sounds and silence: An optical topography study of language recognition at birth. Proc Natl Acad Sci USA 100: 11702–11705. [DOI] [PMC free article] [PubMed] [Google Scholar]
- Pierrot‐Deseilligny C, Milea D, Müri RM ( 2004): Eye movement control by the cerebral cortex. Curr Opin Neurol 17: 17–25. [DOI] [PubMed] [Google Scholar]
- Prechtl HFR, Hopkins B ( 1986): Developmental transformations of spontaneous movements in early infancy. Early Hum Dev 14: 233–238. [DOI] [PubMed] [Google Scholar]
- Rauschecker J, Tian B ( 2000): Mechanisms and streams for processing of “what” and “where” in auditory cortex. Proc Natl Acad Sci USA 97: 11800–11806. [DOI] [PMC free article] [PubMed] [Google Scholar]
- Raz A, Buhle J ( 2006): Typologies of attentional networks. Nat Rev Neurosci 7: 367–379. [DOI] [PubMed] [Google Scholar]
- Reynolds EO, Wyatt JS, Azzopardi D, Delpy DT, Cady EB, Cope M, Wray S ( 1988): New non‐invasive methods for assessing brain oxygenation and haemodynamics. Br Med Bull 44: 1052–1075. [DOI] [PubMed] [Google Scholar]
- Rockland KS, Ojima H ( 2003): Multisensory convergence in calcarine visual areas in macaque monkey. Int J Psychophysiol 50: 19–26. [DOI] [PubMed] [Google Scholar]
- Scheier C, Lewkowicz D, Shimojyo S ( 2003): Sound induces perceptual reorganization of an ambiguous motion display in human infants. Dev Sci 6: 233–244. [Google Scholar]
- Seifritz E, Esposito F, Hennel F, Mustovic H, Neuhoff JG, Bilecen D, Tedeschi G, Scheffler K, Salle FD ( 2002): Spatiotemporal pattern of neural processing in the human auditory cortex. Science 297: 1706–1708. [DOI] [PubMed] [Google Scholar]
- Senkowski D, Schneider TR, Foxe JJ, Engel A ( 2008): Crossmodal binding through neural coherence: Implication for multisensory processing. Trends Neurosci 31: 401–409. [DOI] [PubMed] [Google Scholar]
- Shi F, Yap P‐T, Wu G, Jia H, Gilmore JH, Lin W, Shen D ( 2011): Infant brain atlases from neonates to 1‐ and 2‐year‐olds. PLoS ONE 6: e18746. [DOI] [PMC free article] [PubMed] [Google Scholar]
- Shmuel A, Yacoub E, Pfeuffer J, Van de Moortele PF, Adriany G, Hu X, Ugurbil K ( 2002): Sustained negative BOLD, blood flow and oxygen consumption response and its coupling to the positive response in the human brain. Neuron 36: 1195–1210. [DOI] [PubMed] [Google Scholar]
- Shmuel A, Augath M, Oeltermann A, Logothetis NK ( 2006): Negative functional MRI response correlates with decreases in neuronal activity in monkey visual area V1. Nat Neurosci 9: 569–577. [DOI] [PubMed] [Google Scholar]
- Singh AK, Dan I ( 2006): Exploring the false discovery rate in multichannel NIRS. Neuroimage 33: 542–549. [DOI] [PubMed] [Google Scholar]
- Singh AK, Okamoto M, Dan H, Jurcak V, Dan I ( 2005): Spatial registration of multichannel multi‐subject fNIRS data to MNI space without MRI. Neuroimage 27: 842–851. [DOI] [PubMed] [Google Scholar]
- Smith AT, Williams AL, Singh KD ( 2004): Negative BOLD in the visual cortex: Evidence against blood stealing. Hum Brain Mapp 21: 213–220. [DOI] [PMC free article] [PubMed] [Google Scholar]
- Spelke ES ( 1976): Infants' intermodal perception of events. Cogn Psychol 8: 533–560. [Google Scholar]
- Spelke ES, Born WS, Chu F ( 1983): Perception of moving, sounding objects by four‐month‐old infants. Perception 12: 719–732. [DOI] [PubMed] [Google Scholar]
- Sridharan D, Levitin D, Chafe C, Berger J ( 2007): Neural dynamics of event segmentation in music: Converging evidence for dissociable ventral and dorsal networks. Neuron 55: 521–532. [DOI] [PubMed] [Google Scholar]
- Stein BE, Stanford TR ( 2008): Multisensory integration: Current issues from the perspective of the single neuron. Nat Rev Neurosci 9: 255–266. [DOI] [PubMed] [Google Scholar]
- Stricanne B, Andersen RA, Mazzoni P ( 1996): Eye‐centered, head‐centered, and intermediate coding of remembered sound locations in area LIP. J Neurophysiol 76: 2071–2076. [DOI] [PubMed] [Google Scholar]
- Taga G, Asakawa K ( 2007): Selectivity and localization of cortical response to auditory and visual stimulation in awake infants aged 2 to 4 months. Neuroimage 36: 1246–1252. [DOI] [PubMed] [Google Scholar]
- Taga G, Asakawa K, Maki A, Konishi Y, Koizumi H ( 2003). Brain imaging in awake infants by near‐infrared optical topography. Proc Natl Acad Sci USA 100: 10722–10727. [DOI] [PMC free article] [PubMed] [Google Scholar]
- Taga G, Homae F, Watanabe H ( 2007): Effects of source‐detector distance of near infrared spectroscopy on the measurement of the cortical hemodynamic response in infants. Neuroimage 38: 452–460. [DOI] [PubMed] [Google Scholar]
- Tootell RBH, Hadjikhani N ( 2001): Where is ‘dorsal V4’ in human visual cortex? Retinotopic, topographic and functional evidence. Cereb Cortex 11: 298–311. [DOI] [PubMed] [Google Scholar]
- Tsuzuki D, Jurcak V, Singh AK, Okamoto M, Watanabe E, Dan I ( 2007): Virtual spatial registration of stand‐alone fNIRS data to MNI space. Neuroimage 34: 1506–1518. [DOI] [PubMed] [Google Scholar]
- Tzourio‐Mazoyer N, Landeau B, Papathanassiou D, Crivello F, Etard O, Delcroix N, Mazoyer B, Joliot M ( 2002): Automated anatomical labeling of activations in SPM using a macroscopic anatomical parcellation of the MNI MRI single‐subject brain. Neuroimage 15: 273–289. [DOI] [PubMed] [Google Scholar]
- Villringer A, Chance B ( 1997): Non‐invasive optical spectroscopy and imaging of human brain function. Trends Neurosci 20: 435–442. [DOI] [PubMed] [Google Scholar]
- Voisin J, Bidet‐Caulet A, Bertrand O, Fonlupt P ( 2006): Listening in silence activates auditory areas: A functional magnetic response imaging study. J Neurosci 26: 273–278. [DOI] [PMC free article] [PubMed] [Google Scholar]
- Watanabe H, Taga G ( 2006): General to specific development of movement patterns and memory for contingency between action and events in young infants. Infant Behav Dev 29: 402–422. [DOI] [PubMed] [Google Scholar]
- Watanabe H, Taga G ( 2009): Flexibility in infant actions during arm‐ and leg‐based learning in a mobile paradigm. Infant Behav Dev 32: 79–90. [DOI] [PubMed] [Google Scholar]
- Watanabe H, Homae F, Nakano T, Taga G ( 2008): Functional activation in diverse regions of the developing brain of the human infant. Neuroimage 43: 346–357. [DOI] [PubMed] [Google Scholar]
- Watanabe H, Homae F, Taga G ( 2010): General to specific development of functional activation in the cerebral cortexes of 2‐ to 3‐month‐old infants. Neuroimage 50: 1536–1544. [DOI] [PubMed] [Google Scholar]
- Weissman DH, Woldrff MG ( 2005): Hemispheric asymmetries for different components of global/local attention occur in distinct temporal‐parietal loci. Cereb Cortex 15: 870–876. [DOI] [PubMed] [Google Scholar]
- Wilcox T, Bortfeld H, Woods R, Wruck E, Boas DA ( 2005): Using near‐infrared spectroscopy to assess neural activation during object processing in infants. J Biomed Opt 10: 11010. [DOI] [PMC free article] [PubMed] [Google Scholar]
- Wood JN, Grafman J ( 2003): Human prefrontal cortex: Processing and representational perspectives. Nat Rev Neurosci 4: 139–147. [DOI] [PubMed] [Google Scholar]
- Zatorre RJ, Bouffard M, Ahad P, Belin P ( 2002): Where is ‘where’ in the human auditory cortex. Nat Neurosci 5: 905–909. [DOI] [PubMed] [Google Scholar]
Associated Data
This section collects any data citations, data availability statements, or supplementary materials included in this article.
Supplementary Materials
Additional Supporting Information may be found in the online version of this article.
Supporting Information