

Abstract
Previous functional neuroimaging studies have shown brain activation abnormalities in clinically presymptomatic carriers of the Huntington's disease (preHD) gene mutation when performing complex cognitive tasks. However, little is known about the neural correlates of attentional processes in preHD. In this study, we used functional magnetic resonance imaging to investigate basic aspects of attentional processing in preHD individuals (n = 18) compared to healthy participants (n = 18) during an alertness task. Uni‐ and multivariate statistical techniques were used to assess task‐related regional brain activation and functional network connectivity. Compared to healthy controls, preHD individuals near to the estimated onset of clinical signs showed lower activation of right frontostriatal regions during phasic alertness (P < 0.001, uncorrected). Decreased striatal activation in this preHD subgroup was also evident when compared with those preHD individuals far from the estimated onset of HD signs. Lower putaminal activity was associated with longer reaction times and with proximity to onset. In addition, preHD participants near to onset had lower functional connectivity of motor regions when compared with controls and preHD individuals far from onset. Our data suggest that while alertness‐related performance remains normal, the underlying frontostriatal activity and motor cortex connectivity decline only when approaching the onset of unequivocal signs of HD. However, these attentional network changes might not be the sole explanation for the differences in cognitive task performance previously observed in preHD. Hum Brain Mapp 33:2161–2173, 2012. © 2011 Wiley Periodicals, Inc.
Keywords: Huntington's disease, functional magnetic resonance imaging, attention, prefrontal cortex, striatum
INTRODUCTION
Huntington's disease (HD) is an autosomal dominant inherited neurodegenerative disorder caused by an extended trinucleotide repeat in the HTT gene on chromosome 4, leading to progressive neuronal degeneration, preferentially within regions of the striatum [Vonsattel et al., 1985]. Clinically, the disorder is characterized by progressive motor dysfunction, psychiatric disturbances, and cognitive deficits. Accumulating clinical, neuropsychological, and neuroimaging evidence [Kloppel et al., 2009b; Paulsen, 2009] indicates that in presymptomatic carriers of the HD gene mutation (preHD), subclinical changes may precede the onset of motor dysfunction by several years. This can include subtle neuropsychiatric symptoms [Kirkwood et al., 1999; Nehl et al., 2001] as well as impaired cognitive performance involving multiple domains such as psychomotor speed [Snowden et al., 2002; Stout et al., 2011], episodic memory [Montoya et al., 2006], working memory [Tabrizi et al., 2009], and executive function [Lawrence et al., 1998a; Lemiere et al., 2004; Nehl et al., 2001]. Complementing these findings, neuroimaging studies in preHD have shown structural, metabolic, and perfusion abnormalities extending beyond the striatum to more widespread cortical regions [Gomez‐Anson et al., 2009; Lawrence et al., 1998b; Paulsen et al., 2006; Pavese et al., 2010; Rosas et al., 2005]. More recently, functional magnetic resonance imaging (fMRI) has been increasingly used to investigate early signs of neural dysfunction in preHD [Bohanna et al., 2008; Kloppel et al., 2009b]. Using task‐based fMRI brain activation has been assessed for a variety of conditions of cognitive performance including time production [Zimbelman et al., 2007], local interference [Reading et al., 2004], complex motor sequences [Kloppel et al., 2009a], and working memory [Wolf et al., 2007]. These studies have detected task‐related brain activation changes even in early preHD cohorts, where neural changes were found more often in cortical regions than in striatal areas [Kloppel et al., 2009b].
Attention is a crucial prerequisite for “higher‐order” cognitive processes, such as working memory and executive function [Funahashi, 2001; Kubler et al., 2003; Posner and Petersen, 1990]. Attentional deficits have been already observed in both manifest and preclinical HD [Campodonico et al., 1996; Muller et al., 2002; Sprengelmeyer et al., 1995; Verny et al., 2007]; however, little is known about the functional integrity of the neural correlates of attentional processing in HD gene mutation carriers. Considering that every “higher‐order” cognitive function relies on basal aspects of attention, this is an important issue. For the present study, we have deliberately chosen a task with low cognitive demands to assess basic aspects of attention processing in our preHD participants. We tested two different states of alertness in a so‐called alertness task where responses are obtained in conditions with and without a preceding cue. Conditions without a cue are thought to reflect participants' intrinsic alertness (IA) referring to the tonic aspects of this basic attentional function that maintains a sufficient level of arousal to respond to an event at any given point in time. Responses with a preceding cue are thought to reflect the participants' externally triggered responsiveness to a salient event at any given time point (phasic alertness, PA). Because reaction times (RT) of participants' are the critical‐dependent variable, the difference between intrinsic and externally triggered RT is usually expressed in an increase in response speed [Perin et al., 2010]. These subfunctions appear crucial to enable efficient stimulus processing and have been shown to modulate selective attention and spatial processing in both healthy [Bellgrove et al., 2004; Coull et al., 1998] and disease‐related conditions [Festa‐Martino et al., 2004; Robertson et al., 1995]. Thus, the assessment of these functions is intricately linked to more complex aspects of attention, such as selecting a stimulus and monitoring a salient target [Coull et al., 1998; Posner, 2008].
The objectives of the present study were threefold. First, we investigated whether behavioral performance of HD gene mutation carriers differ from controls in a task assessing IA and PA, functions which have been consistently associated with a frontoparietal and subcortical network [Mottaghy et al., 2006; Sturm and Willmes, 2001; Thiel and Fink, 2007]. Second, using fMRI during the alertness task, we investigated its neural correlates in preHD individuals and healthy controls, including between‐group comparisons of neural activity for each condition. Third, we evaluated brain function on a neural network level. To this end, we analyzed fMRI data using multivariate statistical techniques that are suitable to define connectivity aspects of temporally coherent brain networks [Esposito et al., 2006; Sambataro et al., 2009]. We predicted differences in corticostriatal activation and network connectivity in preHD participants according to how near they were to the estimated onset of unequivocal signs of HD. Specifically, we predicted lower levels of neural activation and network connectivity in those preHD participants near to symptom onset, compared to both preHD far from onset and controls.
MATERIALS AND METHODS
Participants
We studied 18 right‐handed [Oldfield, 1971] preHD participants. All had a molecular genetic diagnosis of a CAG repeat expansion (≥39) in the huntingtin gene (Table I) and a diagnostic confidence score of ≤2 on the motor Unified Huntington's Disease Rating Scale [UHDRS, Huntington Study Group, 1996]. All participants underwent a thorough neuropsychiatric examination by clinicians experienced in HD (G. B. L., C.S. and M. O.); this included the complete UHDRS, the Beck Depression inventory [BDI] [Beck et al., 1961] and the 21‐item Hamilton Depression Rating Scale [HAMD]. PreHD participants with a history of another neurological disorder, a history of head trauma or learning disabilities, were excluded from the study. In addition, all participants underwent a semistructured psychiatric interview in order to exclude axis‐I and axis‐II disorders according to DSM‐IV‐TR (interview conducted by R.C.W). One preHD participant was treated with an antidepressant (venlafaxine, mean daily dosage 150 mg), whereas the other preHD individuals did not report to receive a regular treatment with psychotropic drugs. The age‐at‐onset of motor symptoms was defined as the age at which the predicted probability of symptoms exceeds 0.6 using a formula based on age and CAG repeat length [Langbehn et al., 2004]. PreHD participants were then assigned to two subgroups: those farther (preHDfar) or closer (preHDnear) from onset than the median estimated time to motor symptom onset (= 18.7 years); see Table II.
Table I.
Demographics and clinical scores for healthy controls (n = 18) and preHD participants (n = 18)
| Controls (n = 18) | preHD (n = 18) | P‐value | |||
|---|---|---|---|---|---|
| Mean | SD | Mean | SD | ||
| Age (years) | 37.2 | 10.3 | 36.3 | 9.0 | 0.8 |
| Education (years) | 15.1 | 2.7 | 14.7 | 2.0 | 0.7 |
| Gender (m/f) | 9/9 | 8/10 | |||
| EHI scorea | 88.1 | 12.1 | 85.1 | 14.5 | 0.5 |
| CAG repeat length | 42.1 | 3.1 | |||
| Estimated years to motor onsetb | n.a. | 21.9 | 13.3 | ||
| UHDRS motor score | n.a. | 3.1 | 3.0 | ||
| UHDRS behavioral score | n.a. | 3.0 | 6.7 | ||
| UHDRS cognitive score | n.a. | 329.8 | 32.3 | ||
| BDI score | 1.1 | 1.9 | 4.1 | 4.7 | 0.02 |
| HAMD score | 1.2 | 1.6 | 2.2 | 2.6 | 0.2 |
N.a. indicates that these data were not available in healthy participants.EHI, Edinburgh Handedness Inventory; BDI, Beck depression inventory; UHDRS, Unified Huntington's disease rating scale; HAMD, Hamilton depression rating scale.
Oldfield, 1971.
Years to 60% probability of diagnostic onset (Langbehn et al., 2004).
Table II.
Demographics and clinical scores for preHDfar (n = 9) and preHDnear (n = 9) participants
| preHDfar (n = 9) | preHDnear (n = 9) | P‐value | |||
|---|---|---|---|---|---|
| Mean | SD | Mean | SD | ||
| Age (years) | 32.9 | 7.0 | 39.8 | 9.8 | 0.1 |
| Education (years) | 14.8 | 2.1 | 14.7 | 2.0 | 0.9 |
| Gender (m/f) | 2/7 | 6/3 | 0.01c | ||
| EHI scorea | 88.1 | 12.1 | 85.1 | 14.5 | 0.5 |
| CAG repeat length | 40.1 | 1.5 | 44.0 | 3.1 | 0.00 |
| Estimated years to motor onsetb | 33.0 | 8.9 | 10.8 | 4.4 | 0.00 |
| UHDRS motor score | 2.7 | 2.8 | 3.4 | 3.2 | 0.6 |
| UHDRS behavioral score | 0.0 | 0.0 | 6.8 | 8.7 | 0.05 |
| UHDRS cognitive score | 331.9 | 23.0 | 327.7 | 40.9 | 0.8 |
| BDI score | 3.9 | 4.8 | 4.3 | 4.9 | 0.8 |
| HAMD score | 2.1 | 2.4 | 2.2 | 2.9 | 0.2 |
The healthy control group consisted of 18 right‐handed participants matched for age, education, and handedness. Participants with a neurological or a psychiatric disorder according to DSM‐IV‐TR criteria, substance abuse, or dependence were excluded. The project was approved by the local Ethics Committee (University of Ulm, Germany). Written informed consent was obtained from all participants following a complete description of the study.
Activation Paradigm for fMRI
Basic attentional processes were assessed using a modified alertness task derived from a standardized test battery [Zimmermann and Fimm, 1994]. Alertness and preparatory attention may refer to the same basic function that is a prerequisite for any more complex cognitive effort [Thiel and Fink, 2007; Thiel et al., 2004]. The activation paradigm used in this study was designed to measure both intrinsic and phasic aspects of alertness, where the participants were instructed to press a button whenever an oblique cross appeared on the screen (see Fig. 1, top). The task comprised two activation conditions: in the first condition (IA), the stimulus was presented at random time intervals on a black screen, prompting the subject to press a button as quickly as possible with the right middle finger. In the second condition (PA), a short auditory warning signal of 1,000 Hz preceded the visual stimulus, and participants were instructed to press a button immediately when they saw the oblique cross. In the baseline condition, a white dot was presented until the presentation of a series of oblique crosses with or without preceding auditory warning signal. In each condition (IA and PA), there were two instances of jittering in order to create nonrhythmic and random appearances of each trial within one block of functional challenge. For the IA condition, virtual (i.e., not visible for the subjects) intertrial intervals (ITI) were jittered in intervals between 595 and 1495 ms (mean: 1,045 ms; SD: 291 ms). A second jitter was introduced before the appearance of the target (the cross) in intervals between 160 and 1060 ms (mean: 610 ms; SD: 291 ms). Presentation of the oblique cross had a fixed duration of 500 ms, however with a response dependent abortion. In total, each trial lasted 2,155 ms. Duration of one block of functional challenge for this condition was 22 s as was the duration of the ensuing baseline block. For PA trials, the (virtual) ITI jittered between 755 and 955 ms (mean: 848 ms; SD: 82 ms). Duration of the warning tone was fixed at a length of 500 ms; afterward, a second jitter was used before the appearance of the target. This jitter ranged between 200 and 400 ms (mean: 308 ms; SD: 82 ms). Presentation of the target was again at a fixed length of 500 ms, again with a response‐dependent abortion. Total duration of one trial was 2,155 ms, and one block of functional challenge also had duration of 22 s. The experimental blocks were arranged in the following order: IA(1) – PA(1) – PA(2) – IA(2) – IA(3) – PA(3) – PA(4) – IA(4). Baseline blocks of 22 s were included between the activation conditions. Before scanning, all participants were trained offline using a parallel version of the task.
Figure 1.
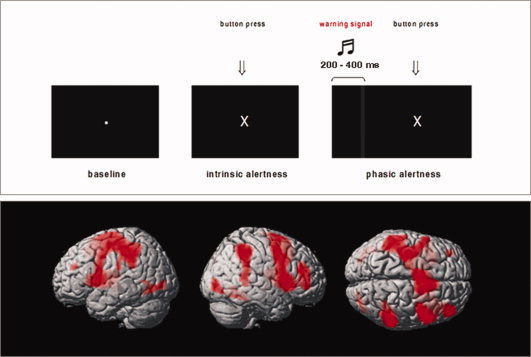
Top: Activation task for fMRI. Bottom: Brain activation during intrinsic and phasic alertness. Shown are rendered images (left, right, and superior views) derived from a GLM second‐level t‐test model using a conjunction analysis for the IA (controls and preHD) and the PA (controls and preHD) condition; P < 0.001, uncorrected at the voxel‐level, P < 0.05 corrected for spatial extent. The second‐level maps are rendered on the anatomical template implemented in SPM5. [Color figure can be viewed in the online issue, which is available at wileyonlinelibrary.com.]
fMRI Data Acquisition
The functional data were acquired using a 3T Magnetom ALLEGRA (Siemens, Erlangen, Germany) head MRI system. T2*‐weighted images were obtained using echo‐planar imaging in an axial orientation (TR/TE = 2,200/39 ms, FoV 230 mm, 30 slices, slice thickness 3 mm, and gap 25%). Stimuli were presented via LCD video goggles (Resonance Technologies, Northridge, CA) and both RT and accuracy indices were recorded. Within the scanner, the task was performed during a single session, yielding 183 whole‐brain MRI volumes (total acquisition time of 6 min and 42.6 s). The first 10 volumes of the experimental run were discarded to allow for equilibration effects.
Data Analysis
Behavioral data analysis
Median RT were calculated for both conditions (IA and PA). Alerting‐related RT was calculated by subtracting the RT during the PA condition from the IA condition. In addition, the number of omitted trials during both conditions was taken into account. Differences between controls and preHD participants were assessed by calculating t‐tests for each measure and condition (P < 0.05).
fMRI data analysis
General Linear Model analyses
All functional data analyses were performed using SPM5 (Wellcome Department of Cognitive Neurology, London) and MATLAB 7.3 (MathWorks, Natick, MA). The functional images were corrected for motion artifacts, and then spatially normalized to the SPM5 EPI standard template. All images were spatially smoothed with a 10‐mm full width at half maximum isotropic Gaussian kernel. Single‐subject analyses and group comparisons were performed within the framework of the General Linear Model GLM [Friston et al., 1995]. The sequence of temporal events was modeled with an SPM5 design matrix including two regressors (IA and PA condition), convolved with the canonical hemodynamic response function. The individual movement parameters (three rigid body translations and rotations) were included as confounding variables. The individual images were entered into a fixed effects model for each subject and adjusted for global effects. Low frequency drifts were removed via a highpass filter using low‐frequency cosine functions with a cut off of 128 s. High frequency drifts were removed via a Gaussian lowpass filter of 4 s. The following contrasts were calculated for each subject using linear contrasts: (1) IA = activation during the IA condition, (2) PA = activation during the PA condition, (3) PA > IA = alerting‐related activity, that is, differential neural activity to warned (PA) versus unwarned (IA) conditions [Thiel and Fink 2007]. For within‐group analyses, voxelwise one‐sample t‐tests against the null hypothesis of zero magnitude were used to calculate within‐group maps for condition (IA, PA, and PA > IA). Group comparisons between healthy controls, far and near preHD participants, were conducted at the second level using the individual first‐level contrasts (IA, PA, and PA > IA) and an analysis of variance (ANOVA) model, where gender and BDI scores were included as nuisance variables. These analyses were masked by a combination of the main effects maps of both groups (P < 0.05). For the second‐level within‐ and between‐group comparisons, the joint criteria of an uncorrected voxelwise threshold of P < 0.001 and a cluster threshold of 50 or more contiguous activated voxels were used for controlling the false positive rate [Forman et al., 1995]. These thresholds, based on 2,000 Monte Carlo simulations using the “AlphaSim” algorithm (http://afni.nimh.nih.gov/pub/dist/doc/manual/Alpha-Sim.pdf), were used for generating corrected functional maps (corrected P < 0.05), thereby reducing the likelihood of false positives from noise.
Independent component analysis
Independent component analysis (ICA) is a multivariate statistical technique that maximizes the independence between output components of fMRI data [Calhoun et al., 2001, 2004], thus identifying a set of spatially nonoverlapping and temporally synchronous brain networks, which can be both task‐related and task‐independent. With regard to functional connectivity of fMRI data, spatial ICA reveals “temporally coherent networks” [Calhoun et al., 2008] by measuring functional covariance patterns between different brain areas. ICA has been proven to be a useful complementary approach for “standard” univariate fMRI data processing, because it allows an analysis of functional connectivity within task‐related neural networks [Esposito et al., 2006; Sambataro et al., 2009]. In this study, a spatial ICA was performed using the “Group ICA for fMRI Toolbox” (GIFT; http://icatb.sourceforge.net) [Correa et al., 2005]. The dimensionality of the functional data for each subject was reduced using three consecutive steps of Principal Component Analysis alternated with data concatenation across the subjects, resulting in one aggregate mixing matrix for all the subjects. An ICA decomposition using the Infomax algorithm was used to extract 18 independent components (ICs), consisting of group spatial maps and related time‐courses. The minimum description length criteria were used to estimate the order selection, that is, the number of ICs [Calhoun et al., 2001] from the smoothed data sets after taking into account the spatial and temporal correlation of the fMRI data. A set of effectively independent and identically distributed data samples was first estimated for each subject through a subsampling algorithm, and the median of these values across the whole sample was used for order selection. The estimation of the number of the ICs performed directly on the data has been shown to effectively reduce the occurrence of over/underfitting the data [Li et al., 2007]. The estimated ICs were used for a back reconstruction into individual ICs using the aggregate mixing matrix created during the dimensionality data reduction steps. The individual ICs consisting of individual spatial independent maps and time‐courses were eventually temporally sorted using the event regressors of the task (i.e., IA and PA) using the individual task design matrices as computed for the individual (first level) GLM analyses. To assess task‐positive networks associated with both alertness conditions (IA and PA), two components of interest (COIs) that showed the highest positive temporal correlation with both the IA and the PA regressors were chosen for second‐level within‐ and between‐group analyses. These COIs were identified using a temporal sorting procedure (“temporal correlation”), as implemented in GIFT.
For each subject's spatial COIs, the voxel weights across all sessions were used as random effects variables and analyzed using SPM5. For within‐group analyses, voxelwise one‐sample t‐tests against the null hypothesis of zero magnitude were used to calculate within‐group maps for each COI. To compare spatial maps between healthy controls, far and preHDnear participants, a second‐level ANOVA model was computed, where gender and BDI scores were included as nuisance variables. These analyses were masked by a combination of the main effects maps of both groups (P < 0.05). For the second‐level within‐ and between‐group comparisons, we chose joint criteria of an uncorrected voxelwise threshold of P < 0.001 and a cluster threshold of 50 or more contiguous activated voxels (corrected P < 0.05) to control for the false positive rate.
The stereotaxic coordinates from the between‐group analyses are reported as coordinates of maxima in a given cluster according to the Montreal Neurological Institute (MNI) template. Anatomical regions and denominations are reported according to the atlas of Talairach and Tournoux [1988]. The conversion from MNI to Talairach space was performed following the approach described by Lancaster et al. [2007], http://www.brainmap.org/icbm2tal/icbm_spm2tal.m).
Relationship between brain function, clinical measures and behavioral performance
To investigate the relationship between neural changes and clinical variables, we extracted beta parameters from the GLM analysis and from the ICA. These parameters were extracted from cluster maxima emerging from the between‐group comparisons (see below). Stepwise multiple regression analyses were used to determine which clinical parameters were the best predictors for the observed functional changes. The predictors were considered to be significant at P < 0.05. In addition, correlation analyses (P < 0.05) were calculated between brain function and behavioral variables. After confirming normal distribution (Shapiro–Wilks W‐test) of the data, correlations were computed using behavioral variables (RT during the IA and PA conditions) and beta parameters. All analyses were performed using the Statistica software (Version 6.0, StatSoft, Tulsa, OK).
RESULTS
Participants
Ratings on the UHDRS motor scale confirmed that preHD participants were presymptomatic with low‐motor‐abnormality scores. All groups, preHDnear, preHDfar, and controls, were similar in age and years of education (Table II). There were more women in the preHDnear group, a significant difference between preHD individuals far and near to the estimated symptom onset was found with respect to gender, CAG repeat length, and the estimated years to symptom onset (Table II). BDI scores were significantly higher in preHD than in controls (P < 0.02), whereas HAMD scores were not significant (see also Table I).
Behavioral Results
RT did not significantly differ between controls and preHD individuals in the IA‐ and PA condition, and, to a similar degree, both controls and preHD were able to respond faster in the PA‐condition. In all groups and in both conditions, the number of omitted trials was not significantly different. RT and the number of omitted trials did not significantly differ between preHDnear, preHDfar, and healthy controls (see Table III).
Table III.
Behavioral task performance during fMRI
| Controls (n = 18) | preHDfar (n = 9) | preHDnear (n = 9) | Controls versus preHDfar | Controls versus preHDnear | preHDfar versus preHDfnear | ||||
|---|---|---|---|---|---|---|---|---|---|
| Mean | SD | Mean | SD | Mean | SD | ||||
| RT IA condition (ms) | 277.2 | 37.9 | 261.1 | 27.0 | 289.5 | 42.7 | P = 0.1 | P = 0.5 | P = 0.1 |
| RT PA condition (ms) | 236.8 | 34.4 | 226.3 | 27.6 | 246.7 | 34.8 | P = 0.2 | P = 0.5 | P = 0.2 |
| RT difference PA > IA (ms) | −40.4 | 29.2 | −34.9 | 23.8 | −42.9 | 25.6 | P = 0.5 | P = 0.8 | P = 0.5 |
| Number of omitted trials (IA) | 1.0 | 2.1 | 1.7 | 3.2 | 1.4 | 3.6 | P = 0.9 | P = 0.7 | P = 0.9 |
| Number of omitted trials (PA) | 0.6 | 0.6 | 3.8 | 7.1 | 0.6 | 0.7 | P = 0.2 | P = 1.0 | P = 0.2 |
Shown is the number of omitted stimuli (group means and standard deviations) during the IA/PA conditions and reaction times (RT, group means, and standard deviations) for the IA/PA conditions as well as RT differences between PA and IA.
GLM Between‐Group Analyses
In all groups, processing during the alertness task was associated with activation in right lateralized lateral prefrontal, parietal, temporal, occipital, and subcortical regions (see Fig. 1, bottom). The PA > IA contrast revealed activation in bilateral auditory and motor areas, in superior temporal regions, in the precuneus and in the medial frontal cortex in preHD and controls.
Separately, for either task condition (IA and PA) group, differences were computed. During the IA condition, planned contrasts between controls and preHDnear or preHDfar as well as between preHDnear and preHDfar subgroups did not reveal any significant differences. However, for the PA condition, the right dorsolateral prefrontal cortex (DLPFC, middle frontal gyrus, Brodmann area [BA] 9), the left medial frontal gyrus (BA 6), and the right putamen were less active in preHDnear participants than in controls. Compared to preHDfar, preHDnear participants showed decreased activation in the right lingual gyrus (BA 18) and again in the right putamen (see Fig. 2 and Table IV for detailed coordinates and z‐scores). These differences were specific to the preHDnear group; preHDfar and controls did not significantly differ. When inverting the direction of the contrasts above, no preHD group showed brain areas that were more active than those of controls. The contrast preHDnear > preHDfar did not yield significant findings.
Figure 2.
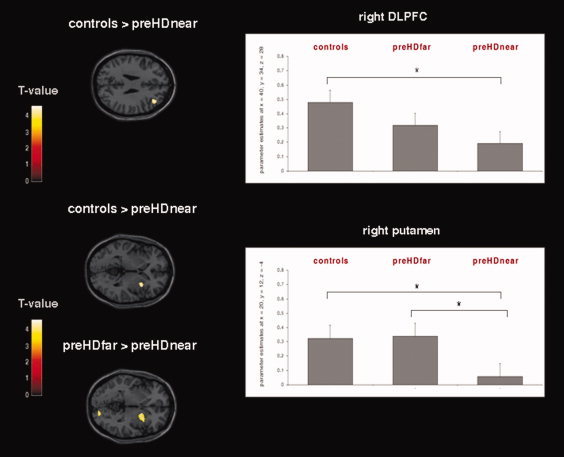
Left: Frontostriatal activation changes during the PA condition in preHDnear participants compared to controls and preHDfar participants. Results from the GLM second level between‐group ANOVA (P < 0.001, uncorrected at the voxel‐level, P < 0.05 corrected for spatial extent); see Table IV for detailed coordinates and z‐scores. The second‐level maps are rendered on the anatomical templates implemented in SPM5. Right: Mean activation effects (estimated beta parameters) in the right DLPFC and the right putamen. The beta parameters were extracted from activation clusters emerging from the between‐group second‐level ANOVA (P < 0.001, uncorrected at the voxel‐level, P < 0.05 corrected for spatial extent). * indicates significant between‐group differences. [Color figure can be viewed in the online issue, which is available at wileyonlinelibrary.com.]
Table IV.
Regions exhibiting differences in brain activation (intrinsic alertness [IA] condition) and functional connectivity (alertness‐related network 1) in preHDnear compared to controls and preHDfar individuals
| Controls > preHDnear | No. of voxels | preHDfar > preHnear | ||||||||||
|---|---|---|---|---|---|---|---|---|---|---|---|---|
| Anatomical region | x | y | z | Z | Anatomical region | x | y | z | Z | No. of voxels | ||
| IA condition | Right putamen | 20 | 12 | −4 | 3.68 | 131 | Right putamen | 28 | 10 | −6 | 3.91 | 294 |
| Right middle frontal gyrus (BA 9) | 40 | 34 | 28 | 3.66 | 75 | Right lingual gyrus (BA 18) | 18 | −90 | −4 | 4.04 | 112 | |
| Left medial frontal gyrus (BA 6) | −4 | −6 | 56 | 3.27 | 79 | |||||||
| Alertness‐related network 1 | Left precentral gyrus | −18 | −14 | 68 | 4.50 | 633 | Left precentral gyrus | −16 | −14 | 68 | 4.26 | 445 |
| Left medial frontal gyrus (BA 6) | −4 | −6 | 52 | 4.49 | Left medial frontal gyrus (BA 6) | −4 | −6 | 52 | 3.85 | |||
Results from second level between‐group analyses (ANOVA model, P < 0.001, uncorrected at the voxel‐level, spatial extent threshold of at least 50 contiguous voxel).
Functional Connectivity Between‐Group Analyses
Eighteen ICs were estimated, consisting of individual spatial independent maps and time‐courses. In healthy controls and preHD individuals, two components of interest (COIs) were chosen for further analyses. These COIs included those voxels with the highest positive temporal correlation between the component‐related time course and the IA and the PA regressors, as specified by the experimental design matrix (COI 1, IA/PA: r = 0.33/0.37; COI 2, IA/PA: r = 0.25/0.30, P = 0.0001 for both conditions/COIs). The first COI revealed a network pattern of predominantly sensorimotor, cingulate, striatal, and thalamic regions in both groups (see Fig. 3). The second COI revealed a network comprising right lateralized ventro‐ and dorsolateral prefrontal regions, superior and inferior parietal areas, the dorsal and posterior cingulate cortex, and the precuneus (see Fig. 3).
Figure 3.
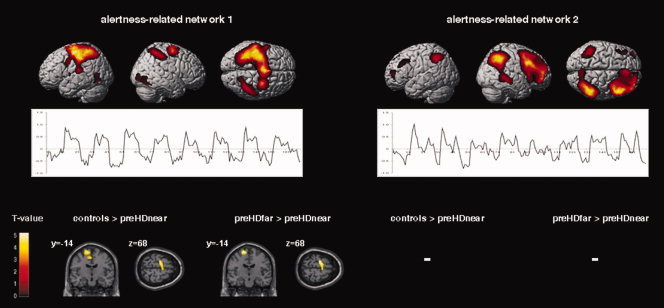
Top: ICA‐derived spatial patterns and related time‐course means of those networks of interest, which showed a positive temporal correlation with the IA and PA regressors (left, right, and superior view). Results from the second‐level within‐group t‐tests including controls and preHD individuals (P < 0.001, uncorrected at the voxel‐level, P < 0.05 corrected for spatial extent). Bottom: Areas with decreased functional connectivity in preHDnear participants compared with healthy participants and preHD far from the estimated motor symptom onset. Results from the second‐level between‐group ANOVA (P < 0.001, uncorrected at the voxel‐level, P < 0.05 corrected for spatial extent); see Table IV for detailed coordinates and Z‐scores. The second‐level maps are rendered on the anatomical templates implemented in SPM5. [Color figure can be viewed in the online issue, which is available at wileyonlinelibrary.com.]
Within the first network, preHDnear participants showed less functional connectivity in a cluster including the left motor cortex and the left supplementary motor area (SMA) when compared with controls or to preHDfar (see Fig. 3 and Table IV for detailed coordinates and z‐scores). The inverted contrasts, that is, preHDnear > controls and preHDnear > preHDfar did not yield significant findings. Within the second network, functional connectivity did not significantly differ between controls and the preHD subgroups.
Relationship Between Brain Function, Clinical Measures, and Behavioral Performance
The farther preHD participants were away from motor onset the more active was the putamen (β = 0.471, P = 0.037) in the PA condition. Furthermore, in the preHD group, a negative correlation was found between the activation of the right putamen and individual mean RT during IA (r = −0.53, P = 0.02) and PA (r = −0.50, P = 0.04), so that reduced putaminal activity was associated with longer RT. There were no significant correlations between prefrontal activation/motor cortex connectivity and clinical/behavioral parameters.
DISCUSSION
This study investigated performance during an alertness‐task as well as task‐related brain activation and functional connectivity in preHD participants far and near to the onset of clinical signs of HD. Despite similar levels of task performance, preHDnear individuals showed significantly less activation of right frontostriatal regions during demands on PA than controls; compared to preHDfar participants, preHDnear had less activity of the right putamen and of occipital regions. Furthermore, task‐related functional connectivity within primary motor regions and the SMA was significantly lower in preHDnear participants compared to the preHDfar and the control group.
Numerous cross‐sectional and longitudinal studies have addressed the question whether cognitive deficits are present in preHD individuals before overt clinical symptoms. Abnormal performance across multiple cognitive domains has been shown by several studies so far [Stout et al., 2011; Tabrizi et al., 2009; Verny et al., 2007], although some authors have failed to demonstrate impaired cognition in preHD [Brandt et al., 2008; Campodonico et al., 1996]. In our study, similar response times in the two task conditions examining IA and PA indicate that preHD participants, independent from the onset of motor signs, were able to maintain alertness levels similar to controls. Several reasons may account for these findings: For instance, we investigated a preHD cohort with a mean time to motor onset of 21.9 years, that is, during a very early presymptomatic period. Thus, it is possible that alertness deficits may not be among potentially impaired functions at this preclinical stage of the disease. A considerable number of reports have supported the notion that preHD individuals can appear cognitively intact when they are far from the predicted motor onset and that the probability of showing signs of cognitive dysfunction increases with closer proximity to clinical symptom manifestation [Paulsen, 2009; Paulsen et al., 2008; Rupp et al., 2009; Stout et al., 2011; Tabrizi et al., 2009]. Cognitive dysfunction in preHD approaching motor onset is also paralleled by striatal volume loss [Tabrizi et al. 2009], thus at least partly explaining the deficits observed. Thus, it is possible that alertness deficits may evolve at a later presymptomatic stage or eventually during early symptomatic stages of the disease. For instance, manifest HD patients performing a similar alertness task had increased RT [Sprengelmeyer et al., 1995]. Also, deficits in PA were discussed against the background of a longer duration of the illness, possibly reflecting more pronounced frontostriatal degeneration [Muller et al., 2002]. It is also possible that during the very early preclinical stage, some tests of cognitive function may not reveal impaired performance, as recently shown by a large study on neurocognition in preHD [Stout et al., 2011]. However, considering the low cognitive demand imposed by the activation task used in this study, we cannot say whether at least preHDnear participants may have more difficulties than controls if demands on attentional networks increase [Gazzaley, in press]. We also acknowledge that the present data have been obtained under the condition of auditory cueing only. Thus, intended replications should consider to additionally or complementary use visual cueing as a second modality.
Assessing the neuronal activity upon processing of the alertness task revealed significant activation in right lateralized lateral prefrontal, parietal, temporal, occipital, and subcortical regions in controls and preHD individuals. The pattern of activation is in accordance with previous studies where a right lateralized network of frontoparietal areas was active during alertness tasks [Mottaghy et al., 2006; Sturm and Willmes, 2001; Thiel and Fink, 2007]. Under the condition of IA, all groups were similar. Processing the phasic condition of the task preHDfar individuals did not differ from controls, whereas preHDnear participants showed less activity in right frontostriatal regions when compared with controls or preHDfar participants. In particular, preHDnear demonstrated hypoactivation of the right DLPFC when compared with controls and hypoactivation of the right putamen when compared with controls and preHDfar. Previous studies support the notion that the right DLPFC is a critical structure for maintaining attention [Corbetta and Shulman, 2002; Perin et al., 2010; Posner and Petersen, 1990; Stuss et al., 2005; Vallesi et al., 2007], and it has also been shown that connections between the DLPFC and the basal ganglia may modulate cognitive processes [Alexander et al., 1986; Chudasama and Robbins, 2006; Hikosaka and Isoda, 2010; Monchi et al., 2001]. These “gating” functions of the striatum [Braver and Cohen, 1999] may extend beyond mere motor processing and appear to play a crucial part for selective monitoring and updating of information and for the processing of attentional shifts [van Schouwenburg et al., 2010]. This is further corroborated by the correlation of putaminal acitivity with RT during the IA and the PA condition. With the caveat of inferring from cross‐sectional data, activity of the putamen declined when participants were closer to the estimated motor onset of the disease. This suggests a progressive loss of a putaminal contribution to attentional networks as the neurodegenerative process advances and adds to previous fMRI studies showing more pronounced loss of putaminal function with closer proximity to motor onset [Wolf et al., 2008b; Zimbelman et al., 2007].
Given these results and considering the importance of attentional alertness for cognitive processing per se one might speculate that hypoactivation of these structures may have contributed to or even conditioned the cognitive abnormalities that have been reported in preHD [Hahn‐Barma et al., 1998; Lemiere et al., 2004; Verny et al., 2007; Stout et al., 2011; Tabrizi et al., 2009]. However, although this explanation might appear plausible, for two reasons the observed hypoactivation may not be the sole explanation of cognitive deficits in preHD. First, brain activation changes in preHD have been demonstrated across a wide range of cognitive challenges of varying complexity in which individual factors of processing strategy and/or increasing cognitive demand were able to modulate activation changes in preHD [Kloppel et al., 2009a; Wolf et al., 2008b]. If a general hypoactivation of the frontostriatal network had been in action in these tasks as a general factor, then the appearance of modulated brain activity would have been less likely. Second, in the present study, it was shown that reduction of neuronal activity was associated with the proximity to the estimated onset of the disease. This suggests that the right‐sided DLPFC activity changes evolve with the underlying functional degeneration. This differs from reduced activity of the left DLPFC that was evident in both subgroups of preHD participants who were near and far from onset during a working memory task [Wolf et al., 2007]. The dependency of the observed hypoactivation on the time‐course of the neurodegenerative process also argues against the assumption of a general factor, because cognitive deficits might already appear in preHD farther from the estimated symptom onset [Tabrizi et al., 2009].
Apart from the assessment of local task‐related activation differences, we also investigated the connectivity between regions and their differences between groups. This type of analysis differs from the GLM analysis used for regional activity and permits assessing how different regions, independent of their regional activity, are spatiotemporally connected. We were specifically interested to test the hypothesis that less activity in the right DLPFC is mirrored in a change of connections of the DLPFC to other regions. We observed two network patterns related to both the IA and the PA condition. One of these networks consisted mainly of right lateralized ventro‐ and dorsolateral prefrontal regions, parietal areas, and regions of cingulate cortex, similar to the frontoparietal activation pattern revealed by the GLM analysis. Consistent with our hypothesis, we would have expected alterations in a network involving the right DLPFC. However, this was not the case, and functional connectivity changes of primary and supplementary motor regions in preHDnear emerged in a network distinct from the frontoparietal circuit. A possible explanation for this discrepancy from our initial expectation takes methodological considerations into account. In contrast to the GLM analyses, the connectivity analyses did not permit to separate between the phasic and intrinsic conditions of the alertness task. It is therefore conceivable that subtle changes in connectivity may have been lost. It also possible that during the early presymptomatic period, changes in frontostriatal activity may not be necessarily paralleled by changes of functional connectivity. Previously, we observed synchronous changes in activity and connectivity in a working memory task [Wolf et al., 2008a], while in the present alertness task despite significant regional deficits of brain activation, the temporal coherence of the subserving network appeared normal. Changes of functional connectivity within distinct task‐related networks could thus mirror task‐ or process‐specific demands rather than a general deficit of brain networks involving prefrontal regions and the striatum. We speculate that with progression of the neurodegenerative process, the functional connectivity of the “attention network” might first deteriorate in network nodes found to exhibit lower activation, such as the right DLPFC and the right putamen. However, longitudinal data are needed to test this hypothesis.
One alertness‐related network was found to include predominantly sensorimotor, cingulate, striatal, and thalamic areas. Here, we found significantly lower connectivity of motor regions in preHDnear, indicating a relationship between proximity to the onset of HD signs and deterioration of motor function. Motor movement preparation and speeded responses were a demand inherent to the present task design. Hence, the functional changes in motor regions are probably associated with the motor aspect of the task. A dysfunction of regions involved in motor performance has been well recognized by electrophysiological and neuroimaging studies in early HD [Bartenstein et al., 1997; Beste et al., 2009] and preHD [Kloppel et al., 2009a; Orth et al., 2010; Schippling et al., 2009]. Our data add new evidence to support the notion of an early functional involvement of the motor domain in preHD, suggesting subtle changes of connectivity before the occurrence of regionally specific activation changes. This is also in line with neuropsychological data in preHD, indicating that cognitive dysfunction in preHD may not evolve uniformly and that the pattern of cognitive deficits in preHD subjects may also vary over time [Nehl et al., 2001; Rupp et al., 2009; Snowden et al., 2001, 2002]. For instance, changes in psychomotor speed might be present in a relatively early presymptomatic period, whereas deficits in working memory or executive function seem to develop with closer proximity to the clinical onset [Nehl et al., 2001; Snowden et al., 2002]. In addition, longitudinal findings have suggested that motor measures and speeded tasks may be more sensitive to disease‐related changes than more complex measures of cognition [Kirkwood et al., 1999; Rupp et al., 2009] and that indices of motor performance could also maximize sensitivity to change in preHDnear participants [Solomon et al., 2008]. The connectivity differences found in the present preHDnear cohort could therefore be regarded as an early neural correlate of motor deficits. However, we again acknowledge that inferring from cross‐sectional data to the evolution of brain activation and connectivity changes over time remains tentative and suggest longitudinal assessments to clarify this issue.
Despite the limitations imposed by the cross‐sectional design of the present study, we have shown that even during performance of a rather low‐demand alertness task individuals carrying a mutated huntingtin gene demonstrated hypoactivation in task‐associated brain regions (right prefrontal and striatal areas) as well as lower functional connectivity in primary and supplementary motor regions. Importantly, these functional changes were observed only in participants near to the estimated onset of clinical signs, while those far from symptom onset did not show any task‐associated abnormalities of brain function. This difference indicates that frontostriatal activity and motor cortex connectivity decline with proximity to the onset of unequivocal signs of HD. The areas implicated in our study differ from those highlighted when higher cognitive functions were assessed in preHD. This suggests that hypoactivity of right frontostriatal regions alone is not sufficient to explain other differences in brain activation and performance observed in preHD.
Acknowledgements
This study was supported by a grant from the CHDI/High Q foundation, a non‐for‐profit organization dedicated to increase the understanding of Huntington's disease and to facilitate the development of new treatment strategies for this illness (http://www.highqfoundation.org/). This study also received support from the European Huntington's Disease Network (EHDN, http://www.euro-hd.net/html/network). We are grateful to Ju¨︁rn Wolf and Johanna Fischer for their assistance with data collection. The authors would also like to thank all participants and their families for their time and interest in this study.
REFERENCES
- Alexander G, Delong M, Strick P ( 1986): Parallel organization of functionally segregated circuits linking basal ganglia and cortex. Ann Rev Neurosci 9: 357–381. [DOI] [PubMed] [Google Scholar]
- Bartenstein P, Weindl A, Spiegel S, Boecker H, Wenzel R, Ceballos‐Baumann AO, Minoshima S, Conrad B ( 1997): Central motor processing in Huntington's disease. A PET study. Brain 120 ( Pt 9): 1553–1567. [DOI] [PubMed] [Google Scholar]
- Beck AT, Ward CH, Mendelson M, Mock J, Erbaugh J ( 1961): An inventory for measuring depression. Arch Gen Psychiatry 4: 561–571. [DOI] [PubMed] [Google Scholar]
- Bellgrove MA, Dockree PM, Aimola L, Robertson IH ( 2004): Attenuation of spatial attentional asymmetries with poor sustained attention. Neuroreport 15: 1065–1069. [DOI] [PubMed] [Google Scholar]
- Beste C, Konrad C, Saft C, Ukas T, Andrich J, Pfleiderer B, Hausmann M, Falkenstein M ( 2009): Alterations in voluntary movement execution in Huntington's disease are related to the dominant motor system: Evidence from event‐related potentials. Exp Neurol 216: 148–157. [DOI] [PubMed] [Google Scholar]
- Bohanna I, Georgiou‐Karistianis N, Hannan AJ, Egan GF ( 2008): Magnetic resonance imaging as an approach towards identifying neuropathological biomarkers for Huntington's disease. Brain Res Rev 58: 209–225. [DOI] [PubMed] [Google Scholar]
- Brandt J, Inscore AB, Ward J, Shpritz B, Rosenblatt A, Margolis RL, Ross CA ( 2008): Neuropsychological deficits in Huntington's disease gene carriers and correlates of early “conversion”. J Neuropsychiatry Clin Neurosci 20: 466–472. [DOI] [PMC free article] [PubMed] [Google Scholar]
- Braver TS, Cohen JD ( 1999): Dopamine, cognitive control, and schizophrenia: The gating model. Prog Brain Res 121: 327–349. [DOI] [PubMed] [Google Scholar]
- Calhoun VD, Adali T, Pearlson GD, Pekar JJ ( 2001): A method for making group inferences from functional MRI data using independent component analysis. Hum Brain Mapp 14: 140–151. [DOI] [PMC free article] [PubMed] [Google Scholar]
- Calhoun VD, Adali T, Pekar JJ ( 2004): A method for comparing group fMRI data using independent component analysis: Application to visual, motor and visuomotor tasks. Magn Reson Imaging 22: 1181–1191. [DOI] [PubMed] [Google Scholar]
- Calhoun VD, Kiehl KA, Pearlson GD ( 2008): Modulation of temporally coherent brain networks estimated using ICA at rest and during cognitive tasks. Hum Brain Mapp 29: 828–838. [DOI] [PMC free article] [PubMed] [Google Scholar]
- Campodonico JR, Codori AM, Brandt J ( 1996): Neuropsychological stability over two years in asymptomatic carriers of the Huntington's disease mutation. J Neurol Neurosurg Psychiatry 61: 621–624. [DOI] [PMC free article] [PubMed] [Google Scholar]
- Chudasama Y, Robbins TW ( 2006): Functions of frontostriatal systems in cognition: Comparative neuropsychopharmacological studies in rats, monkeys and humans. Biol Psychol 73: 19–38. [DOI] [PubMed] [Google Scholar]
- Corbetta M, Shulman GL ( 2002): Control of goal‐directed and stimulus‐driven attention in the brain. Nat Rev Neurosci 3: 201–215. [DOI] [PubMed] [Google Scholar]
- Correa N, Adali T, Yi‐Ou L, Calhoun VD ( 2005): Comparison of blind source separation algorithms for FMRI using a new Matlab toolbox: GIFT. Proc IEEE Int Conf Acoustics, Speech, Signal Process 5: 401–404. [Google Scholar]
- Coull JT, Frackowiak RS, Frith CD ( 1998): Monitoring for target objects: Activation of right frontal and parietal cortices with increasing time on task. Neuropsychologia 36: 1325–1334. [DOI] [PubMed] [Google Scholar]
- Esposito F, Bertolino A, Scarabino T, Latorre V, Blasi G, Popolizio T, Tedeschi G, Cirillo S, Goebel R, Di Salle F ( 2006): Independent component model of the default‐mode brain function: Assessing the impact of active thinking. Brain Res Bull 70: 263–269. [DOI] [PubMed] [Google Scholar]
- Festa‐Martino E, Ott BR, Heindel WC ( 2004): Interactions between phasic alerting and spatial orienting: Effects of normal aging and Alzheimer's disease. Neuropsychology 18: 258–268. [DOI] [PubMed] [Google Scholar]
- Forman SD, Cohen JD, Fitzgerald M, Eddy WF, Mintun MA, Noll DC ( 1995): Improved assessment of significant activation in functional magnetic resonance imaging (fMRI): Use of cluster‐size threshold. Magn Reson Med 33: 636–647. [DOI] [PubMed] [Google Scholar]
- Friston KJ, Holmes A, Worsley KJ, Poline JB, Frith CD, Frackowiak RSJ ( 1995): Statistical parametric maps in functional imaging: A general linear approach. Hum Brain Mapp 2: 189–210. [Google Scholar]
- Funahashi S ( 2001): Neuronal mechanisms of executive control by the prefrontal cortex. Neurosci Res 39: 147–165. [DOI] [PubMed] [Google Scholar]
- Gazzaley A (2011): Influence of early attentional modulation on working memory. Neuropsychologia 2010 Dec 22 [Epub ahead of print]. [DOI] [PMC free article] [PubMed] [Google Scholar]
- Gomez‐Anson B, Alegret M, Munoz E, Monte GC, Alayrach E, Sanchez A, Boada M, Tolosa E ( 2009): Prefrontal cortex volume reduction on MRI in preclinical Huntington's disease relates to visuomotor performance and CAG number. Parkinsonism Relat Disord 15: 213–219. [DOI] [PubMed] [Google Scholar]
- Hahn‐Barma V, Deweer B, Durr A, Dode C, Feingold J, Pillon B, Agid Y, Brice A, Dubois B ( 1998): Are cognitive changes the first symptoms of Huntington's disease? A study of gene carriers. J Neurol Neurosurg Psychiatry 64: 172–177. [DOI] [PMC free article] [PubMed] [Google Scholar]
- Hikosaka O, Isoda M ( 2010): Switching from automatic to controlled behavior: Cortico‐basal ganglia mechanisms. Trends Cogn Sci 14: 154–161. [DOI] [PMC free article] [PubMed] [Google Scholar]
- Kirkwood SC, Siemers E, Stout JC, Hodes ME, Conneally PM, Christian JC, Foroud T ( 1999): Longitudinal cognitive and motor changes among presymptomatic Huntington disease gene carriers. Arch Neurol 56: 563–568. [DOI] [PubMed] [Google Scholar]
- Kloppel S, Draganski B, Siebner HR, Tabrizi SJ, Weiller C, Frackowiak RS ( 2009a): Functional compensation of motor function in pre‐symptomatic Huntington's disease. Brain 132: 1624–1632. [DOI] [PMC free article] [PubMed] [Google Scholar]
- Kloppel S, Henley SM, Hobbs NZ, Wolf RC, Kassubek J, Tabrizi SJ, Frackowiak RS ( 2009b): Magnetic resonance imaging of Huntington's disease: Preparing for clinical trials. Neuroscience 164: 205–219. [DOI] [PMC free article] [PubMed] [Google Scholar]
- Kubler A, Murphy K, Kaufman J, Stein EA, Garavan H ( 2003): Co‐ordination within and between verbal and visuospatial working memory: Network modulation and anterior frontal recruitment. Neuroimage 20: 1298–1308. [DOI] [PubMed] [Google Scholar]
- Lancaster JL, Tordesillas‐Gutierrez D, Martinez M, Salinas F, Evans A, Zilles K, Mazziotta JC, Fox PT ( 2007): Bias between MNI and Talairach coordinates analyzed using the ICBM‐152 brain template. Hum Brain Mapp 28: 1194–1205. [DOI] [PMC free article] [PubMed] [Google Scholar]
- Langbehn DR, Brinkman RR, Falush D, Paulsen JS, Hayden MR, Group IHsDC ( 2004): A new model for prediction of the age of onset and penetrance for Huntington's disease based on CAG length. Clin Genet 65: 267–277. [DOI] [PubMed] [Google Scholar]
- Lawrence AD, Hodges JR, Rosser AE, Kershaw A, Ffrench‐Constant C, Rubinsztein DC, Robbins TW, Sahakian BJ ( 1998a): Evidence for specific cognitive deficits in preclinical Huntington's disease. Brain 121 ( Pt 7): 1329–1341. [DOI] [PubMed] [Google Scholar]
- Lawrence AD, Weeks RA, Brooks DJ, Andrews TC, Watkins LH, Harding AE, Robbins TW, Sahakian BJ. ( 1998b): The relationship between striatal dopamine receptor binding and cognitive performance in Huntington's disease. Brain 1343–1355. [DOI] [PubMed] [Google Scholar]
- Lemiere J, Decruyenaere M, Evers‐Kiebooms G, Vandenbussche E, Dom R ( 2004): Cognitive changes in patients with Huntington's disease (HD) and asymptomatic carriers of the HD mutation—A longitudinal follow‐up study. J Neurol 251: 935–942. [DOI] [PubMed] [Google Scholar]
- Li YO, Adali T, Calhoun VD ( 2007): Estimating the number of independent components for functional magnetic resonance imaging data. Hum Brain Mapp 28: 1251–1266. [DOI] [PMC free article] [PubMed] [Google Scholar]
- Monchi O, Petrides M, Petre V, Worsley K, Dagher A ( 2001): Wisconsin Card Sorting revisited: Distinct neural circuits participating in different stages of the task identified by event‐related functional magnetic resonance imaging. J Neurosci 21: 7733–7741. [DOI] [PMC free article] [PubMed] [Google Scholar]
- Montoya A, Pelletier M, Menear M, Duplessis E, Richer F, Lepage M ( 2006): Episodic memory impairment in Huntington's disease: A meta‐analysis. Neuropsychologia 44: 1984–1994. [DOI] [PubMed] [Google Scholar]
- Mottaghy FM, Willmes K, Horwitz B, Muller HW, Krause BJ, Sturm W ( 2006): Systems level modeling of a neuronal network subserving intrinsic alertness. Neuroimage 29: 225–233. [DOI] [PubMed] [Google Scholar]
- Muller SV, Jung A, Preinfalk J, Kolbe H, Ridao‐Alonso M, Dengler R, Munte TF ( 2002): Disturbance of “extrinsic alertness” in Huntington's disease. J Clin Exp Neuropsychol 24: 517–526. [DOI] [PubMed] [Google Scholar]
- Nehl C, Ready RE, Hamilton J, Paulsen JS ( 2001): Effects of depression on working memory in presymptomatic Huntington's disease. J Neuropsychiatry Clin Neurosci 13: 342–346. [DOI] [PubMed] [Google Scholar]
- Oldfield RC ( 1971): The assessment and analysis of handedness: The Edinburgh inventory. Neuropsychologia 9: 97–113. [DOI] [PubMed] [Google Scholar]
- Orth M, Schippling S, Schneider SA, Bhatia KP, Talelli P, Tabrizi SJ, Rothwell JC ( 2010): Abnormal motor cortex plasticity in premanifest and very early manifest Huntington disease. J Neurol Neurosurg Psychiatry 81: 267–270. [DOI] [PMC free article] [PubMed] [Google Scholar]
- Paulsen JS ( 2009): Functional imaging in Huntington's disease. Exp Neurol 216: 272–277. [DOI] [PMC free article] [PubMed] [Google Scholar]
- Paulsen JS, Magnotta VA, Mikos AE, Paulson HL, Penziner E, Andreasen NC, Nopoulos PC ( 2006): Brain structure in preclinical Huntington's disease. Biol Psychiatry 59: 57–63. [DOI] [PubMed] [Google Scholar]
- Paulsen JS, Langbehn DR, Stout JC, Aylward E, Ross CA, Nance M, Guttman M, Johnson S, MacDonald M, Beglinger LJ, et al. ( 2008): Detection of Huntington's disease decades before diagnosis: The Predict‐HD study. J Neurol Neurosurg Psychiatry 79: 874–880. [DOI] [PMC free article] [PubMed] [Google Scholar]
- Pavese N, Politis M, Tai YF, Barker RA, Tabrizi SJ, Mason SL, Brooks DJ, Piccini P ( 2010): Cortical dopamine dysfunction in symptomatic and premanifest Huntington's disease gene carriers. Neurobiol Dis 37: 356–361. [DOI] [PubMed] [Google Scholar]
- Perin B, Godefroy O, Fall S, de Marco G ( 2010): Alertness in young healthy subjects: An fMRI study of brain region interactivity enhanced by a warning signal. Brain Cogn 72: 271–281. [DOI] [PubMed] [Google Scholar]
- Posner MI ( 2008): Measuring alertness. Ann NY Acad Sci 1129: 193–199. [DOI] [PubMed] [Google Scholar]
- Posner MI, Petersen SE ( 1990): The attention system of the human brain. Annu Rev Neurosci 13: 25–42. [DOI] [PubMed] [Google Scholar]
- Reading SA, Dziorny AC, Peroutka LA, Schreiber M, Gourley LM, Yallapragada V, Rosenblatt A, Margolis RL, Pekar JJ, Pearlson GD, Aylward E, Brandt J, Bassett SS, Ross CA ( 2004): Functional brain changes in presymptomatic Huntington's disease. Ann Neurol 55: 879–883. [DOI] [PubMed] [Google Scholar]
- Robertson IH, Tegner R, Tham K, Lo A, Nimmo‐Smith I ( 1995): Sustained attention training for unilateral neglect: Theoretical and rehabilitation implications. J Clin Exp Neuropsychol 17: 416–430. [DOI] [PubMed] [Google Scholar]
- Rosas HD, Hevelone ND, Zaleta AK, Greve DN, Salat DH, Fischl B ( 2005): Regional cortical thinning in preclinical Huntington disease and its relationship to cognition. Neurology 65: 745–747. [DOI] [PubMed] [Google Scholar]
- Rupp J, Blekher T, Jackson J, Beristain X, Marshall J, Hui S, Wojcieszek J, Foroud T ( 2009): Progression in prediagnostic Huntington disease. J Neurol Neurosurg Psychiatry 81: 379–384. [DOI] [PMC free article] [PubMed] [Google Scholar]
- Sambataro F, Murty VP, Callicott JH, Tan HY, Das S, Weinberger DR, Mattay VS ( 2009): Age‐related alterations in default mode network: Impact on working memory performance. Neurobiol Aging 21: 1920–1933. [DOI] [PMC free article] [PubMed] [Google Scholar]
- Schippling S, Schneider SA, Bhatia KP, Munchau A, Rothwell JC, Tabrizi SJ, Orth M ( 2009): Abnormal motor cortex excitability in preclinical and very early Huntington's disease. Biol Psychiatry 65: 959–965. [DOI] [PMC free article] [PubMed] [Google Scholar]
- Snowden J, Craufurd D, Griffiths H, Thompson J, Neary D ( 2001): Longitudinal evaluation of cognitive disorder in Huntington's disease. J Int Neuropsychol Soc 7: 33–44. [DOI] [PubMed] [Google Scholar]
- Snowden JS, Craufurd D, Thompson J, Neary D ( 2002): Psychomotor, executive, and memory function in preclinical Huntington's disease. J Clin Exp Neuropsychol 24: 133–145. [DOI] [PubMed] [Google Scholar]
- Solomon AC, Stout JC, Weaver M, Queller S, Tomusk A, Whitlock KB, Hui SL, Marshall J, Jackson JG, Siemers ER, Beristain X, Wojcieszek J, Foroud T ( 2008): Ten‐year rate of longitudinal change in neurocognitive and motor function in prediagnosis Huntington disease. Mov Disord 23: 1830–1836. [DOI] [PMC free article] [PubMed] [Google Scholar]
- Sprengelmeyer R, Lange H, Homberg V ( 1995): The pattern of attentional deficits in Huntington's disease. Brain 118 ( Pt 1): 145–152. [DOI] [PubMed] [Google Scholar]
- Stout JC, Paulsen JS, Queller S, Solomon AC, Whitlock KB, Campbell JC, Carlozzi N, Duff K, Beglinger LJ, Langbehn DR, Johnson SA, Biglan KM, Aylward EH ( 2011): Neurocognitive signs in prodromal Huntington disease. Neuropsychology 25: 1–14. [DOI] [PMC free article] [PubMed] [Google Scholar]
- Sturm W, Willmes K ( 2001): On the functional neuroanatomy of intrinsic and phasic alertness. Neuroimage 14: S76–S84. [DOI] [PubMed] [Google Scholar]
- Stuss DT, Alexander MP, Shallice T, Picton TW, Binns MA, Macdonald R, Borowiec A, Katz DI ( 2005): Multiple frontal systems controlling response speed. Neuropsychologia 43: 396–417. [DOI] [PubMed] [Google Scholar]
- Tabrizi SJ, Langbehn DR, Leavitt BR, Roos RA, Durr A, Craufurd D, Kennard C, Hicks SL, Fox NC, Scahill RI, et al. ( 2009): Biological and clinical manifestations of Huntington's disease in the longitudinal TRACK‐HD study: Cross‐sectional analysis of baseline data. Lancet Neurol 8: 791–801. [DOI] [PMC free article] [PubMed] [Google Scholar]
- Talairach J, Tournoux P. (1988): Co‐Planar Stereotaxic Atlas of the Human Brain. New York, NY: Thieme Medical Publishers. [Google Scholar]
- Thiel CM, Fink GR ( 2007): Visual and auditory alertness: Modality‐specific and supramodal neural mechanisms and their modulation by nicotine. J Neurophysiol 97: 2758–2768. [DOI] [PubMed] [Google Scholar]
- Thiel CM, Zilles K, Fink GR ( 2004): Cerebral correlates of alerting, orienting and reorienting of visuospatial attention: An event‐related fMRI study. Neuroimage 21: 318–328. [DOI] [PubMed] [Google Scholar]
- Vallesi A, Mussoni A, Mondani M, Budai R, Skrap M, Shallice T ( 2007): The neural basis of temporal preparation: Insights from brain tumor patients. Neuropsychologia 45: 2755–2763. [DOI] [PubMed] [Google Scholar]
- van Schouwenburg MR, den Ouden HE, Cools R ( 2010): The human basal ganglia modulate frontal‐posterior connectivity during attention shifting. J Neurosci 30: 9910–9918. [DOI] [PMC free article] [PubMed] [Google Scholar]
- Verny C, Allain P, Prudean A, Malinge MC, Gohier B, Scherer C, Bonneau D, Dubas F, Le Gall D ( 2007): Cognitive changes in asymptomatic carriers of the Huntington disease mutation gene. Eur J Neurol 14: 1344–1350. [DOI] [PubMed] [Google Scholar]
- Vonsattel JP, Myers RH, Stevens TJ ( 1985): Neuropathological classification of Huntington's disease. J Neuropathol Exp Neurol 44: 559–577. [DOI] [PubMed] [Google Scholar]
- Wolf RC, Vasic N, Schonfeldt‐Lecuona C, Landwehrmeyer GB, Ecker D ( 2007): Dorsolateral prefrontal cortex dysfunction in presymptomatic Huntington's disease: Evidence from event‐related fMRI. Brain 130: 2845–2857. [DOI] [PubMed] [Google Scholar]
- Wolf RC, Sambataro F, Vasic N, Schonfeldt‐Lecuona C, Ecker D, Landwehrmeyer B ( 2008a): Aberrant connectivity of lateral prefrontal networks in presymptomatic Huntington's disease. Exp Neurol 213: 137–144. [DOI] [PubMed] [Google Scholar]
- Wolf RC, Sambataro F, Vasic N, Schonfeldt‐Lecuona C, Ecker D, Landwehrmeyer B ( 2008b): Altered frontostriatal coupling in pre‐manifest Huntington's disease: Effects of increasing cognitive load. Eur J Neurol 15: 1180–1190. [DOI] [PubMed] [Google Scholar]
- Zimbelman JL, Paulsen JS, Mikos AE, Reynolds NC, Hoffman RG, Rao SM ( 2007): fMRI detection of early neural dysfunction in preclinical Huntington's disease. J Int Neuropsychol Soc 13: 758–769. [DOI] [PubMed] [Google Scholar]
- Zimmermann P, Fimm B. ( 1994. Testbatterie zur Aufmerksamkeitsprüfung (TAP). Herzogenrath: Psytest. [Google Scholar]