

Abstract
The neuronal causes of individual differences in mental abilities such as intelligence are complex and profoundly important. Understanding these abilities has the potential to facilitate their enhancement. The purpose of this study was to identify the functional brain network characteristics and their relation to psychometric intelligence. In particular, we examined whether the functional network exhibits efficient small‐world network attributes (high clustering and short path length) and whether these small‐world network parameters are associated with intellectual performance. High‐density resting state electroencephalography (EEG) was recorded in 74 healthy subjects to analyze graph‐theoretical functional network characteristics at an intracortical level. Ravens advanced progressive matrices were used to assess intelligence. We found that the clustering coefficient and path length of the functional network are strongly related to intelligence. Thus, the more intelligent the subjects are the more the functional brain network resembles a small‐world network. We further identified the parietal cortex as a main hub of this resting state network as indicated by increased degree centrality that is associated with higher intelligence. Taken together, this is the first study that substantiates the neural efficiency hypothesis as well as the Parieto‐Frontal Integration Theory (P‐FIT) of intelligence in the context of functional brain network characteristics. These theories are currently the most established intelligence theories in neuroscience. Our findings revealed robust evidence of an efficiently organized resting state functional brain network for highly productive cognitions. Hum Brain Mapp, 2011. © 2011 Wiley‐Liss, Inc.
Keywords: small‐world network, intelligence, EEG, neuroscience
INTRODUCTION
The human brain is organized as a highly interconnected structural network [Herculano‐Houzel, 2009] that functionally links adjacent and distant brain areas. This functional coupling is present during the processing of cognitive tasks and it is even present during rest [Jann et al.,2010; Laufs,2008]. Recent studies have shown that the functional and anatomical connections of the brain network are organized in a highly efficient small‐world manner [Bullmore and Sporns,2009; Sporns and Kötter,2004; Stam,2004]. A small‐world organization of the brain network implies a high level of local neighborhood clustering (indexed by the clustering coefficient) combined with global efficiency of information transfer (indexed by the path length) [Bullmore and Sporns,2009]. Thus, the small‐world networks explain how the brain minimizes wiring costs while simultaneously maximizing the efficiency of information propagation [Achard and Bullmore,2007; Kaiser and Hilgetag,2006; Sporns et al.,2004]. It is unclear to date whether individual differences in cognitive functions such as intelligence are associated with differences in small‐world characteristics of functional brain networks. Although intelligence is one of the most influential factors characterizing individuals in decision‐making, job placement and education [Deary et al.,2010], the psychophysiological underpinnings of interindividual differences in intelligence are still hardly understood.
Most studies of human intelligence have been conducted in the context of two influential theories: the neural efficiency hypothesis of intelligence [Neubauer and Fink,2009] and the Parieto‐Frontal Integration Theory of intelligence (P‐FIT) [Jung and Haier,2007]. Studies supporting the neural efficiency hypothesis demonstrate that more intelligent subjects need less neural resources (primarily in frontal brain areas) to solve cognitive tasks [Neubauer and Fink,2009]. Most of the studies also fit to the P‐FIT of intelligence. This theory is mainly based on brain imaging data obtained with positron emission tomography (PET) or functional magnetic resonance imaging (fMRI), but also supported by structural findings derived from voxel‐based morphometry [Jung and Haier,2007]. The P‐FIT of intelligence emphasizes that there is no focused intelligence centre in the brain, but that intelligence emerges from a network comprising frontal and parietal brain areas. In this context, the parietal cortex is thought to generate symbols and abstract rules, while the prefrontal cortex tests hypotheses, elaborates solutions to given problems, and generates, selects and inhibits actions. Although the P‐FIT of intelligence suggests that variations in a distributed network exhibits the best prediction for individual differences, no neuroscientific investigation has examined the P‐FIT of intelligence in the context of EEG resting‐state network analyses.
To date, only three studies have related small‐world network features to psychometric intelligence. Two recent brain imaging studies (one using fMRI [van den Heuvel et al.,2009] and the other DTI [Li et al.,2009]) demonstrated associations between psychometric intelligence and a particular brain network topology organized according to a small‐world network. Since the characteristics of a network are not merely defined by its morphological properties (e.g., anatomical connections) and because communication in the brain is faster than the time resolution of seconds (as measured with fMRI), it is preferable to study brain network characteristics using high‐density EEG or magnetoencephalography (MEG) data. High‐density EEG and MEG have the advantages of capturing neurophysiological activations in the millisecond range and, in contrast to fMRI, do not rely on metabolic signals such as the blood oxygenation level dependent (BOLD) signal that is only indirectly related to neurophysiological activations. We therefore calculated small‐world properties of dynamic brain networks on the basis of high‐density EEG. EEG has only been used once to study small‐world characteristics in relation to intellectual abilities [Micheloyannis et al.,2006]. However, the findings of this study do not entirely fit with the results of the fMRI and DTI studies mentioned above. While the cause of this discrepancy is not yet clear, there are methodological issues of concern, such as the limited set of surface electrodes and unsolved problems with volume conductivity (see Method section). To circumvent these methodological issues, we readdressed the question whether psychometric intelligence is related to a functional resting network resembling a small‐world network architecture by using high‐density EEG in association with a valid method to estimate the intracortical sources of surface EEG standardized low resolution brain electromagnetic tomography (sLORETA) [Pascual‐Marqui,2002].
In this study, we focus on the so‐called resting EEG and its relation to psychometric intelligence, and on the upper alpha band as it has been repeatedly associated with intelligence [Angelakis et al.,2004; Doppelmayr et al.,2002; Jausovec and Jausovec,2000; Klimesch,1999; Thatcher et al.,2008]. Given that some studies also identified relationships between psychometric intelligence and other frequency bands (e.g., theta, beta, gamma) [Jausovec and Jausovec,2000; Klimesch,1999; Thatcher et al.,2007], we combined our hypotheses with a data driven approach. In order to not constrict the analysis to a particular frequency band, we first performed a scalp map analysis for the whole frequency spectrum. The power of the different frequency bands were computed for each subject and clusters of electrodes and correlated with the performance in the intelligence test. For the purpose of estimating the intracortical electrical sources, all topographical EEG frequency data were transformed in a second step into the intracortical space. Thus, we obtained for all frequency bands and each voxel a particular current density value correlated with psychometric intelligence. For those frequency bands that revealed significant correlations based on both the topographical analysis and the analysis in the intracortical space, additional graph‐theoretical analyses based on coherence were performed. The advantage of graph‐theoretical network analyses over the classical EEG analyses is that this analysis provides additional information about functional connectivity between different brain areas and electrodes, respectively. Thus graph‐theoretical network analyses are ideal to investigate the neural efficiency hypothesis and the P‐FIT of intelligence. On the basis of the evidence summarized above, we hypothesize that small‐world network characteristics (clustering coefficient, path length and degree) are correlated with psychometric intelligence, especially in parietal and frontal regions.
METHODS
Subjects
Seventy‐five healthy male students (mean/standard deviation: 25.5/4.86 years, range 19–43 years) participated in the study. All were right‐handed according to the Annett‐Handedness‐Questionnaire [Annett,1970] and native Swiss German speakers. They were screened to ensure that they had no history of neurological or psychiatric disorders, neuropsychological problems, or medication and drug abuse. One subject did not agree to conduct the Ravens Advanced Progressive Matrices (RAPM). The local ethics committee approved the study and all participants gave written informed consent to participate in the study.
Task
RAPM is a widely used to measure psychometric intelligence [Raven,2003] and was administered after the EEG recordings. The RAPM is a reasoning‐based intelligence test, which focuses on visual‐spatial abilities. In addition, working memory plays a crucial role in this task, particularly the executive control of attention to overcome distraction or interference. Gray and Thompson [2004] described that the performance RAPM best reflects the general factor of intelligence (g).
Procedure
Subjects were sitting comfortably in a chair in a dimly illuminated, sound‐shielded Faraday recording cage. Subjects were instructed that EEG recording is done while they rested with their eyes alternately open or closed. The EEG protocol consisted of the participants resting with their eyes open for 20 s, followed by 40 s with their eyes closed; this was repeated five times. Only data from the 200 s eyes closed condition were analyzed. After the recording of the resting EEG, subjects conducted the Raven Advanced Progressive Matrices (RAPM).
Electroencephalographical Recording
The high‐density EEG was recorded at a sampling rate of 250 Hz with a bandpass of 0.1 to 100 Hz with a 128‐channel EEG Geodesic Netamps system (Electrical Geodesics, Eugene, Oregon). Recording reference was at Cz (vertex of the head). Impedances were kept below 20 kOhm. Independent component analysis was used to remove eye‐movement artifacts from the EEG. In addition to the application of an automated artifact rejection procedure, data were visually inspected for noise like eye movements, eye blinks, sweating, and muscular artifacts. After artifact rejection the electrodes in the outermost circumference (chin and neck) as well as other artifact channels were excluded and interpolated to a standard 111‐channel electrode array [Perrin et al.,1987]. The artifact‐free EEG was recomputed against the average reference and segmented into 2 s epochs. In a second step, a discrete Fourier transformation algorithm was applied to the artifact‐free 2 s epochs (45 segments per subjects). The power spectrum of 1.5–49.5 Hz (resolution: 0.488 Hz) was calculated. The spectra for each channel were averaged over all epochs for each subject. Absolute power spectra were integrated for the following eight independent frequency bands following classification proposed by Kubicki et al. [1979]: delta (1.5–6 Hz), theta (6.5–8 Hz), alpha1 (8.5–10 Hz), alpha2 (10.5–12 Hz), beta1 (12.5–18Hz), beta2 (18.5–21 Hz), beta3 (21.5–30 Hz), and gamma (30–49.5). All the analyses applied in this study are summarized in a workflow (see Fig. 1).
Figure 1.
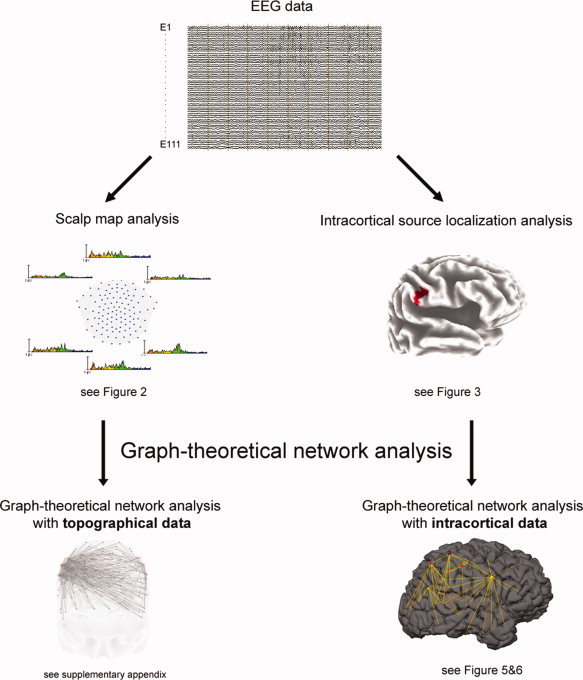
The workflow of all the analyses, which were implemented in this study are summarized as an overview.
Scalp Map Analysis
After the preprocessing steps, the data of 111 electrodes were collapsed into three anterior and three posterior electrode clusters: anterior (left, middle, right), posterior (left, middle, right). Partial regression analyses were calculated for each cluster and frequency band between EEG power and RAPM‐performance, after covarying out age effects. Statistical significance was assessed by means of a nonparametric randomization test [Fisher,1935; Nichols and Holmes,2002]. An error probability of P ≤ 0.05 (corrected for multiple comparisons) was used to indicate significant correlations.
Intracortical Source Localization Analysis
For the purpose of estimating the intracortical electrical sources standardized low resolution brain electromagnetic tomography (sLORETA, [Pascual‐Marqui,2002]) was used. sLORETA computes, from the recorded scalp electric potential differences, the three‐dimensional distribution of the electrically active neuronal generators in the brain as standardized units of current density (A/cm2) at each voxel by assuming similar activation among neighboring neuronal clusters [Pascual‐Marqui,2002]. In the current implementation of sLORETA, computations were made in a realistic head model [Fuchs et al.,2002] using the MNI152 template [Mazziotta et al.,2001] with the three‐dimensional solution space restricted to cortical gray matter as determined by the probabilistic Talairach atlas [Lancaster et al.,2000]. The standard electrode positions on the MNI152 scalp were taken from Jurcak et al. [2007] and Oostenveld and Pramstra [2001]. The intracerebral volume is partitioned in 6,239 voxels at 5 mm spatial resolution. Thus, sLORETA images represent the standardized electric activity at each voxel in Montreal Neurological Institute (MNI) stereotaxic space as the exact magnitude of the estimated current density. Anatomical labels are reported as Brodmannn areas transformed into MNI space [Brett et al.,2002]. sLORETA solves the inverse problem by taking into account the well‐known effects of the head as a volume conductor. Conventional LORETA and the more recent sLORETA analyses have been frequently used in previous experiments to localize brain activations on the basis of EEG or MEG data [Langer et al.,2010; Mulert et al.,2004; Zaehle et al.,2009].
Voxel‐wise partial correlations between current density and RAPM‐performance were calculated while controlling for age effects. Statistical significance was assessed by means of a nonparametric randomization test [Fisher,1935; Nichols and Holmes,2002]. An error probability of P ≤ 0.05 (corrected for multiple comparisons) was used to assess significant correlations between psychometric intelligence and the intracortical sources of activation.
Graph‐Theoretical Network Analysis
Background
To mathematically describe small‐world networks, graph‐theoretical analysis techniques are generally used [Bullmore and Sporns,2009], which are abstract representations of networks consisting of sets of vertices (nodes) linked by connections (edges). These graphs are characterized by specific measures: clustering coefficients and path lengths. In comparison with randomly organized networks, a relative high clustering coefficient and a similar path length characterize small‐world networks. Small‐world features of the human brain have been identified on the basis of functional and anatomical data [Eguíluz et al.,2005; Reijneveld et al.,2007; Stam,2004; Yu et al.,2008].
Measures of connectivity
In the context of this study, connectivity parameters at the level of brain‐topographic data (see Supporting Information Appendix) and for intracortical sources of brain oscillations were analyzed. In particular, the connectivity measure of linear instantaneous dependence (coherence) was used to calculate small‐world parameters. This measure was used in other studies before [De Vico Fallani et al.,2010; Pascual‐Marqui,2007b] and is deemed an adequate measure for computing resting state networks. Linear instantaneous connectivity is a function that operates in the frequency domain and generates a value between 0 and 1. Given two signals x and y, the linear instantaneous connectivity is calculated in a particular frequency f by taking the square of the cross‐spectrum
and the dividing by the product of the two corresponding auto power spectra:
For an extensive discussion on different measures of causal dependencies and their computation, please refer to Geweke [1982] and Pascual‐Marqui [2007b]. Compared with coherence calculations on the surface scalp, the intracortical analysis of coherence is less contaminated by non‐physiological influences due to volume conduction (for a discussion see reference [Pascual‐Marqui,2007b]). Several studies concluded that an intracortical approach represents a clear methodological improvement compared to analysis at surface electrodes [Babiloni et al.,2004; Lehmann et al.,2006; Mulert et al.,2004; Sinai and Pratt,2003]. Finally, conducting the analysis on the intracortical level made it possible to estimate coherence between any number of brain areas (i.e., distributed cortical networks) instead of being restricted to a given array of scalp electrodes [Pascual‐Marqui,2007a].
Construction of the connectivity matrix
On the basis of the stereotactic space provided by the Montreal neurological institute (MNI) template [Mazziotta et al.,2001], 42 anatomical regions of interest (ROI) in each hemisphere were defined according to Brodmann areas [Brodmann,1909]. With these 84 ROIs, the entire cortex was delineated into separate regions for which current densities were computed [Evans et al.,1993].
Within the sLORETA analysis framework, coherence between 84 anatomical regions of interest (ROI) in both hemispheres was computed. We chose to use the centroid voxels of each region of interest (ROI) instead of calculation of average coherence measures of each ROI, because sLORETA estimates the solution of the inverse problem based on the assumption that the smoothest of all possible activation distributions is the most plausible one. This assumption is supported by neurophysiological data demonstrating that neighboring neuronal populations show highly correlated activity. Because of this assumption of sLORETA, signals of spatially near voxels of neighboring ROIs are highly correlated inducing larger coherence, which might be not physiological in nature. By taking just the single center voxel of each ROI, we reduced such contamination. Because of the spatially smooth inverse solution of sLORETA, information of the centroid voxel is an accurate representative for activity within the ROIs.
The coherence was computed between all 84 ROIs. Since our preceding analyses only obtained significant correlations between the upper alpha power and psychometric intelligence using the surface EEG data, we calculated intracortical coherence for the upper alpha frequency band (10.5–12 Hz).
These intracortical coherence measures between the 84 ROIs were subjected to graph‐theoretical network analysis. The input for this analysis consisted of a 84 × 84 coherence‐matrix (84 ROIs) for each subject. An individual network is represented by the weighted connectivity matrix with nodes and edges, where nodes represent ROIs and edges represent the undirected weighted connections (coherence) between ROIs.
Defining the threshold for the small‐world network analysis
In a first step, the correlation threshold, which corresponds to a small‐world topology, was determined on the basis of the average network across all subjects. There is currently no definitive and generally accepted strategy for applying a particular threshold. According to previous small‐world network analyses [Li et al.,2009; Micheloyannis et al.,2009; Stam and Reijneveld,2007; Stam et al.,2007], the average network was, therefore, thresholded repeatedly over a wide range of correlation thresholds in increments of r = 0.05 from r = 0.65 to r = 0.95. The thus obtained thresholded average correlation matrices were then subjected to the network analysis software tnet [Opsahl,2009; Opsahl and Panzarasa,2009] to quantify small‐worldness [Bullmore and Sporns,2009; Watts and Strogatz,1998]. Small‐world indices were derived from the comparison of the real (measured) networks with 100 random networks comprising the same number of nodes, edges and degree distribution as the real network [Opsahl et al.,2008]. Based on the comparison of the real network indices with those of the random networks, key measures describing the overall architecture of the real network were computed. Key measures of a small‐world network are the clustering coefficient C, the characteristic path length L, and the degree distribution D [Watts and Strogatz,1998]. The clustering coefficient C is given by the ratio of the number of closed triplets to the total value of triplets and provides information about the level of local connectedness within a network. The characteristic path length L of a network gives the average number of connections that have to be crossed to travel from each node to every other node in the network and provides information about the level of global communication efficiency of a network [van den Heuvel et al.,2009]. For details about the calculation of the clustering coefficient and path length and their formula see Humphries et al. [2006] and Opsahl and Panzarasa [2009].
Small‐world organized networks are characterized by a clustering coefficient C that is higher than the C of a randomly organized network (C random), but still with a short characteristic path length L that is similar to that of an equivalent random network (L random) [Humphries and Gurney,2008; Humphries et al.,2006; Watts and Strogatz,1998]. Formally, small‐world networks show a ratio γ defined as C real/C random of >>1 and a ratio λ defined as L real/L random of ∼1 [Humphries and Gurney,2008; Sporns and Zwi,2004; Watts and Strogatz,1998]. A high γ reflects a high level of local neighborhood clustering within a network, and a short travel distance λ expresses a high level of global communication efficiency within a network [Bullmore and Sporns,2009; Sporns et al.,2004; Watts and Strogatz,1998].
In summary, the mean correlation matrix (averaged across all subjects) was thresholded with a set of different thresholds (range 0.55–0.95). In a second step, network parameters (clustering coefficient, path length, γ and λ) were calculated for the different thresholded mean coherence matrices. The particular threshold, which identified γ and λ of the mean correlation matrix (over all subjects) that best corresponds to a small‐world topology was chosen and applied to the correlation matrices of each individual subject. Subsequently, the correlation matrix of each subject was subjected to tnet software, which calculated the small‐world indices (clustering coefficient and path length) as described above.
Regional node analysis
Hub regions based on weighted degree centrality [Freeman,1978; Opsahl,2009] were evaluated in addition. Degree is a global centrality measure within a network and is often taken as the sum of weights and labeled node strength [Barrat et al.,2004; Newman,2004]. Therefore, every node exhibits its own degree centrality score. In addition, the betweenness centrality was analyzed. Betweenness centrality relies on the calculation of shortest distances in the network [Wasserman and Faust,1994]. Nodes that occur on many shortest paths (geodesics) between other nodes have higher betweenness centrality than those that do not. A node with high betweenness centrality is interpreted as a gatekeeper that is able to control the information flow through the node.
For statistical comparisons of the relationship between the small‐world indices (number of edges, clustering coefficient, path length), regional node index (degree centrality scores), and the performance in the RAPM, we used partial correlation analysis controlling for age. For these small‐world indices error probability was set to P < 0.05, corrected for multiple comparisons, through a modified Bonferroni method proposed by [Holm,1979; Shaffer,1995] that is more powerful than the traditional Bonferroni approach but maintains experiment wise error rate. For the regional node index, error probability was set to <0.05, uncorrected for multiple comparisons. Because of our strong a priori hypotheses, in particular the parieto‐frontal network, we did not use a correction for multiple comparisons for the regional node index.
RESULTS
Behavioral Results
Raw scores obtained for the Ravens Progressive Matrices (RAPM) ranged between 10 and 31, (mean = 22.2, standard deviation = 5.53). The RAPM scores correlated negatively with age (Pearson's r = −0.40; p = 0.001).
Scalp Map Analysis
Psychometric intelligence was positively correlated with upper alpha oscillations in the right posterior electrode cluster (r = 0.361, p = 0.014) after removing the effect of age. For further electrode clusters, upper alpha frequency revealed also high correlations, but did not reach statistical significance (see Fig. 2). The analysis of the clusters of all other frequency bands revealed no significant relationship with RAPM performance.
Figure 2.

The partial correlation analysis between the performance in the RAPM and the six electrode clusters of all frequency bands is displayed. The correlation coefficient is plotted on the y‐axis. The Fisher's permutation test revealed only significant relationship in the right posterior cluster of the upper alpha band (p < 0.05, corrected for multiple comparisons).
Intracortical Source Localization Analysis
After removing the effect of age, the intracortical source localization analysis of all frequency bands revealed a significantly positive correlation only between the upper alpha activity and the RAPM performance (r = 0.459, p = 0.0068, corrected for multiple comparison). The maximum of this significant correlation was localized in the right parietal cortex (Fig. 3). The partial correlations of all other frequency bands revealed no significant effects.
Figure 3.

After removing the effect of age, the intracortical source localization analysis (with Fisher's permutation test) revealed a positive significant correlation between upper alpha activity in the right parietal cortex and psychometric intelligence (p < 0.05, corrected for multiple comparisons). The significant cluster is displayed in red. The MNI‐coordinates of the local maximum are (X = 55, Y = −25, Z = 30).
Graph‐Theoretical Network Analysis
Across the whole range of relevant correlation thresholds, the threshold of r = 0.85 revealed the network that represents the best small‐world topology, which is defined by a high γ and a λ ≈1. This network (the average correlation matrix across all subjects) is composed of 84 nodes and 1,040 edges; connection density: 0.149. Table I and Figure 4 display all small‐world indices for the differently thresholded average matrices.
Table I.
The small‐world indices of the differently thresholded mean correlation‐matrices of the intracortical graph‐theoretical network analysis are displayed
| Threshold | 0.65 | 0.7 | 0.75 | 0.8 | 0.85 | 0.9 | 0.95 |
|---|---|---|---|---|---|---|---|
| Edges | 2,640 | 2,278 | 1,904 | 1,468 | 1,040 | 746 | 518 |
| Density | 0.379 | 0.327 | 0.273 | 0.211 | 0.149 | 0.107 | 0.074 |
| C | 0.71 | 0.678 | 0.647 | 0.621 | 0.581 | 0.571 | 0.545 |
| L | 1.751 | 1.893 | 1.385 | 1.595 | 2.665 | 3.686 | 4.161 |
| γ weighted | 1.244 | 1.302 | 1.392 | 1.601 | 2.585 | 3.255 | 3.475 |
| λ weighted | 1.118 | 1.148 | 1.175 | 1.267 | 1.268 | 1.644 | 1.796 |
Across the whole range of relevant correlation thresholds, the threshold of r = 0.85 (bold) elucidated the network, which represents the best small‐world network organization.
Figure 4.

The different clustering coefficients and path length of the differently thresholded mean‐weighted correlation matrices and the computed random correlation matrices of the intracortical graph‐theoretical network analysis are plotted in the two diagrams. The x‐axis shows the different correlation coefficient thresholds. On the y‐axis the values for the real and the random clustering coefficient and the path length respectively are displayed. [Color figure can be viewed in the online issue, which is available at wileyonlinelibrary.com.]
After applying this particular threshold (r = 0.85) to each subject, the small world indices (edges, clustering coefficient, path length and degree) were computed for each subject individually and partial correlations between the small‐world indices and the performance in the RAPM were calculated. The partial correlation analyses revealed positive correlations for the number of edges (r = 0.352, p = 0.004) and the clustering coefficients (r = 0.373, p = 0.002), while for the path length a negative relationship emerged (r = −0.305, p = 0.014). All correlations are summarized in Table II (for all the other frequency bands see Supporting Information Table S7).
Table II.
Listed are the correlations coefficients of the partial correlation analysis between the small‐world indices of the intracortical graph‐theoretical network analysis and the intelligence performance
| Edges | C | L | |
|---|---|---|---|
| r | 0.352 | 0.373 | −0.305 |
| p | 0.004 | 0.002 | 0.014 |
In addition, the p value whit the correlations are presented (p < 0.05, corrected for multiple comparisons).
Identification of hub regions
Hub regions were evaluated by weighted degree centrality and betweenness centrality (Supporting Information Table S8) measurements for the correlation threshold (network) that represents the best small‐world organization properties (r = 0.85). The partial correlation analysis between weighted degree centrality and intelligence revealed significant positive correlations primarily in the parietal cortex, anterior cingulate gyrus, and fusiform cortex. The higher the intelligence the higher was the degree centrality in these regions (see Fig. 5). Significant negative correlations of the RAPM with the intracortical organization of the hub regions were found primarily in the frontal cortex and posterior cingulate gyrus. The higher the intelligence the lower was the degree centrality in these regions (see Fig. 6). The exact positive and negative correlation coefficients are summarized in Supporting Information Table S1 and S2.
Figure 5.

The weighted degree centrality measurements of the intracortical graph‐theoretical network analysis, which were significant positively correlated with intelligence, are displayed depending on the magnitude of the correlation coefficient (dark red corresponds to the highest correlation). A significant degree of a node is defined by exceeding the significance threshold p < 0.05 (uncorrected for multiple comparisons). Furthermore, the connections of hub regions in which the hubs were positively correlated with the intelligence (p < 0.05) are presented as lines between the different nodes. The hub regions in the image are shown according to a glass brain to facilitate the view of the entire network. In addition a schematic visualization of the network is provided, which includes the significant Brodmann areas and their interaction with each other. The size of the Brodmann areas represents the magnitude of the correlation with the intelligence test performance.
Figure 6.

The weighted degree centrality measurements of the intracortical graph‐theoretical network analysis, which were significant negatively correlated with intelligence, are displayed depending on the magnitude of the correlation coefficient (dark red accords to the highest correlation). A significant degree of a node is defined by exceeding the significance threshold p < 0.05 (uncorrected for multiple comparisions). Furthermore, the connections of hub regions in which the hubs were positively correlated with the intelligence (p < 0.05) are presented as lines between the different nodes. The hub regions in the image are shown according to a glass brain to facilitate the view of the entire network. In addition, a schematic visualization of the network is provided, which includes the significant Brodmann areas and their interaction with each other. The size of the Brodmann areas represents the magnitude of the correlation with the RAPM.
DISCUSSION
This study sought to delineate the relationship between functional brain network characteristics on the basis of resting state EEG and psychometric intelligence. The intra‐individual stability of resting EEG measures has repeatedly been demonstrated [Ambrosius et al.,2008; Anokhin et al.,2006; Ivonin et al.,2004; Linkenkaer‐Hansen et al.,2007; Näpflin et al.,2007; Neuper et al.,2005; Orekhova et al.,2003; Posthuma et al.,2001; Smit et al.,2006; Tang et al.,2007; Vogel,2000]. For example, Näpflin et al. [2007] showed that the shape of alpha band power spectra is fairly stable across 12–40 months. Their reliability measures revealed a sensitivity of 88% and specificity 99.5% for classifying individual subjects by their resting EEG measures. Other studies using more conventional reliability measures report strong retest reliabilities for the alpha and beta band power ranging from r tt = 0.8 to r tt >0.9 [Kondacs and Szabó,1999]. Finally, on the basis of twin studies resting EEG measures have been demonstrated to be more similar in monozygotic twins than in dizygotic twins, thus resulting in high heritability scores for these measures [Ambrosius et al.,2008; Anokhin et al.,2006; Ivonin et al.,2004; Linkenkaer‐Hansen et al.,2007; Orekhova et al.,2003; Posthuma et al.,2001; Smit et al.,2006; Tang et al.,2007]. Thus, resting EEG can be taken as a stable biological marker for individual brain activity that can be related to cognitive performance. The resting state can be viewed as a kind of starting point from which subsequent cognitions are generated and monitored. Thus, a more efficient resting state (indexed by increased small‐worldness) would be beneficial for subsequent cognitions (see also reference [Klimesch,1999]). Our hypothesis was that more intelligent subjects rely on a functional resting state network that resembles more strongly a small‐world network than less intelligent subjects. In fact we identified a significant correlation between small‐worldness and psychometrically determined intelligence. Higher psychometric intelligence was associated with increased small‐world organization of the upper alpha band. In the following, we will first discuss why the upper alpha band is so important for our study. Subsequently, we will then relate our findings in the network analysis to published findings in the neurophysiological and psychological literature.
A data driven approach was used for the scalp map analysis in which power values were obtained for the different frequency bands and the different electrodes were correlated with intelligence. Using this approach, we identified only one significant “electrode cluster” correlating with psychometric intelligence. This cluster was located on the right posterior scalp. This correlation was obtained for the upper alpha band. In addition, our intracortical source localization analysis revealed a significant correlation between the current densities of the upper alpha band in the right parietal cortex and psychometric intelligence, suggesting that the upper alpha band is a strong predictor of intelligence. Because the scalp map and intracortical source localization analysis revealed only significant results in the upper alpha band, we focused the graph‐theoretical network analysis on the upper alpha band.
Alpha power emerges as a result of synchronous oscillations of synaptic potentials in large populations of neurons (mainly pyramidal cells) spread over the cortex [Michel et al.,2009]. Although the exact mechanisms of alpha rhythm generation and its functional meaning are not yet fully understood, there is mounting evidence that synchronized oscillatory activity in the cerebral cortex is essential for spatiotemporal information coordination and integration [Klimesch,1999; Singer and Gray,1995; Varela et al.,2001; Womelsdorf et al.,2007]. Several studies suggested that synchronized oscillatory activity in cell assemblies plays a key role in encoding, storage, and retrieval of information in the brain [Birbaumer et al.,1990; Lisman and Idiart,1995]. Moreover, alpha power correlates positively with indices of mental activity level, academic performance in high school students, performance on memory tasks, and with the performance in intelligence tests [Golubeva,1980; Klimesch,1999].
The main purpose of our study was to identify a functional network associated with intelligence. Therefore, we applied a graph‐theoretical network analysis using topographic EEG measures and intracortical current densities. Small‐world networks are attractive models for the description of complex brain networks because these networks explain how the brain minimizes wiring costs while simultaneously maximizing the efficiency of information propagation and therefore are ideal to test neural efficiency theory and P‐FIT intelligence [Achard and Bullmore,2007; Kaiser and Hilgetag,2006; Sporns et al.,2004]. Assuming that small‐world networks reflect an optimal balance between local processing specialization/integration and global information propagation, the longer paths combined with lower clustering in the networks of less intelligent subjects indicate a deviation of the normal balance and render their networks more similar to a regular (less efficient) network configuration. It has been suggested that regular configurations have reduced signal propagation speed and synchronizability compared with small‐world networks [Strogatz,2001]. A similar less efficient network architecture as found in this study for the less intelligent subjects (but to a lesser degree) was found in patients with Alzheimer's disease [de Haan et al.,2009; Stam et al.,2007], schizophrenia [Rubinov et al.,2009] and brain tumor [Bartolomei et al.,2006]. Thus, low performance in intelligence tests can be related to changes in small‐world network characteristics that might reflect a less optimal topological network organization. Using diffusion tensor imaging (DTI), Li et al. [2009] identified a similar relationship between small‐world network indices (derived from fiber tractography) and psychometrical intelligence as we found in the present study.
Closer inspection of the hubs and nodes of the identified network revealed four most prominent brain areas in this network: the parietal lobe, the fusiform gyrus, the cingulate gyrus, and the frontal cortex. The strongest positive correlations between degree centrality and intelligence were found bilaterally (more pronounced on the right hemisphere) in the parietal cortex (BA 5, 7, 39, 40). Thus, our a priori hypothesis with respect to the core role of the parietal cortex in monitoring intelligence was substantiated. The finding of the parietal cortex as a hub region in psychometric intelligence is in close correspondence with findings of other studies using fMRI or PET [Gray et al.,2003; Jung and Haier,2007]. In addition, Jung and Haier [2007] emphasized in their meta‐analysis that more than 80% of the included studies report activations within BA 7 in association with the performance in intelligence tests. The parietal cortex can thus be considered as a main hub region for controlling intelligence.
The fusiform gyrus (BA 37) is known as a processing centre for category specific perception [Martin et al.,1996], expert perception [Wong et al.,2009] or logical rule identification [Tachibana et al.,2009]. In addition, changes in grey and white matter in the parietal cortex and the fusiform gyrus were found in children with developmental dyscalculia compared to a control group [Rykhlevskaia et al.,2009]. The dominant left‐sided involvement of the fusiform gyrus identified in our study needs additional explanation. First, left‐sided activity in the fusiform gyrus has been identified as core activity related to intelligence in the meta‐analysis by Jung and Haier [2007]. In addition, the left‐sided fusiform gyrus is known to be involved in retrieval of words [Tsapkini and Rapp,2009] and in the imagination of perceiving objects [Ishai et al.,2000]. Thus, it is possible that solving intelligence tasks requires the application of imagination abilities. In the case of the intelligence test used in our study (RAPM), it is necessary to use mental imagery to determine whether a particular item fits into a particular pattern.
The third hub region was identified in the anterior cingulate gyrus (BA 24). This finding is in accordance with the finding of Haier et al. [2003] who found the strongest functional connectivity between BA 19, 37 and the cingulate gyrus differentiating between subjects with high and low intelligence. They interpreted their results as individual differences in the ability to resolve competition among incoming visual stimuli [Haier et al.,2003]. The key role pinpointed here is response selection and response inhibition, which are psychological functions known to be related to activity in the anterior cingulate cortex. Although none of the previous studies investigated this issue from the perspective of a distributed brain network and did not relate this activity to small‐world network characteristics, they nevertheless support our findings.
Negative correlations between degree centrality (local connectivity) and intelligence were found in the frontal cortex and the posterior cingulate gyrus. The frontal cortex has been associated with decision‐making, accommodation of novelty and planning complex cognitive behaviors, which could be summarized under the term executive function [Andersen and Cui,2009; Miller and Cohen,2001]. Most studies investigating intelligence found intelligence‐related activity in frontal brain areas (cf. reference Jung and Haier [2007] for an extensive review). According to the neural efficiency theory [Neubauer and Fink,2009], only specific brain areas such as the frontal regions demonstrate neural efficiency for intelligence, whereas other brain regions such as the parietal cortex show a positive association. Our results are exactly in line with these assumptions of the neural efficiency theory.
Further studies using graph‐theoretical analysis at an intracortical level could be improved by referring to the individual brain anatomy, which creates less uncertainty for inverse modeling than an average brain. In addition, one of the unsolved problems in connectivity analysis based on EEG data is the volume conduction, although to a lesser extent in the intracortical space than at sensor level, which could even be improved by using only the lagged coherence. We used the coherence measure, because the other valid connectivity measure, phase synchrony as used by Singer and Gray [1995], has not revealed any small world topology. Another issue in studying intelligence is the influence of age. We found a strong correlation between age and IQ and thus used age as a covariate to statistically eliminate age effects on the EEG data. However, the implicit assumption here is that age is linearly related to alpha2 activity; however, it might be that there are also non‐linear associations, which we did not detect in our analyses (Supporting Information Figs. S2, S3 and Table S6).
To our knowledge, this is the first study that investigated the relationship between psychometric intelligence and brain functional networks using intracortical current densities and graph‐theoretical network analysis. We showed that psychometric intelligence correlates with small‐word network properties of functional brain networks at the resting state. Increased performance in the intelligence test was associated (1) with a higher clustering coefficient reflecting increased local network efficiency and (2) with a shorter characteristic path length suggesting faster global information propagation. In other words, the more intelligent the subjects the more their functional network is organized according to a small‐world network. Our results corroborated the P‐FIT of intelligence [Jung and Haier,2007] and emphasized the important role of a distributed network including parietal and frontal areas. Our finding is also in line with the neural efficiency hypothesis since this theory also emphasizes a fronto‐parietal network that is important for intelligence [Neubauer and Fink,2009].
Supporting information
Additional Supporting Information may be found in the online version of this article.
Figure S1. The weighted degree centrality measurements of the topographical analysis, which were significantly and positively correlated with psychometric intelligence, are displayed as red dots. Furthermore, the connections of the significant degrees, which exhibit a significant correlation with the RAPM, are presented as grey lines between the nodes.
Figure S2. The correlation analysis (age‐uncorrected) between performance in the RAPM and the six electrode clusters of all frequency bands in the eyes open condition are displayed. The correlation coefficient is plotted on the y‐axis. The only significant relationship was found in the right posterior cluster of the upper alpha band.
Figure S3. Without removing the effect of age, the intracortical source localization analysis (with Fisher's permutation test) revealed a statistical trend towards a significant relationship between upper alpha activity and psychometric intelligence (p< 0.05, corrected for multiple comparisons). The cluster with the highest correlation (peak correlation was at 0.392) is displayed in red. X, Y, Z are the MNI‐coordinates of the local maximum.
Table S1. All hub regions of the intracortical graph‐theoretical network analysis and their Brodmann area label are listed. The significant positive correlation coefficients between their degree centrality measurements and the performance in the RAPM are in bold numbers highlighted.
Table S2 All hub regions of the intracortical graph‐theoretical network analysis and their Brodmann area label are listed. The significant negative correlation coefficients between their degree centrality measurements and the performance in the RAPM are in bold numbers highlighted.
Table S3. Listed are the small‐world indices of the differently thresholded mean correlation matrix of the topographical analysis. Across the whole range of relevant correlation thresholds, the threshold of r = 0.35 (bold) elucidated the network, which represents the best small‐world network organization.
Table S4. Presented are the correlations coefficients of the partial correlation analysis between the small‐world indices of the topographical analysis and the intelligence performance. In addition the p value if the correlations are listed. Cw = clustering coefficient; CL = path length.
Table S5. All hub regions of the topographical analysis and the X, Y, Z coordinates in the MNI‐space of the electrodes are listed. The significant positive correlation coefficients between their degree centrality measurements and the performance in the RAPM are in bold numbers highlighted.
Table S6. Listed are the correlations coefficients of the age‐uncorrected correlation analysis between the small‐world indices (C = Clustering Coefficient; L = path length) of the intracortical graph‐theoretical network analysis and the intelligence performance. In addition, the p value whit the correlations are presented (p< 0.05, corrected for multiple comparisons).
Table S7. Listed are the correlation coefficients of the partial correlation analysis between the small‐world indices of the intracortical graph‐theoretical network analysis and the intelligence performance for all further frequency bands (not upper alpha). The p‐values associated with the correlation coefficients are also presented. There were no significant correlations.
Table S8. Listed are the results of the betweenness centrality analysis. Betweenness centrality relies on the calculation of shortest distances in the network. Nodes that occur on many shortest paths (geodesics) between other nodes have higher betweenness centrality than those that do not. A node with high betweenness centrality is interpreted as a gatekeeper that is able to control the information flow through the node. For the alpha2 frequency bands, all nodes of the intracortical graph‐theoretical network analysis, which revealed significantly positive or negative correlation between betweenness centraliy and intelligence, are listed with their Brodmann area label and the correlation coefficients (p<0.05, uncorrected for multiple comparisons).
REFERENCES
- Achard S, Bullmore E ( 2007): Efficiency and cost of economical brain functional networks. PLoS Comput Biol 3: e17. [DOI] [PMC free article] [PubMed] [Google Scholar]
- Ambrosius U, Lietzenmaier S, Wehrle R, Wichniak A, Kalus S, Winkelmann J, Bettecken T, Holsboer F, Yassouridis A, Friess E ( 2008): Heritability of sleep electroencephalogram. Biol Psychiatry 64: 344–348. [DOI] [PubMed] [Google Scholar]
- Andersen RA, Cui H ( 2009): Intention, action planning, and decision making in parietal‐frontal circuits. Neuron 63: 568–583. [DOI] [PubMed] [Google Scholar]
- Angelakis E, Lubar JF, Stathopoulou S ( 2004): Electroencephalographic peak alpha frequency correlates of cognitive traits. Neurosci Lett 371: 60–63. [DOI] [PubMed] [Google Scholar]
- Annett M ( 1970): A classification of hand preference by association analysis. Br J Psychol 61: 303–321. [DOI] [PubMed] [Google Scholar]
- Anokhin AP, Müller V, Lindenberger U, Heath AC, Myers E ( 2006): Genetic influences on dynamic complexity of brain oscillations. Neurosci Lett 397: 93–98. [DOI] [PMC free article] [PubMed] [Google Scholar]
- Babiloni C, Binetti G, Cassetta E, Cerboneschi D, Dal Forno G, Del Percio C, Ferreri F, Ferri R, Lanuzza B, Miniussi C, Moretti DV, Nobili F, Pascual‐Marqui RD, Rodriguez G, Romani GL, Salinari S, Tecchio F, Vitali P, Zanetti O, Zappasodi F, Rossini PM ( 2004): Mapping distributed sources of cortical rhythms in mild Alzheimer's disease. A multicentric EEG study. Neuroimage 22: 57–67. [DOI] [PubMed] [Google Scholar]
- Barrat A, Barthelemy M, Pastor‐Satorras R, Vespignani A ( 2004): The architecture of complex weighted networks. Proc Natl Acad Sci USA 101: 3747–3752. [DOI] [PMC free article] [PubMed] [Google Scholar]
- Bartolomei F, Bosma I, Klein M, Baayen JC, Reijneveld JC, Postma TJ, Heimans JJ, van Dijk BW, de Munck JC, de Jongh A, Cover KS, Stam CJ ( 2006): Disturbed functional connectivity in brain tumour patients: Evaluation by graph analysis of synchronization matrices. Clin Neurophysiol 117: 2039–2049. [DOI] [PubMed] [Google Scholar]
- Birbaumer N, Elbert T, Canavan AG, Rockstroh B ( 1990): Slow potentials of the cerebral cortex and behavior. Physiol Rev 70: 1–41. [DOI] [PubMed] [Google Scholar]
- Brett M, Johnsrude IS, Owen AM ( 2002): The problem of functional localization in the human brain. Nat Rev Neurosci 3: 243–249. [DOI] [PubMed] [Google Scholar]
- Brodmann K. ( 1909). Vergleichende Lokalisationslehre der Grosshirnrinde in ihren Prinzipien dargestellt auf Grund des Zellenbaues. Leipzig: Barth. [Google Scholar]
- Bullmore E, Sporns O ( 2009): Complex brain networks: Graph theoretical analysis of structural and functional systems. Nat Rev Neurosci 10: 186–198. [DOI] [PubMed] [Google Scholar]
- de Haan W, Pijnenburg YA, Strijers RL, van der Made Y, van der Flier WM, Scheltens P, Stam CJ ( 2009): Functional neural network analysis in frontotemporal dementia and Alzheimer's disease using EEG and graph theory. BMC Neurosci 10: 101. [DOI] [PMC free article] [PubMed] [Google Scholar]
- De Vico Fallani F, Maglione A, Babiloni F, Mattia D, Astolfi L, Vecchiato G, De Rinaldis A, Salinari S, Pachou E, Micheloyannis S ( 2010): Cortical network analysis in patients affected by schizophrenia. Brain Topogr 23: 214–220. [DOI] [PubMed] [Google Scholar]
- Deary IJ, Penke L, Johnson W ( 2010): The neuroscience of human intelligence differences. Nat Rev Neurosci 11: 201–211. [DOI] [PubMed] [Google Scholar]
- Doppelmayr M, Klimesch W, Stadler W, Pöllhuber D, Heine C ( 2002): EEG alpha power and intelligence. Intelligence 30: 289–302. [Google Scholar]
- Eguíluz VM, Chialvo DR, Cecchi GA, Baliki M ( 2005): Apkarian AVScale‐free brain functional networks. Phys Rev Lett 94: 018102. [DOI] [PubMed] [Google Scholar]
- Evans AC, Collins DL, Mills SR, Brwon ED, Kelly RL, Peters TM ( 1993): 3d statistical neuroanatomical models from 305 MRI volumes In: Processings IEEE Nuclear Science Symposium and Medical Imaging Conference. San Francisco, CA: pp 1813–1817. [Google Scholar]
- Fisher RA ( 1935). The Design of Experiment. New York: Hafner. [Google Scholar]
- Freeman LC ( 1978): Centrality in social networks: Conceptual clarification. Soc Netw 1: 215–239. [Google Scholar]
- Fuchs M, Kastner J, Wagner M, Hawes S, Ebersole JS ( 2002): A standardized boundary element method volume conductor model. Clin Neurophysiol 113: 702–712. [DOI] [PubMed] [Google Scholar]
- Geweke J ( 1982): Measurement of linear‐dependence and feedback between multiple time‐series. J Am Stat Assoc 77: 304–313. [Google Scholar]
- Golubeva EA ( 1980): Individual Characteristics of Human Memory: A Psychophysiological Study. Pedagogika, Moscow. [Google Scholar]
- Gray JR, Thompson PM ( 2004): Neurobiology of intelligence: Science and ethics. Nat Rev Neurosci 5: 471–482. [DOI] [PubMed] [Google Scholar]
- Gray JR, Chabris CF, Braver TS ( 2003): Neural mechanisms of general fluid intelligence. Nat Neurosci 6: 316–322. [DOI] [PubMed] [Google Scholar]
- Haier RJ, White NS, Alkire MT ( 2003): Individual differences in general intelligence correlate with brain function during nonreasoning tasks. Intelligence 31: 429–441. [Google Scholar]
- Herculano‐Houzel S ( 2009): The human brain in numbers: A linearly scaled‐up primate brain. Front Hum Neurosci 3: 31. [DOI] [PMC free article] [PubMed] [Google Scholar]
- Holm S ( 1979): A simple sequentially rejective multiple test procedure. Scand J Stat 6: 65–70. [Google Scholar]
- Humphries MD, Gurney K ( 2008): Network ‘small‐world‐ness’: A quantitative method for determining canonical network equivalence. PLoS One 3: e0002051. [DOI] [PMC free article] [PubMed] [Google Scholar]
- Humphries MD, Gurney K, Prescott TJ ( 2006): The brainstem reticular formation is a small‐world, not scale‐free, network. Proc Biol Sci 273: 503–511. [DOI] [PMC free article] [PubMed] [Google Scholar]
- Ishai A, Ungerleider LG, Haxby JV ( 2000): Distributed neural systems for the generation of visual images. Neuron 28: 979–990. [DOI] [PubMed] [Google Scholar]
- Ivonin AA, Tsitseroshin MN, Pogosyan AA, Shuvaev VT ( 2004): Genetic determination of neurophysiological mechanisms of cortical‐subcortical integration of bioelectrical brain activity. Neurosci Behav Physiol 34: 369–378. [DOI] [PubMed] [Google Scholar]
- Jann K, Koenig T, Dierks T, Boesch C, Federspiel A ( 2010): Association of individual resting state EEG alpha frequency and cerebral blood flow. Neuroimage 51: 365–372. [DOI] [PubMed] [Google Scholar]
- Jausovec N, Jausovec K ( 2000): Differences in resting EEG related to ability. Brain Topogr 12: 229–240. [DOI] [PubMed] [Google Scholar]
- Jung RE, Haier RJ ( 2007): The Parieto‐Frontal Integration Theory (P‐FIT) of intelligence: Converging neuroimaging evidence. Behav Brain Sci 30: 135–154; discussion 154–187. [DOI] [PubMed] [Google Scholar]
- Jurcak V, Tsuzuki D, Dan I ( 2007): 10/20, 10/10, and 10/5 systems revisited: Their validity as relative head‐surface‐based positioning systems. Neuroimage 34: 1600–1611. [DOI] [PubMed] [Google Scholar]
- Kaiser M, Hilgetag CC ( 2006): Nonoptimal component placement, but short processing paths, due to long‐distance projections in neural systems. PLoS Comput Biol 2: e95. [DOI] [PMC free article] [PubMed] [Google Scholar]
- Klimesch W ( 1999): EEG alpha and theta oscillations reflect cognitive and memory performance: A review and analysis. Brain Res Brain Res Rev 29: 169–195. [DOI] [PubMed] [Google Scholar]
- Kondacs A, Szabó M ( 1999): Long‐term intra‐individual variability of the background EEG in normals. Clin Neurophysiol 110: 1708–1716. [DOI] [PubMed] [Google Scholar]
- Kubicki S, Herrmann WM, Fichte K, Freund G ( 1979): Reflections on the topics: EEG frequency bands and regulation of vigilance. Pharmakopsychiatr Neuropsychopharmakol 12: 237–245. [DOI] [PubMed] [Google Scholar]
- Lancaster JL, Woldorff MG, Parsons LM, Liotti M, Freitas ES, Rainey L, Kochunov PV, Nickerson D, Mikiten SA, Fox PT ( 2000): Automated Talairach Atlas labels for functional brain mapping. Hum Brain Mapp 10: 120–131. [DOI] [PMC free article] [PubMed] [Google Scholar]
- Langer N, Beeli G, Jancke L ( 2010): When the sun prickles your nose: An EEG study identifying neural bases of photic sneezing. PLoS One 5: e9208. [DOI] [PMC free article] [PubMed] [Google Scholar]
- Laufs H ( 2008): Endogenous brain oscillations and related networks detected by surface EEG‐combined fMRI. Hum Brain Mapp 29: 762–769. [DOI] [PMC free article] [PubMed] [Google Scholar]
- Lehmann D, Faber PL, Gianotti LR, Kochi K, Pascual‐Marqui RD ( 2006): Coherence and phase locking in the scalp EEG and between LORETA model sources, and microstates as putative mechanisms of brain temporo‐spatial functional organization. J Physiol Paris 99: 29–36. [DOI] [PubMed] [Google Scholar]
- Li Y, Liu Y, Li J, Qin W, Li K, Yu C, Jiang T ( 2009): Brain anatomical network and intelligence. PLoS Comput Biol 5: e1000395. [DOI] [PMC free article] [PubMed] [Google Scholar]
- Linkenkaer‐Hansen K, Smit DJ, Barkil A, van Beijsterveldt TE, Brussaard AB, Boomsma DI, van Ooyen A, de Geus EJ ( 2007): Genetic contributions to long‐range temporal correlations in ongoing oscillations. J Neurosci 27: 13882–13889. [DOI] [PMC free article] [PubMed] [Google Scholar]
- Lisman JE, Idiart MA ( 1995): Storage of 7 +/− 2 short‐term memories in oscillatory subcycles. Science 267: 1512–1515. [DOI] [PubMed] [Google Scholar]
- Martin A, Wiggs CL, Ungerleider LG, Haxby JV ( 1996): Neural correlates of category‐specific knowledge. Nature 379: 649–652. [DOI] [PubMed] [Google Scholar]
- Mazziotta J, Toga A, Evans A, Fox P, Lancaster J, Zilles K, Woods R, Paus T, Simpson G, Pike B, Holmes C, Collins L, Thompson P, MacDonald D, Iacoboni M, Schormann T, Amunts K, Palomero‐Gallagher N, Geyer S, Parsons L, Narr K, Kabani N, Le Goualher G, Boomsma D, Cannon T, Kawashima R, Mazoyer B ( 2001): A probabilistic atlas and reference system for the human brain: International Consortium for Brain Mapping (ICBM). Philos Trans R Soc B Biol Sci 356: 1293–1322. [DOI] [PMC free article] [PubMed] [Google Scholar]
- Michel CM, Koenig T, Brandeis D, Gianotti LR, Wackermann J ( 2009). Electrical Neuroimaging. Cambridge: Cambridge University Press. [Google Scholar]
- Micheloyannis S, Pachou E, Stam CJ, Vourkas M, Erimaki S, Tsirka V ( 2006): Using graph theoretical analysis of multi channel EEG to evaluate the neural efficiency hypothesis. Neurosci Lett 402: 273–277. [DOI] [PubMed] [Google Scholar]
- Micheloyannis S, Vourkas M, Tsirka V, Karakonstantaki E, Kanatsouli K, Stam CJ ( 2009): The influence of ageing on complex brain networks: A graph theoretical analysis. Hum Brain Mapp 30: 200–208. [DOI] [PMC free article] [PubMed] [Google Scholar]
- Miller EK, Cohen JD ( 2001): An integrative theory of prefrontal cortex function. Annu Rev Neurosci 24: 167–202. [DOI] [PubMed] [Google Scholar]
- Mulert C, Jager L, Schmitt R, Bussfeld P, Pogarell O, Moller HJ, Juckel G, Hegerl U ( 2004): Integration of fMRI and simultaneous EEG: Towards a comprehensive understanding of localization and time‐course of brain activity in target detection. Neuroimage 22: 83–94. [DOI] [PubMed] [Google Scholar]
- Näpflin M, Wildi M, Sarnthein J ( 2007): Test‐retest reliability of resting EEG spectra validates a statistical signature of persons. Clin Neurophysiol 118: 2519–2524. [DOI] [PubMed] [Google Scholar]
- Neubauer AC, Fink A ( 2009): Intelligence and neural efficiency. Neurosci Biobehav Rev 33: 1004–1023. [DOI] [PubMed] [Google Scholar]
- Neuper C, Grabner RH, Fink A, Neubauer AC ( 2005): Long‐term stability and consistency of EEG event‐related (de‐)synchronization across different cognitive tasks. Clin Neurophysiol 116: 1681–1694. [DOI] [PubMed] [Google Scholar]
- Newman ME ( 2004): Analysis of weighted networks. Phys Rev E Stat Nonlin Soft Matter Phys 70( 5 Part 2): 056131. [DOI] [PubMed] [Google Scholar]
- Nichols TE, Holmes AP ( 2002): Nonparametric permutation tests for functional neuroimaging: A primer with examples. Hum Brain Mapp 15: 1–25. [DOI] [PMC free article] [PubMed] [Google Scholar]
- Oostenveld R, Praamstra P ( 2001): The five percent electrode system for high‐resolution EEG and ERP measurements. Clin Neurophysiol 112: 713–719. [DOI] [PubMed] [Google Scholar]
- Opsahl T ( 2009): Structure and Evolution of Weighted Networks. London: University of London (Queen Mary College). [Google Scholar]
- Opsahl T, Panzarasa P ( 2009): Clustering in weighted networks. Soc Netw 31: 155–163. [Google Scholar]
- Opsahl T, Colizza V, Panzarasa P, Ramasco JJ ( 2008): Prominence and control: The weighted rich‐club effect. Phys Rev Lett 101:168702. [DOI] [PubMed] [Google Scholar]
- Orekhova EV, Stroganova TA, Posikera IN, Malykh SB ( 2003): Heritability and “environmentability” of electroencephalogram in infants: The twin study. Psychophysiology 40: 727–741. [DOI] [PubMed] [Google Scholar]
- Pascual‐Marqui RD ( 2002): Standardized low‐resolution brain electromagnetic tomography (sLORETA): Technical details. Methods Find Exp Clin Pharmacol 24 ( Suppl D): 5–12. [PubMed] [Google Scholar]
- Pascual‐Marqui RD ( 2007a): Discrete, 3D distributed, linear imaging methods of electrical neuronal activity. Part 1: Exact, zero error localization. arXiv:0710.3341 [math‐ph].
- Pascual‐Marqui RD ( 2007b): Instantaneous and lagged measurements of linear and nonlinear dependence between groups of multivariate times series: Frequency decomposition. arXiv: 0711.1455[stat.ME].
- Perrin F, Pernier J, Bertrand O, Giard MH, Echallier JF ( 1987): Mapping of scalp potentials by surface spline interpolation. Electroencephalogr Clin Neurophysiol 66: 75–81. [DOI] [PubMed] [Google Scholar]
- Posthuma D, Neale MC, Boomsma DI, de Geus EJ ( 2001): Are smarter brains running faster? Heritability of alpha peak frequency, IQ, and their interrelation. Behav Genet 31: 567–579. [DOI] [PubMed] [Google Scholar]
- Raven J, Raven JC, Court JH ( 2003): Manual for Raven's Progressive Matrices and Vocabulary Scales. Section 1: General Overview. San Antonia: Harcourt Assessment. [Google Scholar]
- Reijneveld JC, Ponten SC, Berendse HW, Stam CJ ( 2007): The application of graph theoretical analysis to complex networks in the brain. Clin Neurophysiol 118: 2317–2331. [DOI] [PubMed] [Google Scholar]
- Rubinov M, Knock SA, Stam CJ, Micheloyannis S, Harris AW, Williams LM, Breakspear M ( 2009): Small‐world properties of nonlinear brain activity in schizophrenia. Hum Brain Mapp 30: 403–416. [DOI] [PMC free article] [PubMed] [Google Scholar]
- Rykhlevskaia E, Uddin LQ, Kondos L, Menon V ( 2009): Neuroanatomical correlates of developmental dyscalculia: Combined evidence from morphometry and tractography. Front Hum Neurosci 3: 51. [DOI] [PMC free article] [PubMed] [Google Scholar]
- Shaffer JP ( 1995): Mutiple hypothesis testing. Annu Rev Psychol 46: 561–584. [Google Scholar]
- Sinai A, Pratt H ( 2003): High‐resolution time course of hemispheric dominance revealed by low‐resolution electromagnetic tomography. Clin Neurophysiol 114: 1181–1188. [DOI] [PubMed] [Google Scholar]
- Singer W, Gray CM ( 1995): Visual feature integration and the temporal correlation hypothesis. Annu Rev Neurosci 18: 555–586. [DOI] [PubMed] [Google Scholar]
- Smit CM, Wright MJ, Hansell NK, Geffen GM, Martin NG ( 2006): Genetic variation of individual alpha frequency (IAF) and alpha power in a large adolescent twin sample. Int J Psychophysiol 61: 235–243. [DOI] [PubMed] [Google Scholar]
- Sporns O, Kötter R ( 2004): Motifs in brain networks. PLoS Biol 2: e369. [DOI] [PMC free article] [PubMed] [Google Scholar]
- Sporns O, Zwi JD ( 2004): The small world of the cerebral cortex. Neuroinformatics 2: 145–162. [DOI] [PubMed] [Google Scholar]
- Sporns O, Chialvo DR, Kaiser M, Hilgetag CC ( 2004): Organization, development and function of complex brain networks. Trends Cogn Sci 8: 418–425. [DOI] [PubMed] [Google Scholar]
- Stam CJ ( 2004): Functional connectivity patterns of human magnetoencephalographic recordings: A ‘small‐world’ network? Neurosci Lett 355: 25–28. [DOI] [PubMed] [Google Scholar]
- Stam CJ, Reijneveld JC ( 2007): Graph theoretical analysis of complex networks in the brain. Nonlinear Biomed Phys 1: 3. [DOI] [PMC free article] [PubMed] [Google Scholar]
- Stam CJ, Jones BF, Nolte G, Breakspear M, Scheltens P ( 2007): Small‐world networks and functional connectivity in Alzheimer's disease. Cereb Cortex 17: 92–99. [DOI] [PubMed] [Google Scholar]
- Strogatz SH ( 2001): Exploring complex networks. Nature 410: 268–276. [DOI] [PubMed] [Google Scholar]
- Tachibana K, Suzuki K, Mori E, Miura N, Kawashima R, Horie K, Sato S, Tanji J, Mushiake H ( 2009): Neural activity in the human brain signals logical rule identification. J Neurophysiol 102: 1526–1537. [DOI] [PubMed] [Google Scholar]
- Tang Y, Chorlian DB, Rangaswamy M, Porjesz B, Bauer L, Kuperman S, O'Connor S, Rohrbaugh J, Schuckit M, Stimus A, Begleiter H ( 2007): Genetic influences on bipolar EEG power spectra. Int J Psychophysiol 65: 2–9. [DOI] [PubMed] [Google Scholar]
- Thatcher RW, North D, Biver C ( 2007): Intelligence and EEG current density using low‐resolution electromagnetic tomography (LORETA). Hum Brain Mapp 28: 118–33. [DOI] [PMC free article] [PubMed] [Google Scholar]
- Thatcher RW, North DM, Biver CJ ( 2008): Intelligence and EEG phase reset: A two compartmental model of phase shift and lock. Neuroimage 42: 1639–1653. [DOI] [PubMed] [Google Scholar]
- Tsapkini K, Rapp B ( 2009): The orthography‐specific functions of the left fusiform gyrus: Evidence of modality and category specificity. Cortex 46:185–205. [DOI] [PMC free article] [PubMed] [Google Scholar]
- van den Heuvel MP, Stam CJ, Kahn RS, Hulshoff Pol HE ( 2009): Efficiency of functional brain networks and intellectual performance. J Neurosci 29: 7619–7624. [DOI] [PMC free article] [PubMed] [Google Scholar]
- Varela F, Lachaux JP, Rodriguez E, Martinerie J ( 2001): The brainweb: Phase synchronization and large‐scale integration. Nat Rev Neurosci 2: 229–239. [DOI] [PubMed] [Google Scholar]
- Vogel F ( 2000): Genetics and the Electroencephalogram. Berlin: Springer. [Google Scholar]
- Wasserman S, Faust K ( 1994). Social Network Analysis. Cambridge, MA: Cambridge University Press. [Google Scholar]
- Watts DJ, Strogatz SH ( 1998): Collective dynamics of ‘small‐world’ networks. Nature 393: 440–442. [DOI] [PubMed] [Google Scholar]
- Womelsdorf T, Schoffelen JM, Oostenveld R, Singer W, Desimone R, Engel AK, Fries P ( 2007): Modulation of neuronal interactions through neuronal synchronization. Science 316: 1609–1612. [DOI] [PubMed] [Google Scholar]
- Wong ACN, Palmeri TJ, Rogers BP, Gore JC, Gauthier I ( 2009): Beyond shape: How you learn about objects affects how they are represented in visual cortex. PLoS One 4: e8405. [DOI] [PMC free article] [PubMed] [Google Scholar]
- Yu S, Huang D, Singer W, Nikolic D ( 2008): A small world of neuronal synchrony. Cereb Cortex 18: 2891–2901. [DOI] [PMC free article] [PubMed] [Google Scholar]
- Zaehle T, Frund I, Schadow J, Tharig S, Schoenfeld MA, Herrmann CS ( 2009): Inter‐ and intra‐individual covariations of hemodynamic and oscillatory gamma responses in the human cortex. Front Hum Neurosci 3: 8. [DOI] [PMC free article] [PubMed] [Google Scholar]
Associated Data
This section collects any data citations, data availability statements, or supplementary materials included in this article.
Supplementary Materials
Additional Supporting Information may be found in the online version of this article.
Figure S1. The weighted degree centrality measurements of the topographical analysis, which were significantly and positively correlated with psychometric intelligence, are displayed as red dots. Furthermore, the connections of the significant degrees, which exhibit a significant correlation with the RAPM, are presented as grey lines between the nodes.
Figure S2. The correlation analysis (age‐uncorrected) between performance in the RAPM and the six electrode clusters of all frequency bands in the eyes open condition are displayed. The correlation coefficient is plotted on the y‐axis. The only significant relationship was found in the right posterior cluster of the upper alpha band.
Figure S3. Without removing the effect of age, the intracortical source localization analysis (with Fisher's permutation test) revealed a statistical trend towards a significant relationship between upper alpha activity and psychometric intelligence (p< 0.05, corrected for multiple comparisons). The cluster with the highest correlation (peak correlation was at 0.392) is displayed in red. X, Y, Z are the MNI‐coordinates of the local maximum.
Table S1. All hub regions of the intracortical graph‐theoretical network analysis and their Brodmann area label are listed. The significant positive correlation coefficients between their degree centrality measurements and the performance in the RAPM are in bold numbers highlighted.
Table S2 All hub regions of the intracortical graph‐theoretical network analysis and their Brodmann area label are listed. The significant negative correlation coefficients between their degree centrality measurements and the performance in the RAPM are in bold numbers highlighted.
Table S3. Listed are the small‐world indices of the differently thresholded mean correlation matrix of the topographical analysis. Across the whole range of relevant correlation thresholds, the threshold of r = 0.35 (bold) elucidated the network, which represents the best small‐world network organization.
Table S4. Presented are the correlations coefficients of the partial correlation analysis between the small‐world indices of the topographical analysis and the intelligence performance. In addition the p value if the correlations are listed. Cw = clustering coefficient; CL = path length.
Table S5. All hub regions of the topographical analysis and the X, Y, Z coordinates in the MNI‐space of the electrodes are listed. The significant positive correlation coefficients between their degree centrality measurements and the performance in the RAPM are in bold numbers highlighted.
Table S6. Listed are the correlations coefficients of the age‐uncorrected correlation analysis between the small‐world indices (C = Clustering Coefficient; L = path length) of the intracortical graph‐theoretical network analysis and the intelligence performance. In addition, the p value whit the correlations are presented (p< 0.05, corrected for multiple comparisons).
Table S7. Listed are the correlation coefficients of the partial correlation analysis between the small‐world indices of the intracortical graph‐theoretical network analysis and the intelligence performance for all further frequency bands (not upper alpha). The p‐values associated with the correlation coefficients are also presented. There were no significant correlations.
Table S8. Listed are the results of the betweenness centrality analysis. Betweenness centrality relies on the calculation of shortest distances in the network. Nodes that occur on many shortest paths (geodesics) between other nodes have higher betweenness centrality than those that do not. A node with high betweenness centrality is interpreted as a gatekeeper that is able to control the information flow through the node. For the alpha2 frequency bands, all nodes of the intracortical graph‐theoretical network analysis, which revealed significantly positive or negative correlation between betweenness centraliy and intelligence, are listed with their Brodmann area label and the correlation coefficients (p<0.05, uncorrected for multiple comparisons).