

Abstract
The neurophysiological underpinnings of functional magnetic resonance imaging (fMRI) are not well understood. To understand the relationship between the fMRI blood oxygen level dependent (BOLD) signal and neurophysiology across large areas of cortex, we compared task related BOLD change during simple finger movement to brain surface electric potentials measured on a similar spatial scale using electrocorticography (ECoG). We found that spectral power increases in high frequencies (65–95 Hz), which have been related to local neuronal activity, colocalized with spatially focal BOLD peaks on primary sensorimotor areas. Independent of high frequencies, decreases in low frequency rhythms (<30 Hz), thought to reflect an aspect of cortical‐subcortical interaction, colocalized with weaker BOLD signal increase. A spatial regression analysis showed that there was a direct correlation between the amplitude of the task induced BOLD change on different areas of primary sensorimotor cortex and the amplitude of the high frequency change. Low frequency change explained an additional, different part of the spatial BOLD variance. Together, these spectral power changes explained a significant 36% of the spatial variance in the BOLD signal change (R 2 = 0.36). These results suggest that BOLD signal change is largely induced by two separate neurophysiological mechanisms, one being spatially focal neuronal processing and the other spatially distributed low frequency rhythms. Hum Brain Mapp, 2011. © 2011 Wiley‐Liss, Inc.
Keywords: fMRI, ECoG, neurophysiology, motor cortex, sensorimotor rhythms
INTRODUCTION
Functional magnetic resonance imaging (fMRI) is a widely used tool to investigate human brain function. In both clinical and research settings, statistical maps of the blood oxygen level dependent (BOLD) change that fMRI measures are used to localize function to specific brain regions in individual subjects. How these maps of fMRI activation represent underlying neuronal processing remains unclear [Lauritzen, 2005; Logothetis, 2008].
Previous studies investigating the relationship between BOLD signal change and neurophysiology have adopted the strategy of selecting a small patch of cortex in a functionally relevant area, and then tracking both BOLD signal change and electrophysiological change over time [Logothetis et al., 2001; Mukamel et al., 2005; Niessing et al., 2005]. These studies have shown that in one area of cortex BOLD change is best related to high frequency power changes in the local field potential. Although these studies provide compelling evidence for a relationship, they describe only part of the picture relating BOLD change to neuronal physiology. First, BOLD signal change may be present in the absence of electrophysiological change [Sirotin and Das, 2009]. Previous studies, which preselected functional patches of cortex, may be biased to capture only a particular aspect of the BOLD‐neurophysiology relationship, while missing others. Second, since the shape of the heamodynamic response function differs across areas of cortex [Miezin et al., 2000], different cortical regions may exhibit different relationships between population‐scale neurophysiology and metabolic demand reflected in the BOLD signal. Third, individual subject behaviorally induced BOLD activity maps typically display large BOLD signal changes in primary areas known to be related to that behavior, as well as more variable, weaker, signal changes in surrounding and other regions [Rombouts et al., 1997; Saad et al., 2003]. Because previous studies focused on the BOLD peaks, it is unclear whether the BOLD change in these surrounding areas has a neurophysiological correlate. Fourth, BOLD changes correlate with synaptic processing reflected in local field potentials (LFPs) [Lauritzen, 2005; Logothetis 2008] and in addition to high frequency power changes in the LFP behavior is also associated with power changes in low frequency oscillations in the LFP [Maier et al., 2008; Murthy and Fetz, 1996]. High frequency power change thus may not reflect the complete neurophysiology related to BOLD change.
We examined the relationship between BOLD and neurophysiology without selecting a region based on activation. If the modalities are indeed closely tied, one should find changes in both modalities in some regions, and absence of both in other regions. In addition to the presence or absence of behavior‐associated change, the magnitude of change should also be correlated between modalities. This requires measuring at multiple patches of cortex. Electrocorticographic (ECoG) recordings allow for electrophysiological measurements sampled at multiple points across large areas of cortical surface.
Previous ECoG studies have investigated the spatial distribution of spectral power changes. They have shown that broadband power increases, revealed at high frequencies, are typically local, on areas primarily involved in the task [Crone et al., 1998a; Miller et al., 2009b], and these high frequency changes correspond well to sites found with electrocortical stimulation of language and motor regions [Leuthardt et al., 2007; Sinai et al., 2005]. Power decreases in low frequency sensorimotor rhythms are distributed over larger areas of cortex [Crone et al., 1998b; Miller et al., 2007]. These spectral changes are associated with different processes: broadband power change is associated with local neuronal processing [Manning et al., 2009; Miller et al., 2009a], whereas low frequency oscillations reflect an aspect of subcortical‐cortical interaction [Brown, 2003; Feige et al., 2005; Pfurtscheller and Lopes da Silva, 1999; Schnitzler et al., 2006]. Functional MRI BOLD change has also been compared with electrocortial stimulation mapping, and has been shown to be adequately sensitive but less specific in predicting electrocortical stimulation sites [Pouratian et al., 2002; Rutten et al., 2002]. In motor cortex fMRI has been shown to identify a distributed response for the whole hand, with on top of that a highly localized response for individual fingers [Kleinschmidt et al., 1997]. Functional MRI thus seems to have distributed and localized components, similar to spectral power changes. In this study, we utilized this feature by directly correlating the spatial distributions of BOLD and spectral power change.
To examine the relationship between these different types of physiology and the BOLD signal, 8 patients performed a simple finger movement task first during fMRI, and repeated this task during ECoG recordings after implantation of electrode arrays for clinical purposes. For each patient, about 70 ECoG electrodes were placed in rectilinear arrays covering almost half of one hemisphere at a time. This provided us with the opportunity to measure neuronal populations over distributed cortical sites. Individual electrodes were spaced at a centimeter distance from one another and each electrode sampled from a cortical surface of several millimeters, which translates to the volume of a typical fMRI voxel. Maps of electrocortical activity could thus be compared to surface renderings of fMRI activity maps across the full range of behavior‐associated activation. We found that the magnitude of focal BOLD change in primary sensorimotor areas was parametrically related to the change in high frequency power. Spectral change in low frequency sensorimotor rhythms explained additional variance of BOLD change in a more distributed fashion.
MATERIALS AND METHODS
Participants and Procedure
Eight patients (3 females, Supporting Information Table I) scheduled for the implantation of ECoG arrays (AdTech, Racine, WI) for epilepsy monitoring gave written informed consent to participate in this study. The study was approved by the ethical committee of the University Medical Center Utrecht, in accordance with the Declaration of Helsinki 2008. During a preoperative fMRI session and during ECoG recordings these patients performed the same hand movement task that consisted of 30 second movement blocks (visually cued thumb/finger flexion at the rate of 2 Hz) alternated with 30 second blocks of rest (see Fig. 1) for 4.5–5.5 min.
Figure 1.

Experimental setting. (A) Participants performed a blocked motor task with 30 second periods of rest (when a red cue was presented at 2 Hz) interleaved with 30 second periods of thumb/finger movement (when a green cue was presented at 2 Hz). (B) Representative image of the preimplantation fMRI results showing a statistical t‐map of BOLD change during movement compared to rest. fMRI results were rendered on the cortical surface with a search depth of up to 8 mm below the cortical surface and are clearly visible on pre and post central gyri. For visualization, these maps were smoothed as shown in the middle panel. On the right panel, the estimated percentage of BOLD signal change per electrode is shown. (C) From the ECoG, electric potential power spectra were calculated for each electrode. Power spectra are shown for two electrodes on pre central (I) and post central (II) gyri that showed significant increases during movement in the high frequency band (HFB) from 65–95 Hz. During movement there were power decreases in low frequency bands (α, β1 and β2) and a broadband increase in the HFB. At 50 Hz the ambient “line” noise peak is visible. On the rendering, electrodes in green showed significant (P < 0.05, Bonferroni corrected over electrodes) HFB power increases.
Magnetic Resonance Measurement
Preoperatively, fMRI scans were acquired on a Philips ACS‐NT 1.5T or Achieva 3T scanner with a PRESTO [Neggers et al., 2008; Ramsey et al., 1998] sequence (1.5T: 340 scans, TR/TE 24.02/37 ms, flip angle 9.5°, FOV = 256 × 96 × 192 mm, acquisition voxel size 4 mm isotropic, 3T: 442 scans TR/TE 22.5/33.2 ms, flip angle 10 degrees, FOV = 256 × 224 × 160 mm, acquisition voxel size 4 mm isotropic). Functional images were realigned and coregistered using normalized mutual information [Maes et al., 1997] with an anatomical scan using SPM5 (http://www.fil.ion.ucl.ac.uk/spm/). The anatomical image was segmented in gray and white matter with unified segmentation [Ashburner and Friston, 2005].
fMRI Analysis
Statistical analyses were performed on a single subject basis and therefore no smoothing was applied. A GLM was estimated with one regressor for hand movement activation (a 30s box car for movement blocks convolved with a standard hemodynamic response function, see Fig. S1), data were corrected for low frequency drifts by a 128 second high pass filter and corrected for serial correlations with a first order AR model.
Electrocorticographic Measurement
Arrays of ECoG electrodes were implanted subdurally for localization of seizure foci during the course of treatment for epilepsy. These platinum electrodes had an interelectrode spacing of 1 cm and a measurement surface of 2.3 mm in diameter. Electrodes were localized from a CT and projected to the cortical surface of each patient [Hermes et al., 2010]. ECoG data were acquired with a 128 channel recording system (Micromed, Treviso, Italy) with 512 Hz sampling rate and 0.15–134.4 Hz band‐pass filter.
ECoG Analysis
Signals were rereferenced to the common average of all intracranial electrodes and two second epochs were extracted from movement and rest blocks. Electrodes and epochs that showed large epileptic artifacts were rejected (on average two electrodes per patient were rejected prior to common average referencing). Electrodes in grids that were mostly on frontal, parietal, and occipital lobes were selected for further analysis (Supporting Information Fig. S3) resulting in 67 (range 47–81) electrodes on average per subject. For each epoch, the power spectral density was calculated every 1 Hz by Welch's method (Welch, 1967] with 200 ms windows and a Hamming window to attenuate edge effects.
Since the center frequency for α and β bands can differ between subjects, subject‐specific α and β bands were defined as the peaks in the power spectrum from the rest period as follows (see also Supporting Information Fig. S2). A power law (constant·f −χ) was fit to the power spectrum from the rest period for each electrode and the power was normalized (by element‐wise division at each frequency) with respect to this power law [Miller et al., 2009a]. Peaks in the normalized power spectrum, i.e., where the first derivative was 0, were detected for each electrode. These peaks were convolved with a small Gaussian and the average over these peaks was calculated. The center frequency (f) for each low frequency rhythm was defined as the largest peak of the average Gaussians with α: 5 ≤ f ≤ 13 Hz, β1: 13 < f ≤ 24 Hz and β2: 24 < f < 30 Hz. Low frequency rhythms were detected in classic sensorimotor α and β1 bands (5 ≤ α ≤ 13 Hz, 13 < β1 ≤ 24 Hz) and a β2 rhythm (24 < β2 < 30 Hz) was found in 7 out of 8 subjects (β2 rhythms have previously been shown in layer V of somatosensory cortex [Roopun et al., 2006]).
Spectral power changes for movement compared with rest periods in low frequency bands and in a high frequency band (HFB, 65–95 Hz) were then calculated. The power spectra of each epoch were normalized (by element‐wise division) with respect to the mean power over all epochs at each frequency and the log was taken. The log normalized power was then averaged for α, β1 and β2 bands (center frequency f ± 2 Hz) and for HFB from 65–95 Hz. A t‐test was performed to test whether differences between rest and movement periods were significant, and results are reported at P < 0.05, Bonferroni corrected for the number of electrodes. The signal change from rest to movement periods was calculated by the difference in log normalized power between movement and rest blocks and divided by the standard deviation across all epochs to control for possible differences in variance between different frequency bands (Supporting Information Fig. S1).
Spatial Alignment of ECoG and fMRI
For each ECoG electrode, the magnitude of the BOLD signal change for movement compared to rest was estimated by taking the parameter estimates from the GLM and correcting these for the amplitude of the regressor, which results in the percentage of BOLD signal change with respect to the global mean. To correct for the 1 cm spacing in between electrodes, the estimated percentage of BOLD signal change was averaged across gray matter voxels in an 8 mm radius of an electrode (Fig. 1B, right panel, Supporting Information Fig. S1). This way the fMRI data directly underneath the surface of the grids were optimally matched to the electrodes. Functional MRI results are displayed on the rendered cortical surface as t‐maps, which were generated by testing the GLM hand movement parameter estimates for statistical significance. Figure 1B (left panel) shows an example of these fMRI t‐maps rendered on the cortical surface. For visualization of the overlap between fMRI and ECoG the fMRI t‐maps were smoothed with cosine kernel of 6 mm radius (Fig. 1B, middle panel).
fMRI versus ECoG
It was tested whether the magnitude of the BOLD signal change correlated spatially with the magnitude of the spectral power change in HFB. For each electrode, the BOLD signal change and spectral power change were calculated as described above. For each subject, a linear regression model (Y = XB + ε) was fitted, where Y is a vector with the percentage of BOLD signal change for each electrode and X the design matrix containing a regressor with spectral power changes in HFB for each electrode and an intercept. The degrees of freedom were given by the number of electrodes entered into the analysis (47–81 per subject). This model was tested for significance in each individual subject by an F‐test. To test whether across subjects there was a significant correlation between BOLD and spectral change, it was tested whether the regression coefficients (B) differed significantly from 0 by a t‐test. As an indication of the overlap between BOLD and ECoG, we calculated the percentage of BOLD variance that the model explained (R 2).
To check whether the correlation would not be due to the fact that both BOLD changes and high frequency power changes both peak in the hand sensorimotor area, we looked more specifically at the correlation between HFB and BOLD change within this area. Electrodes over the primary sensorimotor hand area were selected by manual delineation of the hand region on precentral gyri and postcentral gyri. The anterior and posterior borders consisted of the precentral and postcentral sulci; ventral and dorsal borders were drawn where clinical stimulation data indicated the start of mouth and leg areas. This resulted in on average 11 electrodes per subject, range 4–27 electrodes. The regression analysis was then reapplied to this subset of electrodes.
To test whether low frequency bands explained additional variance in the BOLD signal change independently of HFB change the explained variance was calculated (R 2) and adjusted for the number of regressors R = 1−(n−1)/(n−k−1)*(1−R 2) where n denotes the sample size (number of electrodes) and k the number of regressors. In a stepwise regression procedure, regressors for low frequency power changes were each added to the model and it was tested whether across subjects there was a significant increase in the explained variance (ΔR ) by a permutation test (factorial 8 iterations).
RESULTS
fMRI, ECoG, and Basic Overlap
Figure 2 illustrates the fMRI and ECoG results for three subjects (Fig. 2A) and across subjects (Fig. 2B) (all individual results are shown in Supporting Information Fig. S3). Functional MRI results showed that with movement, sensorimotor areas on precentral and postcentral gyri showed BOLD signal increases across all subjects. On a subject‐by‐subject basis, there are small‐and‐variable outlying BOLD signal increases that are very heterogeneous across subjects. The ECoG results showed that with movement, there was a significant (P < 0.05, Bonferroni corrected) power increase in the HFB. These power increases were spatially focal and mostly confined to primary sensorimotor hand areas, as identified by electrocortical stimulation (on average 90% of significant HFB increases were located on a site where electrocortical stimulation between this electrode and one other site elicited hand movement or sensory sensation, shown in Supporting Information Fig. S4). The power in the low frequency ranges (5 ≤ α ≤ 13, 13 < β1 ≤ 24, and 24 < β2 < 30 Hz bands that were defined from the peaks in the power spectrum during rest), decreased significantly with movement, but over larger spatial areas. These areas included, but were less confined to, primary sensorimotor areas (on average 67, 79, and 73% of significant decreases in respectively α, β1, and β2 bands were located on a site where electrocortical stimulation elicited hand movement). The fact that low frequency changes were spatially more distributed does not seem to be due to a different contrast to noise ratio (Supporting Information Fig. S5).
Figure 2.

Visualization of overlap between brain‐surface fMRI results and electric potential change in different frequency bands. (A) For three representative subjects: rendering with smoothed fMRI results mapped on the surface (the t‐values for movement versus rest scaled to the maximum, smoothed with a 6 mm cosine kernel for display). Green denotes significant (P < 0.05, Bonferroni corrected) increase in power in HFB, and cyan significant (P < 0.05, Bonferroni corrected) decrease in power in low frequency bands. The panels on the right show the estimated percentage of BOLD signal change per electrode. (B) Group results: for visualization, electrode coordinates were projected to right hemisphere MNI coordinates and displayed on the normalized averaged gray matter across all subjects. Note that power decreases in low frequencies are spatially more distributed than HFB power increases. On the far right the BOLD change for all electrodes is depicted (only for visualization, the estimated percentage of BOLD signal change is normalized with respect to the standard deviation of each subject to eliminate large inter individual differences in the amplitude of the BOLD change and better visualize the overall distribution).
Figure 2A shows that fMRI activity spatially overlaps with significant power increases in HFB and power decreases in lower frequencies (α, β1, β2 bands, shown for all individual subjects in S3). As shown in Figure 3, the BOLD increase was significantly larger underneath electrodes with significant HFB power increases as compared with sites underneath electrodes with no significant spectral power changes (paired t‐test, P < 0.05). Surprisingly, the BOLD change underneath electrodes with α and β1 power decreases was also significantly larger when compared with electrodes with no significant spectral power changes, even after excluding electrodes with significant HFB increases (P < 0.05, by paired t‐tests). Sites underneath electrodes with a power decrease in the β2 band showed only a trend in BOLD increase (paired t‐test, P = 0.06). The BOLD signal change was largest underneath electrodes with HFB power increases (P < 0.05, by paired t‐tests).
Figure 3.

Estimated percentage of BOLD signal change underneath electrodes with significant HFB increases (green), for electrodes with no significant spectral power change (black) and for low frequency power decreases before (cyan) and after (cyan with black) controlling for overlap with HFB by exclusion of electrodes with significant HFB increases. [Color figure can be viewed in the online issue, which is available at wileyonlinelibrary.com.]
fMRI Versus ECoG: Correlation Between BOLD and HFB
To test whether the amplitude of BOLD signal change over different areas of cortex corresponds to different levels of neuronal change, a multiple regression analysis was used to predict the BOLD signal change by spectral power change. For each electrode i, the percentage of BOLD signal change (y i) and spectral power change in HFB (x i = [x HFBi]) was calculated and entered in the regression model (Y = XB+ε) for each subject individually, see Figure 4A for an example of the relation between predicted BOLD and BOLD change across electrodes for subject 1. An F‐test showed that this regression model was significant in seven of eight subjects (see Supporting Information Table S3 for individual results). Regression coefficients were significantly positive across subjects (t = 2.80, P < 0.05, Fig. 4A), indicating that across areas of cortex BOLD change correlated positively with HFB change. On average 23% of the BOLD change was explained by the HFB change.
Figure 4.
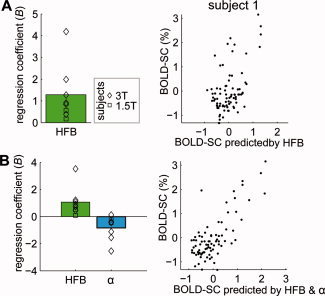
Relationship between BOLD signal change and spectral power change. (A) Regression coefficients (B) from the regression model Y = XB+ε where X = [XHFB] for each subject show that power change in HFB correlated positively with BOLD signal change. For one subject, the relation between the BOLD change predicted by the model and the actual BOLD change is shown. (B) Regression coefficients (B) from the model Y = XB+ε where X = [XHFB X α] show that power change in HFB correlated positively with BOLD signal change, while spectral changes in the α band correlated negatively. For one subjects the relation between the BOLD change predicted by the model and the actual BOLD change is shown. Note the better fit compared to (A) where the model only includes XHFB. [Color figure can be viewed in the online issue, which is available at wileyonlinelibrary.com.]
To check whether this correlation was not due to the fact that both BOLD change and high frequency power change both peak in the hand sensorimotor area, we looked more specifically at the correlation between HFB and BOLD change within this area. If the amplitude of the BOLD change is directly correlated with the magnitude of change in underlying neuronal activity, we expect that also within this area there is a tight correlation between the amplitudes of the two modalities. We thus restricted the analysis to the anatomically defined hand region on pre and post central gyri (Fig. 5A). A regression analysis restricted to these electrodes showed that the magnitude of local BOLD signal change indeed correlated with power increases in HFB during the motor movement task (Fig. 5C). Figure 5B shows that regression coefficients for HFB were significantly larger than zero across subjects (t = 4.21, P < 0.01), indicating that there is a positive correlation between HFB and BOLD signal change. The HFB explained on average 46% of the variance in the BOLD signal change (R 2 = 0.46). For individual analyses this regression model was significant in four of the eight subjects and one subject showed a trend (see also Supporting Information Table S3 for statistics in all individual subjects). In the other three subjects (S3, S6, and S8) the maximum estimated BOLD signal change was smaller than in the other five (Fig. 5C). Two of these differed from all others in that they were scanned at a lower magnetic field strength (1.5T), which can result in a smaller magnitude of BOLD signal change [Logothetis 2008; Ogawa et al., 1998]. In addition, subjects S6 and S8 had limited electrode coverage of precentral gyri and postcentral gyri (4 electrodes), reducing statistical power of the regression model.
Figure 5.

Relationship between BOLD signal change and spectral power change restricted to hand sensorimotor areas. (A) The rendering displays the spatial distribution of electrodes restricted to primary sensorimotor hand areas across all subjects. (B) Regression coefficients (B) from the regression model Y = XB+ε where X = [XHFB] for electrodes show that local BOLD signal change correlated positively with power change in HFB. (C) For all subjects the relation between the BOLD change predicted by the model and the actual BOLD change is shown. Note that the maximum BOLD signal change was larger in subjects 1, 2, 4, 5, and 7 (y axis). Specifically in these cases the correlation between BOLD signal change and HFB power changes was significant or showed a trend and a fitted regression line is shown. Subjects 3 and 6 were scanned on the 1.5T scanner, while all others were scanned on the 3T scanner. [Color figure can be viewed in the online issue, which is available at wileyonlinelibrary.com.]
fMRI Versus ECoG: Do Low Frequency Rhythms Explain Additional Variance in BOLD?
To test whether low frequency rhythms explained additional variance in BOLD change, we added these to the regression model of all electrodes (thus fitting the model Y = XB+ε, where X = [X HFB X α], X = [XHFB X β1] or X = [XHFB X β2]). Adding spectral changes in the α band significantly increased the explained variance in the BOLD signal change by 13% (ΔR 2 = 0.13, P < 0.05 by permutation test), and for the β1 band there was a marginal trend (ΔR 2 = 0.12, P = 0.06). The β2 band was not significant (ΔR 2 = 0.10, P = 0.12) and will not be considered in further analyses. Figure 4B shows for subject 1 that the BOLD change predicted by a model including α and HFB change results in a better fit between the predicted and actual BOLD change compared to a model with only HFB (Fig. 4A). Regression coefficients (B) indicated that spectral power changes in the α band were significantly negatively correlated with BOLD change (t = −2.71, P < 0.05), for the β1 band there was a negative trend (t = −2.23, P = 0.06), whereas HFB change correlated positively in both cases. Both high and low frequency power changes thus correlate with BOLD signal change and explain different parts of the variance in BOLD signal change. Together, HFB and α or HFB and β1 explained on average a total of 36% of BOLD variance.
To get an idea of how spectral power changes in α and β1 rhythms influence BOLD changes, we further investigated in which brain areas they explained most variance in the BOLD signal change. It is possible that if there are large power changes in these low frequency rhythms, there is a peak in BOLD on a primary sensorimotor area, similar to HFB change. We therefore restricted the analysis again analysis to the anatomically defined hand region on pre and postcentral gyri and added the low frequency bands to the regression model of HFB and BOLD. A stepwise regression showed that adding low frequency bands to this model did not significantly increase the explained variance in local BOLD signal change across subjects (α: P = 0.79, β1: P = 0.24 by a permutation test). In other words, in primary sensorimotor areas, the α and β1 rhythms do not add information in predicting movement‐related changes in BOLD signal change as compared to using the HFB alone. Supporting Information Figure S6 shows that for electrodes in nonprimary hand areas, low frequency power changes in α and β1 bands explained most of the variance in the BOLD signal change. We did not further explore differences between α and β1 bands, since power changes were highly correlated (see Supporting Information Fig. S7).
DISCUSSION
We conducted a study comparing spatial maps of fMRI BOLD signal changes to spectral power changes in the measured ECoG potential. Both modalities were carefully coregistered to allow for direct comparison [Hermes et al., 2010]. A simple motor task was employed and the two modalities were compared in terms of cortical surface distribution and magnitude of signal change. High frequency power increases correlated with focal BOLD peaks on primary sensorimotor areas. We found that low frequency power decreases explain a different part of the BOLD signal change. The results indicate that 36% of the total variance in the BOLD signal change (both magnitude and distribution) could be explained by a combination of low (< 30 Hz) and high (65–95 Hz) frequency ECoG changes.
We found that high frequency power increases correlated with focal BOLD peaks on primary sensorimotor areas (Fig. 4B). Increases in HFB change were focused on primary sensorimotor electrodes during movement (Figs. 1, 2, and 5), consistent with previous studies [Crone et al., 1998a; Leuthardt et al., 2007; Miller et al., 2007; Miller et al., 2009b]. This high frequency spectral power change has been shown to correlate directly with firing rate [Manning et al., 2009; Miller et al., 2009a; Whittingstall and Logothetis, 2009], and has been demonstrated to reflect broad‐spectral change across all frequencies [Miller et al., 2007; Miller et al., 2009b]. Previous studies examined the relationship between spectral power change and BOLD change within a specific region [Logothetis et al., 2001; Maier et al., 2008; Mukamel et al., 2005; Niessing et al., 2005]. We extend this relationship found at the neuronal population volumes sampled by microelectrodes [<500 μm (Katzner et al., 2009)] to a widespread network of movement‐related regions on the cortical surface. By comparing ECoG and fMRI BOLD signal change during performance of the same task at the same functionally relevant cortical sites, we demonstrate a direct spatial correlation between the magnitudes of fMRI BOLD and electrophysiologic change. This finding suggests that magnitude of BOLD response is linked to magnitude in the electrophysiological response but such a direct relationship needs to be confirmed with a parametric paradigm (e.g., multiple levels of movement rate or of force).
Interestingly, in addition to high frequency power increases, a significant 13% of BOLD signal change was explained by power decreases in low frequency rhythms. The additional variance in BOLD explained by low frequencies was not restricted to primary areas, suggesting that low frequencies are related to more distributed BOLD changes. Consistent with previous studies [Crone et al., 1998b; Lachaux et al., 2006; Miller et al., 2007], low frequency power decreases were spatially more distributed than high frequency power increases. Understanding how different processes reflected in the LFP are integrated in fMRI activation maps is essential to link fMRI findings to both noninvasive EEG and MEG experiments that measure neuronal signals over larger areas of cortex and invasive studies in nonhuman primates that extract neuronal signals from small areas of cortex. EEG and MEG studies suggested that these low frequency rhythms correlate with BOLD changes [Brookes et al., 2005; Ritter et al., 2009; Winterer et al., 2007]. However, since EEG and MEG intrinsically average over larger volumes of brain tissue, they cannot resolve local neuronal activity with a spatial precision comparable to that of fMRI [Ahlfors et al., 2010]. Although these EEG and MEG studies could show a general colocalization of BOLD and spectral changes, we demonstrate that across areas there is a parametric relationship between BOLD and spectral power change in both low and high frequencies. This parametric relationship suggests a specific coupling between the neurophysiological mechanisms underlying these spectral changes and vascular changes. A general colocalization between fMRI activity and high frequency power change has also been shown by large‐scale penetrating electrodes and microelectrodes [Lachaux et al., 2007; Ojemann et al., 2010], but they also showed that multiple fMRI sites did not show any high frequency power changes. Using a parametric analysis and investigating the full spectral scale of behavior associated changes we were able to show that low frequency changes explain a different part of the BOLD signal change. This may indicate that low frequency power changes explain part of these fMRI sites unexplained by high frequency change. It seems likely that the relationship also applies to other brain functions, such as language, where the spatial distribution of high and low frequency change is local and distributed in a similar manner [Edwards et al., 2009], but this requires confirmation with similar studies on other tasks.
Low frequency sensorimotor rhythms have been associated with reciprocal thalamic and basal ganglia projections to cortex [Brown, 2003; Feige et al., 2005; Pfurtscheller and Lopes da Silva, 1999; Schnitzler et al., 2006]. Assuming that these low frequency rhythms reflect inhibition of a cortical region [Mazaheri et al., 2009], the decrease in power that we measure in α and β1 may reflect a disinhibition or preparation of cortical structures. Lesions and stimulation of specific nuclei in the basal ganglia have indeed been shown to alter metabolism in cortical projection sites [Asanuma et al., 2006; Eidelberg et al., 1996]. Single subject fMRI activation maps typically consist of focal peaks with a high contrast to noise ratio, surrounded by a more distributed and variable pattern of weaker BOLD signal increase [Rombouts et al., 1997; Saad et al., 2003]. Our results suggest that these spatially distributed BOLD signal increases may be induced by the neuronal mechanisms underlying the ongoing α and β brain rhythms, while the peaks in BOLD signal change are induced by local neuronal activity. Since ECoG is sampled relatively sparse with 1 cm inter electrode spacing, it should be considered that the part of BOLD signal change explained by low frequency changes is actually due to missed high frequency activity. On motor cortex however, responses for individual fingers can be captured with 1 cm spaced ECoG electrodes [Miller et al., 2009b] and previous studies sampling at smaller scales in 1 area of cortex have also reported low frequency correlation with BOLD when no spiking or high frequency LFP power change could be found [Maier et al., 2008]. This possibility should however be further explored in other studies using higher resolution spatial sampling.
A complicating factor in the interpretation of fMRI activation maps is that hemodynamic changes occur not only in the capillary bed but also in the arterial and venous blood vessels that feed and drain those beds, respectively. These changes are known as inflow [Gao et al., 1988] and draining vein [Turner, 2002] artefacts, respectively, and cannot easily be distinguished from BOLD effects originating from the capillary bed. To minimize these artifacts in the current study, we used an fMRI acquisition technique that minimizes contribution of larger vessels: 3D PRESTO [Neggers et al., 2008]. Inflow effects are eliminated by acquiring data in whole brain, which enables excitation of the whole brain simultaneously [Duyn et al., 1994]. Draining vein effects are reduced by the use of crusher gradients which cause a rapid dephasing of signal in larger vessels, effectively eliminating those from the fMRI images [Duyn et al., 1996].
Although the blocked design task we used in this study is a simple on–off task, we used the spatial variability in BOLD amplitude and neuronal activity and related these two and found a spatial correlation. Within primary sensorimotor cortex typically a pattern of BOLD activity is found with a range of BOLD response amplitudes that is reproducible across repeated scan sessions [Ramsey et al., 1996] and this range may be associated with a quantitative superposition of hand and individual finger representations in motor cortex [Kleinschmidt et al., 1997]. We exploited this spatially distributed range to study the neuronal correlates of BOLD signal change.
Of the variance in BOLD signal change, we could explain 36% on average. The unexplained variance could in part be due to the aforementioned non‐neuronal artifacts. In addition, measuring ECoG and fMRI at different times may have introduced some variability in task performance, and subsequently in brain activity. A simple motor task leaves limited leeway for this, but test–retest fMRI motor studies typically report 40% overlap of activity patterns in individual subjects [Raemaekers et al., 2007], supporting this notion. Other aspects might contribute to the unexplained variance, such as task related hemodynamic changes that are not reflected by neuronal changes [Sirotin and Das, 2009], neuronal changes that are not reflected by hemodynamic change and nonlinear relations between the two [Lauritzen, 2005] or physiological noise in fMRI, which might affect magnitude of signal change [Birn et al., 2006]. When considering these possible confounds, the finding that a significant 36% of variance in BOLD signal change could be explained by spectral power changes in ECoG and the fact that the parametric relation between these two is visible on the level of the individual subject (Figs. 4, 5), indicate that a large part of the fMRI signal changes is related to the measured neurophysiological changes.
In conclusion, by measuring neuronal population activity using ECoG, our study demonstrates that BOLD signal change is largely induced by two separate neurophysiological mechanisms, being spatially focal neuronal processing and spatially more distributed low frequency‐driven modulation of cortex. Because of the robust spatial relationship between the magnitudes of fMRI activity and high frequency power increases within primary sensorimotor cortex, we conclude that BOLD peaks in primary sensorimotor cortex primarily reflect local neuronal processing.
Supporting information
Additional Supporting Information may be found in the online version of this article.
Supporting Information
Acknowledgements
The authors thank Erika van Hell, Martin Bleichner, Geertjan Huiskamp, Herke Jan Noordmans, Peter Bos, and Cyrille Ferrier for their help in collecting the data, Ole Jensen, Natalia Petridou and Peter Bandettini for their helpful advice, Peter Gosselaar, and Peter van Rijen for implanting the electrodes and the patients and staff of the clinical neurophysiology department for their time and effort.
REFERENCES
- Ahlfors SP, Han J, Lin FH, Witzel T, Belliveau JW, Hamalainen MS, Halgren E ( 2010): Cancellation of EEG and MEG signals generated by extended and distributed sources. Hum Brain Mapp 31: 140–149. [DOI] [PMC free article] [PubMed] [Google Scholar]
- Asanuma K, Tang C, Ma Y, Dhawan V, Mattis P, Edwards C, Kaplitt MG, Feigin A, Eidelberg D ( 2006): Network modulation in the treatment of Parkinson's disease. Brain 129( Part 10): 2667–2678. [DOI] [PMC free article] [PubMed] [Google Scholar]
- Ashburner J, Friston KJ ( 2005): Unified segmentation. Neuroimage 26: 839–851. [DOI] [PubMed] [Google Scholar]
- Birn RM, Diamond JB, Smith MA, Bandettini PA ( 2006): Separating respiratory‐variation‐related fluctuations from neuronal‐activity‐related fluctuations in fMRI. Neuroimage 31: 1536–1548. [DOI] [PubMed] [Google Scholar]
- Brookes MJ, Gibson AM, Hall SD, Furlong PL, Barnes GR, Hillebrand A, Singh KD, Holliday IE, Francis ST, Morris PG ( 2005): GLM‐beamformer method demonstrates stationary field, alpha ERD and gamma ERS co‐localisation with fMRI BOLD response in visual cortex. Neuroimage 26: 302–308. [DOI] [PubMed] [Google Scholar]
- Brown P ( 2003): Oscillatory nature of human basal ganglia activity: Relationship to the pathophysiology of Parkinson's disease. Mov Disord 18: 357–363. [DOI] [PubMed] [Google Scholar]
- Crone NE, Miglioretti DL, Gordon B, Lesser RP ( 1998a): Functional mapping of human sensorimotor cortex with electrocorticographic spectral analysis. II. Event‐related synchronization in the gamma band. Brain 121( Part 12): 2301–2315. [DOI] [PubMed] [Google Scholar]
- Crone NE, Miglioretti DL, Gordon B, Sieracki JM, Wilson MT, Uematsu S, Lesser RP ( 1998b): Functional mapping of human sensorimotor cortex with electrocorticographic spectral analysis. I. Alpha and beta event‐related desynchronization. Brain 121( Part 12): 2271–2299. [DOI] [PubMed] [Google Scholar]
- Duyn JH, Mattay VS, Sexton RH, Sobering GS, Barrios FA, Liu G, Frank JA, Weinberger DR, Moonen CT ( 1994): 3‐dimensional functional imaging of human brain using echo‐shifted FLASH MRI. Magn Reson Med 32: 150–155. [DOI] [PubMed] [Google Scholar]
- Duyn JH, Yang Y, Frank JA, Mattay VS, Hou L ( 1996): Functional magnetic resonance neuroimaging data acquisition techniques. Neuroimage 4( 3 Part 3): S76–S83. [DOI] [PubMed] [Google Scholar]
- Edwards E, Soltani M, Kim W, Dalal SS, Nagarajan SS, Berger MS, Knight RT ( 2009): Comparison of time‐frequency responses and the event‐related potential to auditory speech stimuli in human cortex. J Neurophysiol 102: 377–386. [DOI] [PMC free article] [PubMed] [Google Scholar]
- Eidelberg D, Moeller JR, Ishikawa T, Dhawan V, Spetsieris P, Silbersweig D, Stern E, Woods RP, Fazzini E, Dogali M, Beric A ( 1996): Regional metabolic correlates of surgical outcome following unilateral pallidotomy for Parkinson's disease. Ann Neurol 39: 450–459. [DOI] [PubMed] [Google Scholar]
- Feige B, Scheffler K, Esposito F, Di Salle F, Hennig J, Seifritz E ( 2005): Cortical and subcortical correlates of electroencephalographic alpha rhythm modulation. J Neurophysiol 93: 2864–2872. [DOI] [PubMed] [Google Scholar]
- Gao JH, Holland SK, Gore JC ( 1988): Nuclear magnetic resonance signal from flowing nuclei in rapid imaging using gradient echoes. Med Phys 15: 809–814. [DOI] [PubMed] [Google Scholar]
- Hermes D, Miller KJ, Noordmans HJ, Vansteensel MJ, Ramsey NF ( 2010): Automated electrocorticographic electrode localization on individually rendered brain surfaces. J Neurosci Methods 185: 293–298. [DOI] [PubMed] [Google Scholar]
- Katzner S, Nauhaus I, Benucci A, Bonin V, Ringach DL, Carandini M ( 2009): Local origin of field potentials in visual cortex. Neuron 61: 35–41. [DOI] [PMC free article] [PubMed] [Google Scholar]
- Kleinschmidt A, Nitschke MF, Frahm J ( 1997): Somatotopy in the human motor cortex hand area. A high‐resolution functional MRI study. Eur J Neurosci 9: 2178–2186. [DOI] [PubMed] [Google Scholar]
- Lachaux JP, Fonlupt P, Kahane P, Minotti L, Hoffmann D, Bertrand O, Baciu M ( 2007): Relationship between task‐related gamma oscillations and BOLD signal: New insights from combined fMRI and intracranial EEG. Hum Brain Mapp 28: 1368–1375. [DOI] [PMC free article] [PubMed] [Google Scholar]
- Lachaux JP, Hoffmann D, Minotti L, Berthoz A, Kahane P ( 2006): Intracerebral dynamics of saccade generation in the human frontal eye field and supplementary eye field. Neuroimage 30: 1302–1312. [DOI] [PubMed] [Google Scholar]
- Lauritzen M ( 2005): Reading vascular changes in brain imaging: is dendritic calcium the key? Nat Rev Neurosci 6: 77–85. [DOI] [PubMed] [Google Scholar]
- Leuthardt EC, Miller K, Anderson NR, Schalk G, Dowling J, Miller J, Moran DW, Ojemann JG ( 2007): Electrocorticographic frequency alteration mapping: a clinical technique for mapping the motor cortex. Neurosurgery 60( 4 Suppl 2): 260–270; discussion 270–271. [DOI] [PubMed] [Google Scholar]
- Logothetis NK ( 2008): What we can do and what we cannot do with fMRI. Nature 453: 869–78. [DOI] [PubMed] [Google Scholar]
- Logothetis NK, Pauls J, Augath M, Trinath T, Oeltermann A ( 2001): Neurophysiological investigation of the basis of the fMRI signal. Nature 412: 150–157. [DOI] [PubMed] [Google Scholar]
- Maes F, Collignon A, Vandermeulen D, Marchal G, Suetens P ( 1997): Multimodality image registration by maximization of mutual information. IEEE Trans Med Imaging 16: 187–198. [DOI] [PubMed] [Google Scholar]
- Maier A, Wilke M, Aura C, Zhu C, Ye FQ, Leopold DA ( 2008): Divergence of fMRI and neural signals in V1 during perceptual suppression in the awake monkey. Nat Neurosci 11: 1193–1200. [DOI] [PMC free article] [PubMed] [Google Scholar]
- Manning JR, Jacobs J, Fried I, Kahana MJ ( 2009): Broadband shifts in LFP power spectra are correlated with single‐neuron spiking in humans. J Neurosci 29: 13613–13620. [DOI] [PMC free article] [PubMed] [Google Scholar]
- Mazaheri A, Nieuwenhuis ILC, van Dijk H, Jensen O ( 2009): Prestimulus alpha and mu activity predicts failure to inhibit motor responses. Hum Brain Mapp 30: 1791–1800. [DOI] [PMC free article] [PubMed] [Google Scholar]
- Miezin FM, Maccotta L, Ollinger JM, Petersen SE, Buckner RL ( 2000): Characterizing the hemodynamic response: Effects of presentation rate, sampling procedure, and the possibility of ordering brain activity based on relative timing. Neuroimage 11( 6 Part 1): 735–759. [DOI] [PubMed] [Google Scholar]
- Miller KJ, Leuthardt EC, Schalk G, Rao RP, Anderson NR, Moran DW, Miller JW, Ojemann JG ( 2007): Spectral changes in cortical surface potentials during motor movement. J Neurosci 27: 2424–2432. [DOI] [PMC free article] [PubMed] [Google Scholar]
- Miller KJ, Sorensen LB, Ojemann JG, denNijs M ( 2009a): Power‐Law Scaling in the Brain Surface Electric Potential. PLoS Comput Biol 5: e1000609. [DOI] [PMC free article] [PubMed] [Google Scholar]
- Miller KJ, Zanos S, Fetz EE, den Nijs M, Ojemann JG ( 2009b): Decoupling the cortical power spectrum reveals real‐time representation of individual finger movements in humans. J Neurosci 29: 3132–3137. [DOI] [PMC free article] [PubMed] [Google Scholar]
- Mukamel R, Gelbard H, Arieli A, Hasson U, Fried I, Malach R ( 2005): Coupling between neuronal firing, field potentials, and FMRI in human auditory cortex. Science 309: 951–954. [DOI] [PubMed] [Google Scholar]
- Murthy VN, Fetz EE ( 1996): Oscillatory activity in sensorimotor cortex of awake monkeys: Synchronization of local field potentials and relation to behavior. J Neurophysiol 76: 3949–3967. [DOI] [PubMed] [Google Scholar]
- Neggers SF, Hermans EJ, Ramsey NF ( 2008): Enhanced sensitivity with fast three‐dimensional blood‐oxygen‐level‐dependent functional MRI: Comparison of SENSE‐PRESTO and 2D‐EPI at 3 T. NMR Biomed 21: 663–676. [DOI] [PubMed] [Google Scholar]
- Niessing J, Ebisch B, Schmidt KE, Niessing M, Singer W, Galuske RA ( 2005): Hemodynamic signals correlate tightly with synchronized gamma oscillations. Science 309: 948–951. [DOI] [PubMed] [Google Scholar]
- Ogawa S, Menon RS, Kim SG, Ugurbil K ( 1998): On the characteristics of functional magnetic resonance imaging of the brain. Annu Rev Biophys Biomol Struct 27: 447–474. [DOI] [PubMed] [Google Scholar]
- Ojemann GA, Corina DP, Corrigan N, Schoenfield‐McNeill J, Poliakov A, Zamora L, Zanos S ( 2010): Neuronal correlates of functional magnetic resonance imaging in human temporal cortex. Brain 133: 46–59. [DOI] [PMC free article] [PubMed] [Google Scholar]
- Pfurtscheller G, Lopes da Silva FH ( 1999): Event‐related EEG/MEG synchronization and desynchronization: basic principles. Clin Neurophysiol 110: 1842–1857. [DOI] [PubMed] [Google Scholar]
- Pouratian N, Bookheimer SY, Rex DE, Martin NA, Toga AW ( 2002): Utility of preoperative functional magnetic resonance imaging for identifying language cortices in patients with vascular malformations. J Neurosurg 97: 21–32. [DOI] [PubMed] [Google Scholar]
- Raemaekers M, Vink M, Zandbelt B, van Wezel RJ, Kahn RS, Ramsey NF ( 2007): Test‐retest reliability of fMRI activation during prosaccades and antisaccades. Neuroimage 36: 532–542. [DOI] [PubMed] [Google Scholar]
- Ramsey NF, Tallent K, van Gelderen P, Frank JA, Moonen CTW, Weinberger DR ( 1996): Reproducibility of human 3D fMRI brain maps acquired during a motor task. Hum Brain Mapp 4: 113–121. [DOI] [PubMed] [Google Scholar]
- Ramsey NF, van den Brink JS, van Muiswinkel AM, Folkers PJ, Moonen CT, Jansma JM, Kahn RS ( 1998): Phase navigator correction in 3D fMRI improves detection of brain activation: Quantitative assessment with a graded motor activation procedure. NeuroImage 8: 240–248. [DOI] [PubMed] [Google Scholar]
- Ritter P, Moosmann M, Villringer A ( 2009): Rolandic alpha and beta EEG rhythms' strengths are inversely related to fMRI‐BOLD signal in primary somatosensory and motor cortex. Hum Brain Mapp 30: 1168–1187. [DOI] [PMC free article] [PubMed] [Google Scholar]
- Rombouts SA, Barkhof F, Hoogenraad FG, Sprenger M, Valk J, Scheltens P ( 1997): Test‐retest analysis with functional MR of the activated area in the human visual cortex. AJNR Am J Neuroradiol 18: 1317–1322. [PMC free article] [PubMed] [Google Scholar]
- Roopun AK, Middleton SJ, Cunningham MO, LeBeau FE, Bibbig A, Whittington MA, Traub RD ( 2006): A beta2‐frequency (20–30 Hz) oscillation in nonsynaptic networks of somatosensory cortex. Proc Natl Acad Sci USA 103: 15646–15650. [DOI] [PMC free article] [PubMed] [Google Scholar]
- Rutten GJ, Ramsey NF, van Rijen PC, Noordmans HJ, van Veelen CW ( 2002): Development of a functional magnetic resonance imaging protocol for intraoperative localization of critical temporoparietal language areas. Ann Neurol 51; 350–360. [DOI] [PubMed] [Google Scholar]
- Saad ZS, Ropella KM, DeYoe EA, Bandettini PA ( 2003): The spatial extent of the BOLD response. Neuroimage 19: 132–144. [DOI] [PubMed] [Google Scholar]
- Schnitzler A, Timmermann L, Gross J ( 2006): Physiological and pathological oscillatory networks in the human motor system. J Physiol Paris 99: 3–7. [DOI] [PubMed] [Google Scholar]
- Sinai A, Bowers CW, Crainiceanu CM, Boatman D, Gordon B, Lesser RP, Lenz FA, Crone NE ( 2005): Electrocorticographic high gamma activity versus electrical cortical stimulation mapping of naming. Brain 128( Part 7): 1556–1570. [DOI] [PubMed] [Google Scholar]
- Sirotin YB, Das A ( 2009): Anticipatory haemodynamic signals in sensory cortex not predicted by local neuronal activity. Nature 457: 475–479. [DOI] [PMC free article] [PubMed] [Google Scholar]
- Turner R ( 2002): How much cortex can a vein drain? Downstream dilution of activation‐related cerebral blood oxygenation changes. Neuroimage 16: 1062–1067. [DOI] [PubMed] [Google Scholar]
- Welch P ( 1967): The use of fast Fourier transform for the estimation of power spectra: A method based on time averaging over short, modified periodograms. IEEE Trans Audio Electroacoust 15: 70–73. [Google Scholar]
- Whittingstall K, Logothetis NK ( 2009): Frequency‐band coupling in surface EEG reflects spiking activity in monkey visual cortex. Neuron 64: 281–289. [DOI] [PubMed] [Google Scholar]
- Winterer G, Carver FW, Musso F, Mattay V, Weinberger DR, Coppola R ( 2007): Complex relationship between BOLD signal and synchronization/desynchronization of human brain MEG oscillations. Hum Brain Mapp 28: 805–816. [DOI] [PMC free article] [PubMed] [Google Scholar]
Associated Data
This section collects any data citations, data availability statements, or supplementary materials included in this article.
Supplementary Materials
Additional Supporting Information may be found in the online version of this article.
Supporting Information