

Abstract
In everyday life, our actions are often guided by verbal instructions. Usually, we can implement such instructions immediately without trial and error learning. This raises the fundamental question how verbal instructions are transformed into efficient motor behavior. The aim of this study was to gain deeper insights into the implementation of verbal instructions both on a neural and a cognitive level. To this end, we devised an fMRI experiment in which participants were required to permanently implement new stimulus–response (S–R) mappings and object–color (O–C) mappings. This enabled us to test whether there are brain areas that are specific to the implementation of newly instructed S–R mappings or whether newly instructed rules are represented independently from the specific content. Furthermore, we could test which brain areas are involved in the processing of S–R mappings when compared with O–C mappings. Our results suggest that only one brain area, the left inferior frontal junction (IFJ), was sensitive to the novelty of instructions regardless of whether these instructions conveyed S–R or O–C mappings. Furthermore, our results show that instructions conveying S–R mapping involve a network of brain areas, including pre‐PMd, M1, and IPS that was not sensitive to the novelty of the instructions. Therefore, we conclude that the implementation of verbal instructions results from an interplay of a brain areas that represent novel rulelike information in domain general terms and brain areas that are specific to S–R rules. Hum Brain Mapp, 2011. © 2010 Wiley‐Liss, Inc.
Keywords: verbal instructions, fMRI, cognitive control, prefrontal cortex, IPS
INTRODUCTION
Verbal instructions play a fundamental role in daily life. Whether we read the instruction manual of a new video‐recorder or are told to find our way through an unknown city, verbal instructions are omnipresent. Via the use of verbal instructions, we learn new behavior and optimize already learned behavior. Despite this fundamental role of verbal instructions in behavioral regulation of humans [Vygotskij et al., 1994], little is known about the translation of verbal information into efficient behavior. Human linguistic abilities are not sufficient to explain this transformation process. This becomes clear when looking at the dissociation of knowing and doing in patients with frontal brain lesions. Although these patients can verbally report what they have to do and have no pure motor deficits, they are sometimes unable to transform this instruction into efficient motor behavior [Luria et al., 1980]. In a similar vein, Duncan and colleagues [ 2008] described a symptom they called “goal neglect” where healthy participants behaviorally neglect specific task instructions while still being able to describe them. The extent of goal neglect was influenced by the complexity of task instructions [Duncan et al., 2008]. Furthermore, the authors pointed out the possible link between frontal lobe functioning and the extent of goal neglect.
Research on learning and application of arbitrary visuomotor associations has provided relevant insights into how we learn new stimulus–response (S–R) associations [Grol et al., 2006; Loh et al., 2008; Passingham et al., 2000; Toni et al., 2001a, b]. In most of these studies, subjects either have to perform prelearned S–R associations or have to learn to associate arbitrary stimuli with specific responses on a trial and error basis. Commonly, areas in the frontal cortex (inferior frontal sulcus, inferior frontal gyrus, and premotor areas), temporal cortex (hippocampal areas), and subcortical areas (e.g., basal ganglia) show involvement in the acquisition and application of arbitrary S–R associations [Grol et al., 2006; Loh et al., 2008; Passingham et al., 2000; Toni et al., 2001a, b]. However, these studies did not address how instructions are used to form these S–R associations in the first place.
A number of behavioral studies have recently shown that verbally instructed behavior exerts an automatic influence on the motor level [De Houwer, 2004; De Houwer et al., 2005; Waszak et al., 2008; Wenke and Frensch, 2005; Wenke et al., 2007]. Furthermore, following this logic, a recent fMRI study compared the interference effect induced by verbally instructed and practiced S–R associations [Brass et al., 2009]. Although this study supports the idea that verbally instructed S–R mappings and learned S–R mappings can be dissociated on a functional level, it does not directly investigate the implementation process itself. A more direct investigation comes from a recent fMRI study [Ruge and Wolfensteller, 2010] in which multiple S–R mappings were instructed during an instruction period after which they had to be applied several times. It was shown that lateral prefrontal cortex (LPFC) and the posterior intrapartial sulcus were engaged in early application trials. In contrast, the lateral premotor cortex (PMC) and caudate head were engaged in later application trials. Furthermore, during the instruction period, lateral PMC activation was positively correlated with behavioral performance.
In summary, past research shows that instructed S–R mappings are represented on a different level than repeatedly applied S–R mappings, and we know that instructed S–R mappings exert an automatic influence on our behavior. However, thus far, the brain circuits involved in the implementation of verbal instructions have hardly been investigated. To fill this gap, we devised an fMRI experiment in which participants were required to permanently learn and implement new instructions. By contrasting these new instructions with already implemented instructions, we could test for brain areas sensitive to the implementation of instructions. However, to test whether brain activation related to new instructions is specific to the implementation of S–R mappings, we compared an S–R task with an object–color task (O–C task). We hypothesized that new S–R mapping instructions would induce heightened activation in LPFC and parietal regions when compared with already implemented S–R mapping instructions. Moreover, implemented S–R mapping instructions are believed to rely more on premotor cortices and primary motor cortices.
MATERIALS AND METHODS
Participants
Nineteen participants (five men) took part in the study (mean age = 21.95 years, SD = 2.96). All participants reported to be healthy and had no history of neurological disorders. All participants gave written informed consent, and the study was approved by the Medical Ethical Review Board at the Ghent University hospital. All were right handed, as assessed by the Edinburgh Inventory [Oldfield, 1971]. Participants were paid 45 euro's for their participation.
Tasks
Two different tasks were used: a S–R task and an O–C task. On the start of every trial, participants received an instruction after which a target could appear. The type of instructions and targets differs between the S–R task and O–C task and is explained in more detail below.
Stimulus Response Task
Instruction screens were presented that depicted two S–R mappings. An example of such an instruction screen is “car = I; cork = M” (I stands for index fingers and M stands for middle fingers, Fig. 1 upper panel). In half of the instructions, M (middle fingers) was written in the first line, whereas, in the other half, this was an I (index fingers). Thereafter, a target could appear that was either instructed or uninstructed by the preceding instruction. If the target was instructed, participants had to respond according to the instruction with both middle fingers or index fingers. Bimanual response mappings were applied to prevent visual imagery strategies, in which participants imagine the objects on a left or right location. Furthermore, half of the targets were colored differently from the other half of the targets. Three different color sets were counterbalanced across participants: pink/green, pink/red, and green/red.
Figure 1.
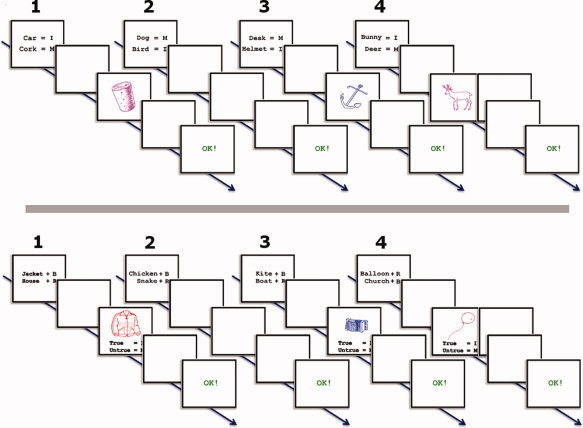
Upper panel, examples of trials per condition used in the SR task. Lower panel, examples of trials per condition used in the O–C task. In both panel, the numbers indicate the trial structures used for the different trial types: (1) new applied, multiple times applied, multiple times instructed (during test session) trials; (2) new instructed and multiple times instructed (during training session) trials; (3) catch trials; (4) control trials, in half of the trials the instruction screens were not followed by a target and in the other half they were not. Note that in the actual experiment all stimuli names were in Dutch.
Object–Color Task
Instructions screens were presented that linked objects with colors. An example of such an instruction screen is “donkey + R; cat + B” (R stands for red and B stands for blue, see Fig. 1 lower panel). Half of the instructions mentioned B (for blue) in the first line, whereas in the other half, this was R (for red). Three different color sets were counterbalanced across participants: red/blue, blue/green, and blue/pink. The colors used in the O–C task were different from the ones used in the S–R task. After an instruction, a colored target could appear that was either instructed or uninstructed by the preceding instruction. If the target was instructed, participants had to judge whether or not the target was colored according to the instruction. This was done by responding with both middle fingers or both index fingers. Which response corresponded to the correct or incorrect option was revealed on target appearance by means of two lines of text written below the target (e.g., correct = I; incorrect = M, I, and M stand for index fingers and middle fingers, respectively). Moreover, the response mapping given on the target screen was randomized; in half of the trials, the first line indicated an index finger response, whereas, in the other half, this was a middle‐finger response. Furthermore, true or untrue judgment responses were randomly divided over both finger pairs. This was done to prevent the activation of a response mapping on instruction screen appearance and to prevent the formation of a response mapping between fingers and truth status (e.g., index fingers is always true).
In both tasks, half of the instructions and their targets consisted of manmade objects and the other half of living objects. Pictures and their names were taken from the picture naming database used by Severens and colleagues [Severens et al., 2005].
Design
The experiment consisted of two sessions; a training session the day before scanning (outside the scanner) and a test session (actual scanning session). The training session was included to create both multiple times applied and multiple times instructed S–R/O–C mappings. By presenting these instructions again during the test session, we are able to look at the effect of implementing an instruction multiple times.
In both sessions, the S–R task and O–C task were presented randomly intermixed throughout the whole experiment with two restrictions: the same task could not occur for five consecutive trials, and the same instruction could not repeat in two consecutive trials.
All tasks were programmed using E‐Prime (Psychology Software Tools). In the training session, all responses were given via a standard PC keyboard, and stimuli were presented on a 17‐in. CRT monitor. In the test session, responses were recorded using two button response boxes, which were placed on the participant's left and right upper leg, and stimuli were projected onto a screen, which was visible to the participants through a mirror attached to the head‐coil.
Training Session
Both S–R and O–C task trials started with a fixation cross in the middle of the screen, which had a random presentation time of 0, 50, 250, or 500 ms. Thereafter, an instruction appeared for 2,000 ms, which was followed by a blank, which had a duration of 250 ms. Then, a target or another blank was presented for 1,500 ms (in the S–R task)/2,000 ms (in the O–C task) or until the participant responded. Participants were not allowed to respond to uninstructed targets or blanks. Subsequently, a feedback screen was presented for 500 ms indicating whether the response was correct, incorrect, too slow, or with a too long delay between the two finger presses (more than 50 ms).
During the training session, a total of 160 unique instructions were presented. Eighty of these conveyed S–R mapping instructions (S–R task), while the other 80 depicted O–C mappings (O–C task).
For both tasks, 20 of 80 instructions were always followed by a target that was instructed in the preceding instruction and were presented 10 times, resulting in 200 trials per task. In half of the presentations, one of the instructed targets was presented and in the other half the other one. Therefore, these instructions were applied multiple times and so we refer to these trials as multiple times applied trials. To avoid the strategy that only one of the S–R mapping/O–C mapping would be prepared, and as a consequence always result in a motor preparation of one response in the S–R task, 20 of the 80 instructions were followed by an uninstructed target. These instructions were presented one time, resulting in a total of 20 trials per task and served as catch trials.
For both tasks, 20 of 80 instructions were never followed by a target and were presented 10 times, resulting in 200 trials per task. These trials are referred to as multiple times instructed trials. The fact that these instructions were never followed by a target could induce a strategy in which participants stop processing instructions that are never followed by a target. To counter such a strategy, 20 of the 80 instructions were presented four times resulting in 80 trials per task; during half of these presentations, instructions were followed by a target and in the other half of the cases by a blank. These trials are referred to as control trials.
In total, the training session consisted of 1,000 trials (500 per task), which were spread over four experimental blocks of 250 trials each. After each block, participants were given a break. Before the training session, participants received instructions on the screen about the tasks and could practice both tasks for 18 trials. None of the stimuli used in the practice block were reused in the experimental blocks.
Test Session
During the test session, participants had to perform both the S–R and O–C tasks, whereas their fMRI data were acquired. The same trial structure as in the training session was used. However, to ensure that the brain signal associated with the presentation of the instructions and the targets could be disentangled, the time between instruction screen disappearance and target presentation was jittered in a pseudo‐logarithmic fashion. Using steps of 800 ms, 50% of the trials used a jitter ranging from 200 to 2,600 ms, 30% of the trials used a jitter ranging from 3,200 to 5,600 ms, and 20% of the trials used a jitter ranging from 6,200 to 8,600. The mean jitter was 3,431 ms.
During the test session, 112 new and unique instructions were used, 56 conveyed S–R mapping instructions, and the other 56 depicted O–C mapping instructions. For both tasks, 20 of 56 instructions were always followed by a target that was instructed in the instructions. These instructions were presented two times during the course of the experiment resulting in 40 trials per task and are referred to as new applied trials. In half of these presentations, one of the instructed targets was presented and in the other half the other target. Again, to avoid the strategy that only one of the S–R mapping/object color mapping would be prepared, 6 of the 56 instruction screens were followed by an uninstructed target. These instructions were presented one time, resulting in a total of six trials per task and served as catch trials.
For both tasks, 20 of 56 instructions were never followed by a target and as a consequence stay instructed only. These instructions were presented two times during the course of the experiment resulting in 40 trials per task and are referred to as new instructed trials. To make sure that participants process instructions even though they are not followed by a target, we have included the following trials. Ten of the 56 instructions were presented four times resulting in 40 per task. During half of these presentations, instructions were followed by a target and in the other half of the cases by a blank. These trials are referred to as control trials.
The multiple times applied trials and the multiple times instructed trials from the training session were also used. This means that 80 old instructions, 40 for each task, were added to the test session. All these old instructions were followed by a target and presented two times, resulting in 40 trials that used the multiple times applied instructions and 40 trials that used the multiple times instructed instructions.
Overall, the test session consisted of 412 trials divided over four experimental blocks. Before scanning, participants received instructions about the tasks and could practice both tasks for 18 trials. None of the stimuli used in the practice block were reused in the experimental blocks. The experiment in the scanner lasted about 50 min.
Behavioral Analysis
On the reaction time (RT) data of the training session, a repeated‐measure ANOVA with the factor APPLICATIONS (multiple times applied, control) was computed for both tasks separately. The same analysis was performed on error rate data, but now the factor APPLICATIONS had three levels (multiple times applied, control, and catch).
On the RT data of the test session, a repeated‐measure ANOVA with the factors APPLICATIONS (new applied, multiple times applied, and multiple times instructed) × PRESENTATION (first time, second time) was computed. For the error rate data, we were not able to dissociate between the number of presentations, because the catch trials were only presented once. Therefore, a repeated‐measure ANOVA with the factor APPLICATIONS (new applied, control, catch, multiple times applied, and multiple times instructed) was computed.
fMRI Methods
The experiment was carried out on a 3T scanner (Siemens Trio) using an eight‐channel radiofrequency head coil. Subjects were positioned head first and supine in the magnet bore. First, 176 high‐resolution anatomical images were acquired using a T1‐weighted 3D MPRAGE sequence [TR = 2,530 ms, TE = 2.58 ms, image matrix = 256 × 256, FOV = 220 mm, flip angle = 7°, slice thickness = 0.90 mm, and voxel size = 0.9 × 0.86 × 0.86 mm (resized to 1 × 1 × 1 mm)]. Whole‐brain functional images were collected using a T2*‐weighted EPI sequence, sensitive to BOLD contrast (TR = 2,000 ms, TE = 35 ms, image matrix = 64 × 64, FOV = 224 mm, flip angle = 80°, slice thickness = 3.0 mm, distance factor = 17%, voxel size 3.5 × 3.5 × 3 mm, and 30 axial slices). A varying number of images were acquired per run due to the self‐paced initiation of trials.
All data were preprocessed and analyzed using SPM5 (http://www.fil.ion.ucl.ac.uk/spm/software/spm5/). To account for possible T1 relaxation effects, the first two scans of each EPI series were excluded from the analysis. First, a mean image for all scan volumes was created, to which individual volumes were spatially realigned using rigid body transformation. Thereafter, they were slice time corrected using the first slice as a reference. The structural image of each subject was coregistered with their mean functional image after which all functional images were normalized to the Montreal Neurological Institute (Montreal, Quebec, Canada) T1 template. The images were resampled into 3.5‐mm3 voxels and spatially smoothed with a Gaussian kernel of 8 mm (full‐width at half maximum). A high‐pass filter of 128 Hz was applied during fMRI data analysis. Statistical analyses were performed on individual subjects' data using the general linear model (GLM) in SPM5.
The main question of interest was which brain areas are involved in the implementation process of instructed S–R mappings. We therefore used instruction screen presentation as the main event of interest in the GLM. Both a canonical hemodynamic response function (HRF) and the first derivative were modeled on the onset of instruction screen presentation for each trial. We distinguished between the new applied, new instructed, multiple times applied, and multiple times instructed trials. This was done separately for the S–R and O–C task and for first and second presentation of the instruction screens. To disentangle activity from instruction screen presentation from activation related to target screen presentation, we also modeled target screen presentation; this was done separately for response and nonresponse trials. Finally, both catch and control trial instructions were modeled as a regressor of noninterest. Six regressors defining head movements were also included to account for any residual movement‐related effect.
Contrast images were computed for each participant to compare the relevant parameter estimates for the regressors containing the canonical HRF. Contrast images were submitted to a second‐level group analysis. We performed two types of second‐level group analysis.
First, whole‐brain contrasts between conditions were computed by performing one‐tailed t‐tests on these images, treating participants as random effect. To test if we could collapse across “never applied” trials, we contrasted first presentation of the new applied and new instructed trials directly with each other; this was done separately for the S–R task and O–C task. Furthermore, this contrast also tests if we are able to disentangle the neural signal belonging to the moment of instruction from that belonging to the moment of target presentation. The only difference between first time applied trials and instructed trials is that the former are followed by a target, whereas the latter is not. Both contrasts did not reveal any significant differences between the two conditions; we therefore collapsed across these trials to form never applied trials. To test whether or not the first and second presentation of multiple times applied trials could be pooled, they were contrasted with each other; this was done for the two tasks separately. Again, these analyses did not result in any significant differences, and therefore we pooled these trials to form the multiple times applied trials.
Second, a full factorial analysis was performed with factors TASK (S–R, O–C) × APPLICATIONS (never applied, multiple times applied), treating participants as random effect. We were especially interested in brain areas underlying the processing of the S–R task and brain activity related to the difference between novel instructions and multiple times applied instructions. First, by contrasting the S–R task versus the O–C task, we directly contrasted the implementation of process of instructed S–R mappings with that of instructed O–C mappings. Hence, this contrast would reveal brain areas that are specific for the implementation process of instructed S–R mappings. Second, by contrasting never‐applied versus multiple times applied instructions, we compared the processing of novel rule‐based information versus the processing of old rule‐based information. Finally, by looking at the interaction contrast of APPLICATIONS and TASK, we searched for brain areas specifically active for newly instructed S–R mappings. To this end, we looked at the t contrasts of S–R task versus O–C task and the never applied versus multiple times applied trials.
To correct for multiple comparisons, we used the program AlphaSim (for program details see afni.nimh.nih.gov/afni/doc/manual/AlphaSim; Ward [2000]). The program determined that, when using an uncorrected threshold of P < 0.001 (Z = 3.1), the minimum cluster size should be at least 22 contiguous voxels to be considered corrected for multiple comparisons on a P < 0.05 level.
Percent Signal Change Analysis
Percent signal‐change analysis was carried out using MARSBAR toolbox for use with SPM5 [Brett, 2002]. Based on the whole‐brain contrast of S–R task versus O–C task, we extracted the coordinates for left M1 (−53 −28 53), right M1 (49 −28 53), left pre‐PMd (−28 −11 60), right pre‐PMd (32 −11 63), left IPS (−35 −35 46), and right IPS (35 −35 46). Based on the contrast of never‐applied instructions > multiple times applied instructions, the coordinates for the left inferior frontal junction (IFJ; −46 7 21) were extracted.
In each ROI, a sphere was drawn with a 6‐mm diameter around the most highly activated voxel. Percent signal change during never‐applied trials and multiple times applied trials were computed for both tasks. Because participants had to give bimanual responses, left and right M1 ROIs were pooled resulting in a mean percent signal change for bilateral M1.
RESULTS
Behavioral Results
After performing an outlier analysis on RT data and error rate data, one participant (male) was excluded from further analysis, because both the RT data and error rate data deviated more than two SD from the group mean. All reported post hoc analysis used Bonferroni correction.
Training Session
RTs and error rates from the training session are depicted in Figure 2A,B, respectively.
Figure 2.
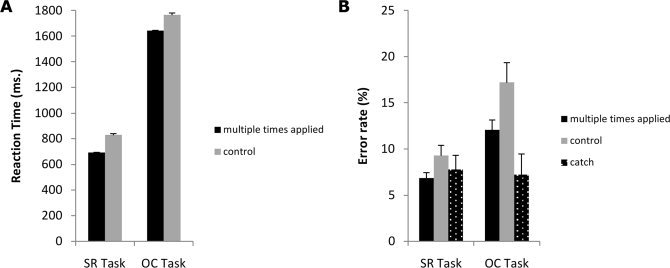
Panel A, Reaction times for both the SR task (left bars) and OC task (right bars) in the training session for the multiple times applied (black bar) and control trials (grey bar). Panel B, error rates for both the SR task (left bars) and OC task (right bars) in the training session for the multiple times applied (black bar), control (grey bar) and catch trials (white dotted black bar).
In the S–R task, RTs were significantly faster in the multiple times applied trials than in the control trials, F(1,17) = 97.5, P < 0.001. The error rates had a mean of 4.79% (SD = 2.1). The ANOVA on error rates did not show a significant main effect of APPLICATIONS, F(2,34) = 1.60, P > 0.05.
In the O–C task, participants were significantly faster in the multiple times applied trials than in the control trials, F(1,17) = 31.3, P < 0.001. Mean error rate was 7.3% (SD = 3.3). The ANOVA on error rates showed a main effect of APPLICATIONS, F(4,68) = 30.03, P < 0.001. Post hoc analysis revealed that participants made significantly fewer errors in the catch trials compared to the multiple times applied trials (P < 0.001) and that more errors were made in the control trials compared to the multiple times applied trials (P < 0.05).
Test Session
RTs and error rates from the test session are depicted in Figure 3A–C, respectively. An ANOVA on the RT data of the S–R task revealed a significant main effect of APPLICATIONS, F(2,34) = 137.55, P < 0.001 and of PRESENTATION, F(1,17) = 19.84, P < 0.005. Post hoc analysis revealed that participants responded significantly faster in multiple times applied trials compared to new applied trials and multiple times instructed trials (both P values < 0.001). Moreover, RTs are faster in second presentation than in the first presentation. The overall error rate in the S–R task was 5.9% (SD = 3.7). The ANOVA revealed a significant main effect of APPLICATIONS, F(4,68) = 2.99, P < 0.05. Post hoc analysis revealed that participants made significantly fewer errors in the multiple times applied trials compared to the new applied trials (P < 0.05), control trials (P < 0.001), and the multiple times instructed trials (P < 0.001), but not compared to the catch trials (P < 0.05).
Figure 3.
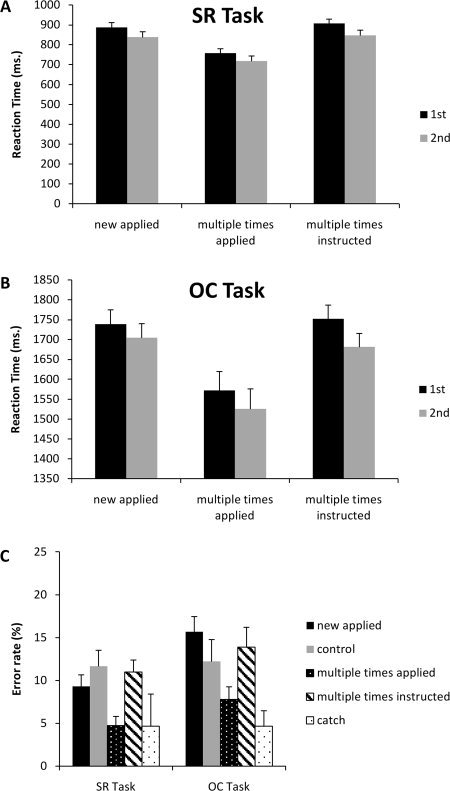
Panel A, Reaction times for the SR task for the new applied, multiple times applied and multiple times instructed trials. Black bars represent 1st time presentation, grey bars 2nd time presentation. Panel B, Reaction times for the OC task for the new applied, multiple times applied and multiple times instructed trials. Black bars represent 1st time presentation, grey bars 2nd time presentation. Panel C, error rates for both the SR task (left bars) and OC task (right bars) in the test session for the new applied (black bar), control (grey bar), multiple times applied (white dotted black bar), multiple times instructed (black stripped white bar) and the catch trials (black dotted white bar).
The same pattern of results was observed in the RT data of the O–C task, which showed a main effect of APPLICATIONS, F(2,34) = 16.21, P < 0.001. Post hoc analysis showed that this was caused by the significantly lower RTs in the multiple times applied trials compared to the new applied trials and multiple times instructed trials (all P values < 0.005). Although RTs tended to be faster for the second presentation when compared with the first presentation, the main effect of PRESENTATION failed to reach significance, F(1,17) = 4.19, P = 0.057.
The overall error rate in the O–C task was 7.75% (SD = 3.9). The repeated‐measure ANOVA showed a significant main effect of APPLICATIONS, F(4,68) = 6.89, P < 0.001. Post hoc testing showed that participants made significant less errors in the multiple times applied trials compared to the multiple times instructed trials (P < 0.05) and the new applied trials (P < 0.001). Furthermore, fewer errors were made in the catch trials compared to the new applied trials (P < 0.05).
In summary, the error data indicate that both tasks were relatively easy to perform. During the test session, participants did not make significantly more errors in either the new applied, catch, or control trials, indicating that they paid close attention to the instructions. Although the mean error rates of both tasks are quite similar, a paired sample t‐test revealed that they were significantly different from each other, t(17) = −2.18, P < 0.05. Participants made more errors in the O–C task compared to the S–R task, which could indicate that the O–C task was more difficult than the S–R task. However, the difference in error rate and RTs between the two tasks can be understood from the fact that the two tasks differ from one another in the target phase. In the O–C task, participants also had to encode the response mapping on target presentation. Consequently, differences in brain activation found for S–R task versus O–C task instructions should not reflect the use of more resources during the instruction phase of the O–C task. Finally, the data indicate that the training session led to the predicted learning effects for the multiple times applied trials. The multiple times instructed trials that did not show a decrease in RTs in the training session. It is very likely that participants formed a no‐response association with these trials. Indeed, the slow RTs on the first presentation seem to indicate so. Therefore, these trials are not used for the fMRI analysis.
fMRI Results
Instructions that are applied without errors in all presentations were used in the fMRI analysis. Because we are interested in the implementation of instructed S–R mappings rather than their application, all reported analyses focus on instruction screen presentation. We have restricted the analyses to the never applied and multiple times applied trials (see fMRI methods and Table I); this because these trials primarily reflect the implementation process of instructed S–R/O–C mappings. All the MNI coordinates of the reported contrasts are found in Table II.
Table I.
Separate for each trial type the number of times the depicted mappings are applied based on the number of presentations during the test session
| Trial | First presentation | Second presentation |
|---|---|---|
| New applied* | Never | One time |
| New instructed* | Never | Never |
| Multiple times applied** | Applied five times | One mapping applied six times |
| Multiple times instructed** | Never (instructed 11 times) | One time (instructed 12 times) |
In the fMRI analysis, the new applied and new instructed first presentation trials are pooled together to form the never applied trials.
In the fMRI analysis, both the presentations of the multiple times applied trials are pooled together.
Table II.
Brain activation in all tested whole brain contrasts
| Location | Brodmann area | Voxels | z‐max | mni coordinates (x, y, z) | Laterality |
|---|---|---|---|---|---|
| SR Task > OC Task | |||||
| Pre‐PMd | 6 | 235 | 6.04 | −28, −11, 60 | Left |
| Medial Frontal Gyrus | 6 | 4.3 | −7, −4, 53 | Left | |
| Medial Frontal Gyrus | 6 | 3.98 | 11, −4, 60 | Right | |
| IPS* | 40 | 205 | 5.66 | −35, −35, 46 | Left |
| IPL | 40 | 4.73 | −49, −28, 49 | Left | |
| IPS** | 40 | 189 | 5.32 | 35, −35, 46 | Right |
| IPL | 40 | 5.05 | 46, −28, 49 | Right | |
| Pre‐PMd | 6 | 69 | 4.96 | 32, −11, 63 | Right |
| OC Task > SR Task | |||||
| Cuneus | 18 | 116 | 4.65 | −7, −105, 11 | Left |
| Cuneus | 18 | 4.33 | −14, −98, 25 | Left | |
| Cuneus | 19 | 3.35 | −11, −88, 42 | Left | |
| Cuneus | 18 | 129 | 4.4 | 18, −98, 18 | Right |
| Cuneus | 19 | 4.34 | 18, −84, 39 | Right | |
| Cuneus | 19 | 4.1 | 21, −91, 32 | Right | |
| Lingual Gyrus | 19 | 32 | 3.97 | −7, −67, 0 | Left |
| Never applied > multi times applie | |||||
| IFJ | 9 | 27 | 4.23 | −46, 7, 21 | Left |
| Multi times applied > never applied | |||||
| Cuneus | 7 | 653 | 5.37 | −7, −70, 35 | Left |
| Cingulate Gyrus | 31 | 4.97 | −4, −39, 32 | Left | |
| Precuneus | 7 | 4.57 | 7, −60, 35 | Right | |
| Precuneus | 39 | 136 | 5.02 | −46, −70, 46 | Left |
Contrast names are written in bold. Multiple rows can belong to the same cluster.
IFJ, Inferior Frontal Junction; IPS, Intra Parietal Sulcus; IPL, Inferior Parietal Lobule; pre‐PMd, pre‐premotor dorsal.
*cluster includes left M1, ** cluster includes right M1.
Whole‐Brain Analysis
S–R task versus O–C task
First, we looked at the effect of the stimulus–response (S–R) and O–C task. For the S–R task versus O–C task, contrast activation was found in the left IPS (−35 −35 46) and right IPS (35 −35 46) that extended through the somatosensory cortex, in bilateral M1 (left M1, −53 −28 49 and right M1, 49 −25 53). Furthermore, bilateral pre‐PMd (left, −28 −11 60 and right, 32 −11 63) showed heightened activation for the S–R task (see Fig. 4A).
Figure 4.
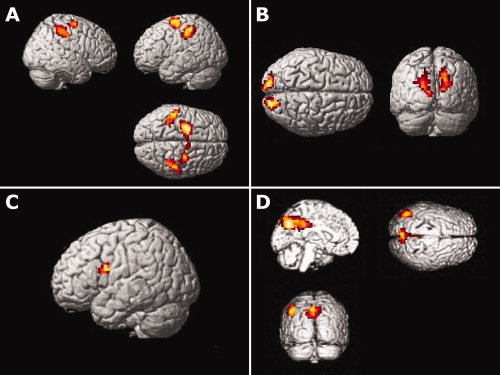
Panel A: Brain activation for the contrast SR task instructions > O–C task instructions. Panel B: Brain activation for the contrast O–C task instructions > SR task instructions. Panel C: Brain activation for the contrast never applied trials > multiple times applied trials. Panel D: Brain activation for the contrast multiple times applied trials > never applied trials. The significant threshold is Z = 3.1 in all four contrasts.
In the reversed contrast, O–C task versus S–R task, activation was predominantly found in the occipital lobe (Fig. 4B).
New instructions versus applied instructions
Next, we looked at the effect of applying instructions. In the contrast between the never‐applied trials versus the multiple times applied trials, there was only activation in an area that encompasses the left IFJ (−46 7 21, see Fig. 4C). In fact, the activation is slightly ventral to the classical IFJ coordinate (see Derrfuss et al. [ 2005]) and possibly includes Broca's area [Lindenberg et al., 2007; Papoutsi et al., 2009]. However, the activation extended dorsally into the IFJ. The inverse contrast revealed activation in left and right precuneus (−7 70 35 and 7 60 35) and the left angular gyrus (−46 −70 46, see Fig. 4D).
Brain Areas Specific to the Implementation of Newly Instructed S–R Mappings
No brain area showed activation for the interaction contrast of APPLICATIONS and TASK. This indicates that there is no brain area specifically active for newly instructed S–R mappings.
Percent Signal Change Analysis
We were mainly interested in the implementation of verbally instructed S–R mappings, and so we extracted the percent signal‐change data from areas found in the S–R task versus O–C task contrast (left IPS, right IPS, left pre‐PMd, right pre‐PMd, and M1). Moreover, to investigate whether or not the left IFJ is activated for novel instructions regardless of whether they convey S–R mappings or not, we also performed a percent signal‐change analysis on this area. A repeated‐measure ANOVA with factors TASK (S–R, O–C) × APPLICATIONS (never applied, multiple times applied) was computed for each region separately (see Fig. 5).
Figure 5.
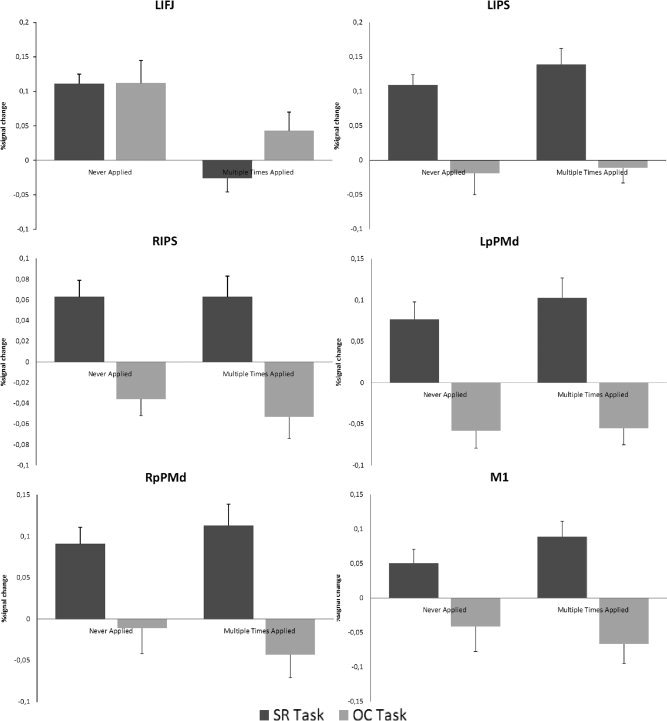
Percent signal change analysis for left IFJ (LIFJ), left IPS (LIPS), right IPS (RIPS), left pre‐PMd (LpPMd), right pre‐PMd (RpPMd), and M1. From left to right the bars represent: the never applied trials in the SR task (dark grey), the never applied trials in the O–C task (light gray), the multiple times applied trials in the SR task (dark grey), and the multiple times applied trials in the O–C task (light gray).
For the left IFJ, this revealed an significant main effect of APPLICATIONS, F(1,17) = 25.84, P < 0.001. The main effect of TASK was not significant nor was the interaction effect of TASK × APPLICATIONS, showing that never‐applied instructions induce heightened activation compared to multiple times instructed instructions, regardless of what type of information the instructions convey.
Both the left and right IPS showed heightened activation for S–R task instructions as is reflected in a main effect of TASK, F(1,17) = 23.90, P < 0.001 and F(1,17) = 22.63, P < 0.001 for left IPS and right IPS, respectively. Neither the main effect of APPLICATIONS nor the interaction effect of TASK × APPLICATIONS was significant. This shows that IPS is sensitive to instructed S–R mappings only, but that it does not differentiate between new or already implemented S–R mappings.
A similar pattern was found for the left and right pre‐PMd regions. Both showed a significant main effect of TASK, F(1,17) = 30.66, P < 0.001 (left pre‐PMd), and F(1.17) = 20.64, P < 0.001 (right pre‐PMd), indicating that heightened activity was induced by the S–R mapping instructions and not by the O–C mapping instructions. Furthermore, there was no significant main effect of APPLICATIONS or an interaction effect of TASK × APPLICATIONS. Both left and right pre‐PMd was insensitive to the fact that an instructed S–R mapping was already applied or not.
Finally, the percent signal‐change analysis for bilateral M1 revealed that it was more activated during S–R task instructions when compared with O–C task instructions, main effect of TASK, F(1,17) = 18.71, P < 0.001. There was no main effect of APPLICATIONS or an interaction effect of TASK × APPLICATIONS. Again, like IPS and pre‐PMd, M1 activation was only induced by S–R mapping instructions regardless of whether they were novel or frequently applied.
DISCUSSION
In this study, we have investigated the implementation process of verbally instructed R–S mappings. To do so, we developed a paradigm where participants had to learn and implement new S–R mappings. Furthermore, we compared the implementation of S–R mappings with the implementation of O–C mappings that have the same complexity but were lacking the response component. As hypothesized, novel S–R mappings instructions induce activity in the left IFJ. However, this was also the case for novel O–C mapping instructions, which indicate that the IFJ processes novel rule‐based information. Old instructions, regardless of whether they instruct S–R mappings or O–C mappings, induce activation predominantly in bilateral precuneus. The precuneus is linked with successful episodic memory retrieval, which enables current knowledge to be associated with past experiences [Cavanna and Trimble, 2006; Lundstrom et al., 2005]. In contrast from what was hypothesized, instructions that communicate S–R mappings regardless of whether they are new or implemented induce activity in bilateral IPS, pre‐PMd, and M1 when compared with O–C mappings. Finally, we found no interaction of novelty and task, indicating that no brain region is specifically responsible for the implementation of novel S–R mappings. Our data support the conclusion that instructed and implemented S–R mappings can be dissociated on the neural level [Brass et al., 2009]. However, the brain region that is involved in implementing new S–R rules is also involved in implementing new rules that are not response‐related. On the other hand, our data suggest that there is a highly specific network of brain regions for the implementation of S–R rules. But, this network is insensitive to the novelty of the rule.
Left IFJ and the Implementation of Verbal Instructions
The most consistent activation for the implementation of new verbal instructions was located in the left IFJ. This finding is consistent with Ruge and Wolfensteller [ 2010] who also found left IFJ activation in the first trials of newly instructed S–R mappings. However, our findings add two important aspects to the existing research. First, we can show that the IFJ is activated in the instruction phase of newly instructed S–R mappings when no target is presented yet. Furthermore, the left IFJ did not reveal a preference for the type of instruction given. Both S–R and O–C mappings induced left IFJ activity. The IFJ is an area that is commonly found in cognitive control tasks such as in task‐switching tasks, Stroop tasks, and n‐back tasks [Brass et al., 2005a; Derrfuss et al., 2005]. It has been argued that the common denominator in these tasks is the need for updating the relevant task representation [Brass et al., 2005a; Chikazoe et al., 2009; Derrfuss et al., 2005] and specifying the general task goal [Brass et al., 2005b]. However, while in cognitive control tasks, the IFJ was found to be active for repeated presentations of the same task rule, this study only found IFJ involvement for the first‐time implementation. On the first sight, this seems to be contradictory. However, we think that the reason for the repeated involvement of the IFJ in cognitive control is related to the interference that is present in these paradigms. Because the relevant task representation has to be always enforced against interference from irrelevant tasks representations, participants always have to re‐implement the rule (see Monsell et al. [ 2001]) for a similar explanation of the Stroop interference). Moreover, there is evidence that task updating is done via self instructions. For instance, a study by Goschke [ 2000] demonstrated that participants use verbal self‐instructions to prepare the upcoming task‐set [Goschke, 2000]. The location of the IFJ predisposes this area to be involved in self‐instruction and the representation of rule‐based information. It is located at the intersection of areas that are related to working memory (BA46, BA9), verbal production (BA44), and motor preparation (BA6). At the same time, the finding of IFJ involvement for the O–C mappings indicates that the IJF not only involved in updating rule information that is directly linked to specific responses. Rather, the IFJ seems to be related to information that guides future behavior in a more general sense.
It is crucial to mention that the maximum of the IFJ activation was located ventral to the location reported in previous studies [Derrfuss et al., 2005] and therefore might encompass the ventral PMC and parts of Broca's area [Lindenberg et al., 2007; Papoutsi et al., 2009]. This raises the possibility that the activation is related to the verbalization of behavioral rules. This interpretation is in our opinion not very plausible. First, the cluster of activation extended more dorsally (z coordinate = 29) and therefore also includes the typical IFJ region, which can be dissociated from Broca's area on the basis of functional and structural neuroanatomy [Brass et al., 2005a, b]. Second, the pattern of IFJ activation reported here is similar to the one, more typical IFJ region, reported by Ruge and Wolfensteller [ 2010]; showing a sharp decline of IFJ activation for the application of new S–R mappings when compared with S–R mappings that are already applied two or three times. In summary, the fact that the IFJ activity reported here shows the same activation pattern as is reported previously [Ruge and Wolfensteller, 2010] and includes the coordinates of the classical IFJ region let us believe that the updating rule information interpretation is preferred over the verbalization interpretation.
IPS and Motor Areas
Bilateral IPS, M1, and pre‐PMd showed heightened activation for the S–R task while being insensitive to the fact that these instructions were new or multiple times applied.
In the literature, IPS is considered an area important for sensory‐motor integration [Andersen and Buneo, 2002]. It is believed to bind information stemming from the sensory, cognitive, and motor domains [Gottlieb, 2007; Pouget et al., 2002]. Moreover, it is implied in forming higher‐order motor plans [Andersen and Buneo, 2002] and has a role in setting action goals, making it an area that could be on the top of the motor hierarchy [Tunik et al., 2007]. The interpretation that the IPS functions as a “bridge” between sensory, cognitive, and motor‐related information fits nicely with our results. It is this type of information that is present in the S–R task. Each instruction screen conveys a response rule that includes sensory information (e.g., stimulus representation of a cork) that is linked to motor information (e.g., press index finger). Regardless of whether such an S–R mapping is applied or not, the need for binding these different types of information remains. Therefore, unlike the IFJ, the IPS is not only activated for newly instructed S–R mappings but also for S–R mappings that have been applied. Indeed, in a previous imaging study investigating task preparation [Brass and von Cramon, 2004], it was argued that both IFJ and IPS were needed to prepare for the relevant task. It was hypothesized that the IFJ was involved in the updating of the general task goal but that the IPS provided the relevant S–R association needed to perform the task. However, in this previous study, both areas were always co‐activated making it hard to dissociate between the processes. In this study, we were able to confirm this hypothesis by showing dissociation in activation between the left IFJ and IPS. Interestingly, in a previous study investigating the application of instructed S–R mappings, the IPS showed a decline in activity over time. However, this area was located more posterior in the IPS than the area found in this study [Ruge and Wolfensteller, 2010]. Furthermore, we have shown constant involvement of anterior IPS for both new and old S–R mapping instructions but not for O–C mapping instructions. In the previous study, only instructed S–R mappings were considered making it difficult to locate this anterior IPS activation.
Pre‐PMd and M1
Picard and Strick [ 2001] argued that the PMC can be divided into multiple subregions including the dorsal part of the PMC (PMd) and pre‐PMd. Because the pre‐PMd is connected to the prefrontal cortex but does not project to M1 and the spinal cord, it is argued that this region is not involved in direct motor control, but more with cognitive, sensory, or motivational input of motor behavior such as response selection and setting up conditional visuo‐motor associations [Mars et al., 2008; Picard and Strick, 2001]. In addition, the reported pre‐PMd location here seems to encompass both the PMdr and PMdc areas as defined by Simon and colleagues [ 2002]. They argue that PMdr is responsible for the maintenance of visuospatial information relevant for action while the PMdc is related to motor preparation [Simon et al., 2002]. Furthermore, in a study investigating the difference between motor execution, preparation, and imagery, pre‐PMd was found predominantly active in motor imagery [Hanakawa et al., 2008]. One could speculate that motor imagery is a process that could be well suited for the implementation of instructed responses [Ruge and Wolfensteller, 2010], and future research should investigate this in more detail.
Finally, bilateral M1 was recruited when instructions conveyed S–R mappings. M1 is an area typically linked with motor execution and preparation [Hanakawa et al., 2008]. There was no increase in activation when these S–R mappings were applied multiple times. It is commonly thought that responding to a stimulus repeatedly forms a memory trace that has direct access to the motor code [Logan, 1988; Waszak et al., 2008]. Our data suggest that receiving an S–R mapping instruction generates a motor code from the very first trial.
CONCLUSION
In this study, we investigated the neural substrates of the implementation process of verbally instructed behavior. It is shown that processing instructions conveying S–R mapping involve a network of brain areas, including pre‐PMd, M1, and IPS. Only the left IFJ was sensitive to the novelty of instructions. However, this area was not sensitive to the type of information that was instructed. Therefore, we conclude that the implementation of verbal instructions results from an interplay of brain areas that represent rulelike information in domain general terms and brain areas that are specific to S–R rules.
In summary, this study sets the stage for a new line of research, investigating the transformation of instructions into actions. In particular, more work needs to be done to determine the exact roles of the indentified brain regions. Furthermore, the exact nature of the implementation process of instructions into actions remains to be clarified.
Acknowledgements
This work was supported by a special research fund (BOF grant 01Z05306, University of Ghent).
REFERENCES
- Andersen RA, Buneo CA ( 2002): Intentional maps in posterior parietal cortex. Annu Rev Neurosci 25: 189–220. [DOI] [PubMed] [Google Scholar]
- Brass M, von Cramon DY ( 2004): Decomposing components of task preparation with functional magnetic resonance imaging. J Cogn Neurosci 16: 609–620. [DOI] [PubMed] [Google Scholar]
- Brass M, Derrfuss J, Forstmann B, von Cramon DY ( 2005a): The role of the inferior frontal junction area in cognitive control. Trends Cogn Sci 9: 314–316. [DOI] [PubMed] [Google Scholar]
- Brass M, Ullsperger M, Knoesche TR, von Cramon DY, Phillips NA ( 2005b): Who comes first? The role of the prefrontal and parietal cortex in cognitive control. J Cogn Neurosci 17: 1367–1375. [DOI] [PubMed] [Google Scholar]
- Brass M, Wenke D, Spengler S, Waszak F ( 2009): Neural correlates of overcoming interference from instructed and implemented stimulus‐response associations. J Neurosci 29: 1766–1772. [DOI] [PMC free article] [PubMed] [Google Scholar]
- Cavanna AE, Trimble MR ( 2006): The precuneus: A review of its functional anatomy and behavioural correlates. Brain 129: 564–583. [DOI] [PubMed] [Google Scholar]
- Chikazoe J, Jimura K, Asari T, Yamashita K, Morimoto H, Hirose S, Miyashita Y, Konishi S ( 2009): Functional dissociation in right inferior frontal cortex during performance of Go/No‐Go task. Cereb Cortex 19: 146–152. [DOI] [PubMed] [Google Scholar]
- De Houwer J ( 2004): Spatial Simon effects with nonspatial responses. Psychonom Bull Rev 11: 49–53. [DOI] [PubMed] [Google Scholar]
- De Houwer J, Beckers T, Vandorpe S, Custers R ( 2005): Further evidence for the role of mode‐independent short‐term associations in spatial Simon effects. Percept Psychophys 67: 659–666. [DOI] [PubMed] [Google Scholar]
- Derrfuss J, Brass M, Neumann J, von Cramon DY ( 2005): Involvement of the inferior frontal junction in cognitive control: Meta‐analyses of switching and stroop studies. Human Brain Mapp 25: 22–34. [DOI] [PMC free article] [PubMed] [Google Scholar]
- Duncan J, Parr A, Woolgar A, Thompson R, Bright P, Cox S, Bishop S, Nimmo‐Smith I ( 2008): Goal neglect and Spearman's g: Competing parts of a complex task. J Exp Psychol Gen 137: 131–148. [DOI] [PubMed] [Google Scholar]
- Goschke T ( 2000): Involuntary persistence and intentional reconfiguration in task‐set switching In: Monsell S, Driver J, editors. Attention and Performance XVIII: Control of Cognitive Processes. Cambridge: MIT Press; pp 331–355. [Google Scholar]
- Gottlieb J ( 2007): From thought to action: The parietal cortex as a bridge between perception, action, and cognition. Neuron 53: 9–16. [DOI] [PubMed] [Google Scholar]
- Grol MJ, de Lange FP, Verstraten FAJ, Passingham RE, Toni I ( 2006): Cerebral changes during performance of overlearned arbitrary visuomotor associations. J Neurosci 26: 117–125. [DOI] [PMC free article] [PubMed] [Google Scholar]
- Hanakawa T, Dimyan MA, Hallett M ( 2008): Motor planning, imagery, and execution in the distributed motor network: A time‐course study with functional MRI. Cereb Cortex 18: 2775–2788. [DOI] [PMC free article] [PubMed] [Google Scholar]
- Lindenberg R, Fangerau H, Seitz RJ ( 2007): “Broca's area” as a collective term? Brain Lang 102: 22–29. [DOI] [PubMed] [Google Scholar]
- Logan GD ( 1988): Toward an instance theory of automatization. Psychol Rev 95: 492–527. [Google Scholar]
- Loh M, Pasupathy A, Miller EK, Deco G ( 2008): Neurodynamics of the prefrontal cortex during conditional visuomotor associations. J Cogn Neurosci 20: 421–431. [DOI] [PubMed] [Google Scholar]
- Lundstrom BN, Ingvar M, Petersson KM ( 2005): The role of precuneus and left inferior frontal cortex during source memory episodic retrieval. Neuroimage 27: 824–834. [DOI] [PubMed] [Google Scholar]
- Luria AR, Teuber H‐L, Haigh B ( 1980): Higher Cortical Functions in Man, Vol. XXII New York, NY: Basic Books; 634 p. [Google Scholar]
- Mars RB, Coles MGH, Huistijn W, Toni I ( 2008): Delay‐related cerebral activity and motor preparation. Cortex 44: 507–520. [DOI] [PubMed] [Google Scholar]
- Monsell S, Taylor TJ, Murphy K ( 2001): Naming the color of a word: Is it responses or task sets that compete? Mem Cogn 29: 137–151. [DOI] [PubMed] [Google Scholar]
- Oldfield RC ( 1971): Assessment and analysis of handedness—Edinburgh inventory. Neuropsychologia 9: 97–113. [DOI] [PubMed] [Google Scholar]
- Papoutsi M, de Zwart JA, Jansma JM, Pickering MJ, Bednar JA, Horwitz B ( 2009): From phonemes to articulatory codes: An fMRI study of the role of Broca's area in speech production. Cereb Cortex 19: 2156–2165. [DOI] [PMC free article] [PubMed] [Google Scholar]
- Passingham RE, Toni I, Rushworth MFS ( 2000): Specialisation within the prefrontal cortex: The ventral prefrontal cortex and associative learning. Exp Brain Res 133: 103–113. [DOI] [PubMed] [Google Scholar]
- Picard N, Strick PL ( 2001): Imaging the premotor areas. Curr Opin Neurobiol 11: 663–672. [DOI] [PubMed] [Google Scholar]
- Pouget A, Deneve S, Duhamel JR ( 2002): A computational perspective on the neural basis of multisensory spatial representations. Nat Rev Neurosci 3: 741–747. [DOI] [PubMed] [Google Scholar]
- Ruge H, Wolfensteller U ( 2010): Rapid formation of pragmatic rule representations in the human brain during instruction‐based learning. Cereb Cortex 20: 1656–1667. [DOI] [PubMed] [Google Scholar]
- Severens E, Van Lommel S, Ratinckx E, Hartsuiker RJ ( 2005): Timed picture naming norms for 590 pictures in Dutch. Acta Psychol 119: 159–187. [DOI] [PubMed] [Google Scholar]
- Simon SR, Meunier M, Piettre L, Berardi AM, Segebarth CM, Boussaoud D ( 2002): Spatial attention and memory versus motor preparation: Premotor cortex involvement as revealed by fMRI. J Neurophysiol 88: 2047–2057. [DOI] [PubMed] [Google Scholar]
- Toni I, Ramnani N, Josephs O, Ashburner J, Passingham RE ( 2001a): Learning arbitrary visuomotor associations: Temporal dynamic of brain activity. Neuroimage 14: 1048–1057. [DOI] [PubMed] [Google Scholar]
- Toni I, Rushworth MFS, Passingham RE ( 2001b): Neural correlates of visuomotor associations—Spatial rules compared with arbitrary rules. Exp Brain Res 141: 359–369. [DOI] [PubMed] [Google Scholar]
- Tunik E, Rice NJ, Hamilton A, Grafton ST ( 2007): Beyond grasping: Representation of action in human anterior intraparietal sulcus. Neuroimage 36: T77–T86. [DOI] [PMC free article] [PubMed] [Google Scholar]
- Vygotskij L, Veer Rvd, Valsiner J, Prout T ( 1994): The Vygotsky Reader. Oxford: Blackwell. [Google Scholar]
- Waszak F, Wenke D, Brass M ( 2008): Cross‐talk of instructed and applied arbitrary visuomotor mappings. Acta Psychol 127: 30–35. [DOI] [PubMed] [Google Scholar]
- Wenke D, Frensch PA ( 2005): The influence of task instruction on action coding: Constraint setting or direct coding? J Exp Psychol‐Hum Percept Perform 31: 803–819. [DOI] [PubMed] [Google Scholar]
- Wenke D, Gaschler R, Nattkemper D ( 2007): Instruction‐induced feature binding. Psychol Res‐Psychol Forschung 71: 92–106. [DOI] [PubMed] [Google Scholar]