

Abstract
To clarify the characteristics of interhemispheric connections, we investigated cortico‐cortical evoked potentials (CCEP) in human. Fourteen patients with temporal lobe epilepsy who underwent invasive EEG monitoring with bilaterally implanted subdural electrodes were studied. Electric pulse stimuli were given in a bipolar fashion at two adjacent electrodes on and around the motor area (MA) or sensory area (SA), and CCEP responses were recorded by averaging electrocorticograms from the contralateral hemisphere. Seventy‐two pairs of electrodes were stimulated, and 468 recordings were analyzed. Fifty‐one of 468 recordings demonstrated CCEP responses. Of 51 responses, 16 consisted of an initial positive triphasic wave (Type 1), 27 had an initial negative biphasic wave (Type 2), and 8 showed an initial positive biphasic wave (type 3). The mean latencies of the earliest peaks were 13.1, 28.9, and 29.4 ms in Types 1, 2, and 3 responses, respectively. The responses were more frequently evoked by stimulating facial MA (f‐MA) and nonfacial MA (nf‐MA) than by stimulating SA or noneloquent area. In both f‐MA and nf‐MA stimulation, the responses were more frequently recorded at the contralateral f‐MA than at the contralateral nf‐MA or other areas. SA stimulation never evoked CCEP responses at the contralateral MA or SA. The amplitudes were maximal when f‐MA was stimulated and responses recorded at the contralateral f‐MA. These findings suggest that the interhemispheric connections are uneven. Both f‐MA and nf‐MA send dense interhemispheric connections to the contralateral f‐MA. SA may have no or only rare direct connection with the contralateral MA or SA. Hum Brain Mapp, 2012. © 2011 Wiley Periodicals, Inc.
Keywords: neural networks, corpus callosum, human brain, primary motor cortex, primary sensory cortex, intracranial recording, subdural electrode, functional mapping, evoked potentials, epilepsy
INTRODUCTION
Neural connections in the human brain have attracted interest recently, and human neural pathways have been demonstrated by MRI studies [Mori et al.,2000]. Electrophysiologically, these connections may also be examined by cortico‐cortical evoked potential (CCEP) studies [Brugge et al.,2003; Greenlee et al.,2004; Matsumoto et al.,2004,2005,2007; Rutecki et al.,1989; Terada et al.,2008; Umeoka et al.,2009; Wilson et al.,1990,1991].
Previously, we recorded CCEP responses from the contralateral hemisphere by stimulating facial motor area (f‐MA) in three epilepsy patients [Terada et al.,2008]. Our result demonstrated that most of these interhemispheric CCEP responses showed initial positive triphasic waveforms (P1‐N1‐P2). P1 had 1 or 2 notches, although P1 was absent in two of eight responses. The latency of P1 ranged 9.2 to 23.8 ms. The response was not evoked when non‐motor area (non‐MA) was stimulated, while stimulation of the motor area (MA) evoked CCEP responses at both MA and non‐MA electrodes in the contralateral hemisphere. Therefore, we speculate that the stimulation produces one‐way volley, and that orthodromic impulses may play an important role for this CCEP response. Regarding the location relationship between stimulation and response, stimulation of upper areas evoked responses recorded from the upper areas, while stimulation of lower areas produced responses recorded from the lower areas. These findings suggest that the neural connections may project to contralateral homonymous areas. However, our previous study examined only a small number of patients and evaluated only the f‐MA. Therefore, we were not able to characterize the interhemispheric connections between bilateral MA more precisely.
In this study, we evaluated 468 CCEP recordings from 14 epilepsy patients to clarify the characteristics of interhemispheric neural connections arising from the MA. Furthermore, we also succeeded to stimulate the sensory area (SA) and evaluated interhemispheric connections originating from the SA.
SUBJECTS AND METHODS
Subjects, Electrodes Implantation, and Functional Mapping
The data were obtained from 14 patients with medically intractable temporal lobe epilepsy (5 men and 9 women, aged 16–43 years) (Table I). The Institutional Review Board approved this study, and informed consent was obtained from all patients. Interictal neurological examinations detected no focal neurological abnormalities in all patients. Routine noninvasive evaluations including MRI, SPECT, and scalp EEG/video monitoring failed to determine the epileptogenic zone. Therefore, these patients underwent long‐term invasive EEG/video monitoring with chronically implanted subdural and depth electrodes as a part of presurgical evaluation [Mihara and Baba,2001].
Table I.
Number of electrodes identifying eloquent areas by standard cortical stimulations, and number of electrodes recording CCEP responses for each area stimulated
| Pt. | Sex/ age | Standard cortical stimulation | Cortico‐cortical evoked potential study | |||||||||||||||||
|---|---|---|---|---|---|---|---|---|---|---|---|---|---|---|---|---|---|---|---|---|
| Stimulated area | ||||||||||||||||||||
| Number of electrodes identifying eloquent areas | f‐MA | nf‐MA | SA | NEA | ||||||||||||||||
| Number of electrodes recording CCEP in each area | ||||||||||||||||||||
| f‐MA | nf‐MA | SA | f‐MA | nf‐MA | SA | NEA | f‐MA | nf‐MA | SA | NEA | f‐MA | nf‐MA | SA | NEA | f‐MA | nf‐MA | SA | NEA | ||
| 1 | F/36 | 2 | 2 | 6 | ||||||||||||||||
| 2 | F/32 | 2 | 2 | 1 | 1 | 4 | 1 | 1 | 4 | 8 | 8 | 44 | ||||||||
| 3 | M/29 | 2 | 4 | 8 | ||||||||||||||||
| 4 | M/36 | 3 | 4 | 8 | ||||||||||||||||
| 5 | F/21 | 3 | 4 | 8 | 2 | 2 | ||||||||||||||
| 6 | F/21 | 1 | 1 | 4 | 4 | 1 | 1 | 17 | ||||||||||||
| 7 | M/21 | 4 | 2 | 4 | 2 | 6 | 2 | 1 | 3 | 4 | 2 | 6 | ||||||||
| 8 | F/22 | 5 | ||||||||||||||||||
| 9 | F/43 | 6 | 2 | 8 | 4 | 18 | 8 | 12 | 14 | 6 | 30 | |||||||||
| 10 | M/35 | 2 | 3 | 2 | 3 | 5 | 2 | 3 | 5 | 1 | 2 | 1 | ||||||||
| 11 | F/34 | 4 | 2 | 4 | 12 | 4 | 4 | 8 | 8 | 32 | ||||||||||
| 12 | F/29 | 1 | 4 | 2 | 4 | 8 | 2 | 8 | 20 | |||||||||||
| 13 | F/16 | 4 | 2 | 6 | 4 | 8 | 2 | 4 | 4 | 2 | 6 | |||||||||
| 14 | M/23 | 10 | ||||||||||||||||||
Pt, patient number; M, male; F, female; f‐MA, facial motor area; nf‐MA, nonfacial motor area; SA, somatosensory area; NEA, noneloquent area.
Each subdural electrode was 2.3 mm in diameter and made of platinum‐iridium alloy. The center‐to‐center inter‐electrode distance was 10 mm. The locations and the numbers of subdural and depth electrodes implanted were standardized (see Fig. 1) [Mihara and Baba,2001]. Briefly, two bundles of depth electrodes were inserted targeting the amygdala and hippocampus on each side. A subdural plate (2 × 6) was slipped under the basal temporal lobe on each side. To detect epileptiform activities of extra‐temporal areas, a subdural strip (1 × 6) was placed to cover the anterior temporal region (AT), and four strips were slipped radially from the burr hole to cover the temporo‐central (TC), temporo‐parietal (TP), parieto‐occipital (PO), and temporo‐occipital regions (TO). All bundles, plates, and strips were placed almost symmetrically on both sides. The tip electrode of each bundle was designated “1,” and the number was increased in order up to “6” for the most proximal electrodes.
Figure 1.
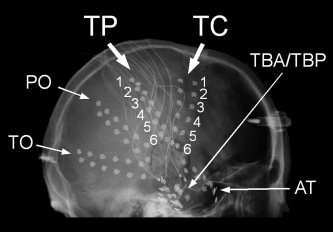
X‐ray image showing the standardized locations of subdural electrodes. Subdural plates (2 × 6; TBA and TBP) cover basal temporal regions, and 5 subdural strips (1 × 6) cover extratemporal areas on each side (AT, anterior temporal; TC, temporo‐central; TP, temporo‐parietal; PO, parieto‐occipital; and TO, temporo‐occipital). Plates and strips were placed almost symmetrically on both sides. The tip electrode of each bundle was designated “1,” and the number is increased in order up to “6” for the most proximal electrode.
Standard cortical stimulation was performed [Lesser and Gordon,2000] to determine the MA, SA, and other eloquent areas. A constant‐current biphasic square electric pulse with a duration of 0.3 ms and frequency of 50 Hz was delivered for 1 to 5 sec (SEN‐3301/SSI04J, Nihon Koden Corp., Tokyo). When pure motor or sensory response was evoked upon stimulation of an electrode, the electrode was defined as MA or SA. If both motor and sensory responses were observed at a single electrode, such electrode was excluded from further CCEP analysis in this study. The f‐MA (MA of mouth, tongue, or face) and nonfacial MA (nf‐MA; MA of finger or hand) were analyzed separately because CCEP responses of these areas have different characteristics.
The locations of electrodes were also anatomically confirmed by using 3D reconstruction MRI imaging (MRICro: “http://www.cabiatl.com/mricro/) in each patient. Electrodes locating on the precentral gyrus were defined as MA‐MRI, and electrodes on the postcentral gyrus were defined as SA‐MRI. When electrodes were not on the precentral or postcentral gyri, they were named NEA‐MRI.
Stimulation and Data Acquisition for CCEP
CCEP recordings were performed after clinical evaluations were completed, and therefore did not interfere with clinical evaluations. All CCEP recordings were performed while the patients were awake and sitting in bed.
For CCEP recording, we conducted stimulation by applying the same parameters as in the previous reports [Terada et al.,2008; Umeoka et al.,2009]. Briefly, the electrical stimulation consisted of a constant‐current square pulse at a duration of 0.3 ms with a frequency of 1 Hz in alternating polarity (SEN‐3301/SSI04J, Nihon Koden Corp., Tokyo). Two adjacent electrodes were stimulated in bipolar fashion. As we analyzed f‐MA, nf‐MA, and SA stimulations separately, we did not use the responses evoked by simultaneous stimulation of different eloquent areas; e.g., stimulation of an electrode pair covering f‐MA and nf‐MA. For the same reason, we did not use the responses evoked by stimulation of an electrode pair covering MA‐MRI and SA‐MRI. For comparison, not only eloquent areas, but also noneloquent areas (NEA) were stimulated for CCEP recording. The current intensity was set at 80% of the intensity that produced clinical signs or after‐discharges during standard cortical stimulation for eloquent areas. For NEA, 80% of the maximal intensity employed in cortical stimulation was used. Even using lower stimulus intensity, patients sometimes demonstrated clinical responses during CCEP recording. In such cases, we decreased the intensity until no clinical response was observed. No clinical seizure occurred during CCEP recordings.
For CCEP recording, an evoked potential machine was used (Neuropack sigma, Nihon Koden Corp., Tokyo). Sampling rate was set at 5,000–10,000 Hz. The low frequency filter was set at 10 Hz, and the high frequency filter at 2,000–5,000 Hz depending on the sampling rate. Electrocorticograms were recorded with reference to a subdural electrode placed on a noneloquent indifferent area. For CCEP recording, 20 to 50 electrocorticographic responses were averaged and time‐locked to the stimulus.
For statistical analyses, chi‐square test and t‐test were used (StatMate III, Advanced Technology for Medicine & Science, Tokyo).
RESULTS
Cortical stimulation identified the f‐MA (28 electrodes), nf‐MA (8 electrodes), and SA (16 electrodes including 8 electrodes for facial SA and 8 electrodes for nonfacial SA) in 14 patients (Table I). All these eloquent areas were detected by stimulating electrodes of the TC or TP strips (see Fig. 1). Therefore, CCEP were evaluated by stimulating TC or TP electrodes and recording from the contralateral TC or TP electrodes. As transcallosal CCEP responses were well recognized at the contralateral homologous area in the previous study [Terada et al.,2008], the homonymous electrodes and their contiguous electrodes were mainly selected as recording sites. Because of time pressure, not all pairs could be examined. Finally, we stimulated a total of 72 pairs of electrodes, and 468 recordings were evaluated (Table I). Of 468 recordings, 51 demonstrated definitive CCEP responses and were used in subsequent analyses.
Waveforms
As reported previously, initial positive triphasic waves (P1‐N1‐P2) were recorded from the contralateral hemisphere (Figs. 2, 3, 4; Type 1 response). Type 1 responses were found in 16 recordings; 12 by f‐MA stimulation, 2 by SA stimulation, and 2 by NEA stimulation. The recorded sites were the f‐MA (seven responses), SA (one response), and NEA (eight responses). The mean onset latency was 5.2 ms [standard deviation (SD): 1.0], and the mean latencies of P1, N1, and P2 were 13.1 ms (SD: 3.3), 30.1 ms (SD: 2.9), and 56.9 ms (SD: 7.9), respectively. The mean amplitude was 16.0 μV (SD: 8.7) from onset to P1, 77.3 μV (SD: 59.4) from P1 to N1, and 107.9 μV (SD: 72.2) from N1 to P2. A notch was seen superimposing on P1 in all Type 1 responses except one, in which 2 notches were detected (see Fig. 3).
Figure 2.
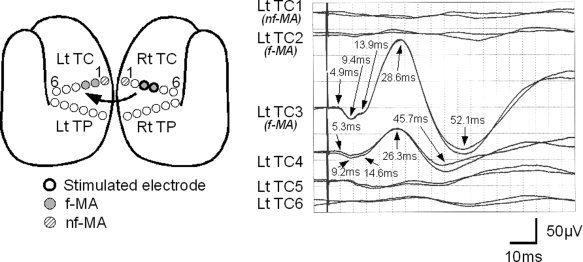
Typical Type 1 response observed in Patient 7. The schematic figure shows the location of eloquent area and the stimulated electrodes. Bold circles signify the stimulated electrodes. Gray circles indicate electrodes located over facial motor area (f‐MA), and hatched circles over nonfacial motor area (nf‐MA). Two waveforms are displayed in each channel to confirm their reproducibility. CCEP responses were evoked by stimulating f‐MA (Rt TC3/4), and were recorded from contralateral electrodes. The third and fourth channels (Lt TC3 on f‐MA and Lt TC4 on noneloquent area) demonstrate initial positive triphasic waveforms. Although there may be responses at the fifth and sixth channels, they are not analyzed in this study because they are too small.
Figure 3.
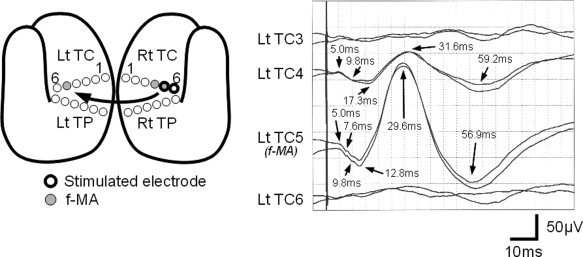
Type 1 response observed in Patient 5. The schematic figure shows the location of eloquent area and the stimulated electrodes. Bold circles signify the stimulated electrodes. Gray circles indicate electrodes located over facial motor area (f‐MA). Two waveforms are displayed in each channel to confirm their reproducibility. CCEP responses were evoked by stimulating an electrodes pair including f‐MA (Rt TC5), and were recorded from contralateral electrodes. The second and third channels (Lt TC4 on noneloquent area and Lt TC5 on f‐MA) demonstrate initial positive triphasic waveforms.
Figure 4.
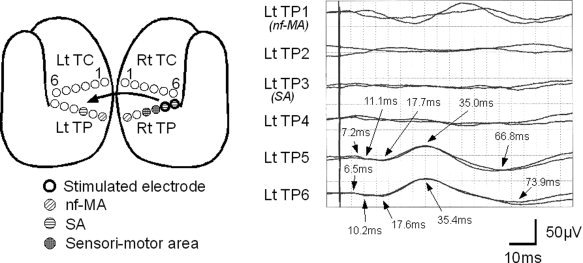
Type 1 response observed in Patient 10. The schematic figure shows the location of eloquent area and the stimulated electrodes. In addition to the symbols described in Figure 2, sensory area (SA; circle with horizontal lines) and sensori‐motor area (circle with crossed lines) are demonstrated. CCEP responses were evoked by stimulating SA (Rt TP5/6), and were recorded from contralateral electrodes. The fifth and sixth channels (Lt TP5/6 on noneloquent area) demonstrate initial positive triphasic waveforms. Although the first channel may show some response, it is not used in subsequent analysis because it is not reproducible.
In 27 recordings, initial negative biphasic waves (N1‐P2) were observed (Fig. 5; Type 2 response). Type 2 responses were obtained by f‐MA stimulation (16 responses), nf‐MA stimulation (6 responses), and NEA stimulation (5 responses). The recorded sites were the f‐MA (9 responses), nf‐MA (1 response), SA (1 response), and NEA (16 responses). The mean onset latency was 11.1 ms (SD: 3.7), and latencies of N1 and P1 were 28.9 ms (SD: 5.0) and 52.5 ms (SD: 8.9), respectively. The mean amplitude was 27.5 μV (SD: 17.2) from onset to N1, and 49.1 μV (SD: 27.4) from N1 to P2. In 7 of 27 responses, a notch was seen superimposing on N1 (see Fig. 5). This notch was observed when stimulating f‐MA (4 responses), nf‐MA (1 response), or NEA (2 responses), and recorded at f‐MA (3 responses) or NEA (4 responses).
Figure 5.
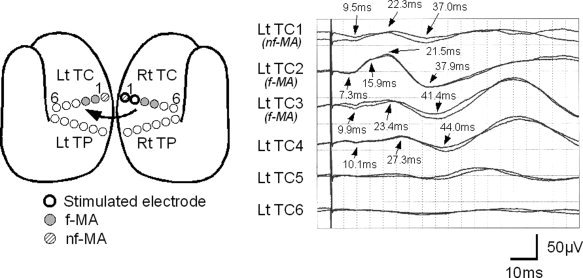
Typical Type 2 responses observed in Patient 7. The schematic figure shows the location of eloquent area and the stimulated electrodes (see Fig. 2 for explanation). CCEP responses are evoked by stimulating nonfacial motor area (nf‐MA; Rt TC1) and noneloquent area (NEA; Rt TC2), and were recorded from contralateral electrodes. The first, second, third, and fourth channels (Lt TC1 on nf‐MA, Lt TC2/3 on facial motor area [f‐MA] and Lt TC4 on NEA) demonstrate initial negative biphasic waveforms. At Lt TC2, the initial negative peak (N1) has a notch at 15.9 ms.
In addition, initial positive biphasic waveforms (P1′‐N1′) were identified in 8 recordings (Fig. 6; Type 3 response). Type 3 responses were obtained by f‐MA stimulation (four responses), nf‐MA stimulation (one responses), or NEA stimulation (three responses), and recorded at f‐MA (five responses), nf‐MA (two responses), or NEA (one response). The mean latencies of onset, P1′ and N1′ were 17.0 ms (SD: 6.0), 29.4 ms (SD: 4.5), and 49.4 ms (SD: 5.7), respectively. The mean amplitude was 20.9 μV (SD: 10.9) from onset to P1′, and 34.6 μV (SD: 16.5) from P1′ to N1′.
Figure 6.
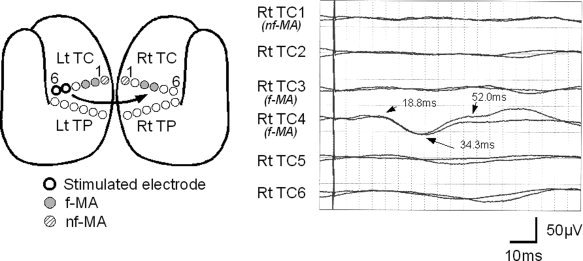
Typical Type 3 responses observed in Patient 7. The schematic figure shows the location of eloquent area and the stimulated electrodes (see Fig. 2 for explanation). CCEP responses are evoked by stimulating noneloquent area (NEA; Lt TC5/6), and were recorded from contralateral electrodes. The fourth channel (Rt TC4 on facial motor area [f‐MA]) demonstrates an initial positive biphasic waveform.
Statistical Analysis
Comparison among stimulation and recording sites
Chi‐square test was used to analyze the effect of the stimulation site. The analysis demonstrated that the stimulating site affected the positive CCEP response rate (P < 0.001). In each comparison between eloquent sites, a significant difference was observed between f‐MA and SA (P < 0.001), between f‐MA and NEA (P < 0.001), between nf‐MA and SA (P < 0.001), and between nf‐MA and NEA (P < 0.001) (Table II). These findings thus suggested that f‐MA stimulation and nf‐MA stimulation evoked contralateral hemispheric CCEP responses more frequently than SA stimulation or NEA stimulation.
Table II.
Number of trials and responses recorded from stimulation of pairs of electrodes (for cortical stimulation‐defined eloquent areas)
| Stimulation | Recording | Number of trials | CCEP response | Mean response rate per stimulation area | Response type | |||
|---|---|---|---|---|---|---|---|---|
| Number | % | Type 1 | Type 2 | Type 3 | ||||
| f‐MA | f‐MA | 27 | 15 | 55.6a | 29.1b | 7 | 5 | 3 |
| nf‐MA | 7 | 1 | 14.3 | 1 | ||||
| SA | 8 | 1 | 12.5 | 1 | ||||
| NEA | 68 | 15 | 22.1 | 5 | 10 | |||
| nf‐MA | f‐MA | 5 | 4 | 80.0a | 25.0b | 3 | 1 | |
| nf‐MA | 4 | 1 | 25.0 | 1 | ||||
| SA | 3 | 0 | 0 | |||||
| NEA | 16 | 2 | 12.5 | 2 | ||||
| SA | f‐MA | 14 | 0 | 0 | 2.9 | |||
| nf‐MA | 2 | 0 | 0 | |||||
| SA | 9 | 0 | 0 | |||||
| NEA | 43 | 2 | 4.7 | 2 | ||||
| NEA | f‐MA | 43 | 2 | 4.7 | 3.8 | 1 | 1 | |
| nf‐MA | 13 | 1 | 7.7 | 1 | ||||
| SA | 25 | 1 | 4.0 | 1 | ||||
| NEA | 181 | 6 | 3.3 | 1 | 4 | 1 | ||
f‐MA, facial motor area; nf‐MA, nonfacial motor area; SA, somatosensory area; NEA, noneloquent area.
Significantly higher rate compared with SA (P < 0.05), and NEA recording (P < 0.005).
Significantly higher rate compared with SA stimulation (P < 0.001) and NEA stimulation (P < 0.001).
Chi‐square analysis on the effect of the recording site demonstrated that the recording site was important for a positive contralateral CCEP response for f‐MA and nf‐MA stimulations (P < 0.01 and P < 0.05, respectively), but had no significant effect for SA and NEA stimulations (Table II). For f‐MA stimulation, a significant difference in positive CCEP response was found between f‐MA and SA recordings (P < 0.05) and between f‐MA and NEA recordings (P < 0.005). For nf‐MA stimulation, a significant difference was also observed between f‐MA and SA recordings (P < 0.05) and between f‐MA and NEA recordings (P < 0.005). These data suggested that both f‐MA and nf‐MA stimulations tended to evoke contralateral CCEP responses at the f‐MA.
The same statistical analysis was performed among MA‐MRI, SA‐MRI, and NEA‐MRI (Table III). The statistical analysis demonstrated that the stimulating site affected the positive CCEP response rate (P < 0.001). In each comparison between eloquent sites, a significant difference was observed between MA‐MRI and SA‐MRI (P < 0.001), between MA‐MRI and NEA‐MRI (P < 0.001), and between SA‐MRI and NEA‐MRI (P < 0.01) (Table III). These findings indicated that both MA‐MRI stimulation and SA‐MRI stimulation evoked contralateral hemispheric CCEP responses more frequently than NEA‐MRI stimulation, and that MA‐MRI stimulation evoked the responses much more frequently than SA‐MRI stimulation.
Table III.
Number of trials and responses recorded from stimulation of pairs of electrodes (for MRI‐defined eloquent areas)
| Stimulation | Recording | Number of trials | CCEP response | Mean response rate per stimulation area | Response type | |||
|---|---|---|---|---|---|---|---|---|
| Number | % | Type 1 | Type 2 | Type 3 | ||||
| MA‐MRI | MA‐MRI | 53 | 19 | 35.8a | 25.4b | 5 | 10 | 4 |
| SA‐MRI | 29 | 8 | 27.6 | 3 | 5 | |||
| NEA‐MRI | 56 | 8 | 14.3 | 4 | 4 | |||
| SA‐MRI | MA‐MRI | 45 | 7 | 15.6 | 8.8c | 3 | 2 | 2 |
| SA‐MRI | 38 | 3 | 7.9 | 1 | 2 | |||
| NEA‐MRI | 64 | 3 | 4.7 | 2 | 1 | |||
| NEA‐MRI | MA‐MRI | 47 | 1 | 2.1 | 1.8 | 1 | ||
| SA‐MRI | 34 | 1 | 2.9 | 1 | ||||
| NEA‐MRI | 83 | 1 | 1.2 | 1 | ||||
MA‐MRI, motor area defined by MRI imaging; SA‐MRI, somatosensory area defined by MRI imaging; NEA‐MRI, noneloquent area defined by MRI imaging.
Significantly higher rate compared with NEA‐MRI recording (P < 0.01).
Significantly higher rate compared with SA‐MRI stimulation (P < 0.001) and NEA‐MRI stimulation (P < 0.001).
Significantly higher rate compared with NEA‐MRI stimulation (P < 0.01).
The statistical analysis on the effect of the recording site demonstrated that the recording site was important for a positive contralateral CCEP response only for MA‐MRI (P < 0.05) (Table III). For MA‐MRI stimulation, a significant difference in positive CCEP response was found between MA‐MRI and NEA‐MRI recordings (P < 0.01). These data also suggested that MA stimulation tended to evoke contralateral CCEP responses at the MA.
Comparisons of latencies and amplitudes
The latencies and the amplitudes were analyzed statistically using t‐test, for each waveform type (Tables IV, V, VI). Because of the limited data available, not all comparisons were possible. Therefore, comparisons of waveform parameters were performed only between f‐MA recording with contralateral f‐MA stimulation (the most frequently recorded and the most prominent waveforms obtained in this study) versus all other stimulation/recording patterns.
Table IV.
Amplitudes and latencies of major wave components in Type 1 responses
| Latency ± SD (ms) | Amplitude ± SD (μV) | |||||||
|---|---|---|---|---|---|---|---|---|
| Stimulation | Recording | Onset | P1 | N1 | P2 | P1 | N1 | P2 |
| f‐MA | f‐MA | 4.8 ± 0.7 | 11.9 ± 2.8 | 29.4 ± 2.0 | 56.0 ± 4.7 | 22.3 ± 7.5a | 119.7 ± 61.8b | 162.0 ± 73.9b |
| nf‐MA | ||||||||
| SA | ||||||||
| NEA | 4.9 ± 0.8 | 13.7 ± 3.6 | 29.9 ± 2.9 | 53.5 ± 9.3 | 14.6 ± 6.4 | 61.4 ± 31.6 | 83.2 ± 37.0 | |
| nf‐MA | f‐MA | |||||||
| nf‐MA | ||||||||
| SA | ||||||||
| NEA | ||||||||
| SA | f‐MA | |||||||
| nf‐MA | ||||||||
| SA | ||||||||
| NEA | 6.9 ± 0.5 | 17.7 ± 0.1 | 35.2 ± 0.3 | 70.4 ± 5.0 | 7.0 ± 1.4 | 30.5 ± 3.5 | 48.5 ± 0.7 | |
| NEA | f‐MA | |||||||
| nf‐MA | ||||||||
| SA | 6.2 | 10.1 | 27.1 | 55.4 | 5.0 | 15.0 | 40.0 | |
| NEA | 5.5 | 13.1 | 28.7 | 55.7 | 8.0 | 15.0 | 39.0 | |
SD, standard deviation; f‐MA, facial motor area; nf‐MA, nonfacial motor area; SA, somatosensory area; NEA, noneloquent area.
Significantly greater compared with other stimulation/recording patterns (P < 0.01).
Significantly greater compared with other stimulation/recording patterns (P < 0.05).
Table V.
Amplitudes and latencies of major wave components in Type 2 responses
| Latency ± SD (ms) | Amplitude ± SD (μV) | |||||
|---|---|---|---|---|---|---|
| Stimulation | Recording | Onset | N1 | P2 | N1 | P2 |
| f‐MA | f‐MA | 7.8 ± 0.6a | 24.3 ± 1.9a | 47.6 ± 11.4 | 30.2 ± 23.0 | 56.0 ± 29.6 |
| nf‐MA | ||||||
| SA | 9.0 | 33.2 | 29.0 | 14.0 | 29.0 | |
| NEA | 12.1 ± 4.2 | 33.1 ± 2.9 | 58.7 ± 4.8 | 34.3 ± 19.9 | 54.6 ± 35.7 | |
| nf‐MA | f‐MA | 11.3 ± 4.9 | 23.7 ± 2.4 | 44.4 ± 8.4 | 19.3 ± 16.2 | 55.0 ± 25.5 |
| nf‐MA | 9.5 | 22.3 | 37.0 | 16.0 | 18.0 | |
| SA | ||||||
| NEA | 13.5 ± 4.7 | 31.5 ± 5.9 | 49.3 ± 7.5 | 15.0 ± 1.4 | 40.0 ± 19.8 | |
| SA | f‐MA | |||||
| nf‐MA | ||||||
| SA | ||||||
| NEA | ||||||
| NEA | f‐MA | 9.6 | 26.6 | 50.6 | 18.0 | 36.0 |
| nf‐MA | ||||||
| SA | ||||||
| NEA | 11.8 ± 3.5 | 28.2 ± 5.0 | 52.9 ± 5.6 | 28.5 ± 4.9 | 42.8 ± 10.5 | |
SD, standard deviation; f‐MA, facial motor area; nf‐MA, nonfacial motor area; SA, somatosensory area; NEA, noneloquent area.
Significantly shorter compared with other stimulation/recording patterns (P < 0.001).
Table VI.
Amplitudes and latencies of major wave components in Type 3 responses
| Latency ± SD (ms) | Amplitude ± SD (μV) | |||||
|---|---|---|---|---|---|---|
| Stimulation | Recording | Onset | P1′ | N1′ | P1′ | N1′ |
| f‐MA | f‐MA | 20.0 ± 4.5 | 31.6 ± 4.1 | 52.0 ± 5.6 | 20.0 ± 15.6 | 38.3 ± 27.5 |
| nf‐MA | 15.1 | 22.2 | 43.7 | 11.0 | 29.0 | |
| SA | ||||||
| NEA | ||||||
| nf‐MA | f‐MA | 10.0 | 28.9 | 53.1 | 25.0 | 48.0 |
| nf‐MA | ||||||
| SA | ||||||
| NEA | ||||||
| SA | f‐MA | |||||
| nf‐MA | ||||||
| SA | ||||||
| NEA | ||||||
| NEA | f‐MA | 18.8 | 34.3 | 52.0 | 35.0 | 30.0 |
| nf‐MA | 21.7 | 29.4 | 50.9 | 16.0 | 30.0 | |
| SA | ||||||
| NEA | 7.6 | 25.7 | 39.8 | 20.0 | 25.0 | |
SD, standard deviation; f‐MA, facial motor area; nf‐MA, nonfacial motor area; SA, somatosensory area; NEA, noneloquent area.
For Type 1 response, no significant differences in latencies such as latencies of onset, P1, N1, and P2 were observed in all comparisons. On the other hand, all amplitudes were significantly greater in the waveforms of f‐MA recording with contralateral f‐MA stimulation than other waveforms: from onset to P1 (P < 0.01), from P1 to N1 (P < 0.05), and from N1 to P2 (P < 0.05) (Table IV). For Type 2 response, the latencies of onset (P < 0.001) and N1 (P < 0.001) were shorter in the waveforms of f‐MA recording with contralateral f‐MA stimulation than other waveforms. However, no significant differences were detected in the comparisons of the latency of P2 and of all amplitudes (Table V). For Type 3, no significant differences were observed in all comparisons (Table VI).
DISCUSSION
Consistent with our previous report [Terada et al.,2008], CCEP responses were recorded from the contralateral hemisphere in the current study. Compared with the previous study, this study investigated a larger number of patients, and furthermore succeeded to stimulate not only f‐MA but also nf‐MA and SA. The data obtained allowed us to clarify the characteristics of these interhemispheric connections more precisely. All patients in the current study had temporal lobe epilepsy. Therefore, we presume that all the CCEP responses observed in the present study may reflect normal physiological phenomena.
Effect of Stimulation and Recording Sites
Facial motor area stimulation
CCEP responses were recorded from the contralateral hemisphere more frequently by stimulating f‐MA (29.1%) than by stimulating SA (2.9%) or NEA (3.8%). And, f‐MA stimulation evoked CCEP responses more frequently at the contralateral f‐MA (55.6%) than at nf‐MA (14.3%), SA (12.5%), or NEA (22.1%), although the differences were only significant when compared with SA or NEA recordings, probably because the number of data was too small. Furthermore, the amplitudes of all components in Type 1 response were significantly greater when stimulating f‐MA and recording from contralateral f‐MA. These data suggest that compared to other areas, the f‐MA has denser interhemispheric connections with the contralateral f‐MA. From the physiological point of view, these connections are supposed to play an important role to control facial movements, which are usually symmetric or not independent between both sides.
Nonfacial motor area stimulation
CCEP responses were recorded from the contralateral hemisphere more frequently by stimulating nf‐MA (25.0%) than by stimulating SA (2.9%) or NEA (3.8%). Furthermore, nf‐MA stimulation evoked CCEP responses more frequently at the contralateral f‐MA (80.0%) than at nf‐MA (25.0%), SA (0%), or NEA (12.5%), although the differences were only significant when compared with SA or NEA recordings. There were no apparent differences in amplitudes when compared with SA or NEA stimulation, although statistical analysis could not be performed. These findings suggest that interhemispheric connections originating from the nf‐MA extend to the contralateral f‐MA more frequently than to other areas including the contralateral homologous nf‐MA. From the physiological viewpoint, the relatively sparse connections between bilateral nf‐MA may correspond to the fact that left and right hands are controlled separately and may move independently in humans.
In a previous electrophysiological study, Ugawa et al. [1993] demonstrated interhemispheric connections between strictly homotopic areas in left and right MA using transcranial magnetic stimulation. In an anatomical study conducted in humans, Aboitiz et al. [1992] also noticed that most fibers in the corpus callosum connect the corresponding areas of the left and right hemispheres. Furthermore, our previous report suggests that the interhemispheric connections are between bilateral homologous areas, although the data were limited only to f‐MA stimulation [Terada et al.,2008]. In contrast, the current study demonstrated that the neural connections between left and right MA were uneven. Both f‐MA and nf‐MA send interhemispheric fibers to the contralateral f‐MA more frequently than to the contralateral nf‐MA (see Fig. 7). On the other hand, compared with nf‐MA, f‐MA tends to receive more interhemispheric connections from the contralateral MA, both f‐MA and nf‐MA. Anatomical analysis in animals demonstrated uneven transcallosal connections between left and right MA [Gould et al.,1986; Pandya and Vignolo,1971). They reported that motor representation of the distal forelimb has no or greatly reduced callosal connections, as was also observed in the present human study.
Figure 7.
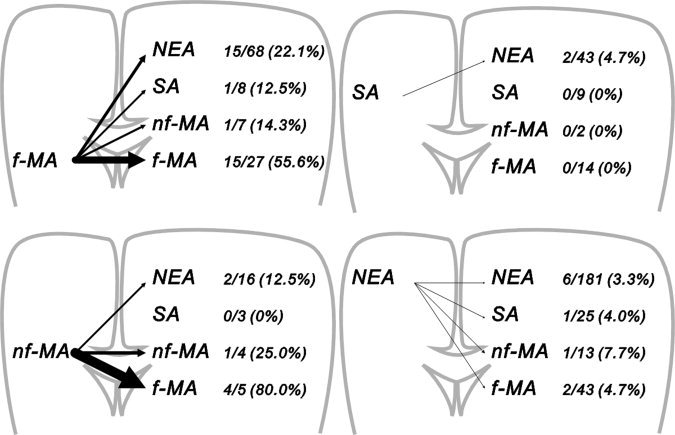
Schematic presentation of the results. Arrows indicate the interhemispheric connections. The line thicknesses correspond to the positive rate of CCEP responses; i.e., the thicker the line is, the more frequently the interhemispheric responses can be recorded. It is demonstrated that both facial motor area (f‐MA) and nonfacial motor area (nf‐MA) send their neural connections to the contralateral f‐MA rather than nf‐MA or other areas. Furthermore, it is also seen that both somatosensory area (SA) and noneloquent area (NEA) send sparse connections to the contralateral hemisphere.
Sensory area and noneloquent area stimulation
Stimulation of SA or NEA evoked only rare CCEP responses that could be recorded from the contralateral hemisphere. Especially, SA stimulation never evoked any response at the contralateral MA or SA, even though both facial and nonfacial SA were examined. For both SA and NEA stimulation, there were no significant differences in positive response rate among the recording sites. These findings indicate that there is no or only very sparse neural connection from the SA or NEA to the contralateral hemisphere in humans. There was no previous report on the interhemispheric connection between left and right SA in humans by any method. However, animal studies have demonstrated transcallosal connection between bilateral SA by anatomical investigations [Cusick et al.,1985; Jones and Powell,1969; Pandya and Vignolo,1968] and also by electrophysiological studies [Chang,1953; Curtis,1940a]. The discrepancy between this study and the previous reports may represent the difference in functional organization between humans and animals or the difference in methodology.
Analysis of MRI‐defined eloquent areas
Recently, 3D reconstruction MRI imaging is used to identify “motor area,” “somatosensory area,” or other eloquent areas. In this study, we also used the same method, although we could not differentiate between f‐MA and nf‐MA by MRI imaging. In the results, it was also demonstrated that MA‐MRI (25.4%) more frequently sent the interhemispheric neural connections than SA‐MRI (8.8%) or NEA‐MRI (1.8%). It was also demonstrated that MA‐MRI stimulation more frequently demonstrated the CCEP responses in the contralateral MA‐MRI (35.8%) than SA‐MRI (27.8%) or NEA‐MRI (14.3%). These findings are concordant with the analysis mentioned above.
In this analysis, however, the statistically significant difference was also observed in comparison between SA‐MRI stimulation (8.8%) and NEA‐MRI stimulation (1.8%). In the analysis discussed above, there was no statistically significant difference between SA stimulation (2.9%) and NEA stimulation (3.8%). By stimulating SA‐MRI, 13 of 147 trials demonstrated CCEP responses in the contralateral hemisphere. Of 13, six stimulations resulted in motor response in cortical stimulation, even the electrical stimuli were given on SA‐MRI. It was most likely that these six stimulations might activate the adjacent MA, and, therefore, resulted in activation of the interhemispheric neural connections arising from the MA. This kind of phenomenon was called “distant response” by Penfield and Jasper [1954].
Waveform types
In this study, three types of waveforms were recorded, which we designated Type 1, Type 2, and Type 3. Judged from the waveforms and peak latencies, the generators of N1 and P2 in Type 1 and Type 2 are most likely to be identical, while an additional generator may give rise to P1 in Type 1.
Type 1 responses were mainly recorded while stimulating f‐MA (12 of 16 Type 1 responses) and while recording at f‐MA (seven responses). Interestingly, this response was never recorded when nf‐MA was stimulated. Therefore, we speculate that P1 in Type 1 response may be a relatively specific component generated by the contralateral f‐MA.
In Type 1 response, one or two notches always superimpose on P1. As discussed in our previous report [Terada et al.,2008], this notch may represent the high frequency oscillation seen in somatosensory evoked potential [Hashimoto et al.,1996; Maegaki et al.,2000], or the d‐wave and i‐wave observed in transcranial magnetic stimulation [Hanajima et al.,2001], or the different latencies between anodal and cathodal stimuli. Further study is needed to specify the significance of the notches.
Judged from the peak latencies, P1′ and N1′ of Type 3 may correspond to the opposite tail of dipoles of N1 and P2. However, because of technical limitation (spatial sampling problem in subdural recording), we could not analyze their distributions and fields. Therefore, we could not confirm the presence of this dipole. Further study, including EEG or MEG studies, is necessary to clarify the relationship between N1‐P2 in Type 1/2 response and P1′‐N1′ in Type 3 responses.
Latencies
In this study, the onset of P1 in Type 1 response was 3.6–7.2 ms, and the peak latency of P1 in Type 1 was 7.6–13.6 ms. The onset of N1 in Type 2 was 7.1–20.6 ms, the peak latency of N1 15.9–38.6 ms, the onset of P1′ in Type 3 7.6–24.2 ms, and the latency of P1′ 22.2–36.2 ms.
Shibasaki et al. [1978] demonstrated the latency difference of C reflexes in bilateral limbs in patients with cortical myoclonus, and suggested that the transit time between bilateral hemispheres is 9–11 ms. Brown et al. [1991] also demonstrated similar side‐to‐side difference of C reflexes in patients with cortical myoclonus. Their data suggested that the interhemispheric transit time is 10.1–15.6 ms. Transcranial magnetic stimulation also demonstrated transcallosal connections between bilateral MA. When the ipsilateral MA was stimulated as the conditioning stimulation, EMG responses evoked by contralateral MA stimulation was reduced significantly. This interhemispheric inhibition was maximal when the stimulus interval was approximately 8–9 ms [Ferbert et al.,1992]. Ugawa et al. [1993] reported that stimulation of the ipsilateral MA facilitated the response for the contralateral MA stimulation, and demonstrated that this effect was prominent when the conditioning stimulation was given 8 ms before the contralateral stimulation. Cracco et al. [1989] and Amassian and Cracco [1987] reported cortical responses similar to our results by transcranial electrical or magnetic stimulations. Their peak latencies of the initial positive peak were 8.8–12.2 and 9–14 ms, respectively. These studies suggest that the transcallosal transit time is approximately 8–14 ms for left and right MA, and are almost concordant with our result (the peak latency of P1 in Type 1, the onset of N1 in Type 2, or the onset of P1′ in Type 3).
Hanajima et al. [2001] showed the occurrence of interhemispheric facilitation 4–5 ms after contralateral MA stimulation, followed by late inhibition maximal at 11 ms. This facilitation occurred much earlier than our initial peak, but occurred with the similar timing with the onset of P1 in Type 1. Then, it is possible that the very early portion of our CCEP components (P1 in Type 1 response) corresponds to this facilitation.
In animal studies, the initial positive wave lasted approximately 15 ms and the second negative wave lasted approximately 75 ms in cat [Curtis,1940b]. Cukiert and Timo‐Iaria [1989] reported that the initial response started at 2–10 ms and the second peak at 10–25 ms. Single neuron recording in animals demonstrated that the initial unit arrived at 6–8 ms by stimulating the opposite pyramidal tract in cat [Asanuma and Okuda,1962]. The latencies obtained in the present study are consistent with those of previous works.
Anatomically, Aboitiz [1992] reported the presence of fast‐conducting, large‐caliber fibers between bilateral MA and SA in human. Hofer and Frahm [2006] reported connecting fibers of larger diameters (>3 μm) between bilateral MA located posterior to the midbody of corpus callosum. The estimated conduction velocity of these fibers is 40 mm/ms, corresponding to a transcallosal transit time of 2.5–3.2 ms [Aboitiz et al.,1992]. This time lag is much shorter than the latency of our initial positive peak, and even shorter than the onset of the positive wave. This discrepancy may be explained by the time lag between the stimulation and volley generation at the stimulated site, as well as the time lag between the arrival time of the volley and the EPSP generation at the recording site. It is also possible that we might have missed the earliest potential of CCEP in the present study.
Generators
As discussed above, we speculate that there are at least two independent generators for the current CCEP, corresponding to the initial (P1 in Type 1) and the following peaks. Curtis [1940b] reported that the initial positive and the second negative peaks responded differently to chemical agents. He, therefore, concluded that ascending fibers in the upper layers of the cortex give rise to the initial positive peak, and descending fibers, which reach the deeper cortical layers from interneuron in the upper layer, generate the next negative peak. Chang [1953] analyzed the effects of Novocaine and strychnine to these components, and compared the potentials between stimulation of contralateral hemisphere and direct stimulation on corpus callosum. He speculated that the initial positive wave is caused by the antidromic volley and the presynaptic orthodromic volley, and the second peak is the activity of the superficially placed callosal afferent and their postsynaptic neurons. The feline study of Cukiert and Timo‐Iaria [1989] suggested that the early and late components reflect most probably the involvement of mono‐ and poly‐synaptic pathways, respectively, on account of the differences in latency, response to stimulus frequency, and the stability.
CONCLUSION
As previously reported, we demonstrated interhemispheric connections between left and right MA in humans in this study. In addition, we also demonstrated that the interhemispheric connections were uneven. The f‐MA has dense connections with the contralateral f‐MA, and the nf‐MA also has dense connections with the contralateral f‐MA but less dense connections with the contralateral homologous nf‐MA. The SA has no or only sparse connection with the contralateral MA or SA.
Acknowledgements
The authors thank Ms. Miyako Yamaguchi, Ms. Mariko Ishikawa, and Mr. Yuji Sakura for technical assistance. They also gratefully acknowledge the efforts and generous cooperation of the patients in this study.
REFERENCES
- Aboitiz F( 1992): Brain connections: interhemispheric fiber systems and anatomical brain asymmetries in humans. Biol Res 25: 51–61. [PubMed] [Google Scholar]
- Aboitiz F, Scheibel AB, Fisher RS, Zeidel E( 1992): Fiber composition of the human corpus callosum. Brain Res 98: 143–153. [DOI] [PubMed] [Google Scholar]
- Amassian VE, Cracco RQ( 1987): Human cerebral cortical responses to contralateral transcranial stimulation. Neurosurgery 20: 148–155. [PubMed] [Google Scholar]
- Asanuma H, Okuda O( 1962): Effects of transcallosal volleys on pyramidal tract cell activity of cat. J Neurophysiol 25: 198–208. [DOI] [PubMed] [Google Scholar]
- Brown P, Day BL, Rothwell JC, Thompson PD, Marsden CD( 1991): Intrahemispheric and interhemispheric spread of cerebral cortical myoclonic activity and its relevance to epilepsy. Brain 114: 2333–2351. [DOI] [PubMed] [Google Scholar]
- Brugge JF, Volkov IO, Garell PC, Reale RA, Howard MA III ( 2003): Functional connections between auditory cortex on Heschl's gyrus and on the lateral superior temporal gyrus in humans. J Neurophysiol 90: 3750–3763. [DOI] [PubMed] [Google Scholar]
- Chang HT( 1953): Cortical response to activity of callosal neurons. J Neurophysiol 16: 117–131. [DOI] [PubMed] [Google Scholar]
- Cracco RQ, Amassian VE, Maccabee PJ, Cracco JB( 1989): Comparison of human transcallosal responses evoked by magnetic coil and electrical stimulation. Electroencephalogr Clin Neurophysiol 74: 417–424. [DOI] [PubMed] [Google Scholar]
- Cukiert A, Timo‐Iaria C( 1989): An evoked potential mapping of transcallosal projections in the cat. Arq Neuro‐Psiquiat (São Paulo) 47: 1–7. [DOI] [PubMed] [Google Scholar]
- Curtis HJ( 1940a): Intercortical connections of corpus callosum as indicated by evoked potentials. J Neurophysiol 3: 407–413. [Google Scholar]
- Curtis HJ( 1940b): An analysis of cortical potentials mediated by the corpus callosum. J Neurophysiol 3: 414–422. [Google Scholar]
- Cusick CG, MacAvoy MG, Kaas JH( 1985): Interhemispheric connections of cortical sensory areas in tree shrews. J Comp Neurol 235: 111–128. [DOI] [PubMed] [Google Scholar]
- Ferbert A, Priori A, Rothwell JC, Day BL, Colebatch JG, Marsden CD( 1992) Interhemispheric inhibition of the human motor cortex. J Physiol 453: 525–546. [DOI] [PMC free article] [PubMed] [Google Scholar]
- Gould HJ III, Cusick CG, Pons TP, Kaas JH( 1986): The relationship of corpus callosum connections to electrical stimulation maps of motor, supplementary motor, and the frontal eye fields in owl monkeys. J Comp Neurol 247: 297–325. [DOI] [PubMed] [Google Scholar]
- Greenlee JDW, Oya H, Kawasaki H, Volkov IO, Kaufman OP, Kovach C, Howard MA, Brugge JF( 2004): A functional connection between inferior frontal gyrus and orofacial motor cortex in human. J Neurophysiol 92: 1153–1164. [DOI] [PubMed] [Google Scholar]
- Hanajima R, Ugawa Y, Machii K, Mochizuki H, Terao Y, Enomoto H, Furubayashi T, Shiio Y, Uesugi H, Kanazawa I( 2001): Interhemispheric facilitation of the hand motor area in humans. J Physiol 531: 849–859. [DOI] [PMC free article] [PubMed] [Google Scholar]
- Hashimoto I, Mashiko T, Imada T( 1996): Somatic evoked high‐frequency magnetic oscillations reflect activity of inhibitory interneurons in the human somatosensory cortex. Electroencephalogr Clin Neurophysiol 100: 189–203. [DOI] [PubMed] [Google Scholar]
- Hofer S, Frahm J( 2006): Topography of the human corpus callosum revisited‐comprehensive fiber tractography using diffusion tensor magnetic resonance imaging. NeuroImage 32: 989–994. [DOI] [PubMed] [Google Scholar]
- Jones EG, Powell TPS( 1969): Connexions of the somatic sensory cortex of the rhesus monkey. II. Contralateral cortical connexions. Brain 92: 717–730. [DOI] [PubMed] [Google Scholar]
- Lesser RP, Gordon B ( 2000): Methodologic considerations in cortical electrical stimulation in adults In: Lüders HO, Noachtar S, editors. Epileptic Seizures: Pathophysiology and Clinical Semiology. Philadelphia: Churchill Livingstone; pp 153–165. [Google Scholar]
- Maegaki Y, Najm I, Terada K, Morris HH, Bingaman WE, Kohaya N, Takenobu A, Kadonaga Y, Lüders HO( 2000): Somatosensory evoked high‐frequency oscillations recorded directly from the human cerebral cortex. Clin Neurophysiol 111: 1916–1926. [DOI] [PubMed] [Google Scholar]
- Matsumoto R, Nair DR, LaPresto E, Najm I, Bingaman W, Shibasaki H, Lüders HO( 2004): Functional connectivity in the human language system: A cortico‐cortical evoked potential study. Brain 127: 2316–2330. [DOI] [PubMed] [Google Scholar]
- Matsumoto R, Kinoshita M, Taki J, Hitomi T, Mikuni N, Shibasaki H, Fukuyama H, Hashimoto N, Ikeda A( 2005): In vivo epileptogenicity of focal cortical dysplasia: A direct cortical paired stimulation study. Epilepsia 46: 1744–1749. [DOI] [PubMed] [Google Scholar]
- Matsumoto R, Nair DR, LaPresto E, Bingaman W, Shibasaki H, Lüders HO( 2007): Functional connectivity in human cortical motor system: A cortico‐cortical evoked potential study. Brain 130: 181–197. [DOI] [PubMed] [Google Scholar]
- Mihara T, Baba K ( 2001): Combined use of subdural and depth electrodes In: Lüders HO, Comair YG, editors. Epilepsy Surgery, 2nd ed Philadelphia: Lippincott Williams & Wilkins; pp 613–621. [Google Scholar]
- Mori S, Kaufmann WE, Pearlson GD, Crain BJ, Stieltjes B, van Zijl PC( 2000): In vivo visualization of human neural pathways by magnetic resonance imaging. Ann Neurol 47: 412–414. [PubMed] [Google Scholar]
- Pandya DN, Vignolo LA( 1968): Interhemispheric neocortical projections of somatosensory areas I and II in the rhesus monkey. Brain Res 7: 300–303. [DOI] [PubMed] [Google Scholar]
- Pandya DN, Vignolo LA( 1971): Intra‐ and interhemispheric projections of the precentral, premotor and arcuate areas in the rhesus monkey. Brain Res 26: 217–233. [PubMed] [Google Scholar]
- Penfield W, Jasper H( 1954): Epilepsy and Functional Anatomy of the Human Brain. Boston: Little Brown. [Google Scholar]
- Rutecki PA, Grossman RG, Armstrong D, Irish‐Loewen S( 1989): Electrophysiological connections between the hippocampus and entorhinal cortex in patients with complex partial seizures. J Neurosurg 70: 667–675. [DOI] [PubMed] [Google Scholar]
- Shibasaki H, Yamashita Y, Kuroiwa Y( 1978): Electroencephalographic studies of myoclonus: Myoclonus‐related cortical spikes and high amplitude somatosensory evoked potentials. Brain 101: 447–460. [DOI] [PubMed] [Google Scholar]
- Terada K, Usui N, Umeoka S, Baba K, Mihara T, Matsuda K, Tottori T, Agari T, Nakamura F, Inoue Y( 2008): Interhemispheric connection of motor areas in humans. J Clin Neurophysiol 25: 351–356. [DOI] [PubMed] [Google Scholar]
- Ugawa Y, Hanajima R, Kanazawa I( 1993): Interhemispheric facilitation of the hand area of the human motor cortex. Neurosci Lett 160: 153–155. [DOI] [PubMed] [Google Scholar]
- Umeoka S, Terada K, Baba K, Usui K, Matsuda K, Tottori T, Usui N, Nakamura F, Inoue Y, Fujiwara T, Mihara T( 2009): Neural connection between bilateral basal temporal regions: Cortico‐cortical evoked potential analysis in patients with temporal lobe epilepsy. Neurosurgery 64: 847–855. [DOI] [PubMed] [Google Scholar]
- Wilson CL, Isokawa M, Babb TL, Crandall PH( 1990): Functional connections in the human temporal lobe. I. Analysis of limbic system pathways using neuronal responses evoked by electrical stimulation. Exp Brain Res 82: 279–292. [DOI] [PubMed] [Google Scholar]
- Wilson CL, Isokawa M, Babb TL, Crandall PH, Levesque MF, Engel J Jr ( 1991): Functional connections in the human temporal lobe. II. Evidence for a loss of functional linkage between contralateral limbic structures. Exp Brain Res 85: 174–187. [DOI] [PubMed] [Google Scholar]