

Abstract
Parkinson's disease (PD) patients have difficulty in initiating movements. Previous studies have suggested that the abnormal brain activity may happen not only during performance of self‐initiated movements but also in the before movement (baseline or resting) state. In the current study, we investigated the functional connectivity of brain networks in the resting state in PD. We chose the rostral supplementary motor area (pre‐SMA) and bilateral primary motor cortex (M1) as “seed” regions, because the pre‐SMA is important in motor preparation, whereas the M1 is critical in motor execution. FMRIs were acquired in 18 patients and 18 matched controls. We found that in the resting state, the pattern of connectivity with both the pre‐SMA or the M1 was changed in PD. Connectivity with the pre‐SMA in patients with PD compared to normal subjects was increased connectivity to the right M1 and decreased to the left putamen, right insula, right premotor cortex, and left inferior parietal lobule. We only found stronger connectivity in the M1 with its own local region in patients with PD compared to controls. Our findings demonstrate that the interactions of brain networks are abnormal in PD in the resting state. There are more connectivity changes of networks related to motor preparation and initiation than to networks of motor execution in PD. We postulate that these disrupted connections indicate a lack of readiness for movement and may be partly responsible for difficulty in initiating movements in PD. Hum Brain Mapp, 2010. © 2010 Wiley‐Liss, Inc.
Keywords: Parkinson's disease, functional connectivity, resting state, rostral supplementary motor area, primary motor cortex
INTRODUCTION
Parkinson's disease (PD) patients have difficulty in initiating movements (akinesia), particularly for those that are internally generated. Although it has been extensively investigated, the underlying pathophysiology of this deficit remains unclear. Extensive neuroimaging studies using PET or functional MRI (fMRI) have investigated brain activity during performance of self‐initiated or self‐selected movements. The common findings of these studies are the hypoactivation of the supplementary motor area (SMA), and hyperactivation of some other cortical motor regions, like the lateral premotor cortex (PMC), and parietal cortex in patients with PD compared to normal subjects [Buhmann et al.,2003; Haslinger et al.,2001; Jahanshahi et al., 1995; Playford et al.,1992; Rascol et al.,1997; Sabatini et al.,2000; Wu and Hallett,2005]. Levodopa or apomorphine administration [Buhmann et al.,2003; Haslinger et al.,2001; Jenkins et al., 1992], ventral posterolateral pallidotomy [Ceballos‐Baumann et al., 1994; Grafton et al., 1995], or deep brain stimulation of the subthalamic nucleus [Grafton et al.,2006] can relatively normalize the hypoactivation of the SMA, and decrease the overactivation of other cortical areas. The increased activity in the SMA is highly correlated with the clinical improvement of akinesia [Haslinger et al.,2001]. Because the SMA is critical in initiating movements, particularly for internally generated movements [Deiber et al.,1991,1996; Jahanshahi et al., 1995; Jenkins et al.,2000; Playford et al.,1992; Tanji and Hoshi,2001], these observations indicate that the dysfunction of the SMA secondary to the deficit of nigrostriatal dopamine system is an important reason contributing to akinesia in PD. Meanwhile, patients with PD may need compensatory activity of other motor circuits to overcome their difficulty in performing self‐initiated movements [Grafton,2004].
Abnormal brain activity may happen not only during performance of movements but also before movement, in the baseline or resting state. Using transcranial magnetic stimulation (TMS), Pascual‐Leone and colleagues [1994a,b] found decreased cortical facilitation in the baseline state in PD. This abnormal cortical activity in the resting condition may prolong the time of development required to build up pre‐movement cortical excitability past the threshold required for movement execution, thus, contributing to akinesia in PD [Pascual‐Leone et al.,1994a,b]. Later TMS studies also found reduction of intracortical facilitation in the resting state in PD [Bares et al.,2003; Lefaucheur et al.,2004], which suggests that facilitatory motor inputs and cortical connections are defective in PD [Lefaucheur,2005]. Recently, using fMRI, we found that the regional homogeneity (which reflects local similarity of neuronal activity) is decreased in the putamen, thalamus, and SMA; and increased in the cerebellum, primary motor cortex (M1), and PMC in patients with PD compared to normals [Wu et al.,2009]. These findings indicate that neuronal activity is abnormal in the resting state in PD.
In the current study, we investigated the interactions of the neural networks in the resting state in PD. Studies of interactions of brain areas may provide more valuable information in understanding functional changes than simply investigating regional brain activity. Methods for exploring interregional connectivity are functional connectivity [Friston et al.,1993a], or effective connectivity [Friston et al.,1993b], which have been extensively used in neuroscientific and neurological studies, and are commonly accepted as powerful ways to characterize neural interactions among brain regions during particular tasks [Buchel et al.,1999; Friston,1995; Friston and Buchel,2000; Liu et al.,1999]. It has been shown that there are very low frequency (<0.08 Hz) fluctuations (LFFs) in MR signals that can be detected in the resting brain [Biswal et al.,1995; Greicius et al.,2003; Lowe et al.,1998; Xiong et al.,1999]. These LFFs in MR signal intensity are supposed to arise from fluctuations in capillary blood flow and blood oxygenation, which, at least in part, reflect spontaneous neuronal activity [Biswal et al.,1995; Logothetis et al.,2001; Lu et al.,2007; Pelled and Goelman,2004]. These fluctuations have identified temporal correlations between functionally related regions, like motor, auditory, language, and visual areas [Biswal et al.,1995; Jiang et al.,2004; Lowe et al.,1998; Xiong et al.,1999], and have been suggested to reflect the functional connectivity between these regions. This method has been increasingly applied to investigate interactions of brain regions in normal and pathological states in the resting state [Greicius et al.,2003; Wang et al.,2006].
By now, only a couple of studies have investigated functional connectivity in PD in the resting state [Helmich et al.,2010; Wu et al.,2009]. Helmich and colleagues used the putamen and caudate nucleus as seeds investigated the functional connectivity of cortico‐striatal networks [Helmich et al.,2010], but the connectivity of cortical motor areas was not focused in that study. In a recent study, with graph theory‐based connectivity analysis, we found that the connectivity degrees in several regions, like the SMA, M1, and cerebellum were changed in PD in the resting state [Wu et al.,2009]. However, that study did not show how certain regions connect with other brain regions. A method used to investigate functional connectivity for a specific region in fMRI is the “seed voxel” approach [Biswal et al.,1995]. This method selects a voxel in a region of the brain as a reference and cross‐correlates the time course of the “seed” with that of all other voxels in the whole brain to produce functional connectivity maps [Biswal et al.,1995; Xiong et al.,1999]. This approach can identify brain regions functionally connected to the “seed.” Here, we used this analysis method to investigate the functional connectivity of neural networks in the rostral SMA (pre‐SMA) and bilateral M1 in the resting state in PD. The SMA contains two separate areas: the SMA‐proper in the caudal portion and the pre‐SMA in the rostral portion [Tanji and Hoshi,2001]. We chose the pre‐SMA as a “seed” because this region is important in motor control, like motor preparation and initiation [Cunnington et al.,2002; Deiber et al.,1991,1996; Jahanshahi et al., 1995; Jenkins et al.,2000; Playford et al.,1992; Tanji and Hoshi,2001]. We also chose the bilateral M1 as a “seed” because they are critical in motor execution. Investigation of connectivity in these cortical motor areas will be helpful on our understanding of PD‐related modulation on motor preparation, initiation, or execution networks.
In healthy subjects, the brain motor networks must maintain a dynamic equilibrium during the resting state, to be ready to perform a future motor task [Bressler and Kelso,2001]. Presumably, if the interactions among the brain regions are disrupted in the resting state, the brain networks may not ready to initiate or execute coming movements. This might be a partial explanation for difficulty in initiating movements in PD.
METHODS
Subjects
We studied 18 patients with PD (12 male, 6 female; mean age 62.36 ± 5.68), and 18 age‐ and sex‐matched healthy subjects (12 male, 6 female; mean age 62.10 ± 6.02). The subjects were all right‐handed as measured by the Edinburgh Inventory [Oldfield,1971]. The diagnosis of PD was based on medical history, physical and neurological examinations, response to levodopa or dopaminergic drugs, and laboratory tests and MRI scans to exclude other diseases. Akinesia was the leading symptom and was dominant on the right side in every patient. Akinesia has been defined as a delay or a failure in movement initiation [Hallett et al.,1991]. In the current study, all patients had an obvious delay in movement initiation, but had at most a mild tremor. Patients were assessed with the UPDRS (Unified Parkinson's Disease Rating Scale) [Lang and Fahn,1989], the Hoehn and Yahr disability scale [Hoehn and Yahr,1967], and Mini‐Mental State Exam (MMSE) while off their medications. MMSE was ≥ 27 in all subjects, and there was no difference between the patients and controls. All subjects reported no history of heart disease, hypertension, or diabetes. The clinical data of patients with PD are shown in Table I. The experiments were performed according to the Declaration of Helsinki and were approved by the Institutional Review Board. All subjects gave their written informed consent for the study.
Table I.
Clinical details of patients with Parkinson's disease (Mean ± SD)
| Age (years) | 62.36 ± 5.68 |
| Sex | 6F, 12M |
| Disease duration (years) | 4.21 ± 1.63 |
| UPDRS motor score (off medication) | 22.16 ± 3.78 |
| H&Y (off medication) | 1.78 ± 0.50 |
| l‐dopa dose (mg/day) | 350.76 ± 50.21 |
UPDRS, Unified Parkinson's Disease Rating Scale, is the most commonly used tool to rate the symptoms of Parkinson disease; H and Y, Hoehn and Yahr Staging, is a rating scale to evaluate the severity of Parkinson's disease; F, female; M, male.
FUNCTIONAL MRI PROCEDURE
Patients were scanned after their medication had been withdrawn for at least 12 h. Imaging was performed on a 1.5 T Siemens Sonata scanner. A standard 8‐channel head coil was used with foam padding to restrict head motion. High resolution axial T1‐ and T2‐weighted images were obtained in every subject. We used a gradient‐echo echo‐planar sequence sensitive to BOLD contrast to acquire functional images [TR = 2,000 ms, TE = 60 ms, flip angle = 90°, field of view (FOV) = 24 × 24 cm, matrix = 64 × 64]. Twenty axial slices were collected with 5 mm thickness, and a 2 mm gap. Resolution was 3.75 × 3.75 mm in‐plane. During resting state fMRI, subjects were instructed to keep their eyes closed, to remain motionless, and to not to think of anything in particular. The scanning session lasted for 6 min.
We additionally asked the subjects to perform two types of finger movements, left or right index finger tapping task, to help to define the coordinate of the “seed” regions. These two fMRI sessions were block‐designed, and included two states, “movement” and “resting,” alternatively. In the movement state, the subjects were asked to perform a self‐initiated, self‐paced motor task, during which they briskly tapped their right or left index finger at an interval of 2 s in separate sessions. Each state lasted for 20 s and repeated 6 times. Before the scanning, the subjects were trained to execute the finger tapping at the required interval. No external cue was given to help the subjects move at the specified rate during fMRI scanning. An electrical response button was fixed to their index fingers to record the intervals between finger movements during scanning.
DATA ANALYSIS
Behavioral Data Analysis
Each subject's performance during fMRI was recorded. The intervals between finger movements were compared between patients with PD and controls (two‐sample t test).
Data Preprocessing
Data of each fMRI scan contained 180 time points. The first five time points of fMRI data were discarded because of the instability of the initial MRI signal and the adaptation of the subjects to the circumstances. The remaining 175 images were preprocessed using AFNI software. They were slice‐time corrected, and aligned to the first image of each session for motion correction, spatially normalized to Talairach and Tournoux space [Talairach and Tournoux,1988] and were smoothed with a Gaussian filter of 4 mm full width at half‐maximum (FWHM) to reduce noise and residual differences in gyral anatomy. Linear drift was removed. A temporal filter (0.01 Hz < f < 0.08 Hz) was applied to the data from the resting state to remove very‐low‐frequency drifts and physiological high‐frequency noise [Biswal et al.,1995]. No temporal filter was used on the data from the motor task.
Each subject's head motion parameters were examined. No subject's dataset had more than 1 mm maximum translation in x, y, or z, or 1° of maximum rotation about three axes. Since correlation analysis is sensitive to gross head motion, we further characterized the head motion as an index representing the peak displacement that was determined by a method initiated by Jiang et al. [1995] and further used by other studies [Lowe et al.,1998; Wang et al.,2006]. Then, a two‐tailed two‐sample t test was performed on the peak displacement to examine between‐group differences in head motion.
Brain Activation Analysis
Data were analyzed for each single subject separately on a voxel‐by‐voxel basis using the general linear model approach for the time series. We defined a model using a fixed effect boxcar design convolved with a hemodynamic response function to analysis of task‐dependent activation. Then, a one‐sample t test model was used to identify brain activity within each group [P < 0.05, with family‐wise error (FWE) correction for multiple comparisons]; whereas a two‐sample t test model (P < 0.05, FWE corrected) was used for between‐group comparisons.
Functional Connectivity Analyses
We defined three regions of interest (ROIs) centered at the voxels that showed the maximum magnitude of activation within the pre‐SMA, left M1, or right M1 from the results of finger movements for each individual, with a radius of 5 mm. We also chose the posterior cingulate cortex (PCC) as a ROI to evaluate the effect of cardiac and respiratory fluctuation on our findings [Helmich et al.,2010]. The center of the ROI of PCC was defined as x = 12, y = 47, z = 32 (Talairach coordinates), as used in previous report [Greicius et al.,2003]. The ROIs were used as the seeds for functional connectivity analysis in the resting state. A seed reference time course was obtained by averaging the time courses within each ROI. Correlation analysis was carried out between the seed reference and the whole brain in a voxel‐wise manner. In the correlation analysis, eight nuisance covariates were regressed, including: the white matter signal, the cerebrospinal fluid signal, and six head motion parameters. This procedure was done by a toolkit REST (see http://www.restfmri.net). We did not apply global signal regression to avoid the introduction of artificial negative correlations that may result from removal of the global signal [Murphy et al.,2009]. The partial correlation coefficient between the time series adjusting for the eight nuisance covariates is equivalent to the correlation coefficient between the orthogonalized time series with respect to these covariates. The individual correlation coefficient (r) maps were converted into z map by Fisher's Z‐transform to improve the normality [Lowe et al.,1998; Press et al.,1992]. The individual z value was entered into a random effect one‐sample t test in a voxel‐wise manner to determine brain regions showing significant connectivity with each “seed” in the resting state within each group. Then, a random effect two‐sample t test was used to identify between‐group differences in connectivity with the pre‐SMA, left M1, right M1, or PCC. In the current study, positive connectivity means that the spontaneous signal fluctuations in brain networks are in‐phase with the fluctuations observed in the corresponding seed region; whereas negative connectivity means that the spontaneous signal fluctuations are antiphase related with the fluctuations observed in the corresponding seed region [Fox et al.,2005]. A FWE corrected threshold of P < 0.05 was used for either within or between group results.
In addition, to explore whether the interactions of brain networks correlate with the disease severity, a correlation analysis of functional connectivity results against the UPDRS motor score was performed in patients with PD.
RESULTS
Behavioral Data
The mean between tapping interval for finger movements across the group of normal subjects was 2.02 ± 0.14 s (ranged from 1.77 to 2.36 s). In patients with PD, the averaged interval was 2.05 ± 0.16 s (from 1.82 to 2.33 s). There was no significant difference between the two groups (P = 0.163, two‐sample t test).
Head Motion
There was no significant difference in head motion measured in peak displacement between the two groups using the two‐sample t test [t(36) = 0.40, P = 0.72]. Therefore, the patients with PD and controls in the present study were similar in head motion characteristics.
Brain Activity During Performance of Self‐Initiated Movement
During performance of right index finger movement, all subjects activated the left M1, bilateral PMC, bilateral parietal cortex, bilateral cerebellum, pre‐SMA, and SMA proper (one‐sample t test, P < 0.05, FWE corrected). During performance of left index finger movement, all subjects activated the right M1, bilateral PMC, bilateral parietal cortex, bilateral cerebellum, pre‐SMA, and SMA proper (one‐sample t test, P < 0.05, FWE corrected). For the right hand movement, the patients had more activation in the bilateral parietal cortex, bilateral PMC, and right cerebellum, and had less activity in the pre‐SMA compared to normal controls (two sample t test, P < 0.05, FWE corrected). For the left hand movement, the patients had more activation in the bilateral parietal cortex, bilateral PMC, and bilateral cerebellum, and had less activity in the pre‐SMA compared to normal controls (two sample t test, P < 0.05, FWE corrected). We used the results from the right hand movement to define the ROIs of the pre‐SMA and left M1, and used the results from the left hand movement to define the ROI of right M1. The averaged Talairach coordinates (±SD) of the ROIs across the subjects were pre‐SMA: 2.1 ± 3.6, 5.0 ± 1.5, 57.0 ± 4.9; left M1: −36.4 ± 4.7, −21.5 ± 3.7, 54.3 ± 5.8; and right M1: 37.4 ± 4.3, −22.5 ± 4.1, 57.5 ± 5.3. Because the movement data were only used to define the coordinates of “seed” regions for functional connectivity analysis, and the results of such movements in PD has been extensively reported, the details of brain activity are not shown here.
Functional Connectivity of the Pre‐SMA in the Resting State
In the normal subjects, the pre‐SMA showed significant positive connectivity with the pre‐SMA (that is, intraregional connectivity), left M1, bilateral PMC, bilateral putamen, bilateral insula, left inferior parietal lobule, and left middle frontal gyrus. Meanwhile, the right medial frontal gyrus, right posterior cingulate, left parahippocampal gyrus, left precuneus, left cingulate gyrus, left middle temporal lobe, and right superior temporal lobe had significant negative connectivity with the pre‐SMA (one sample t test, P < 0.05, FWE corrected; Fig. 1A, Table II).
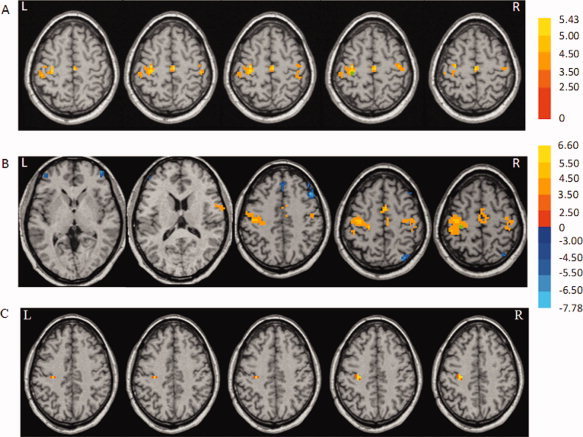
Figure 1.

Brain regions show significant positive (hot color) and negative (cold color) functional connectivity in the rostral supplementary motor area (pre‐SMA) in the resting state in normal control subjects (A), and Parkinson's disease (PD) patients (B). Hot and cold colors indicate significant positive and negative connectivity with the pre‐SMA, respectively. The results are shown across each group (one‐sample t test, P < 0.05, FWE corrected). C: Differences of functional connectivity with the pre‐SMA between patients with PD and normal subjects in the resting state (two‐sample t test; P < 0.05, FWE corrected). Hot and cold colors indicate increases and decreases of connectivity with the pre‐SMA in patients with PD compared to normal subjects, respectively. T score bars are shown on the right. Green spot: the position of the region of interest (ROI). L, left; R, right.
Table II.
Functional connectivity in the pre‐SMA in the resting state in normal subjects
| Brain region | Coordinates | Brodmann area | t value | Cluster size | r Mean | r SD | ||
|---|---|---|---|---|---|---|---|---|
| x | y | z | ||||||
| L M1 | −26 | −20 | 66 | 4 | 4.66 | 810 | 0.028 | 0.150 |
| Pre‐SMA | 1 | 4 | 56 | 6 | 24.57 | 11151 | 0.667 | 0.098 |
| L PMC | −22 | −7 | 50 | 6 | 6.33 | 1242 | 0.133 | 0.126 |
| R PMC | 40 | −1 | 47 | 6 | 5.57 | 1026 | 0.050 | 0.137 |
| L PMC | −19 | −18 | 62 | 6 | 4.59 | 658 | 0.151 | 0.168 |
| L Middle Frontal Gyrus | −34 | 43 | 26 | 9 | 4.50 | 594 | 0.109 | 0.193 |
| R Insula | 38 | 7 | 2 | 13 | 6.66 | 5157 | 0.274 | 0.117 |
| L Insula | −44 | 7 | 2 | 13 | 6.27 | 5454 | 0.159 | 0.173 |
| L Inferior Parietal Lobule | −52 | −40 | 29 | 40 | 6.81 | 1404 | 0.149 | 0.138 |
| L Inferior Parietal Lobule | −49 | −24 | 26 | 40 | 4.70 | 486 | 0.180 | 0.148 |
| L Putamen | −19 | 1 | 8 | 6.39 | 1350 | 0.215 | 0.083 | |
| R Putamen | 28 | −2 | 6 | 6.10 | 416 | 0.087 | 0.178 | |
| R Medial Frontal Gyrus | 1 | 52 | −6 | 10 | −5.48 | 1080 | −0.226 | 0.211 |
| R Posterior Cingulate | 1 | −40 | 20 | 29 | −5.23 | 621 | −0.170 | 0.102 |
| L Precuneus | −13 | −60 | 20 | 31 | −5.10 | 459 | −0.168 | 0.140 |
| L Cingulate Gyrus | −16 | 22 | 38 | 32 | −5.19 | 567 | −0.057 | 0.093 |
| L Parahippocampal Gyrus | −28 | −37 | −6 | 36 | −5.21 | 486 | −0.208 | 0.129 |
| R Superior Temporal Lobe | 49 | −52 | 26 | 39 | −7.13 | 2781 | −0.063 | 0.165 |
| L Middle Temporal Lobe | −46 | −70 | 26 | 39 | −5.89 | 1296 | −0.190 | 0.093 |
| R Cerebellum, Tonsil | 7 | −49 | −30 | −4.56 | 567 | −0.176 | 0.113 | |
List of the brain regions showing a significant connectivity with the pre‐SMA (one sample t test, P < 0.05, FWE corrected). The coordinates are given as stereotaxic coordinates referring to the atlas of Talairach and Tournoux. Positive t value means positive connectivity between the brain regions and pre‐SMA; Negative t value means negative connectivity between the brain regions and pre‐SMA; L, left; R, right; M1, primary motor cortex; PMC, premotor cortex; pre‐SMA, rostral supplementary motor area; SD, standard deviation.
In patients with PD, the pre‐SMA showed significant positive connectivity with the pre‐SMA, bilateral M1, bilateral insula, bilateral PMC, right inferior frontal gyrus, right postcentral gyrus, right inferior parietal lobule, and left superior temporal lobe, and had significant negative connectivity with the right inferior parietal lobule, right middle frontal gyrus, right posterior cingulate, left precuneus, left angular gyrus, left superior frontal gyrus, and right cingulate gyrus in the resting state (one sample t test, P < 0.05, FWE corrected; Fig. 1B, Table III).
Table III.
Functional connectivity in the pre‐SMA in the resting state in patients with Parkinson's disease
| Brain region | Coordinates | Brodmann area | t value | Cluster size | r Mean | r SD | ||
|---|---|---|---|---|---|---|---|---|
| x | y | z | ||||||
| R Postcentral Gyrus | 52 | −16 | 29 | 2 | 4.95 | 459 | 0.033 | 0.088 |
| R Postcentral Gyrus | 49 | −22 | 38 | 3 | 5.49 | 1350 | 0.027 | 0.197 |
| R M1 | 38 | −20 | 62 | 4 | 6.31 | 594 | 0.130 | 0.177 |
| L M1 | −36 | −21 | 52 | 4 | 5.30 | 1012 | 0.104 | 0.179 |
| Pre‐SMA | 4 | 4 | 56 | 6 | 21.46 | 9612 | 0.770 | 0.074 |
| L PMC | −34 | −13 | 40 | 6 | 5.79 | 1917 | 0.219 | 0.133 |
| R PMC | 46 | −7 | 48 | 6 | 4.47 | 648 | 0.169 | 0.142 |
| L Insula | −32 | 22 | 5 | 13 | 6.44 | 621 | 0.188 | 0.200 |
| R Insula | 40 | 13 | 4 | 13 | 4.56 | 432 | 0.144 | 0.187 |
| L Superior Temporal Lobe | −49 | 7 | 5 | 22 | 5.41 | 2025 | 0.234 | 0.144 |
| R Inferior Parietal Lobule | 52 | −28 | 26 | 40 | 4.51 | 405 | 0.031 | 0.138 |
| R Inferior Frontal Gyrus | 54 | 4 | 17 | 44 | 5.98 | 567 | 0.021 | 0.169 |
| L Angular Gyrus | −43 | −64 | 32 | 2 | −5.51 | 2538 | −0.181 | 0.129 |
| L Precuneus | −10 | −64 | 35 | 7 | −5.64 | 2808 | −0.063 | 0.139 |
| R Middle Frontal Gyrus | 22 | 25 | 38 | 8 | −6.01 | 1377 | −0.105 | 0.153 |
| L Superior Frontal Gyrus | −13 | 43 | 41 | 8 | −5.23 | 567 | −0.035 | 0.165 |
| R Middle Frontal Gyrus | 34 | 22 | 44 | 8 | −5.18 | 675 | −0.166 | 0.209 |
| R Posterior Cingulate | 10 | −49 | 17 | 30 | −5.82 | 3510 | −0.235 | 0.096 |
| R Cingulate Gyrus | 1 | −31 | 35 | 31 | −4.45 | 405 | −0.208 | 0.142 |
| R Inferior Parietal Lobule | 46 | −55 | 38 | 40 | −7.69 | 4536 | −0.162 | 0.177 |
List of the brain regions showing a significant connectivity with the pre‐SMA (one sample t test, P < 0.05, FWE corrected). The coordinates are given as stereotaxic coordinates referring to the atlas of Talairach and Tournoux. Positive t value means positive connectivity between the brain regions and pre‐SMA; Negative t value means negative connectivity between the brain regions and pre‐SMA; L, left; R, right; M1, primary motor cortex; PMC, premotor cortex; pre‐SMA, rostral supplementary motor area; SD, standard deviation.
A comparison between the two groups showed significantly stronger connectivity in the right M1, and a decreased connectivity in the left putamen, right insula, right PMC, and left inferior parietal lobule with the pre‐SMA in patients with PD compared to normal controls (two‐sample t test, P < 0.05, FWE corrected; Fig. 1C, Table IV).
Table IV.
Differences of functional connectivity in the pre‐SMA in the resting state between patients with Parkinson's disease and normal subjects
| Brain region | Coordinates | Brodmann area | t value | Cluster size | ||
|---|---|---|---|---|---|---|
| x | y | z | ||||
| R M1 | 40 | −20 | 60 | 4 | 5.62 | 594 |
| R PMC | 38 | −4 | 50 | 6 | −3.42 | 412 |
| R Insula | 36 | 6 | 6 | 13 | −4.02 | 540 |
| L Inferior Parietal Lobule | −50 | −38 | 26 | 40 | −3.68 | 626 |
| L Putamen | −20 | 4 | 2 | −4.05 | 540 | |
List of the brain regions showing significant difference of connectivity with the pre‐SMA between patients with PD and normal subjects (two‐sample t test, P < 0.05, FWE corrected). The coordinates are given as stereotaxic coordinates referring to the atlas of Talairach and Tournoux. Positive t value means increased connectivity in patients with PD than in normal subjects; Negative t value means decreased connectivity in patients with PD than in normal subjects; L, left; R, right; M1, primary motor cortex; PMC, premotor cortex; pre‐SMA, rostral supplementary motor area.
Functional Connectivity of the Left M1 in the Resting State
In the normal subjects, the left M1 showed significant positive connectivity with the bilateral M1, bilateral postcentral gyrus, and SMA proper (one sample t test, P < 0.05, FWE corrected; Fig. 2A, Table V). In patients with PD, the left M1 had significant positive connectivity with the bilateral M1, SMA proper, right inferior frontal gyrus, bilateral postcentral gyrus, and left paracentral lobule, and had significant negative connectivity with the left inferior frontal gyrus, right middle frontal gyrus, right medial frontal gyrus, right superior parietal lobule, and right middle temporal gyrus (one sample t test, P < 0.05, FWE corrected; Fig. 2B, Table V). A comparison between the two groups showed significantly stronger connectivity in the left M1 (x = −28, y = −22, z = 41; t value, 4.88; cluster size, 1404) (its own local region) in patients with PD compared to normal controls (two‐sample t test, P < 0.05, FWE corrected; Fig. 2C).
Figure 2.
Brain regions show significant positive (hot color) and negative (cold color) connectivity with the left primary motor cortex (M1) in the resting state in normal control subjects (A) and patients with PD (B). The results are shown across each group (one‐sample t test, P < 0.05, FWE corrected). C: The increase of functional connectivity with the left M1 in patients with PD compared to normal subjects (two‐sample t test; P < 0.05, FWE corrected). T score bars are shown on the right. Green spot: the position of the ROI. L, left; R, right.
Table V.
Functional connectivity in the left M1 in the resting state in normal subjects and patients with Parkinson's disease
| Brain region | Coordinates | Brodmann area | t value | Cluster size | r Mean | r SD | ||
|---|---|---|---|---|---|---|---|---|
| x | y | z | ||||||
| Normal subjects | ||||||||
| L Postcentral Gyrus | −46 | −25 | 44 | 2 | 4.58 | 567 | 0.172 | 0.189 |
| L M1 | −28 | −18 | 50 | 4 | 4.81 | 1809 | 0.159 | 0.101 |
| R M1 | 38 | −16 | 48 | 4 | 4.76 | 611 | 0.129 | 0.175 |
| SMA proper | 1 | −19 | 53 | 6 | 5.43 | 540 | 0.186 | 0.177 |
| R Postcentral Gyrus | 38 | −25 | 45 | 40 | 4.51 | 327 | 0.085 | 0.154 |
| Patients | ||||||||
| L Postcentral Gyrus | −42 | −26 | 52 | 3 | 6.26 | 2108 | 0.138 | 0.230 |
| L M1 | −40 | −19 | 41 | 4 | 6.60 | 9153 | 0.337 | 0.218 |
| R M1 | 16 | −25 | 56 | 4 | 4.42 | 459 | 0.087 | 0.142 |
| SMA proper | 4 | −1 | 48 | 6 | 6.08 | 2538 | 0.133 | 0.159 |
| L Paracentral Lobule | −10 | −30 | 59 | 6 | 4.50 | 1107 | 0.098 | 0.191 |
| R Postcentral Gyrus | 40 | −31 | 53 | 40 | 4.40 | 296 | 0.079 | 0.208 |
| R Inferior Frontal Gyrus | 58 | 4 | 20 | 44 | 6.23 | 621 | 0.092 | 0.141 |
| R Superior Parietal Lobule | 31 | −70 | 44 | 7 | −5.18 | 459 | −0.046 | 0.180 |
| R Medial Frontal Gyrus | 1 | 31 | 32 | 9 | −5.10 | 756 | −0.084 | 0.100 |
| R Middle Frontal Gyrus | 43 | 28 | 32 | 9 | −7.78 | 2214 | −0.059 | 0.128 |
| R Middle Temporal Gyrus | 52 | −61 | 23 | 39 | −4.35 | 567 | −0.095 | 0.162 |
| L Inferior Frontal Gyrus | −43 | 43 | 9 | 46 | −4.80 | 729 | −0.157 | 0.172 |
List of the brain regions showing a significant connectivity with the left M1 in normal subjects and patients with PD (one sample t test, P < 0.05, FWE corrected). The coordinates are given as stereotaxic coordinates referring to the atlas of Talairach and Tournoux. Positive t value means positive connectivity between the brain regions and M1; Negative t value means negative connectivity between the brain regions and M1; L, left; R, right; M1, primary motor cortex; SD, standard deviation; SMA, supplementary motor area.
Functional Connectivity of the Right M1 in the Resting State
In the normal subjects, the right M1 showed significant positive connectivity with the bilateral M1, right postcentral gyrus, left inferior parietal lobule, and SMA proper (one sample t test, P < 0.05, FWE corrected; Fig. 3A, Table VI). In patients with PD, the right M1 showed significant positive connectivity with the bilateral M1, bilateral postcentral gyrus and SMA proper, and had significant negative connectivity with the right precuneus (one sample t test, P < 0.05, FWE corrected; Fig. 3B, Table VI). A comparison between the two groups showed significantly stronger connectivity in the right M1 (x = 34, y = −24, z = 52; t value, 4.62; cluster size, 512) in patients with PD compared to normal controls (two‐sample t test, P < 0.05, FWE corrected).
Figure 3.

Brain regions show significant positive (hot color) and negative (cold color) connectivity with the right M1 in the resting state in normal control subjects (A) and patients with PD (B). The results are shown across each group (one‐sample t test, P < 0.05, FWE corrected). T score bars are shown on the right. Green spot: the position of the ROI. L, left; R, right.
Table VI.
Functional connectivity in the right M1 in the resting state in normal subjects and patients with Parkinson's disease
| Brain region | Coordinates | Brodmann area | t value | Cluster size | r Mean | r SD | ||
|---|---|---|---|---|---|---|---|---|
| x | y | z | ||||||
| Normal subjects | ||||||||
| R Postcentral Gyrus | 34 | −34 | 58 | 3 | 4.67 | 206 | 0.147 | 0.108 |
| L M1 | −36 | −24 | 50 | 4 | 5.20 | 836 | 0.097 | 0.132 |
| R M1 | 32 | −25 | 51 | 4 | 5.74 | 2319 | 0.184 | 0.139 |
| SMA proper | 4 | −11 | 52 | 6 | 5.13 | 419 | 0.152 | 0.098 |
| L Inferior Parietal Lobule | −38 | −40 | 48 | 40 | 5.62 | 387 | 0.126 | 0.117 |
| Patients | ||||||||
| L Postcentral Gyrus | −32 | −36 | 46 | 3 | 4.62 | 316 | 0.132 | 0.086 |
| L M1 | −36 | −26 | 49 | 4 | 5.51 | 2110 | 0.164 | 0.127 |
| R M1 | 34 | −26 | 53 | 4 | 6.12 | 3625 | 0.339 | 0.152 |
| SMA proper | 6 | −9 | 56 | 6 | 5.04 | 486 | 0.089 | 0.106 |
| R Postcentral Gyrus | 40 | −32 | 50 | 40 | 5.11 | 371 | 0.096 | 0.100 |
| R Precunes | 38 | −64 | 33 | 39 | −5.92 | 184 | −0.118 | 0.148 |
List of the brain regions showing a significant connectivity with the right M1 in normal subjects and patients with PD (one sample t test, P < 0.05, FWE corrected). The coordinates are given as stereotaxic coordinates referring to the atlas of Talairach and Tournoux. Positive t value means positive connectivity between the brain regions and M1; Negative t value means negative connectivity between the brain regions and M1; L, left; R, right; M1, primary motor cortex; SD, standard deviation; SMA, supplementary motor area.
Correlation Analysis
Correlation analysis between connectivity t score and the UPDRS motor score in brain areas that showed significant connection with the pre‐SMA revealed significantly negative correlation in left putamen (r = −0.73; P = 0.0005; Fig. 4), and positive correlation in right M1 (r = 0.77; P = 0.0002; Fig. 4) in patients with PD.
Figure 4.

The results of correlation analysis between connectivity t score (y‐axis) and Unified Parkinson's Disease Rating Scale (UPDRS) motor score (x‐axis) in the right M1 (triangle), and left putamen (square) in PD patients. [Color figure can be viewed in the online issue, which is available at wileyonlinelibrary.com.]
Correlation analysis between connectivity t score and the UPDRS motor score in brain areas that showed significant connection with the either left or right M1 did not show any significant correlation in patients with PD.
Functional Connectivity of the PCC
In both groups, the PCC had connectivity with the bilateral medial prefrontal cortex, bilateral parahippocampal gyrus, left inferolateral temporal cortex, bilateral inferior parietal cortex, and cuneus/precuneus (one sample t test, P < 0.05, FWE corrected). There was no significant difference between the two groups (two‐sample t test, P < 0.05, FWE corrected).
DISCUSSION
In the current study, we investigated the functional connectivity in the resting state in patients with PD. Because the pre‐SMA is critical in motor control functions such as motor preparation and initiation, we chose this region as a “seed” to investigate the PD‐related changes of connectivity of motor control networks. Although the M1 may also be involved in some motor planning, its major role is in motor execution. We chose the bilateral M1 as “seed” regions to investigate the PD‐related modulations of motor execution networks. The novel finding of this study is that the functional connectivity in the pre‐SMA, as well as in the M1, is different between patients with PD and normal controls in the resting state. Our study demonstrates that not only the neural activity [Wu et al.,2009], but also the pattern of interactions of brain networks are abnormal in PD during resting state.
The pre‐SMA and M1 showed both positive and negative connectivity with a number of brain regions. Although the significance of negative correlations between brain regions remains unclear, it has been suggested that they arise between functional systems with apparently opposite goals or functions [Di Martino et al.,2008; Fox et al.,2005; Fransson,2005; Greicius et al.,2003; Kelly et al.,2008; Margulies et al.,2007]. Thus, the negative connectivity in the current study means that increase of activity in the pre‐SMA or M1 predicts decrease of activity in those negatively connected related regions. The positive and negative connectivity present the correlated‐ and anticorrelated‐networks between the pre‐SMA or M1 and other brain regions, respectively [Fox et al.,2005; Kelly et al.,2008]. The correlated‐ and anticorrelated‐networks are thought to subserve opposing or competitive processes, and may reflect antagonistic influences of one network on another [Kelly et al.,2008].
Both the positive and negative connectivity in the pre‐SMA are different between patients with PD and normals in the resting state (Fig. 1A,B, Tables II and III). We found positive connectivity between the SMA and left putamen in controls, but not in PD (Fig. 1B,C). It has been shown that, in monkeys [Inase et al.,1999; McGuire et al.,1991a,b], as well as in humans [Lehéricy et al.,2004], the SMA sends bilateral projections to the striatum. The putamen also projects to the cortical motor areas, including the SMA, via the globus pallidus [Alexander et al.,1990; Mink,1996]. In PD, it has been shown that the dopamine uptake is reduced in the striatum, and the most severely affected region is the putamen [Brooks et al.,1990]. In a recent study, we found a decreased regional homogeneity in the putamen in patients with PD compared to normals in the resting state [Wu et al.,2009]. Dopamine deficiency within the striatum induces unbalance of the direct and indirect pathways, and leads to an insufficient thalamocortical facilitation in PD [DeLong,1983]. It has been shown that the putamen is involved in the planning of self‐initiated or self‐paced movements [Cunnington et al.,2002], and the pre‐SMA and anterior striatum are parts of a closed‐loop motor circuit that is involved in preparation and updating of plans for future actions that are under voluntary control [Forstmanna et al.,2008]. In addition, dysfunction of the putamen correlates with clinical scores of akinesia [Benamer et al.,2003]. Possibly, the disconnection between the putamen and pre‐SMA is a consequence of the dysfunction of the basal ganglia. The connectivity between the pre‐SMA and putamen was negatively correlated with UPDRS motor score, which suggests that as the disorder progresses, the interactions among these two regions become more abnormal. This, in turn, may contribute to the difficulty in initiating internally generated movements in PD.
Our observations are inconsistent with a recent report [Helmich et al.,2010], in which the authors did not find decreased functional connectivity between the putamen and pre‐SMA in patients with PD. We think a possible reason contributing to this inconsistency is patient inclusion. In our study, akinesia was the leading symptom in every patient, and all patients had obvious difficulty in initiating movements. The clinical details of that study [Helmich et al.,2010] were not presented. If most of their patients did not have difficulty in motor initiation, then it may explain why they did not find connectivity change between the putamen and pre‐SMA.
We found that in the normal subjects, the pre‐SMA is tightly connected with other motor association areas, like the PMC, insular cortex, and parietal cortex in the baseline resting state (Fig. 1A and Table II). It has been observed that electrical stimulation of the pre‐SMA elicited cortico‐cortical evoked potential at PMC [Matsumoto et al.,2007]. In patients with PD, there was less connectivity between the pre‐SMA and these motor association areas compared to normals, including the right insula, right PMC, and left inferior parietal lobule (Fig. 1C and Table IV).
The insula has connections with a large number of cortical regions, including the orbital cortex, frontal operculum, lateral PMC, ventral granular cortex, SMA, the secondary somatosensory areas and retroinsular area of the parietal lobe, the temporal pole and the superior temporal sulcus [Augustine,1996]. It is also extensively connected with the basal ganglia [Chikama et al.,1997], amygdala, other limbic areas, and the dorsal thalamus [Augustine,1996; Mesulam and Mufson,1985]. The insula has multifaceted sensory and motor functions. It has been identified as a visceral sensory, visceral motor (autonomic), motor association, vestibular, and language‐related area [Augustine,1996]. This region is also involved in complex functions such as working memory and selective visual attention [Grasby et al.,1994].
PD‐related pathological changes, for example, Lewy body and glial cytoplasmic inclusions, were found in the insular cortex [Braak et al.,1996; Mochizuki et al.,2002; Papapetropoulos and Mash,2007], and there is an association between the Lewy body densities and orthostatic hypotension in PD. The pathological changes in the insula also relate to some other symptoms in PD. For example, the performance of novelty seeking in patients with PD correlated with the insular cortical dopamine D2 receptor availability [Kaasinen et al.,2004]. In addition, the regional cerebral blood flow (rCBF) in the insula decreases in PD [Hsu et al.,2007; Kikuchi et al.,2001], and is negatively correlated with the motor UPDRS [Hsu et al.,2007]. It has been suggested that the insular hypoperfusion has a relation with disease severity and participates in motor performance, and is consistent with the extended predictions of the basal ganglia circuit model [Hsu et al.,2007].
The PMC is important in the temporal organization of sequential movements [Halsband et al.,1990,1993], selection of movements [Deiber et al.,1991], and in the generation of motor sequences from memory that fit into a precise plan [Grafton et al.,1992; Shibasaki et al.,1993]. The inferior parietal lobule is also involved in motor processing. It is related to motor selection with external information [Deiber et al.,1991; Grafton et al.,1992], plays a role in selecting and monitoring a sequence, and is involved in the temporal aspects of motor sequence to ensure that each movement occurs after successfully completing the preceding move.
The reduction of connectivity in these motor association areas may disrupt the normal function of central motor networks. Thus, the increased connectivity between the pre‐SMA and right M1 in PD may be a compensation for these decreased connections (Fig. 1C and Table IV). TMS study showed that conditioning stimulations over pre‐SMA significantly enhance motor‐evoked potentials elicited by M1 stimulation [Mars et al.,2009]. Several imaging studies on PD have reported increased activity of the M1 during motor performance compared to normals [Haslinger et al.,2001; Sabatini et al.,2000; Thobois et al.,2004]. In contrast, an fMRI study on drug naive patients with PD observed hypoactivity in the M1 [Buhmann et al.,2003], and the activation increased after levodopa intake. It is possible that the strengthened connectivity of the M1 may reflect compensatory functional reorganization after prolonged dopamine treatment. However, it is also possible that this increased connectivity between the M1 and pre‐SMA is not only simply a compensation, but also reflects the primary pathophysiological changes of PD, as a consequence of the inability to inhibit contextually inappropriate circuits [Grafton et al.,2006; Turner et al.,2003]. An impaired ability to control or focus regional activity could arise from dysfunction of the basal ganglia, per se [Mink,1996], or from dysfunction of the thalamus and/or frontal lobes secondary to abnormal basal ganglia outflow.
Consistent with previous reports [Cordes et al.,2000; Wu et al.,2008], the left and right M1 showed positive connectivity with the M1 and parietal cortex bilaterally, and with the SMA proper in both groups in the resting state (Figs. 2 and 3). We also found some differences between the groups. For example, there were some negative connections in PD, but not in controls (Tables V and VI). However, the comparison between the groups only revealed more local connectivity in the M1 in PD compared to normals (Fig. 2C). In a previous study, we found an increased regional homogeneity in the M1 in patients with PD compared to normals in the resting state [Wu et al.,2009]. These results suggest that the PD‐related change of interactions within motor execution networks is not as obvious as that within motor planning networks, which might be an explanation for the greater difficulties in motor preparation and initiation than in motor execution in PD [Pascual‐Leone et al.,1994a,b].
At a TR of 2,000 ms, the cardiac and respiratory fluctuation effects might be aliased into the low frequency BOLD MR signal fluctuations [Dagli et al., 1999; Lowe et al.,1998]. The low‐pass filtering could not remove the effects of these physiological noises completely. We did not find significant between‐group difference of functional connectivity in the PCC. The PCC has been shown to respond to autonomic fluctuations [Birn et al.,2006; Critchley et al.,2003; Shmueli et al.,2007]. Thus, difference of cardiac and respiratory rates is unlikely an important reason contributing to the effects we observed [Helmich et al.,2010]. However, we can not exclude the potential influence of the cardiac and respiratory rates on our findings. These aliasing effects may reduce the specificity of our findings, or even might further confound the detected differences between the two groups [Birn et al.,2006]. In the future, by simultaneously recording the respiratory and cardiac cycle during the acquisition of whole‐brain imaging data, or by using shorter TR (e.g., 400 ms) and focusing on some specific regions, these physiological effects may be estimated and excluded.
In the current study, we explored changes of interactions of brain networks in the pre‐SMA and bilateral M1 in the resting state. However, other brain areas are also important in motor control, like the PMC and cerebellum. In the future, investigation of the connectivity of brain networks in more motor‐related areas should provide further insights to our understanding on abnormality of baseline state brain function in PD.
In conclusion, our findings showed that both the positive‐ and negative‐networks are in functionally abnormal patterns in PD. The interactions of networks related to motor preparation and initiation have more abnormalities than that of motor execution networks. The disrupted motor control networks may disrupt the function of the pre‐SMA in the resting state, which might make it difficult to initiate voluntary movements and produce a symptom such as akinesia.
REFERENCES
- Alexander GE,Crutcher MD,DeLong MR ( 1990): Basal ganglia‐thalamocortical circuits: Parallel substrates for motor, oculomotor, “prefrontal” and “limbic” functions. Progr Brain Res 85: 119–146. [PubMed] [Google Scholar]
- Augustine JR ( 1996): Circuitry and functional aspects of the insular lobe in primates including humans. Brain Res Rev 22: 229–244. [DOI] [PubMed] [Google Scholar]
- Bares M,Kanovsky P,Klajblova H,Rektor I ( 2003): Intracortical inhibition and facilitation are impaired in patients with early Parkinson's disease: A paired TMS study. Eur J Neurol 10: 385–389. [DOI] [PubMed] [Google Scholar]
- Benamer HT,Oertel WH,Patterson J,Hadley DM,Pogarell O,Hoffken H,Gerstner A,Grosset DG ( 2003): Prospective study of presynaptic dopaminergic imaging in patients with mild parkinsonism and tremor disorders: Part 1. Baseline and 3‐month observations. Mov Disord 18: 977–984. [DOI] [PubMed] [Google Scholar]
- Birn RM,Diamond JB,Smith MA,Bandettini PA ( 2006): Separating respiratory‐variation‐related fluctuations from neuronal‐activity‐related fluctuations in fMRI. Neuroimage 31: 1536–1548. [DOI] [PubMed] [Google Scholar]
- Biswal B,Yetkin FZ,Haughton VM,Hyde JS ( 1995): Functional connectivity in the motor cortex of resting human brain using echo‐planar MRI. Magn Reson Med 34: 537–541. [DOI] [PubMed] [Google Scholar]
- Bonnefoi‐Kyriacou B,Legallet E,Lee RG,Trouche E ( 1998): Spatiotemporal and kinematic analysis of pointing movements performed by cerebellar patients with limb ataxia. Exp Brain Res 119: 460–466. [DOI] [PubMed] [Google Scholar]
- Braak H,Braak E,Yilmazer D,de Vos RA,Jansen EN,Bohl J ( 1996): Pattern of brain destruction in Parkinson's and Alzheimer's diseases. J Neural Trans 103: 455–490. [DOI] [PubMed] [Google Scholar]
- Bressler SL,Kelso JAS ( 2001): Cortical coordination dynamics and cognition. Trends Cogn Sci 5: 26–36. [DOI] [PubMed] [Google Scholar]
- Brooks DJ,Ibanez V,Sawle GV,Quinn N,Lees AJ,Mathias CJ,Bannister R,Marsden CD,Frackowiak RS ( 1990): Differing patterns of striatal 18F‐dopa uptake in Parkinson's disease, multiple system atrophy, and progressive supranuclear palsy. Ann Neurol 28: 547–555. [DOI] [PubMed] [Google Scholar]
- Buchel C,Coull JT,Friston KJ ( 1999): The predictive value of changes in effective connectivity for human learning. Science 283: 1538–1541. [DOI] [PubMed] [Google Scholar]
- Buchel C,Friston KJ ( 1997): Modulation of connectivity in visual pathways by attention: Cortical interactions evaluated with structural equation modelling and fMRI. Cereb Cortex 7: 768–778. [DOI] [PubMed] [Google Scholar]
- Buchel C ( 2004): Perspectives on the estimation of effective connectivity from neuroimaging data. Neuroinformatics 2: 169–174. [DOI] [PubMed] [Google Scholar]
- Buhmann C,Glauche V,Sturenburg HJ,Oechsner M,Weiller C,Buchel C ( 2003): Pharmacologically modulated fMRI—Cortical responsiveness to levodopa in drug‐naïve hemiparkinsonian patients. Brain 126: 451–461. [DOI] [PubMed] [Google Scholar]
- Catalan MJ,Ishii K,Honda M,Samii A,Hallett A ( 1999): PET study of sequential finger movements of varying length in patients with Parkinson's disease. Brain 122: 483–495. [DOI] [PubMed] [Google Scholar]
- Chikama M,McFarland NR,Amaral DG,Haber SN ( 1997): Insular cortical projections to functional regions of the striatum correlate with cortical cytoarchitectonic organization in the primate. J Neurosci 17: 9686–9705. [DOI] [PMC free article] [PubMed] [Google Scholar]
- Cordes D,Haughton VM,Arfanakis K,Wendt GJ,Turski PA,Moritz CH,Quigley MA,Meyerand ME ( 2000): Mapping functionally related regions of brain with functional connectivity MR imaging. AJNR Am J Neuroradiol 21: 1636–1644. [PMC free article] [PubMed] [Google Scholar]
- Critchley HD,Mathias CJ,Josephs O,O'Doherty J,Zanini S,Dewar BK,Cipolotti L,Shallice T,Dolan RJ ( 2003): Human cingulate cortex and autonomic control: Converging neuroimaging and clinical evidence. Brain 126: 2139–2152. [DOI] [PubMed] [Google Scholar]
- Cunnington R,Windischberger C,Deecke L,Moser E ( 2002): The preparation and execution of self‐initiated and externally‐triggered movement: A study of event‐related fMRI. NeuroImage 15: 373–385. [DOI] [PubMed] [Google Scholar]
- Deiber MP,Passingham RE,Colebatch JG,Friston KJ,Nixon PD,Frackowiak RS ( 1991): Cortical areas and the selection of movement: A study with positron emission tomography. Exp Brain Res 84: 393–402. [DOI] [PubMed] [Google Scholar]
- Deiber MP,Ibanez V,Sadato N,Hallett M ( 1996): Cerebral structures participating in motor preparation in humans: A positron emission tomography study. J Neurophysiol 75: 233–247. [DOI] [PubMed] [Google Scholar]
- DeLong MR ( 1983): The neurophysiologic basis of abnormal movements in basal ganglia disorders. Neurobehav Toxicol Teratol 5: 611–616. [PubMed] [Google Scholar]
- Di Martino A,Scheres A,Margulies DS,Kelly AM,Uddin LQ,Shehzad Z,Biswal B,Walters JR,Castellanos FX,Milham MP ( 2008): Functional connectivity of human striatum: A resting state fMRI study. Cereb Cortex 18: 2735–2747. [DOI] [PubMed] [Google Scholar]
- Dick JP,Rothwell JC,Day BL,Cantello R,Buruma O,Gioux M,Benecke R,Berardelli A,Thompson PD,Marsden CD ( 1989): The Bereitschaftspotentials is abnormal in Parkinson's disease. Brain 112: 233–244. [DOI] [PubMed] [Google Scholar]
- Eckert T,Barnes A,Dhawan V,Frucht S,Gordon MF,Feigin AS,Eidelberg D ( 2005): FDG PET in the differential diagnosis of parkinsonian disorders. NeuroImage 26: 912–921. [DOI] [PubMed] [Google Scholar]
- Eidelberg D,Moeller JR,Ishikawa T,Dhawan V,Spetsieris P,Chaly T,Robeson W,Dahl JR,Margouleff D ( 1995): Assessment of disease severity in parkinsonism with fluorine‐18‐fluorodeoxyglucose and PET. J Nucl Med 36: 378–383. [PubMed] [Google Scholar]
- Forstmanna B,Dutilh G,Brown S,Neumann J,Cramond DYV,Ridderinkhof KR,Wagenmakers E ( 2008): Striatum and pre‐SMA facilitate decision‐making under time pressure. Proc Natl Acad Sci USA 105: 17538–17542. [DOI] [PMC free article] [PubMed] [Google Scholar]
- Fox MD,Snyder AZ,Vincent JL,Corbetta M,Van E,Raichle ME ( 2005): The human brain is intrinsically organized into dynamic, anti‐correlated functional networks. Proc Natl Acad Sci USA 102: 9673–9678. [DOI] [PMC free article] [PubMed] [Google Scholar]
- Fransson P ( 2005): Spontaneous low‐frequency BOLD signal fluctuations: An fMRI investigation of the resting‐state default mode of brain function hypothesis. Hum Brain Mapp 26: 15–29. [DOI] [PMC free article] [PubMed] [Google Scholar]
- Friston KJ,Buchel C ( 2000): Attentional modulation of effective connectivity from V2 to V5/MT in humans. Proc Natl Acad Sci USA 97: 7591–7596. [DOI] [PMC free article] [PubMed] [Google Scholar]
- Friston KJ,Frith CD,Liddle PF,Frackowiak RS ( 1993a): Functional connectivity: The principal component analysis of large (PET) data sets. J Cereb Blood Flow Metab 13: 5–14. [DOI] [PubMed] [Google Scholar]
- Friston KJ,Frith CD,Frackowiak RS ( 1993b): Time‐dependent changes in effective connectivity measured with PET. Hum Brain Mapp 1: 69–80. [Google Scholar]
- Friston KJ ( 1995): Functional and effective connectivity in neuroimaging: A synthesis. Hum Brain Mapp 2: 56–78. [Google Scholar]
- Fu QG,Flament D,Coltz J,Ebner T ( 1997): Relationship of cerebellar purkinje cell simple spike discharge to movement kinematics in the monkey. J Neurophysiol 78: 478–491. [DOI] [PubMed] [Google Scholar]
- Grafton ST,Mazziotta JC,Presty S,Friston KJ,Frackowiak RS,Phelps ME ( 1992): Functional anatomy of human procedural learning determined with regional cerebral blood flow and PET. J Neurosci 12: 2542–2548. [DOI] [PMC free article] [PubMed] [Google Scholar]
- Grafton ST,Turner RS,Desmurget M,Bakay R,Delong M,Vitek J,Crutcher M ( 2006): Normalizing motor‐related brain activity: Subthalamic nucleus stimulation in Parkinson disease. Neurology 66: 1192–1199. [DOI] [PubMed] [Google Scholar]
- Grafton ST ( 2004): Contributions of functional imaging to understanding parkinsonian symptoms. Curr Opin Neurobiol 14: 715–719. [DOI] [PubMed] [Google Scholar]
- Grasby PM,Frith CD,Friston KJ,Simpson J,Fletcher PC,Frackowiak RSJ,DoLan RJ ( 1994): A graded task approach to the functional mapping of brain areas implicated in auditory‐verbal memory. Brain 117: 1271–1282. [DOI] [PubMed] [Google Scholar]
- Greicius MD,Krasnow B,Reiss AL,Menon V ( 2003): Functional connectivity in the resting brain: A network analysis of the default mode hypothesis. Proc Natl Acad Sci USA 100: 253–258. [DOI] [PMC free article] [PubMed] [Google Scholar]
- Hallett M,Cohen LG,Bierner SM ( 1991): Studies of sensory and motor cortex physiology: With observations on akinesia in Parkinson's disease. Electroencephalogr Clin Neurophysiol Suppl 43: 76–85. [PubMed] [Google Scholar]
- Halsband U,Freund HJ ( 1990): Premotor cortex and conditional motor learning in man. Brain 113: 207–222. [DOI] [PubMed] [Google Scholar]
- Halsband U,Ito N,Tanji J,Freund HJ ( 1993): The role of premotor cortex and the supplementary motor area in the temporal control of movement in man. Brain 116: 243–266. [DOI] [PubMed] [Google Scholar]
- Haslinger B,Erhard P,Kampfe N,Boecker H,Rummeny E,Schwaiger M,Conrad B,Ceballos‐Baumann AO ( 2001): Event‐related functional magnetic resonance imaging in Parkinson's disease before and after levodopa. Brain 124: 558–570. [DOI] [PubMed] [Google Scholar]
- He AG,Tan LH,Tang Y,James GA,Wright P,Eckert MA,Fox PT,Liu Y ( 2003): Modulation of neural connectivity during tongue movement and reading. Hum Brain Mapp 18: 222–232. [DOI] [PMC free article] [PubMed] [Google Scholar]
- Helmich RC,Derikx LC,Bakker M,Scheeringa R,Bloem BR,Toni I ( 2010): Spatial remapping of cortico‐striatal connectivity in Parkinson's disease. Cereb Cortex 20: 1175–1186. [DOI] [PubMed] [Google Scholar]
- Hoehn MM,Yahr MD ( 1967): Parkinsonism: Onset, progression and mortality. Neurology 17: 427–442. [DOI] [PubMed] [Google Scholar]
- Hoshi E,Tremblay L,Feger J,Carras PL,Strick PL ( 2005): The cerebellum communicates with the basal ganglia. Nat Neurosci 8: 1491–1493. [DOI] [PubMed] [Google Scholar]
- Hsu JL,Jung TP,Hsu CY,Hsu YH,Chen YK,Duann JR,Wang HC,Makeig S ( 2007): Regional CBF changes in Parkinson's disease: A correlation with motor dysfunction. Eur J Nucl Med Mol Imaging 34: 1458–1466. [DOI] [PubMed] [Google Scholar]
- Huang C,Mattis P,Perrine K,Brown N,Dhawan V,Eidelberg D ( 2008): Metabolic abnormalities associated with mild cognitive impairment in Parkinson disease. Neurology 70: 1470–1477. [DOI] [PMC free article] [PubMed] [Google Scholar]
- Huang C,Mattis P,Tang C,Perrine K,Carbon M,Eidelberg D ( 2007): Metabolic brain networks associated with cognitive function in Parkinson's disease. Neuroimage 34: 714–723. [DOI] [PMC free article] [PubMed] [Google Scholar]
- Ichinohe N,Mori F,Shoumura K ( 2000): A di‐synaptic projection from the lateral cerebellar nucleus to the laterodorsal part of the striatum via the central lateral nucleus of the thalamus in the rat. Brain Res 880: 191–197. [DOI] [PubMed] [Google Scholar]
- Inase M,Tokuno H,Nambu A,Akazawa T,Takada M ( 1999): Corticostriatal and corticosubthalamic input zones from the presupplementary motor area in the macaque monkey: Comparison with the input zones from the supplementary motor area. Brain Res 833: 191–201. [DOI] [PubMed] [Google Scholar]
- Jahanshani M,Jenkins H,Brown RG,Marsden CD,Passingham RE,Brooks DJ ( 1995): Self‐initiated versus externally triggered movements. I. An investigation using measurement of regional cerebral blood flow with PET and movement‐related potentials in normal and Parkinson's disease subjects. Brain 118: 913–933. [DOI] [PubMed] [Google Scholar]
- Jenkins IH,Jahanshahi M,Jueptner M,Passingham RE,Brooks DJ ( 2000): Self‐initiated versus externally triggered movements. II. The effect of movement predictability on regional cerebral blood flow. Brain 123: 1216–1228. [DOI] [PubMed] [Google Scholar]
- Jiang A,Kennedy DN,Baker JR,Weisskoff RM,Tootell RB,Woods RP,Benson RR,Kwong KK,Brady TJ,Rosen BR,Belliveau JW ( 1995): Motion detection and correction in functional MR imaging. Hum Brain Mapp 3: 224–235. [Google Scholar]
- Jiang TZ,He Y,Zang YF,Weng XC ( 2004): Modulation of functional connectivity during the resting state and the motor task. Hum Brain Mapp 22: 63–71. [DOI] [PMC free article] [PubMed] [Google Scholar]
- Jueptner M,Weiller C ( 1998): A review of differences between basal ganglia and cerebellar control of movements as revealed by functional imaging studies. Brain 121: 1437–1449. [DOI] [PubMed] [Google Scholar]
- Jueptner M,Stephan KM,Frith CD,Brooks DJ,Frackowiak RSJ ( 1997a): Anatomy of motor learning. I. Frontal cortex and attention to action. J Neurophysiol 77: 1313–1324. [DOI] [PubMed] [Google Scholar]
- Jueptner M,Frith CD,Brooks DJ,Frackowiak RSJ,Passingham RE ( 1997b): Anatomy of motor learning. II. Subcortical structures and learning by trail and error. J Neurophysiol 77: 1325–1337. [DOI] [PubMed] [Google Scholar]
- Kaasinen V,Aalto S,Nagren K,Rinne JO ( 2004): Insular dopamine D2 receptors and novelty seeking personality in Parkinson's disease. Mov Disord 19: 1348–1351. [DOI] [PubMed] [Google Scholar]
- Kelly CAM,Uddin LQ,Biswal BB,Castellanos FX,Milham MP ( 2008): Competition between functional brain networks mediates behavioral variability. Neuroimage 39: 527–537. [DOI] [PubMed] [Google Scholar]
- Kikuchi A,Takeda A,Kimpara T,Nakagawa M,Kawashima R,Sugiura M,Kinomura S,Fukuda H,Chida K,Okita N,Takase S,Itoyama Y ( 2001): Hypoperfusion in the supplementary motor area, dorsolateral prefrontal cortex and insular cortex in Parkinson's disease. J Neurol Sci 193: 29–36. [DOI] [PubMed] [Google Scholar]
- Lang AE,Fahn S ( 1989): Assessment of Parkinson's disease In: Munsat TL, editor. Quantification of Neurological Deficit. Boston: Butterworths; pp 285–309. [Google Scholar]
- Lang CE,Bastian AJ ( 2002): Cerebellar damage impairs automaticity of a recently practiced movement. J Neurophysiol 87: 1336–1347. [DOI] [PubMed] [Google Scholar]
- Lefaucheur JP,Drouot X,Von Raison F,Ménard‐Lefaucheur I,Cesaro P,Nguyen JP ( 2004): Improvement of motor performance and modulation of cortical excitability by repetitive transcranial magnetic stimulation of the motor cortex in Parkinson's disease. Clin Neurophysiol 115: 2530–2541. [DOI] [PubMed] [Google Scholar]
- Lefaucheur ( 2005): Motor cortex dysfunction revealed by cortical excitability studies in Parkinson's disease: Influence of antiparkinsonian treatment and cortical stimulation. Clin Neurophysiol 116: 244–253. [DOI] [PubMed] [Google Scholar]
- Lehéricy S,Ducros M,Krainik A,Francois C,Van de Moortele P,Ugurbil K,Kim DS ( 2004): 3D diffusion tensor axonal tracking shows distinct SMA and Pre‐SMA projections to the human striatum. Cereb Cortex 14: 1302–1309. [DOI] [PubMed] [Google Scholar]
- Liu YJ,Gao JH,Liotti M,Pu Y,Fox PT ( 1999): Temporal dissociation of parallel processing in the human subcortical outputs. Nature 400: 364–367. [DOI] [PubMed] [Google Scholar]
- Logothetis NK,Pauls J,Augath M,Trinath T,Oeltermann A ( 2001): Neurophysiological investigation of the basis of the fMRI signal. Nature 412: 150–157. [DOI] [PubMed] [Google Scholar]
- Lowe MJ,Mock BJ,Sorenson JA ( 1998): Functional connectivity in single and multislice echoplanar imaging using resting‐state fluctuations. NeuroImage 7: 119–132. [DOI] [PubMed] [Google Scholar]
- Lu H,Zuo Y,Gu H,Waltz JA,Zhan W,Scholl CA,Rea W,Yang Y,Stein EA ( 2007): Synchronized delta oscillations correlate with the resting‐state functional MRI signal. Proc Natl Acad Sci USA 104: 18265–18269. [DOI] [PMC free article] [PubMed] [Google Scholar]
- Luders E,Gaser C,Jancke L,Schlaug G ( 2004): A voxel‐based approach to gray matter asymmetries. Neuroimage 22: 656–664. [DOI] [PubMed] [Google Scholar]
- Manzoni D ( 2007): The cerebellum and sensorimotor coupling: Looking at the problem from the perspective of vestibular reflexes. Cerebellum 6: 24–37. [DOI] [PubMed] [Google Scholar]
- Margulies DS,Kelly AM,Uddin LQ,Biswal BB,Castellanos FX,Milham MP ( 2007): Mapping the functional connectivity of anterior cingulate cortex. Neuroimage 37: 579–588. [DOI] [PubMed] [Google Scholar]
- Mars RB,Klein MC,Neubert FX,Olivier E,Buch ER,Boorman ED,Rushworth MF ( 2009): Pre‐SMA exerts top‐down control over primary motor cortex during response switching: A paired‐pulse transcranial magnetic stimulation and diffusion‐weighted imaging study. NeuroImage 47 ( Suppl 1): S177. [Google Scholar]
- Matsui H,Udaka F,Miyoshi T,Hara N,Tamura A,Oda M,Kubori T,Nishinaka K,Kameyama M ( 2006): Frontal assessment battery and brain perfusion image in Parkinson's disease. J Geriatr Psychiatry Neurol 19: 41–45. [DOI] [PubMed] [Google Scholar]
- Matsumoto R,Nair DR,LaPresto E,Bingaman W,Shibasaki H,Luders HO ( 2007): Functional connectivity in human cortical motor system: A cortico‐cortical evoked potential study. Brain 130: 181–197. [DOI] [PubMed] [Google Scholar]
- McGuire PK,Bates JF,Goldman‐Rakic PS ( 1991a): Interhemispheric integration: I. Symmetry and convergence of the corticocortical connections of the left and the right principal sulcus (PS) and the left and the right supplementary motor area (SMA) in the rhesus monkey. Cereb Cortex 1: 390–407. [DOI] [PubMed] [Google Scholar]
- McGuire PK,Bates JF,Goldman‐Rakic PS ( 1991b): Interhemispheric integration: II. Symmetry and convergence of the corticostriatal projections of the left and the right principal sulcus (PS) and the left and the right supplementary motor area (SMA) of the rhesus monkey. Cereb Cortex 1: 408–417. [DOI] [PubMed] [Google Scholar]
- Mesulam MM,Mufson EJ ( 1985): The insula of reil in man and monkey. Architectonics, connectivity, and function In: Peters A,Jones EG, editors. Cerebral Cortex, Vol. 4 Association and Auditory Cortices. New York: Plenum Press; pp 179–226. [Google Scholar]
- Middleton FA,Strick PL ( 2000): Basal ganglia and cerebellar loops: Motor and cognitive circuits. Brain Res Brain Res Rev 31: 236–250. [DOI] [PubMed] [Google Scholar]
- Middleton FA,Strick PL ( 2001): Cerebellar projections to the prefrontal cortex of the primate. J Neurosci 21: 700–712. [DOI] [PMC free article] [PubMed] [Google Scholar]
- Mink J ( 1996): The basal ganglia: Focused selection and inhibition of competing motor programs. Prog Neurobiol 50: 381–425. [DOI] [PubMed] [Google Scholar]
- Mochizuki A,Komatsuzaki Y,Shoji S ( 2002): Association of Lewy bodies and glial cytoplasmic inclusions in the brain of Parkinson's disease. Acta Neuropathol 104: 534–537. [DOI] [PubMed] [Google Scholar]
- Murphy K,Birn RM,Handwerker DA,Jones TB,Bandettini PA ( 2009): The impact of global signal regression on resting state correlations: Are anti‐correlated networks introduced? Neuroimage 44: 893–905. [DOI] [PMC free article] [PubMed] [Google Scholar]
- Oldfield RC ( 1971): The assessment and analysis of handedness: The Edinburgh inventory. Neuropsychologia 9: 97–113. [DOI] [PubMed] [Google Scholar]
- Papapetropoulos S,Mash DC ( 2007): Insular pathology in Parkinson's disease patients with orthostatic hypotension. Parkinsonism Relat Disord 13: 308–311. [DOI] [PubMed] [Google Scholar]
- Pascual‐Leone A,Valls‐Solé J,Brasil‐Neto JP,Cammarota A,Grafman J,Hallett M ( 1994a): Akinesia in Parkinson's disease. I. Shortening of simple reaction time with focal, single‐pulse transcranial magnetic stimulation. Neurology 44: 884–891. [DOI] [PubMed] [Google Scholar]
- Pascual‐Leone A,Valls‐Solé J,Brasil‐Neto JP,Cammarota A,Grafman J,Hallett M ( 1994b): Akinesia in Parkinson's disease. II. Effects of subthreshold repetitive transcranial motor cortex stimulation. Neurology 44: 892–898. [DOI] [PubMed] [Google Scholar]
- Pelled G,Goelman G ( 2004): Different physiological MRI noise between cortical layers. Magn Reson Med 52: 913–916. [DOI] [PubMed] [Google Scholar]
- Petrides M,Alivisatos B,Evans AC,Meyer E ( 1993): Dissociation of human mid‐dorsolateral from posterior dorsolateral frontal cortex in memory processing. Proc Natl Acad Sci USA 90: 873–877. [DOI] [PMC free article] [PubMed] [Google Scholar]
- Playford ED,Jenkins IH,Passingham RE,Nutt J,Frackowiak RS,Brooks DJ ( 1992): Impaired mesial frontal and putamen activation in Parkinson's disease: A positron emission tomography study. Ann Neurol 32: 151–161. [DOI] [PubMed] [Google Scholar]
- Press WH,Teukolsky SA,Vetterling WT,Flannery BP ( 1992): Numerical Recipes in C, 2nd ed. Cambridge: U.K. Cambridge Univ. Press. [Google Scholar]
- Rascol O,Sabatini U,Fabre N,Brefel C,Loubinoux I,Celsis P,Senard JM,Montastruc JL,Chollet F ( 1997): The ipsilateral cerebellar hemisphere is overactive during hand movements in akinetic parkinsonian patients. Brain 120: 103–110. [DOI] [PubMed] [Google Scholar]
- Rizzolatti G,Luppino G ( 2001): The cortical motor system. Neuron 31: 889–901. [DOI] [PubMed] [Google Scholar]
- Rowe J,Stephan KE,Friston K,Frackowiak R,Lees A,Passingham R ( 2002): Attention to action in Parkinson's disease: Impaired effective connectivity among frontal cortical regions. Brain 125: 276–289. [DOI] [PubMed] [Google Scholar]
- Sabatini U,Boulanouar K,Fabre N,Martin F,Carel C,Colonnese C,Bozzao L,Berry I,Montastruc JL,Chollet F,Rascol O ( 2000): Cortical motor reorganization in akinetic patients with Parkinson's disease: A functional MRI study. Brain 123: 394–403. [DOI] [PubMed] [Google Scholar]
- Shibasaki H,Sadato N,Lyshkow H,Yonekura Y,Honda M,Nagamine T,Suwazono S,Magata Y,Ikeda A,Miyazaki M ( 1993): Both primary motor cortex and supplementary motor area play an important role in complex finger movement. Brain 116: 1387–1398. [DOI] [PubMed] [Google Scholar]
- Shmueli K,van Gelderen P,de Zwart JA,Horovitz SG,Fukunaga M,Jansma JM,Duyn JH ( 2007): Low‐frequency fluctuations in the cardiac rate as a source of variance in the resting‐state fMRI BOLD signal. Neuroimage 38: 306–320. [DOI] [PMC free article] [PubMed] [Google Scholar]
- Simon SR,Meunier M,Piettre L,Berardi AM,Segebarth CM,Boussaoud D ( 2002): Spatial attention and memory versus motor preparation: Premotor cortex involvement as revealed by fMRI. J Neurophysiol 88: 2047–2057. [DOI] [PubMed] [Google Scholar]
- Stein JF,Glickstein M ( 1992): Role of the cerebellum in visual guidance of movement. (Review). Physiol Rev 72: 967–1017. [DOI] [PubMed] [Google Scholar]
- Talairach J,Tournoux P ( 1988): Co‐Planar Stereotaxic Atlas of the Human Brain. Stuttgart, Germany: Thieme. [Google Scholar]
- Tanji J,Hoshi E ( 2001): Behavioral planning in the prefrontal cortex. Curr Opin Neurobiol 11: 164–170. [DOI] [PubMed] [Google Scholar]
- Thach WT,Goodkin HP,Keating JG ( 1992): The cerebellum and the adaptive coordination of movement (Review). Annu Rev Neurosci 15: 403–442. [DOI] [PubMed] [Google Scholar]
- Thobois S,Jahanshahi M,Pinto S,Frackowiak R,Limousin‐Dowsey P ( 2004): PET and SPECT functional imaging studies in Parkinsonian syndromes: From the lesion to its consequences. Neuroimage 23: 1–16. [DOI] [PubMed] [Google Scholar]
- Turner RS,Grafton ST,Hoffman JM,Votaw JR,DeLong MR ( 1998): Motor subcircuits mediating the control of movement velocity: A PET study. J Neurophysiol 80: 2162–2176. [DOI] [PubMed] [Google Scholar]
- Turner RS,Grafton ST,McIntosh AR,DeLong MR,Hoffman JM ( 2003): The functional anatomy of parkinsonian bradykinesia. Neuroimage 19: 163–179. [DOI] [PubMed] [Google Scholar]
- Wang L,Zang YF,He Y,Zhang XQ,Jiang TZ,Liang M,Tian LX,Wu T,Li KC ( 2006): Changes of hippocampal connectivity in the early stages of Alzheimer's disease: Evidence from resting state fMRI. NeuroImage 31: 496–504. [DOI] [PubMed] [Google Scholar]
- Wu C,Gu H,Lu H,Stein EA,Chen JH,Yang Y ( 2008): Frequency specificity of functional connectivity in brain networks. Neuroimage 42: 1047–1055. [DOI] [PMC free article] [PubMed] [Google Scholar]
- Wu T,Hallett M ( 2005): A functional MRI study of automatic movements in patients with Parkinson's disease. Brain 128: 2250–2259. [DOI] [PubMed] [Google Scholar]
- Wu T,Hallett M ( 2008): Neural correlates of dual task performance in patients with Parkinson's disease. J Neurol Neurosurg Psychiatry 79: 760–766. [DOI] [PubMed] [Google Scholar]
- Wu T,Kansaku K,Hallett M ( 2004): How self‐initiated memorized movements become automatic: A fMRI study. J Neurophysiol 91: 1690–1698. [DOI] [PubMed] [Google Scholar]
- Wu T,Long X,Zang Y,Wang L,Hallett M,Li K,Chan P ( 2009): Regional homogeneity changes in patients with Parkinson's disease. Hum Brain Mapp 30: 1502–1510. [DOI] [PMC free article] [PubMed] [Google Scholar]
- Wu T,Wang L,Chen Y,Zhao C,Li K,Chan P ( 2009): Changes of functional connectivity of the motor network in the resting state in Parkinson's disease. Neurosci Lett 460: 6–10. [DOI] [PubMed] [Google Scholar]
- Xiong J,Parsons LM,Gao JH,Fox PT ( 1999): Interregional connectivity to primary motor cortex revealed using MRI resting state images. Hum Brain Mapp 8: 151–156. [DOI] [PMC free article] [PubMed] [Google Scholar]
- Yu H,Sternad D,Corcos DM,Vaillancourt DE ( 2007): Role of hyperactive cerebellum and motor cortex in Parkinson's disease. Neuroimage 35: 222–233. [DOI] [PMC free article] [PubMed] [Google Scholar]