

Abstract
Object recognition occurs even when environmental information is incomplete. Illusory contours (ICs), in which a contour is perceived though the contour edges are incomplete, have been extensively studied as an example of such a visual completion phenomenon. Despite the neural activity in response to ICs in visual cortical areas from low (V1 and V2) to high (LOC: the lateral occipital cortex) levels, the details of the neural processing underlying IC perception are largely not clarified. For example, how do the visual areas function in IC perception and how do they interact to archive the coherent contour perception? IC perception involves the process of completing the local discrete contour edges (contour completion) and the process of representing the global completed contour information (contour representation). Here, functional magnetic resonance imaging was used to dissociate contour completion and contour representation by varying each in opposite directions. The results show that the neural activity was stronger to stimuli with more contour completion than to stimuli with more contour representation in V1 and V2, which was the reverse of that in the LOC. When inspecting the neural activity change across the visual pathway, the activation remained high for the stimuli with more contour completion and increased for the stimuli with more contour representation. These results suggest distinct neural correlates of contour completion and contour representation, and the possible collaboration between the two processes during IC perception, indicating a neural connection between the discrete retinal input and the coherent visual percept. Hum Brain Mapp 33:2407–2414, 2012. © 2011 Wiley Periodicals, Inc.
Keywords: binding, fMRI, object, vision
INTRODUCTION
Environmental information is often incomplete, but the brain can recognize objects by completing the discrete visual information. This completion phenomenon in visual object recognition has been extensively studied, especially with the Kanizsa‐type illusory counters (ICs) [Kanizsa, 1955; Murray et al., 2002; Seghier and Vuilleumier, 2006; TallonBaudry et al., 1996]. In the Kanizsa‐type ICs, the discrete contour edges are completed so that a contour is perceived (see Fig. 1). An IC was often compared with a scrambled control stimulus [Csibra et al., 2000; Ffytche and Zeki, 1996; Hirsch et al., 1995; Kruggel et al., 2001; Larsson et al., 1999; Lee and Nguyen, 2001; Mendola et al., 1999; Murray et al., 2002; Seghier et al., 2000; TallonBaudry et al., 1996] and visual areas from low (V1 and V2) to high (LOC: the lateral occipital cortex) levels were shown to be involved in IC perception. Two basic neural mechanisms have been hypothesized for IC perception: one that analyzes the local visual information and one that processes the global visual information [Halko et al., 2008; Seghier and Vuilleumier, 2006]. The local mechanism is proposed to occur at an early stage and in low‐level visual areas such as V1 and V2. The gaps between the inducers are supposed to be completed by interpolation [Halko et al., 2008; Shipley and Kellman, 1992]. The local mechanism is also often referred to as a feed‐forward or bottom‐up mechanism [Ffytche and Zeki, 1996]. The global mechanism is proposed to take place at a later stage and in high‐level visual areas such as the LOC. The global processing can send feed‐back or top‐down signals to the local processing [Murray et al., 2002, 2004]. The stage (later or early) or the figural characteristic (contour or surface) of the global mechanism is still in controversy. For instance, Stanley and Rubin [ 2003] suggest that the global surface information could be extracted before the local features are analyzed. In addition, Kanizsa‐type ICs are a classic type of feature binding that integrates discrete local features into global coherent objects [Seghier and Vuilleumier, 2006; Treisman, 1999]. The neurophysiological hypothesis of feature binding proposes that the local visual information is integrated by the ongoing neuronal synchronization and another neural approach (unclear so far) is required to collect the integrated global information. This neurophysiological hypothesis also concerns the local and global mechanisms, with an emphasis on the tight real‐time collaboration between them [Singer, 1999; Treisman, 1999].
Figure 1.
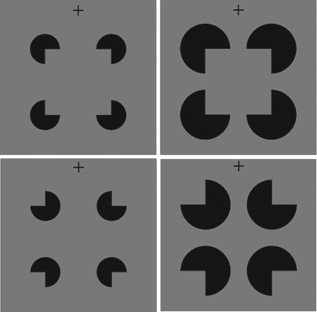
Illustration of the experimental stimuli. The Kanizsa (upper) and control (lower) stimuli with large (left) and small (right) gaps are shown. The size of the inducer gaps was varied so that contour completion (interpolation between gaps) and contour representation (contour strength or contour clarity) varied in opposite directions. As the interpolation increased (i.e., more gap), the contour strength became weaker, and vice versa. For instance, the strength of the contour of a square was weaker in the large‐gap than in the small‐gap condition, but more interpolation was needed.
Despite the neural responses to ICs in visual areas from V1 to the LOC, the details of the neural processing underlying IC perception are largely not clarified. The direct evidence supporting and differentiating the local and global mechanisms is still lacking. For example, do the local and global processes involve the same visual areas? Or are some visual areas more involved in one process than in the other process? In addition, how do the local and global processes interact to archive the vivid contour perception? To answer these questions, one approach could be to dissociate the local and global processes and the corresponding neural mechanisms. If the local and global mechanisms are dissociable, it would also be possible to observe the collaboration between them. It has been shown that Kanizsa‐type IC perception is associated with the ratio of physically specified edge length to total edge length (support ratio) of the stimuli [Shipley and Kellman, 1992]. IC perception is not a binary (present or absent) visual experience. The contour strength or contour clarity of the Kanizsa stimuli with a larger support ratio is stronger than that of those with a smaller support ratio. Inspired by the work of Shipley and Kellman [Shipley and Kellman, 1992], we produced the Kanizsa‐type ICs with small and large support ratios by varying the size of the inducer gaps (gaps between contour edges) to dissociate the local and global mechanisms. The large‐gap stimuli had a small support ratio and the small‐gap stimuli had a large support ratio. Meanwhile, the size of the contour was the same in the large‐ and small‐gap conditions and thus comparable between conditions (see Fig. 1). In this varying‐gap design, the local and global mechanisms varied in opposite directions. As the need for the interpolation between gaps increased (i.e., more gap), the contour strength became weaker, and vice versa. Thus we would be able to examine the neural correlates of the local and global processes. This paradigm has also been adopted in a recent behavioral study, which showed that the contour strength was effectively modulated, indicating distinct local and global mechanisms [Halko et al., 2008]. The current design manipulated the process of completing the discrete contour information (interpolation between gaps) and the process of representing the completed contour information (contour strength). The mechanisms revealed by this paradigm might not be the same as the surface perception mechanisms suggested by Stanley and Rubin [ 2003]. Stanley and Rubin [ 2003] investigated a common surface perception mechanism that is involved in perceiving both contours and globally completed regions, while the current study focused on the contour‐related mechanisms. To be more accurate, we defined the local and global processes modulated in the present study as contour completion and contour representation. ICs and control stimuli with large or small gaps were presented during functional magnetic resonance imaging (fMRI) scanning. To reduce the potential that more attention could be paid to ICs than to control stimuli [Herrmann et al., 1999; TallonBaudry et al., 1996; Wu and Zhang, 2009], subjects were required to maintain fixation without a task related to ICs [Hirsch et al., 1995; Mendola et al., 1999; Stanley and Rubin, 2003].
MATERIALS AND METHODS
Participants
Seven subjects from the University of Science and Technology of China (USTC) (ages 20–26, three males) and three subjects from the University of Minnesota (UMN) (ages 31–33, two males.) participated in the main experiment. Three subjects (ages 22–33, two males) from UMN participated in the control experiment. All subjects were right‐handed and had normal or corrected‐to‐normal vision. They all gave written, informed consents in accordance with procedures and protocols approved by USTC or UMN.
Stimuli and Procedure
Main experiment
The four inducers were arranged so that an illusory square appeared in Kanizsa figures and disappeared in control stimuli (see Fig. 1). The support ratio was 0.45 and 0.75 in the large‐ and small‐gap conditions, respectively. The size of the illusory square was the same in the large‐ and small‐gap conditions. USTC subjects underwent two 510s runs with 18s blocks interleaved by 12s rests. The stimuli were presented in different blocks four times. The sequence of the stimuli was randomized. In each block, a stimulus alternated between two versions of the stimulus (reversal contrast) at 1 Hz to prevent retinotopic visual aftereffects and to make the stimulus more dynamic [Mendola et al., 1999]. The stimuli were displayed on a gray background and subtended a visual angle of 2.5°. Subjects were asked to fixate on the fixation cross above the stimuli, which was to reduce the possibility of the eccentricity difference between Kanizsa and control stimuli with a center fixation cross. UMN subjects underwent three 300s runs with 12s blocks interleaved by 12s rests. The stimuli subtended a visual angle of 7°.
Retinotopic localizer
USTC subjects viewed two types of retinotopic mapping stimuli [Engel et al., 1997; Fang and He, 2005; Sereno et al., 1995]. The first were counter‐phase (8 Hz) checkerboard wedges of 7° located at the right horizontal, lower vertical, left horizontal and upper vertical meridians. These served to map boundaries between visual areas. The second were counter‐phase (8 Hz) checkerboard annuli (1°, 3°, 5°, and 7° in diameter) that served to map the retinotopic extent of each area. Two 510s retinotopic localizer runs with 18s blocks interleaved by 12s rests were performed: one that presented the wedges and one that presented the annuli. The stimuli were presented in different blocks and repeated four times. For UMN subjects, there were two wedge stimuli (7°) located at the horizontal and vertical meridians, and two annuli stimuli (3°, 7° in diameter). Two 204s retinotopic mapping runs with 12s blocks interleaved by 12s rests were performed: one that presented the wedges and one that presented the annuli.
Control experiment
Beside the runs in the main experiment of UMN subjects, two more 300s inducer localizer runs with 12s blocks interleaved by 12s rests were performed. Four balls with the same diameter and at the same locations as the inducers in the large‐gap condition were presented in different blocks and repeated four times (see Fig. 3). In each block, a stimulus alternated between two versions of the stimulus (reversal contrast) at 1 Hz. All stimuli in the control experiment subtended a visual angle of 10°.
Figure 3.

Illustration of the inducer localizer stimuli and the results of the control experiment. (a) Regions in V1 corresponding to the inducers or inducer gaps of one representative subject are respectively marked with circles and squares. Localizer stimuli are shown in the middle. The relationships between the inducers and the V1 regions activated by them are indicated by colors. The orange color represents the overlapping regions. (b) The differences between the activations to Kanizsa and control stimuli (IC response) in the large‐gap condition in the above V1 regions. The mean IC responses in the regions corresponding to the inducers or inducer gaps are respectively shown with the large filled circles or squares. The IC responses from the individual subjects are shown by the small triangles in different directions. The IC response occurred in the regions corresponding to the inducers gaps but not to the inducers themselves. Error bars indicate ± S.E.M. The data from the left and right hemispheres were averaged. [Color figure can be viewed in the online issue, which is available at wileyonlinelibrary.com.]
The visual angle of the stimuli was 2.5° for USTC subjects. This was because of a report that neural responses to IC may be reduced when the size of stimuli increases, with an optimal response at 2–4° [Heider et al., 2002]. After that, the larger visual angles were adopted in UMN subjects, especially in the control experiment, to obtain clearer mapping of V1 activations. Consistent with other fMRI studies [Maertens, 2008; Sasaki and Watanabe, 2004], we also observed neural responses to large‐size IC stimuli.
fMRI data acquisition
MRI data were collected using a Siemens 3‐T Magnetom TRIO scanner with an eight‐channel phase array surface coil. For USTC subjects, the stimuli were projected through a video projector onto a translucent screen, which was placed in front of the scanner bed. For UMN subjects, the stimuli were back‐projected through a video projector onto a translucent screen, which was placed inside the scanner bore. Subjects viewed the stimuli through a mirror situated above their eyes. In the main experiment, for USTC subjects, BOLD signals were acquired with an EPI (echo‐planar imaging) sequence (TE: 30 ms, TR: 2,000 ms, FOV: 24 × 24 cm2, matrix: 64 × 64, flip angle: 90°, slice thickness: 4.0 mm, slice gap: 0.4 mm, number of slices: 22, slice orientation: axial) to cover the whole brain. For UMN subjects, BOLD signals were acquired with more slices (TE: 28 ms, TR: 2,000 ms, FOV: 22 × 22 cm2, matrix: 64 × 64, flip angle: 90°, slice thickness: 3.0 mm, slice gap: 0 mm, number of slices: 35, slice orientation: axial) to cover the whole brain. In the control experiment, BOLD signals were acquired with finer resolution (TE: 30 ms, TR: 2,000 ms, FOV: 22 × 22 cm2, matrix: 128 × 128, flip angle: 90°, slice thickness: 3.0 mm, slice gap: 0 mm, number of slices: 20, slice orientation: perpendicular to the calcarine sulcus) to cover the visual cortex. A T1 weighted anatomical volume (3D MPRAGE, 1 × 1 × 1 mm3 resolution) was acquired for all subjects.
fMRI data analyses
The imaging data were analyzed using BrainVoyager (Brain Innovation). Functional data underwent preprocessing, including motion correction and temporal frequency filtering above 0.01 Hz per scan. Functional and anatomical data were coregistered and transformed into a common brain space [Talairach and Tournoux, 1988]. Anatomical data were further flattened. General linear model (GLM) analysis was performed on the functional data of each subject. For the task runs viewing Kanizsa and control stimuli, four conditions (Kanizsa and control stimuli with large or small gaps) were modeled. For the retinotopic localizer runs, four conditions (right horizontal, lower vertical, left horizontal and upper vertical) were modeled for the data from USTC subjects and two conditions (horizontal and vertical) were modeled for the data from UMN subjects. For the inducer localizer runs, four conditions (top left, top right, bottom right and bottom left) were modeled. In all GLM analyses, the motion correction parameters were modeled as non‐interest variances and removed. A parameter estimate for each condition was calculated for each voxel.
ROI Definitions
Definition of the LOC in the main experiment
The LOC was identified by comparing the activations to Kanizsa and control stimuli in both the large‐ and small‐gap conditions (The contrast was (small‐gap Kanizsa ‐ small‐gap control) + (large‐gap Kanizsa ‐ large‐gap control)). The group results of the LOC (P ≤ 0.0001, Supporting Information Fig. 1) were first obtained to serve as a reference for identified LOCs in each subject, which were consistent with previous studies [Kruggel et al., 2001; Murray et al., 2002]. Then the LOCs of the individual subjects were identified at the threshold of P ≤ 0.01 (see Supporting Information Table III for the LOC coordinates of each subject). The LOC was localized according to the individual subjects' data and the group results of the LOC only served as a reference when identifying the LOCs of the individual subjects. Because it is still in controversy that whether illusory and real objects active the same brain regions or active the same brain regions at the same activation level [Larsson et al., 1999; Mendola et al., 1999], we adopted illusory Kanizsa shapes but not real shapes or complicated objects to identify the LOC in the main experiment.
Definition of the retinotopic visual regions in the main experiment
The wedges served to map boundaries between visual areas (P ≤ 0.0001) and the annuli served to map the retinotopic extent of each area (P ≤ 0.0001) (Supporting Information Fig. 2) [Engel et al., 1997; Fang and He, 2005; Sereno et al., 1995; Wandell et al., 2007]. The obtained visual regions were then masked by the regions activated to the task stimuli, which were defined as the common regions activated to all the four types of stimuli (Kanizsa and control stimuli with large or small gaps. The contrast was small‐gap Kanizsa + small‐gap control + large‐gap Kanizsa + large‐gap control) (P ≤ 0.0001).
Figure 2.

Illustration of the results of the main experiment. The difference between the activations to Kanizsa (K) and control (C) stimuli (IC response) was not significant in V1 and V2 in the small‐gap condition. The IC response was stronger in the large‐gap than in the small‐gap condition in V1, but became weaker in the lateral occipital cortex (LOC). In addition, the IC response increased from low‐ to high‐tier visual areas (P < 0.001) in the small‐ rather than in the large‐gap condition. One asterisk indicates 0.05 ≥ P > 0.01; two asterisks indicate 0.01 ≥ P > 0.001; three asterisks indicate P ≤ 0.001. Error bars indicate ± S.E.M. The data from the left and right hemispheres were averaged.
Definition of the V1 regions corresponding to the inducers or the inducer gaps in the control experiment
The wedges and the annuli were used to map the V1 regions as described above, and the obtained V1 regions were further masked by the regions activated to each inducer (P ≤ 0.0001). V1 regions corresponding to the inducer gaps were defined as the areas in V1 between the V1 regions activated by the inducers (see Fig. 3).
RESULTS
The fMRI results of the main experiment are depicted in Figure 2, 1. The difference between the activations to ICs and control stimuli was defined as the IC response, which reflects the brain activity related to perceiving ICs. In V1 and V2, the IC response was observed in the large‐gap (t 9 = 5.385 2, P < 0.001 in V1; t 9 = 3.738, P = 0.005 in V2) but not in the small‐gap condition. In addition, the IC response was stronger in the large‐gap than in the small‐gap condition in V1 (t 9 = 3.068, P = 0.013). In V3 and V3a, the IC response was observed in both the large‐gap (t 9 = 5.436, P < 0.001 in V3, t 9 = 4.619, P = 0.001 in V3a) and the small‐gap (t 9 = 2.525, P = 0.032 in V3, t 9 = 4.075, P = 0.003 in V3a) conditions. In the LOC, the IC response was observed in both the large‐ (t 9 = 5.375, P < 0.001) and the small‐gap conditions (t 9 = 7.913, P < 0.001). However, the IC response was stronger in the small‐gap than in the large‐gap condition (t 9 = 5.941, P < 0.001), which was the reverse of that in V1. These results suggest that visual areas from low to high levels have different roles in IC perception. V1 and V2 showed more responses to the stimuli with more contour completion and thus are more responsible for contour completion, whereas the LOC was more activated by the stimuli with more contour representation and hence is more related to contour representation.
In addition, an incremental trend in the IC response across the visual pathway was observed in the small‐gap (F 1,9 = 8.197, P < 0.001. Gray bars in Fig. 2) rather than in the large‐gap (F 1,9 = 2.024, P = 0.112. Black bars in Fig. 2) condition (see Supporting Information Table II for the post‐hoc analyses). The IC response increased from low‐ to high‐tier visual areas when viewing the stimuli with more contour representation, but remained high when viewing the stimuli with more contour completion. These results suggest that neural activity changes in different ways for contour completion and contour representation across the visual pathway.
A potential issue in IC research with Kanizsa figures is that the Kanizsa and control stimuli do not match perfectly. For example, the inducers are rotated toward the inside in the Kanizsa figures and the outside in the control stimuli. It is possible that the results from comparing the activations to Kanizsa and control stimuli could be just due to the physical stimulus differences of the inducers. However, Lee and Nguyen [ 2001] show the absence of differential cortical responses to various rotation configurations of the inducers, as long as no IC is generated. It is recently suggested that comparing Kanizsa figures with such control stimuli mainly reflects IC perception, rather than configural property of the figure [for review, see Seghier and Vuilleumier, 2006]. As to the present study, it was unlikely that the results were due to the physical stimulus differences of the inducers. Despite this, we still conducted a control experiment with the extra runs to localize the inducers (see Fig. 3) to confirm the observation in the main experiment. The control experiment focused on V1 since the influence of the configural property of the figure would be strongest in V1. Clearer retinotopic mapping of each inducer could be obtained in V1 than in extrastriate areas. In addition, because the IC response occurred in the large‐gap condition in V1 in the main experiment, the control experiment focused on the large‐gap condition. By means of the inducer localizer we were able to examine whether the IC response occurs just in the V1 regions corresponding to the inducers (if the results in the main experiment were caused by the physical stimulus differences of the inducers). The V1 regions corresponding to the inducer gaps where the completion is supposed to happen were also examined. The results are illustrated in Figure 3. In the large‐gap condition, the IC response occurred not in the V1 regions corresponding to the inducers (t 2 = 1.7831, P = 0.2165), but in the V1 regions corresponding to the inducer gaps (t 2 = 7.1524, P = 0.019). The results are consistent with the results of a recent fMRI study [Maertens, 2008] showing that the IC response occurs at the gap locations, but not at the inducer locations in V1. Together with the finding of Lee and Nguyen [ 2001] that IC response is not affected by inducer rotation, these results unlikely support the notion that the results in the main experiment were just caused by the physical stimulus differences of the inducers.
DISCUSSION
Previous animal single‐unit studies and human imaging studies have shown neural responses to ICs in multiple visual areas from V1 to the LOC [Ffytche and Zeki, 1996; Hirsch et al., 1995; Kruggel et al., 2001; Larsson et al., 1999; Lee and Nguyen, 2001; Maertens, 2008; Mendola et al., 1999; Murray et al., 2002; Sasaki and Watanabe, 2004; Seghier et al., 2000], with the functions of the visual areas in IC perception remaining not clarified. V1 and V2 neurons have small receptive fields and they are thought to respond to local visual features. In contrast, the LOC is thought to process high‐level global visual information because LOC neurons have large receptive fields and pool information from large portions of the visual field [Grill‐Spector and Malach, 2004]. According to this view, Stanley and Rubin [ 2003] showed LOC activity to global surface processing in IC perception. The present study, by dissociating contour completion and contour representation in IC perception, shows that V1 and V2 are more responsible for contour completion that processes local discrete visual information, whereas the LOC is more involved in contour representation that processes global integrated visual information. These results are consistent with the particular neuronal properties of different visual areas, and provide evidence for their roles in IC perception.
Besides examining the neural responses in a single visual area, fMRI makes it possible to observe the neural activity change across the visual pathway. The current results showed that the activation increased (incremental change) from low‐ to high‐tier visual areas when viewing the stimuli with more contour representation, but remained high (plateau change) when viewing the stimuli with more contour completion. These neural activity changes in IC perception have been observed in previous fMRI studies [Mendola et al., 1999; Sasaki and Watanabe, 2004]. We show that the incremental activation change is largely attributed to contour representation and the plateau activation change is largely due to contour completion. These results may provide insight into the way in which the contour completion and contour representation collaborate across the visual pathway to archive contour perception.
The local feed‐forward hypothesis [Ffytche and Zeki, 1996] suggests a bottom‐up mechanism that emphasizes the role of the low‐level visual areas such as V1 and V2. The global feed‐back hypothesis [Murray et al., 2002, 2004; Stanley and Rubin, 2003] suggests a top‐down mechanism that emphasizes the role of the high‐level visual areas such as the LOC. Part of the current data, that V1 and V2 are more involved in contour completion and the LOC is more involved in contour representation, are congruent with these proposals. However, the different neural activity changes across the visual pathway for contour completion and contour representation might not be fully interpreted with the feed‐forward or the feed‐back hypothesis. Our data may more fit the idea from the feature binding neurophysiological hypothesis with an ongoing local mechanism integrating the discrete local visual information and a global mechanism collecting the integrated global visual information [Singer, 1999; Treisman, 1999]. We propose that IC perception might be supported by a parallel neural mechanism. In the parallel model, contour completion is an ongoing “computing” neural process in which discrete visual information is being completed. Contour representation is a “collecting” neural process in which the completed information from the contour completion process is being gathered. The contour representation process becomes stronger across the visual pathway as the completed information is accumulated. A contour is recognized when enough completed information is obtained in the LOC. The parallel model is consistent with the feature binding neurophysiological hypothesis, providing the possible evidence for the proposed collecting mechanism, and indicating the collaboration between the local computing and global collecting mechanisms. This parallel model does not conflict with the feed‐forward or feed‐back model and could be complementary to them. Consistent with the feed‐forward model, the information flow in the parallel model is from the low‐ to high‐tier visual areas. The contour completion process may also be modulated by the signals from high‐level visual areas.
As in previous fMRI studies [Hirsch et al., 1995; Mendola et al., 1999; Stanley and Rubin, 2003], a passive viewing task was adopted to reduce the potential that more attention could be paid to ICs than to control stimuli [Herrmann et al., 1999; TallonBaudry et al., 1996; Wu and Zhang, 2009]. Subjects were not required to pay more attention to either IC stimuli or control stimuli. It is possible that IC stimuli are drawing attention, but then attention would only be the consequence of IC perception and might act to amplify an already evoked IC response [Maertens, 2008]. In addition, an fMRI study [Sasaki and Watanabe, 2004] with careful controls of attention suggests that neuronal responses to IC in multiple visual areas are not influenced by attention. This attentional issue remains open to be elucidated.
Recent studies using more elaborate retinotopic mapping methods showed that the LOC contains two lateral occipital areas: a posterior region (LO1) and an anterior region (LO2) [Larsson and Heeger, 2006; Swisher et al., 2007]. While both LO1 and LO2 respond to objects, LO2 is considered to be more invariant than LO1 to the low‐level features of objects, such as size, orientation and position [Grill‐Spector et al., 1999; Larsson and Heeger, 2006; Sawamura et al., 2005]. The LOC investigated in the current study is the region that responds to illusory contours, which has been shown to be largely invariant to stimulus size [Mendola et al., 1999; Murray et al., 2002]. Therefore, the functional property of the LOC region responding to illusory contours may be more consistent with that of LO2.
CONCLUSION
How discrete local information is integrated into the coherent object percept is a fundamental question of the visual system. Illusory contours reveal the dissociation between the retinal input and the percept. The present results show dissociable neural correlates of contour completion and contour representation and the possible collaboration between the two processes in IC perception, indicating the neural mechanisms connecting the discrete input and the coherent percept.
Supporting information
Additional Supporting Information may be found in the online version of this article.
Supporting Information
Acknowledgements
The authors thank Anders Westanmo, Ben Brown, and David Engblom for their comments on the original manuscript and language corrections.
Footnotes
We focused on the difference between the activations to Kanizsa and control stimuli which reflects the brain activity related to perceiving Kanizsa figures. See Supporting Information Table I for the activation in each condition. Because the stimuli were presented below the fixation cross, the ventral retinotopic areas (V1, V2, V3v, and V4) were negatively activated (see Supporting Information Table I) and thus were not included in the analyses.
All tests were two‐tailed.
Contributor Information
Xiang Wu, Email: rwfwuwx@gmail.com.
Daren Zhang, Email: drzhang@ustc.edu.cn.
REFERENCES
- Csibra G, Davis G, Spratling MW, Johnson MH ( 2000): Gamma oscillations and object processing in the infant brain. Science 290: 1582–1585. [DOI] [PubMed] [Google Scholar]
- Engel SA, Glover GH, Wandell BA ( 1997): Retinotopic organization in human visual cortex and the spatial precision of functional MRI. Cereb Cortex 7: 181–192. [DOI] [PubMed] [Google Scholar]
- Fang F, He S ( 2005): Cortical responses to invisible objects in the human dorsal and ventral pathways. Nat Neurosci 8: 1380–1385. [DOI] [PubMed] [Google Scholar]
- Ffytche DH, Zeki S ( 1996): Brain activity related to the perception of illusory contours. Neuroimage 3: 104–108. [DOI] [PubMed] [Google Scholar]
- Grill‐Spector K, Malach R ( 2004): The human visual cortex. Annu Rev Neurosci 27: 649–677. [DOI] [PubMed] [Google Scholar]
- Grill‐Spector K, Kushnir T, Edelman S, Avidan G, Itzchak Y, Malach R ( 1999): Differential processing of objects under various viewing conditions in the human lateral occipital complex. Neuron 24: 187–203. [DOI] [PubMed] [Google Scholar]
- Halko MA, Mingolla E, Somers DC ( 2008): Multiple mechanisms of illusory contour perception. J Vis 8: 1–17. [DOI] [PubMed] [Google Scholar]
- Heider B, Spillmann L, Peterhans E ( 2002): Stereoscopic illusory contours—Cortical neuron responses and human perception. J Cogn Neurosci 14: 1018–1029. [DOI] [PubMed] [Google Scholar]
- Herrmann CS, Mecklinger A, Pfeifer E ( 1999): Gamma responses and ERPs in a visual classification task. Clin Neurophysiol 110: 636–642. [DOI] [PubMed] [Google Scholar]
- Hirsch J, Delapaz RL, Relkin NR, Victor J, Kim K, Li T, Borden P, Rubin N, Shapley R ( 1995): Illusory contours activate specific regions in human visual‐cortex—Evidence from functional magnetic‐resonance‐imaging. Proc Natl Acad Sci USA 92: 6469–6473. [DOI] [PMC free article] [PubMed] [Google Scholar]
- Kanizsa G ( 1955): Margini quasi‐percettivi in campi con stimolazione omogenea. Riv Psicol 49: 7–30. [Google Scholar]
- Kruggel F, Herrmann CS, Wiggins CJ, von Cramon DY ( 2001): Hemodynamic and electroencephalographic responses to illusory figures: Recording of the evoked potentials during functional MRI. Neuroimage 14: 1327–1336. [DOI] [PubMed] [Google Scholar]
- Larsson J, Heeger DJ ( 2006): Two retinotopic visual areas in human lateral occipital cortex. J Neurosci 26: 13128–13142. [DOI] [PMC free article] [PubMed] [Google Scholar]
- Larsson J, Katrin A, Balazs G, Aleksandar M, Karl Z, Per ER ( 1999): Neuronal correlates of real and illusory contour perception: Functional anatomy with PET. Eur J Neurosci 11: 4024–4036. [DOI] [PubMed] [Google Scholar]
- Lee TS, Nguyen M ( 2001): Dynamics of subjective contour formation in the early visual cortex. Proc Natl Acad Sci USA 98: 1907–1911. [DOI] [PMC free article] [PubMed] [Google Scholar]
- Maertens M ( 2008): Retinotopic activation in response to subjective contours in primary visual cortex. Front Hum Neurosci 2: 1–7. [DOI] [PMC free article] [PubMed] [Google Scholar]
- Mendola JD, Dale AM, Fischl B, Liu AK, Tootell RBH ( 1999): The representation of illusory and real contours in human cortical visual areas revealed by functional magnetic resonance imaging. J Neurosci 19: 8560–8572. [DOI] [PMC free article] [PubMed] [Google Scholar]
- Murray MM, Wylie GR, Higgins BA, Javitt DC, Schroeder CE, Foxe JJ ( 2002): The spatiotemporal dynamics of illusory contour processing: Combined high‐density electrical mapping, source analysis, and functional magnetic resonance imaging. J Neurosci 22: 5055–5073. [DOI] [PMC free article] [PubMed] [Google Scholar]
- Murray SO, Schrater P, Kersten D ( 2004): Perceptual grouping and the interactions between visual cortical areas. Neural Netw 17: 695–705. [DOI] [PubMed] [Google Scholar]
- Sasaki Y, Watanabe T ( 2004): The primary visual cortex fills in color. Proc Natl Acad Sci USA 101: 18251–18256. [DOI] [PMC free article] [PubMed] [Google Scholar]
- Sawamura H, Georgieva S, Vogels R, Vanduffel W, Orban GA ( 2005): Using functional magnetic resonance imaging to assess adaptation and size invariance of shape processing by humans and monkeys. J Neurosci 25: 4294–4306. [DOI] [PMC free article] [PubMed] [Google Scholar]
- Seghier ML, Vuilleumier P ( 2006): Functional neuroimaging findings on the human perception of illusory contours. Neurosci Biobehav Rev 30: 595–612. [DOI] [PubMed] [Google Scholar]
- Seghier M, Dojat M, Delon‐Martin C, Rubin C, Warnking J, Segebarth C, Bullier J ( 2000): Moving illusory contours activate primary visual cortex: An fMRI study. Cereb Cortex 10: 663–670. [DOI] [PMC free article] [PubMed] [Google Scholar]
- Sereno MI, Dale AM, Reppas JB, Kwong KK, Belliveau JW, Brady TJ, Rosen BR, Tootell RB ( 1995): Borders of multiple visual areas in humans revealed by functional magnetic resonance imaging. Science 268: 889–893. [DOI] [PubMed] [Google Scholar]
- Shipley TF, Kellman PJ ( 1992): Strength of visual interpolation depends on the ratio of physically specified to total edge length. Percept Psychophys 52: 97–106. [DOI] [PubMed] [Google Scholar]
- Singer W ( 1999): Neuronal synchrony: A versatile code for the definition of relations? Neuron 24: 49–65. [DOI] [PubMed] [Google Scholar]
- Stanley DA, Rubin N ( 2003): fMRI activation in response to illusory contours and salient regions in the human lateral occipital complex. Neuron 37: 323–331. [DOI] [PubMed] [Google Scholar]
- Swisher JD, Halko MA, Merabet LB, McMains SA, Somers DC ( 2007): Visual topography of human intraparietal sulcus. J Neurosci 27: 5326–5337. [DOI] [PMC free article] [PubMed] [Google Scholar]
- Talairach J, Tournoux P. 1988. Co‐Planar Stereotaxic Atlas of the Human Brain. New York: Thieme. [Google Scholar]
- TallonBaudry C, Bertrand O, Delpuech C, Pernier J ( 1996): Stimulus specificity of phase‐locked and non‐phase‐locked 40 Hz visual responses in human. J Neurosci 16: 4240–4249. [DOI] [PMC free article] [PubMed] [Google Scholar]
- Treisman A ( 1999): Solutions to the binding problem: Progress through controversy and convergence. Neuron 24: 105–110. [DOI] [PubMed] [Google Scholar]
- Wandell BA, Dumoulin SO, Brewer AA ( 2007): Visual field maps in human cortex. Neuron 56: 366–383. [DOI] [PubMed] [Google Scholar]
- Wu X, Zhang D ( 2009): Early induced beta/gamma activity during illusory contour perception. Neurosci Lett 462: 244–247. [DOI] [PubMed] [Google Scholar]
Associated Data
This section collects any data citations, data availability statements, or supplementary materials included in this article.
Supplementary Materials
Additional Supporting Information may be found in the online version of this article.
Supporting Information