

Abstract
Recently, blink‐related delta oscillations (delta BROs) have been observed in healthy subjects during spontaneous blinking at rest. Delta BROs have been linked with continuous gathering of information from the surrounding environment, which is classically attributed to the precuneus. Furthermore, fMRI studies have shown that precuneal activity is reduced or missing when consciousness is low or absent. We therefore hypothesized that the source of delta BROs in healthy subjects could be located in the precuneus and that delta BROs could be absent or reduced in patients with disorders of consciousness (DOC). To test these hypotheses, electroencephalographic (EEG) activity at rest was recorded in 12 healthy controls and nine patients with DOC (four vegetative states, and five minimally conscious states). Three‐second‐lasting EEG epochs centred on each blink instance were analyzed in both time‐ (BROs) and frequency domains (event‐related spectral perturbation or ERSP and intertrial coherence or ITC). Cortical sources of the maximum blink‐related delta power, corresponding to the positive peak of the delta BROs, were estimated by standardized Low Resolution Electromagnetic Tomography. In control subjects, as expected, the source of delta BROs was located in the precuneus, whereas in DOC patients, delta BROs were not recognizable and no precuneal localization was possible. Furthermore, we observed a direct relationship between spectral indexes and levels of cognitive functioning in all subjects participating in the study. This reinforces the hypothesis that delta BROs reflect neural processes linked with awareness of the self and of the environment. Hum Brain Mapp 34:2178–2189, 2013. © 2012 Wiley Periodicals, Inc.
Keywords: event‐related potentials ERPs, event‐related oscillations EROs, delta rhythm, precuneus, blinking, consciousness
INTRODUCTION
In the last few years, a growing interest has been shown in the study of brain functions in the resting state, when a subject, not involved in cognitive tasks requiring outward attention, is left free to follow his/her thoughts (task unrelated thought). This condition has been associated to a set of brain regions with high metabolism at rest, forming the the default mode network (DMN) or task‐negative network (TNN) [Fox et al., 2005; Gusnard and Raichle, 2001; Raichle et al., 2001]. It has been shown that when the same subject is involved in a cognitive and/or perceptive task requiring a behavioral response, metabolic parameters significantly decrease across the DMN, whereas they increase in other cerebral areas, anticorrelated and complementary to the DMN, forming the task‐positive network (TPN) [Fox et al., 2005]. The DMN encompasses the posterior‐cingulate cortex (PCC)/precuneus, the temporo‐parietal junction, the medial prefrontal cortex, the parahippocampal gyri, the superior frontal sulci, and the thalamus [Raichle et al., 2001]. In particular, the PCC/precuneus, the anterior‐cingulate/mesiofrontal cortex, and the temporo‐parietal junctions, being densely interconnected, compose a sort of “core hub,” within which the PCC/precuneus constitutes a convergence node with a pivotal functional role [Fransson and Marrelec, 2008; Hagmann et al., 2008; Vogt and Laureys, 2005].
However, the inclusion of the precuneus in the DMN still remains an open question [Buckner et al., 2008; Margulies et al., 2009], because its high blood oxygen level‐dependent signal during rest could also be interpreted as a consequence of the spread of activation from neighboring regions that are functionally more important, e.g., PCC. From the functional point of view, the precuneus is involved in self‐processing events with a visuospatial (attentional) connotation [Cavanna and Trimble, 2006], such as the continuous gathering of information from the surrounding environment and the representation of the self in relationship with the outside world [Gusnard and Raichle, 2001; Raichle et al., 2001]. This functional activity appears to be reduced when the attention is shifted to behavioral responses associated to tasks [Gusnard and Raichle, 2001; Raichle et al., 2001]. Finally, the precuneus is considered relevant for neural conscious processes, because its activity is reduced in low or absent consciousness states, such as in physiological (sleep), drug‐induced (anaesthesia), or neuropsychiatric conditions [epilepsy, Alzheimer's disease, schizophrenia, coma, vegetative state (VS) and minimally conscious state (MCS); Boly et al., 2008; Buckner et al., 2008; Cavanna, 2007].
Recently, we have observed a bioelectrical oscillatory activity in the delta frequency range, both time‐ and phase‐locked to the spontaneous blinking at rest (blink‐related delta oscillations or delta BROs) [Bonfiglio et al., 2009, 2011]. This phenomenon is suggestive of a mechanism comparing the current environment image, appearing at the eyelid reopening, with its mnestic representation stored in the visuospatial sketch pad (short‐term memory) at the moment of eyelid closure [Bonfiglio et al., 2011]. This mechanism can be associated to an automated surveillance system of the visuospatial environment, activated by default when the subject is engaged in self‐oriented thoughts (sentinel theory) [Bonfiglio et al., 2011; Buckner et al., 2008; Hahn et al., 2007]. Interestingly, a relationship between changes in the blinking rate and evolution/outcome of both vegetative and MCSs has recently been reported [Bonfiglio et al., 2005]. This would suggest that information about the conscious state of subjects can be inferred from the analysis of the spontaneous blinking behavior.
Under the above assumptions, in this work we have investigated the following hypotheses: a) if delta BROs are involved in a mechanism monitoring visuospatial environment, and because this function is classically attributed to the precuneus, the source of such activity should be located in the precuneus itself and (b) if delta BROs are an expression of neuronal networks involved in certain conscious functions, they should be missing or reduced in subjects with disorders of consciousness (DOC). The purpose of this study was therefore to (a) locate the source of delta BROs in a group of normal subjects, to confirm, also according to its anatomical location, the functional significance previously ascribed to them; (b) verify their absence or reduction in a group of subjects with DOC, demonstrating the close relationship between delta oscillations and activity of neural networks involved in consciousness functions; and, consequently, (c) highlight their relationship with levels of severity of consciousness disturbances, not only to validate point (b) but also to propose the delta BROs as a possible paraclinical biomarker of consciousness.
MATERIALS AND METHODS
Participants
Twelve healthy volunteers, aged from 21 to 63 years (mean 32.6 ± 13.75, five females), and nine patients with DOC, aged from 21 to 66 years (mean 42.9 ± 18.6, five females), participated in the study. The groups did not differ either by age (t‐test, P = 0.160) or by sex (Fisher Exact Test, P = 0.67).
Patients underwent a clinical assessment both to obtain a differential diagnosis between VS and MCS and to evaluate the severity levels of their consciousness disturbances. This included two scales: the JFK Coma Recovery Scale‐Revised (CRS‐R) [Giacino et al., 2004] and the Levels of Cognitive Functioning Scale (LCFS) [Hagan et al., 1979]. So, the group of patients with DOC was stratified into two subgroups, VS and MCS. The VS group was composed of three subjects with CRS‐R score = 6/23, plus one subject with a CRS‐R score of 9/23 [assigned, however, only for the presence of visual fixation and, hence, according to Bruno et al., 2010, classified as VS]. The MCS group consisted of two subjects with CRS‐R score = 10/23, plus three subjects with LCFS scores of 5 and 6. As it is known, a CRS‐R total score is not provided for subjects with a LCF score >4 [Giacino et al., 2004]. However, due to their CRS‐R partial scores of <6 in the Motor subscale and <2 in the Communication subscale, which are not enough to achieve the diagnostic status of “emergence from MCS,” they had to be classified as MCS+ [Giacino et al., 2004]. A synoptic view of patients' demographic and clinical data is reported in Table 1. All patients underwent morphologic MRI examination: detected lesions ranged from single or multifocal lesions (with lobar, sublobar, or lacunar extension) to diffuse axonal damage and atrophy, but no focal lesions were detected in correspondence of either the precuneal or the cuneal cortical regions (details about both neuropathology and location of lesions are reported in Supporting Information Table 1).
Table 1.
Synoptic view of patients' demographic and clinical data
| Case no. | Sex | Age (years) | Cause | Duration (months) | Diagnosis | CRS‐R | LCFS |
|---|---|---|---|---|---|---|---|
| 1 | M | 64 | Hypoxic‐hypoxia | 10 | VS | 5/23 | 2 |
| 2 | F | 66 | Ischemic‐hypoxia | 96 | VS | 5/23 | 2 |
| 3 | M | 45 | Hypoxic‐hypoxia | 51 | VS | 6/23 | 2 |
| 4 | F | 58 | Ischemic‐hypoxia | 85 | VS | 9/23 | 3 |
| 5 | F | 21 | Trauma | 21 | MCS | 11/23 | 3 |
| 6 | M | 55 | Trauma | 10 | MCS | 10/23 | 3 |
| 7 | M | 31 | Hypoxic‐hypoxia | 176 | MCS+ | Not attributable | 5 |
| 8 | F | 22 | Trauma | 31 | MCS+ | Not attributable | 6 |
| 9 | F | 24 | Trauma | 55 | MCS+ | Not attributable | 6 |
Data of case numbers 5 and 8 are relative to the same subject considered at different levels of clinical severity.
Recordings
EEG signals were recorded by using a BQ132S EEG amplifier (BrainQuick System, Micromed, Treviso, Italy) and an electrode cap (Electro‐Cap International, Eaton, OH) with 19 predetermined recording locations (Fp1, Fp2, F8, F4, Fz, F3, F7, T4, C4, Cz, C3, T3, T6, P4, Pz, P3, T5, O1, and O2) following the 10–20 International System. The ground electrode was placed between Fz and Fp1–Fp2. Electrode impedance was always kept below 5 kΩ. EEG signals were digitized at a sampling rate of 256 Hz and band‐pass filtered between 0.5 and 45 Hz. Surface potentials were referenced off‐line to an estimated infinity reference by using the REST software [Qin et al., 2010], thereby rendering EEG data reference‐free [Kayser and Tenke, 2010].
Blinks were also monitored by means of electrooculographic (EOG) recording. The electrodes were arranged diagonally to the horizontal line passing by the outer corners of the eyes. Two additional signals were usually recorded: ECG and biceps brachii muscle EMG. Each recording session consisted of approximately 30 min of continuously recorded data. All the data were exported in EDF format for subsequent analyses.
Experimental Set
During each recording period, subjects were seated in a chair (or in a wheelchair for some patients) in a noise‐insulated room with comfortable temperature. Subjects were not aware that the purpose of the work focused on spontaneous blinking. Hence, no special instruction was given about regulation of blinking activity. Subjects were only instructed to look ahead, letting their eyes wander without paying attention to anything in particular and they were free to think of whatever they wished (“waiting room effect”) [Bonfiglio et al., 2009, 2011]. Patients were given the same instructions as healthy subjects, whether or not they were able to understand them. The control of the waking state of subjects was facilitated by the fact that recordings were made in the eyes open condition. The simple clinical inspection and/or continuous monitoring of blinks on the ongoing EOG have therefore been sufficient to ensure that there was not any drop in vigilance. All experiments followed the tenets of the declaration of Helsinki. Written informed consent was obtained after the aims and the experimental techniques were fully explained. Experiments had the approval of the local ethical committee.
Data Analysis
Data analyses were performed employing the EEGLAB toolbox [Delorme and Makeig, 2004], within the Matlab© framework (The Mathworks, Natick, MA).
Preprocessing
Blink events were automatically detected via a correlation based technique, in which only one sample blink instance had to be manually selected as a template. Whenever the value of the convolution between the template and the signal exceeded a certain threshold a blink instance was detected. The minimum delay between two subsequent instances had to be greater than 3 s, to include only artifact‐free data segments in the following analyses. All detections were then visually inspected for acceptance or removal. Independent component analysis (ICA) was employed to detect and remove blinking artifacts from the data, using the runica algorithm [Makeig et al., 1996], with principal component analysis preprocessing. For each recording, the components which corresponded to the blink artifact, both in terms of weight map and waveforms, were selected and removed from the data. To avoid that possible between‐groups differences of blink‐artifact ICA components could affect the reliability of both the blink‐artifact removal process and, consequently, blink‐related EEG signals, we previously checked both normalized amplitude and morphology of blink‐artifact ICA waveforms for each group by superimposing them and visually inspecting their substantial correspondence. EEG epochs were then extracted in the [−1.5 s, +1.5 s] interval around the maximum amplitude value (T0) of each blink instance. Groups did not statistically differ about the total number of epochs (i.e., blinks) analyzed [One‐Way analysis of variance (ANOVA): F (2,18) = 1.19, P > 0.05].
Waveform analysis
EEG epochs were analyzed in the time domain by extracting the corresponding time‐locked average potential (event‐related potential, ERP) [Bonfiglio et al., 2009]. Spectral analysis was then performed using wavelet analysis [Torrence and Compo, 1998]. Delta BROs were obtained from ERP traces by performing the inverse wavelet transform on the wavelet coefficients within the delta frequency range (i.e., by filtering signals in the delta frequency range), as in Bonfiglio et al. 2011.
Source modeling
To determine the sources of electrical activity in correspondence with EEG responses to blink events, the standardized Low Resolution Electromagnetic Tomography (sLORETA) method [Pascual‐Marqui et al., 1994, 2002] was employed. sLORETA has been widely used to localize sources of currents with set‐ups consisting of as few as 19 electrodes [Pascual‐Marqui et al., 2002], reaching sublobar accuracy [Clemens et al., 2010].
Source localization was performed on a three‐shell spherical model (Montreal Neurological Institute brain atlas) registered to the Talairach brain atlas [Talairach and Tournoux, 1988]. The model consists of 6,239 cortical gray matter voxels at 5 mm resolution. Electrode positions were registered to the spherical model following Towle et al. 1993. Results were displayed employing a Colin27 T2‐weighted MRI brain model [Holmes et al., 1998]. A two‐tailed t‐test relying on 5,000 randomized samples was employed to verify whether the distribution of current values significantly differed from the null hypothesis (no distinct source of activation). sLORETA analysis was performed in correspondence of the maximum blink‐related delta power.
Spectral analysis
EEG epochs were also analyzed in the frequency domain by means of event‐related spectral perturbation (ERSP) and intertrial coherence (ITC) [Delorme and Makeig, 2004]. The former makes it possible to compute event‐related changes in spectral power over time, whereas the latter measures the phase‐locking factor (i.e., phase synchrony) in response to the same event, for different latencies. Both measures were computed separately for the three groups of subjects, and then compared employing a bootstrap technique, setting the threshold P for statistical significance at 0.05. The time–frequency band in which the corresponding area of significance was substantially noise‐free was identified as the region of interest (ROI). Subsequent statistical analyses focused on the between‐groups comparison of spectral parameters in both the time‐window from +250 to +350 ms and the frequency range from 0.5 to 3.0 Hz within the ROI (One‐Way ANOVA, with a significance threshold P set at 0.05, and Tukey's post hoc test). This was to narrow the statistical analysis to the time–frequency window suited to represent the most meaningful part, on a functional plane, of the whole phenomenon, i.e., the positive wave of the blink‐related delta ERP, where, in healthy subjects, the blink‐related EEG signal reaches its maximum values, in terms of both power and coherence, at +300 ms.
Baseline power spectra
Baseline power spectra were computed on filtered signals (0.5–45 Hz range) over 0.25 Hz bins, using the Welch method [Welch, 1967], in the range between −1,500 ms and −500 ms from T0. Power in the delta band was then computed by summing spectral power in all bins between 0.5 and 3.0 Hz, and then normalizing this value by the total power (0.5–45 Hz), for each subject. Comparison between the three groups was performed by means of One‐Way ANOVA, with a significance threshold P set at 0.05, and Tukey's post hoc test.
RESULTS
The Delta BROs Waveform is Detectable in Healthy Subjects, But Not in DOC Patients
Grand average delta BROs for healthy subjects (controls) and patients with DOC (VS and MCS) are plotted in Figure 1. Figure 1A shows the topographical representation of controls. Delta BROs characteristic morphology at group level at mid parietal site (Pz electrode) is shown in Figure 1B. A biphasic positive–negative oscillation can be observed for controls only (solid line), with a positive peak a +300 ms and a negative peak at +600 ms following blink peak time (T0). In patients (dashed lines) no clear components are recognizable, but only random delta oscillations are present, indistinguishable from background noise.
Figure 1.
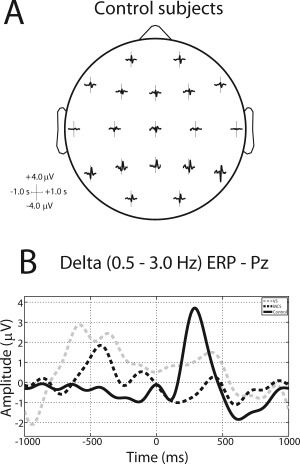
(A) Average blink‐related ERPs in all channel locations for control subjects, after ICA‐artifact rejection. Time ranges from −1500 ms to +1500 ms, frequency from 0.5 Hz to 45 Hz. (B) Average blink‐related ERP in channel Pz in the delta band (0.5–3.0 Hz) for VS (dashed gray line), MCS (dashed black line), and control (solid black line) subjects.
Precuneal Localization of the Delta BROs Source in Healthy Subjects
The maximum blink‐related delta power corresponded for all healthy subjects to the positive peak of the delta BROs waveform, i.e., +300 ms after blink peak (T0). At group level (Fig. 2A), the source localization is shown with respect to both the three planes of space and the 3D rendering of the two hemispheres. As it can be seen, the location of the source is fully included within the boundaries of Brodmann's area (BA) 7 m (precuneus). Sagittal projections of current density source localization at +300 ms for single healthy subjects are shown in Supporting Information Figure 1. Sagittal projections have been made in correspondence of the maximum in current density in the X direction. The maximum value is highlighted in the Y–Z plane by two black arrows on the Y and Z axes. In a single subject, although the typical delta BRO waveform was obtained, it was not possible to identify a clear cortical local maximum. Among the remaining 11 subjects, a current source in correspondence of BA 7 m (precuneus) was obtained in eight subjects; for the remaining three subjects the source was localized in correspondence of BA 23 (PCC) (Supporting Information Fig. 1).
Figure 2.
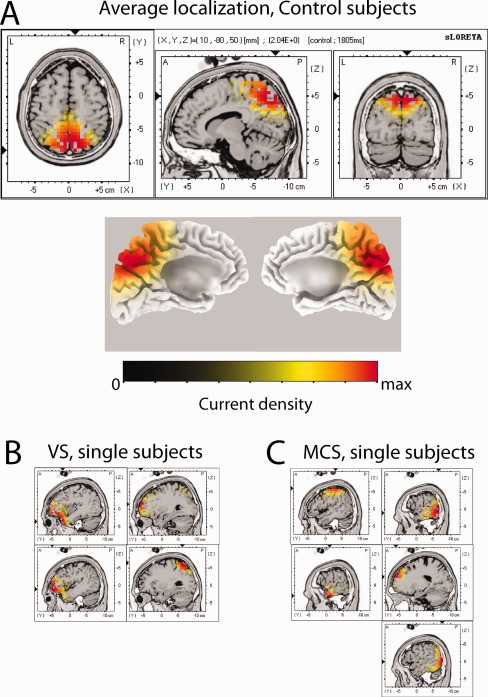
(A) Grand average current densities for the delta‐band blink‐related ERP computed in correspondence to the peak in delta power (t = +300 ms) for control subjects, with three‐dimensional rendering for the left and right hemispheres. (B and C) Sagittal view of single‐subject current densities for the delta‐band blink‐related ERP computed in correspondence to the peak in delta power (t = +300 ms) for, respectively, VS (panel B), and MCS (panel C) subjects. Sagittal planes are computed in correspondence with the maximum current density.
All current density values have been normalized in the 0‐max current range.
To verify that the current sources detected in the control group are linked to BROs, the same source localization was performed also in the patient groups. Sources at +300 ms in individual patients are shown in Figure 2B,C: for both VS and MCS patients, sources are located in scattered, not homogeneous, sites, which are not comparable to the source localization observed in healthy subjects.
Blink‐Related EEG Spectral Changes Across Consciousness Levels
In “The delta BROs waveform is detectable in healthy subjects, but not in DOC patients” section, the differences in delta BROs between controls and patients with DOC were reported. Subsequent analyses focused on spectral components of blink‐related EEG traces, and in particular on ERSP and ITC at electrode Pz (spectral indexes).
Comparison between healthy subjects and DOC patients
In Figure 3, both ERSP and ITC maps of healthy subjects and DOC patients (VS and MCS) are represented and statistically significant differences between the three groups (Fig. 3A,C, bootstrap analysis; Fig. 3B,D, left panels, ANOVA and Tukey's test) are shown. In healthy subjects, the delta BROs positive component at +300 ms is characterized by clearly visible peaks in the frequency domain in both ERSP and ITC plots. This means that, at +300 ms after T0, there is a peak in delta power and a synchronization of activity in that frequency range. The most striking features for DOC patients are: (a) for VS, the almost total absence of the power and synchrony enhancement in the low frequencies (<5 Hz) (Fig. 3A,C), approximately between +200 ms and +500 ms; (b) for MCS, the partial recovery of the power and synchronization in the low‐theta and delta bands (i.e., <5 Hz) about in the same time‐window. Both ERSP and ITC maps show significant differences (P < 0.05, bootstrap analysis) between healthy subjects and DOC patients for low (<5.0 Hz) frequency bands, about between +200 ms and +500 ms after blink peak (Fig. 3A) for ERSP and about between +200 ms and +700 ms after blink peak (Fig. 3C) for ITC. Several other small spots of significance in other frequencies/times can be observed, but their occurrence varied when the bootstrap procedure was repeated, and we therefore did not consider them in the following analyses.
Figure 3.
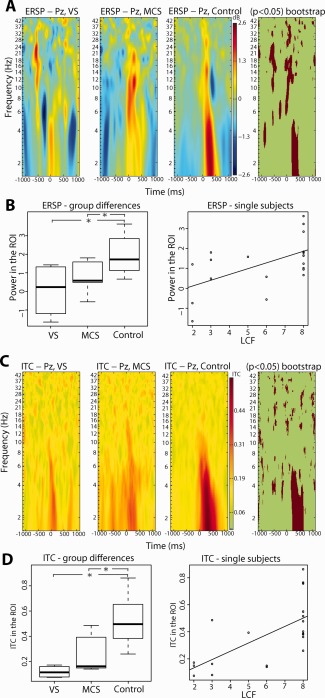
(A) ERSPs for VS, MCS and control subjects, in the −1000 to +1000 ms and 1–45 Hz range, with significant differences between the two groups (P < 0.05) highlighted via a bootstrap technique. (B) Left: box plots showing average ERSP in the time‐window from +250 and +350 ms within the ROI (delta range) for VS, MCS, and control subjects. Right: average ERSP in the time‐window from +250 and +350 ms within the ROI (delta range) as a function of LCFS score. Regression (linear model fitting) showed a significant value P < 0.01, with r 2 = 0.32. (C) ITCs for healthy controls and subjects with DOC, in the −1000 to +1000 ms and 1–45 Hz range, with significant differences between the two groups (P < 0.05) highlighted via a bootstrap technique. (D) Left: box plots showing average ITC in the time‐window from +250 and +350 ms within the ROI (delta range) for VS, MCS, and control subjects. Right: average ITC in the time‐window from +250 and +350 ms within the ROI (delta range) as a function of LCFS score. Regression (linear model fitting) showed a significant value P < 0.01, with r 2 = 0.44. Asterisks in panels B and D mark significant differences between groups (P < 0.05, One‐Way ANOVA, and post hoc Tukey's test).
As is shown in Figure 3B,D (left panels), between‐groups comparisons turned out to be statistically significant both in terms of ERSP (One‐Way ANOVA: F (2,18) = 5.431; P < 0.05) and ITC (One‐Way ANOVA: F (2,18) = 10.58; P < 0.01), with post hoc testing able to distinguish VS and MCS from control group (P < 0.05), but not MCS from VS group. This notwithstanding that the intermediate behavior of MCS with respect to both VS and healthy subjects is clearly recognizable by inspecting Figure 3B,D.
Blink‐related spectral indexes directly correlate with LCFS scores
Furthermore, a highly significant direct relationship between spectral indexes and levels of cognitive functioning was found. For each subject, both the average delta power and the average phase coherence at electrode Pz were computed in the time–frequency bands where a significant difference between healthy subjects and patients was assessed (see Fig. 3A,C). A linear regression between LCFS scores and the two spectral indexes showed a significant direct relation (P < 0.01, linear model function) for both delta power (r 2 = 0.32) and coherence (r 2 = 0.44) (Fig. 3B,D, right panels).
Delta Oscillations Dominate the Background EEG of DOC Patients
The power of the background delta rhythm (as measured in a reference epoch ranging between −1,500 and −500 ms from T0) has an antithetical—with respect to blink‐related delta activity—behavior across the groups: in DOC patients (both VS and MCS) it is significantly higher (One‐Way ANOVA: F (2,18)=12.7, P < 0.01; Tukey's test: P < 0.01) and has a more widespread distribution on the scalp with respect to healthy subjects (see Supporting Information Fig. 2). Such antithetical behavior is reversed, as already mentioned, during delta BROs.
DISCUSSION
General Findings
The results of our study need to be evaluated considering three main factors (delta BROs, source localization, and levels of consciousness), that are variously intermingled with each other. Here, we found that: (a) in control subjects' resting state, spontaneous blinking is able to elicit a modulation of EEG oscillations on a wide range of frequencies (multiband modulation), that involves both signal power (especially at medium‐ and low‐frequency bands) and its phase coherence (especially at low‐frequency bands); (b) the source of these low‐frequency oscillations is localized in the precuneus; (c) in DOC patients' resting state such a blink‐induced modulation does not occur at all, or occurs at low levels of activation; (d) consequently, precuneal localization of this slow activity was not possible; (e) finally, there is a direct relationship between quantitative aspects of delta BROs at mid parietal site and LCFS scores (this resulting in an inverse relationship in terms of severity of consciousness disturbances).
Source Localization of Delta BROs in Healthy Subjects
This study confirms the existence of an oscillatory activity in the delta frequency range (0.5–3.0 Hz) of the resting‐state EEG, both time‐ and phase‐locked to spontaneous blinking instances (BROs) [Bonfiglio et al., 2009, 2011]. In the time domain, as previously described, this activity can be characterized as an ERP waveform with biphasic morphology and positive–negative polarity over posterior regions, whose bi‐dimensional (2D map) topographic group distribution is shown in Figure 1. On a mean group basis, the current source corresponding to the major component of the ERP (positive peak at about +300 ms), was fully localized at the precuneus (BA 7 m). This location confirms and extends previous results obtained by EEG [Berg and Davies, 1988; Heuser‐Link et al., 1992], MEG [Hari et al., 1994], and fMRI [Bristow et al., 2005], in which blink‐related activity, in these cases related to voluntary blinking, was localized in the mesial parieto‐occipital region (near the parieto‐occipital sulcus). At first, this activity was deemed to be a visual potential evoked by luminance changes linked with closure (on–off) and opening (off–on) of the eyelids during the blink [Berg and Davies, 1988; Heuser‐Link et al., 1992]. Subsequently, based on MEG and fMRI studies, this activity has been linked to the continuity of vision, through short‐term storage events of the visual–spatial environmental image [Bristow et al., 2005; Hari et al., 1994]. The precuneus, together with anterior‐cingulate/mesiofrontal cortex and temporo‐parietal junctions, is included by most Authors in the DMN, within which indeed it would constitute a convergence node with a primary functional role [Fransson and Marrelec, 2008; Hagmann et al., 2008; Vogt and Laureys, 2005]. The currently prevailing line of thought considers the precuneus to be involved in the representation of the self in relation to the outside world [Cavanna and Trimble, 2006; Cavanna, 2007]. This is in accordance with the functional significance that has been putatively assigned to delta BROs, i.e., the manifestation of neural networks subserving perceptive awareness of the visuospatial environment in an egocentric reference frame (first‐person perspective) at a low level of processing (i.e., whereas the subject is not engaged in attention‐demanding tasks but rather in internally oriented activities) [Bonfiglio et al., 2009, 2011]. This functional hypothesis is therefore supported by the full anatomical correspondence, highlighted in this study, between the source of this blink‐related activity and the precuneus.
Delta BROs Modulation Across Levels of Consciousness
Since the earliest studies of DeVolder et al. 1990 in subjects with postanoxic VS, and Laureys et al. 1999 in subjects with multicause VS, it became clear that the mesial parieto‐occipital region (namely the PCC/precuneus) was also included among the various brain regions with impaired glucose metabolism. Laureys et al. 1999, through statistical parametric mapping, linked this phenomenon to a loss of effective connectivity between prefrontal regions and the PCC, whose integrity under normal conditions has long been considered critical for proper functioning of both working memory [Goldman‐Rakic, 1988] and neural conscious processes [Baars et al., 2003]. Numerous studies have subsequently confirmed and stressed the role of the PCC/precuneus in maintaining various functions of consciousness, through the demonstration of its inactivation during states of loss or impaired consciousness [Boly et al., 2009], as well as its functional recovery to near‐normal levels at the re‐emergence of consciousness itself [Laureys et al., 2004; Laureys, 2005]. Such a recovery has been related to the rewiring of long‐range corticocortical (between midline‐posterior and prefrontal areas) and/or corticothalamic connections (between midline‐posterior and nonspecific thalamic nuclei) [Laureys et al., 2006; Silva et al., 2010; Voss et al., 2006]. Recently, a direct relationship between connectivity strength within the DMN and levels of awareness was found, with the peak significance of this correlation situated in the PCC/precuneus, so that this parameter was indicated as an element of differentiation between VSs and MCSs [Vanhaudenhuyse et al., 2010]. In our opinion, the results of our study are complementary, in an electrophysiological perspective, to those previously reported: in our group of subjects with DOC no slow blink‐related activity was detected at the precuneus (contrary to healthy subjects). Furthermore, signal power in the delta band at Pz and its phase coherence were directly proportional to the LCFS scores expressed by all subjects participating in the study. This confirms the crucial role played by this cortical region in neural processes of consciousness.
In terms of functional significance, from a neurophysiological perspective, the absence or low levels of blink‐related activity in subjects with DOC shows that in normal conditions spontaneous blinking probably deals with basic neural activities related to consciousness. Moreover, both its current source localization in the precuneus and the functional characteristics classically attributed to the precuneus itself (i.e., the coincidence of both anatomical and functional aspects) show that it probably deals with awareness of self and environment.
Spontaneous and Evoked Delta Oscillations: Functional Significance
A relevant element in our study is the finding that baseline (background) delta power is significantly higher in subjects with DOC than in control subjects. This finding is congruent with what has recently been reported by Leon‐Carrion et al. 2008 in patients with traumatic brain injury. If we, instead, consider event‐related (blink‐related) delta signals, an opposite behavior can be observed. In other words, in this study there is a double dissociation between spontaneous delta, blink‐related delta and levels of consciousness of subjects. This is in line with what was emphasized by Klimesch 1999, who found a double dissociation in cognitive performance in different circumstances: during normal development from infants to adulthood, during the involution processes of senescence, in different neurological disorders, and finally in the hypnagogic state (i.e., in the transition state between waking and sleep during which the ability to respond to external stimuli is reduced). The inverse relationship between spontaneous and event‐related delta activity was also confirmed in studies on both schizophrenia and Alzheimer's disease (diseases that share, among other things, altered states of consciousness) [Bates et al., 2009; Yener et al., 2008]. An additional relevant element is the correlation we found between levels of consciousness and phase coherence of delta oscillations. It was recently shown in macaques that reaction time to a relevant stimulus depends on the current phase of spontaneous delta rhythm and on the ability of evoked delta oscillations to align to the phase of the stimulus itself (entrainment) [Lakatos et al., 2008]. Moreover, an inverse relationship between the power of both delta and theta oscillations at rest and the amplitude reduction of mismatch negativity (MMN) has been shown in humans affected by schizophrenia [Kirino, 2007]. Strikingly, in its nature of ERP, MMN depends on phase‐resetting of brain oscillations in these same frequency bands [Karacaş et al., 2000]. All these findings suggest that the efficiency in information processing may depend on the ability of recruitment of coherent oscillations and that the relative inability to recruit them in pathological conditions is dependent on the presence of interfering oscillations in the same frequency band, originating from pathological sources [Bates et al., 2009; Kirino, 2007]. Thus, the following interpretation can be made: on one hand, there are disordered (chaotic) delta oscillations—more or less widely represented—which are not organized by the event (i.e., unresponsive) and not involved in a functional activity; on the other hand, there are ordered delta oscillations, spatially localized, and temporally organized, put into phase by the event or likely to be (i.e., responsive) and possibly involved in a functional activity. By taking into account that, first, the recovery of the functions of consciousness and the activation of precuneus are synchronous with the anatomofunctional restoration of long‐range corticocortical and/or corticothalamic connections [Laureys et al., 2006; Silva et al., 2010; Voss et al., 2006] and, second, the importance of slow oscillations as elements of long‐range connectivity [Sarnthein et al., 1998; von Stein and Sarnthein, 2000], we are led to speculate that the emergence and consolidation of coherent delta oscillations at mid‐parietal site of subjects who are coming out from VS reflect the progress of these same phenomena of reconnection. Moreover, despite the diversity of our approach to the problem, we can agree with Balazs et al. 2006 and Hildebrandt et al. 2007, that the emergence from the VS is somehow characterized by the recovery of primary visual and/or visual associative areas (paravisual cortices) and probably deals with a regained (or better) awareness of the environment, perhaps in view of future interaction with it.
LIMITATIONS
Although in this study a significant relationship between spectral parameters (ERSP/ITC) and LCFS scores was demonstrated, however, at the group level analysis, as in other recent works [Wu et al., 2011], MCS patients turned out to be not statistically different from VS. In our case, this is due to a high intersubject variability (within group variance) of the blink‐related EEG spectral parameters, which resulted in a partial overlapping between VS and MCS. As can be seen from Figure 3B,D, in fact, the within‐group variance of MCS is greater than the variance between MCS and VS groups for both ERSP and ITC.
The reason for this could be traced to three alternative or complementary factors. First, because the within‐group variance is inversely proportional to the number of cases, the relatively low number of subjects enrolled in our study may have played a role in the lack of statistical differentiation of the MCS group. As a consequence, although the overall results of this study can be considered encouraging, it would be desirable to get a confirmation on larger cohorts of patients, who could be recruited promoting a large, well controlled, multicentric study on the topic. Second, the MCS group is less homogeneous with respect to the VS group because it is composed of subjects with LCFS scores ranging from 3 to 6, hence with a behavioral reactivity somewhat different from each other. Therefore, increasing the number of patients with MCS would also help to divide this group into two further subgroups, MCS− and MCS+, with the advantage of considerably improving within‐group homogeneity. Finally, because the MCS group is characterized by intermediate levels of activity, i.e., not flattened at the lower levels of VS (floor effect) neither at the higher ones of controls (ceiling effect), it may be more sensitive to the fluctuations in arousal/alertness that often characterize patients with DOC. A solution, as suggested by Neumann and Kotchoubey 2004 and by Schiff 2005, may be to assess patients on more than one occasion.
Moreover, a few general factors should be also considered. MCS patients are diagnosed as such because they begin to present reliable and reproducible behavioral responses to external stimuli. However, these responses depend on the activity of the TPN, not on DMN activity. It is known, in fact, that the two systems are anticorrelated, i.e., the activation of one of them disables the other. Assuming a dissociated involvement of the two systems in some patients with DOC [Schiff, 2005], the fact that the TPN is activated in patients with MCS, when they are asked to produce a behavioral response, does not necessarily imply that the DMN is activatable too, in the opposite condition of rest [Soddu et al., 2009]. Consequently, the recovery of a certain proneness to respond to external stimuli (that presupposes the acquisition of a, more or less explicit, perceptual orientation of the subject towards the external environment) may not give us sufficient information about his/her contents of consciousness—defined as (self‐) reflective consciousness. This could partly explain some Type II errors (false negatives) shown in recent functional studies [Gawryluk et al., 2010; Gosseries et al., 2011; Schnakers et al., 2009]. Finally, the interference between these two systems should also not be forgotten, so the periodic functional prevalence of DMN during cognitive tasks can be a source of errors in providing the required responses, even in normal subjects [Sonuga‐Barke and Castellanos, 2007]. Following this line of thought, the inconsistency and great latency of the behavioral responses observed in some patients with DOC, elements on which the clinical differentiation between VS and MCS is made, and hence of crucial importance for the correct approach to clinical care of individual patients, could be attributed to a persistent prevalence of DMN, which may interfere with the TPN ability to respond. A consideration arises from all the above: trying to associate functional indexes (EEG or metabolic) of the DMN to behavioral scales scores, which, as such, only test the TPN, may be a not entirely appropriate procedure in this type of studies.
It must be stressed, moreover, that the fragmentation of the DOC group into two subgroups resulted in a mismatch of the age factor, both between VS and healthy controls and between VS and MCS. However, as is known, old age is in itself a negative prognostic factor regarding the possibility of recovery from a VS [Monti et al., 2010], so the probability that the elderly join the group with the most severe DOC (and vice versa) is higher. In other words, the difference in age presented by the two diagnostic subgroups is not surprising given that it reflects the epidemiology of DOC and the influence of the age factor on the likelihood of recovery. On the other hand, to rule out any relationship between the spectral parameters (ERSP/ITC) of the blink‐related EEG and the age of participants in this study and, consequently, the possibility of any age‐related bias, we performed a preliminary regression analysis between these variables in our subjects, which, as expected, was not significant.
CONCLUSIONS
The localization of the delta BROs source in the precuneus, and its absence in patients with DOC, introduced evidence favoring the hypothesis that this activity reflects neural processes associated with phenomena of awareness of the self and the environment. Moreover, the finding of a correlation between power/synchronization of delta BROs at mid‐parietal site and levels of consciousness, in our opinion, reinforces this hypothesis, even if, due to the lack of statistical differentiation between VS and MCS in the present work and the still limited studies on the topic to date, further confirmation is required before delta BROs can be considered as a reliable biomarker of consciousness.
Theoretical assumptions [Crick and Koch, 1990] and various experimental evidence [Bonfiglio et al., 2005, 2009, 2011], however, permit us to consider blinking as a spontaneous event, not only internally generated, but also intrinsically associated to the temporal frame of consciousness stream. Spontaneous blinking would in fact work as a sort of behavioral epiphenomenon, marking opening and closure times of the subsequent phases of attention/processing and updating/storing of the conscious context (referring both to outer and inner environments), which are the basis for maintaining the function of consciousness. Compared with conventional analysis of the resting state EEG, where recordings are usually performed with eyes closed or epochs invalidated by blink artifacts are discarded (thus paradoxically losing the activity of interest), the analysis of EEG modulations associated with spontaneous blinking used in this study introduces a new dynamic element (i.e., the blink) to be considered as a reference point for both time‐ and phase‐locked analyses. Therefore, blink‐related analysis of the resting‐state EEG may be regarded as a dynamic (phasic), intrinsically event‐related analysis, rather than a static (tonic) one. This new perspective has enabled us to grasp, in some respects, active processes during the resting state and, hence, to penetrate the inner structure of temporal processes of consciousness.
Ultimately, we feel that, in the light of the overall results of this study, we can respond in a cautiously positive manner to the question left open by Karacaş et al. 2000, as to whether the delta response could be taken as an index of the degree of consciousness.
Supporting information
Supporting Information Figure 1
Supporting Information Figure 2
Supporting Information Table 1
This work was performed at: Unit of Neurorehabilitation, Department of Neuroscience, University of Pisa, Italy.
REFERENCES
- Baars BJ, Rams⊘y TZ, Laureys S (2003): Brain, conscious experience and the observing self. Trends Neurosci 26:671–675. [DOI] [PubMed] [Google Scholar]
- Balazs S, Stepan C, Binder H, von Gizycki H, Avitable M, Obersteiner A, Rattay F, Selesnick I, Bodis‐Wollner I (2006): Conjugate eye movements and gamma power modulation of the EEG in persistent vegetative state. J Neurol Sci 246:65–69. [DOI] [PubMed] [Google Scholar]
- Bates AT, Kiehl KA, Laurens KR, Liddle PF (2009): Low‐frequency EEG oscillations associated with information processing in schizophrenia. Schizophr Res 115:222–230. [DOI] [PubMed] [Google Scholar]
- Berg P, Davies MB (1988): Eyeblink‐related potentials. Electroencephalogr Clin Neurophysiol 69:1–5. [DOI] [PubMed] [Google Scholar]
- Boly M, Phillips C, Tshibanda L, Vanhaudenhuyse A, Schabus M, Dang‐Vu TT, Moonen G, Hustinx R, Maquet P, Laureys S (2008): Intrinsic brain activity in altered states of consciousness: How conscious is the default mode of brain function? Ann N Y Acad Sci 1129:119–129. [DOI] [PMC free article] [PubMed] [Google Scholar]
- Boly M, Tshibanda L, Vanhaudenhuyse A, Noirhomme Q, Schnakers C, Ledoux D, Boveroux P, Garweg C, Lambermon B, Phillips C, Luxen A, Moonen G, Bassetti C, Maquet P, Laureys S (2009): Functional connectivity in the default network during resting state is preserved in a vegetative but not in a brain dead patient. Hum Brain Mapp 30:2393–2400. [DOI] [PMC free article] [PubMed] [Google Scholar]
- Bonfiglio L, Carboncini MC, Bongioanni P, Andre P, Minichilli F, Forni M, Rossi B (2005): Spontaneous blinking behaviour in persistent vegetative and minimally conscious states: Relationships with evolution and outcome. Brain Res Bull 68:163–170. [DOI] [PubMed] [Google Scholar]
- Bonfiglio L, Sello S, Andre P, Carboncini MC, Arrighi P, Rossi B (2009): Blink‐related delta oscillations in the resting‐state EEG: A wavelet analysis. Neurosci Lett 449:57–60. [DOI] [PubMed] [Google Scholar]
- Bonfiglio L, Sello S, Carboncini MC, Arrighi P, Andre P, Rossi B (2011): Reciprocal dynamics of EEG alpha and delta oscillations during spontaneous blinking at rest: A survey on a default mode‐based visuospatial awareness. Int J Psychophysiol 80:44–53. [DOI] [PubMed] [Google Scholar]
- Bristow D, Frith C, Rees G (2005): Two distinct neural effects of blinking on human visual processing. NeuroImage 27:136–145. [DOI] [PubMed] [Google Scholar]
- Bruno MA, Vanhaudenhuyse A, Schnakers C, Boly M, Gosseries O, Demertzi A, Majerus S, Moonen G, Hustinx R, Laureys S (2010): Visual fixation in the vegetative state: An observational case series PET study. BMC Neurol 10:35. [DOI] [PMC free article] [PubMed] [Google Scholar]
- Buckner RL, Andrews‐Hanna JR, Schacter DL (2008): The brain's default network: Anatomy, function, and relevance to disease. Ann N Y Acad Sci 1124:1–38. [DOI] [PubMed] [Google Scholar]
- Cavanna AE (2007): The precuneus and consciousness. CNS Spectr 12:545–552. [DOI] [PubMed] [Google Scholar]
- Cavanna AE, Trimble MR (2006): The precuneus: A review of its functional anatomy and behavioual correlates. Brain 129:564–583. [DOI] [PubMed] [Google Scholar]
- Clemens B, Bessenyei M, Fekete I, Puskás S, Kondákor I, Tóth M, Hollódy K (2010): Theta EEG source localization using LORETA in partial epilepsy patients with and without medication. Clin Neurophysiol 121:848–858. [DOI] [PubMed] [Google Scholar]
- Crick F, Koch C (1990): Some reflections on visual awareness. Cold Spring Arb Symp Quant Biol 55:953–962. [DOI] [PubMed] [Google Scholar]
- Delorme A, Makeig S (2004): EEGLAB: An open source toolbox for analysis of single‐trial EEG dynamics including independent component analysis. J Neurosci Methods 134:9–21. [DOI] [PubMed] [Google Scholar]
- DeVolder AG, Goffinet AM, Bol A, Michel C, de Barsy T, Laterre C (1990): Brain glucose metabolism in postanoxic syndrome: Positron emission tomographic study. Arch Neurol 47:197–204. [DOI] [PubMed] [Google Scholar]
- Fox MD, Snyder AZ, Vincent JL, Corbetta M, Van Essen DC, Raichle ME (2005): The human brain is intrinsically organized into dynamic, anticorrelated functional networks. Proc Natl Acad Sci USA 102:9673–9678. [DOI] [PMC free article] [PubMed] [Google Scholar]
- Fransson P, Marrelec G (2008): The precuneus/posterior cingulate cortex plays a pivotal role in the default mode network: Evidence from a partial correlation network analysis. NeuroImage 42:1178–1184. [DOI] [PubMed] [Google Scholar]
- Gawryluk JR, D'Arcy RCN, Connoly JF, Weaver DF (2010): Improving the clinical assessment of consciousness with advances in electrophysiological and neuroimaging techniques. BMC Neurol 10:11. [DOI] [PMC free article] [PubMed] [Google Scholar]
- Giacino JT, Kalmar K, Whyte J (2004): The JFK Coma Recovery Scale‐Revised: Measurement characteristics and diagnostic utility. Arch Phys Med Rehabil 85:2020–2029. [DOI] [PubMed] [Google Scholar]
- Goldman‐Rakic PS (1988): Topography of cognition: Parallel distributed networks in primate association cortex. Annu Rev Neurosci 11:137–156. [DOI] [PubMed] [Google Scholar]
- Gosseries O, Schnakers C, Ledoux D, Vanhaudenhuyse A, Bruno MA, Demertzi A, Noirhomme Q, Lehembre R, Damas P, Goldman S, Peeters E, Moonen G, Laureys S (2011): Automated EEG entropy measurements in coma, vegetative/unresponsive wakefulness syndrome and minimally conscious state. Funct Neurol 26:25–30. [PMC free article] [PubMed] [Google Scholar]
- Gusnard DA, Raichle ME (2001): Searching for a baseline: Functional imaging and the resting human brain. Nat Rev Neurosci 2:685–694. [DOI] [PubMed] [Google Scholar]
- Hagan C, Malkmus D, Durham P (1979): Levels of cognitive function In: Rehabilitation of the Head‐Injured Adult: Comprehensive Physical Management. Downey, CA: Professional Staff Association of Rancho Los Amigos Hospital. [Google Scholar]
- Hagmann P, Cammoun L, Gigandet X, Meuli R, Honey CJ, Wedeen VJ, Sporns O (2008): Mapping the structural core of human cerebral cortex. PLoS Biol 6:e159. [DOI] [PMC free article] [PubMed] [Google Scholar]
- Hahn B, Ross TJ, Stein EA (2007): Cingulate activation increases dynamically with response speed under stimulus unpredictability. Cereb Cortex 17:1664–1671. [DOI] [PMC free article] [PubMed] [Google Scholar]
- Hari R, Salmelin R, Tissari SO, Kajola M, Virsu V (1994): Visual stability during eyeblinks. Nature 367:121–122. [DOI] [PubMed] [Google Scholar]
- Heuser‐Link M, Dirlich G, Berg P, Vogl L, Scherg M (1992): Eyeblinks evoke potentials in the occipital brain region. Neurosci Lett 143:31–34. [DOI] [PubMed] [Google Scholar]
- Hildebrandt H, Happe S, Deutschmann A, Basar‐Eroglu C, Eling P, Brunhöber J (2007): Brain perfusion and VEP reactivity in occipital and parietal areas are associated to recovery from hypoxic vegetative state. J Neurol Sci 260:150–158. [DOI] [PubMed] [Google Scholar]
- Holmes CJ, Hoge R, Collins L, Woods R, Toga AW, Evans AC (1998): Enhancement of MR images using registration for signal averaging. J Comput Assist Tomogr 22:324–333. [DOI] [PubMed] [Google Scholar]
- Karacaş S, Erzengin OU, Başar E (2000): The genesis of human event‐related responses explained through the theory of oscillatory neural assemblies. Neurosci Lett 285:45–48. [DOI] [PubMed] [Google Scholar]
- Kayser J, Tenke CE (2010): In search of the Rosetta Stone for scalp EEG: Converging on reference‐free techniques. Clin Neurophysiol 121:1973–1975. [DOI] [PMC free article] [PubMed] [Google Scholar]
- Kirino E (2007): Mismatch negativity correlates with delta and theta EEG power in schizofrenia. Int J Neurosci 117:1257–1279. [DOI] [PubMed] [Google Scholar]
- Klimesch W (1999): EEG alpha and theta oscillations reflect cognitive and memory performance: A review and analysis. Brain Res Rev 29:169–195. [DOI] [PubMed] [Google Scholar]
- Lakatos P, Karmos G, Mehta AD, Ulbert I, Schroeder CE (2008): Entrainment of neuronal oscillations as a mechanism of attentional selection. Science 320:110–113. [DOI] [PubMed] [Google Scholar]
- Laureys S (2005): The neural correlate of (un)awareness: Lessons from vegetative state. Trends Cogn Sci 9:556–559. [DOI] [PubMed] [Google Scholar]
- Laureys S, Goldman S, Phillips C, Van Bogaert P, Aerts J, Luxen A, Franck G, Maquet P (1999): Impaired effective cortical connectivity in vegetative state: Preliminary investigation using PET. NeuroImage 9:377–382. [DOI] [PubMed] [Google Scholar]
- Laureys S, Owen AM, Schiff ND (2004): Brain function in coma, vegetative state, and related disorders. Lancet Neurol 3:537–546. [DOI] [PubMed] [Google Scholar]
- Laureys S, Boly M, Maquet P (2006): Tracking the recovery of consciousness from coma. J Clin Invest 116:1823–1825. [DOI] [PMC free article] [PubMed] [Google Scholar]
- Leon‐Carrion J, Martin‐Rodriguez JF, Damas‐Lopez J, Barroso y Martin JM, Dominguez‐Morales MR (2008): Brain function in the minimally conscious state: A quantitative neurophysiological study. Clin Neurophysiol 119:1506–1514. [DOI] [PubMed] [Google Scholar]
- Makeig S, Bell AJ, Jung T‐P, Sejnowski TJ (1996): Independent component analysis of electroencephalographic data In: Touretzky D, Mozer M, Hasselmo M, editors. Advances in Neural Information Processing Systems, Vol.8 Cambridge, MA: The MIT Press; pp145–151. [Google Scholar]
- Margulies DS, Vincent JL, Kelly C, Lohmann G, Uddin LQ, Biswal BB, Villringer A, Castellanos FX, Milham MP, Petrides M (2009): Precuneus shares intrinsic functional architecture in humans and monkeys. Proc Natl Acad Sci USA 106:20069–20074. [DOI] [PMC free article] [PubMed] [Google Scholar]
- Monti MM, Laureys S, Owen AM (2010): The vegetative state. BMJ 341:c3765. [DOI] [PubMed] [Google Scholar]
- Neumann N, Kotchoubey B (2004): Assessment of cognitive functions in severely paralysed and severely brain‐damaged patients: Neuropsychological and electrophysiological methods. Brain Res Brain Res Protoc 14:25–36. [DOI] [PubMed] [Google Scholar]
- Pascual‐Marqui RD, Michel MC, Lehmann D (1994): Low resolution electromagnetic tomography: A new method for localizing electrical activity in the brain. Int J Psychophysiol 18:49–65. [DOI] [PubMed] [Google Scholar]
- Pascual‐Marqui RD, Esslen M, Kochi K, Lehmann D (2002): Functional imaging with low resolution brain electromagnetic tomography (LORETA): A review. Methods Find Exp Clin Pharmacol 24(Suppl. C):91–95. [PubMed] [Google Scholar]
- Qin Y, Xu P, Yao D (2010): A comparative study of different references for EEG default mode network: The use of the infinity reference. Clin Neurophysiol 121:1981–1991. [DOI] [PubMed] [Google Scholar]
- Raichle ME, MacLeod AM, Snyder AZ, Powers WJ, Gusnard DA, Shulman GL (2001): A default mode of brain function. Proc Natl Acad Sci USA 98:676–682. [DOI] [PMC free article] [PubMed] [Google Scholar]
- Sarnthein J, Petsche H, Rappelsberger P, Shaw GL, von Stein A (1998): Synchronization between prefrontal and posterior association cortex during human working memory. Proc Natl Acad Sci USA 95:7092–7096. [DOI] [PMC free article] [PubMed] [Google Scholar]
- Schiff ND (2005): Modeling the minimally conscious state: Measurements of brain function and therapeutic possibilities. Progr Brain Res 150:473–493. [DOI] [PubMed] [Google Scholar]
- Schnakers C, Vanhaudenhuyse A, Giacino J, Ventura M, Boly M, Majerus S, Moonen G, Laureys S (2009): Diagnostic accuracy of the vegetative and minimally conscious state: Clinical consensus versus standardized neurobehavioral assessment. BMC Neurol 9:35. [DOI] [PMC free article] [PubMed] [Google Scholar]
- Silva S, Alacoque X, Fourcade O, Samii K, Marque P, Woods R, Mazziotta J, Chollet F, Loubinoux I (2010): Wakefulness and loss of awareness: Brain and brainstem interaction in the vegetative state. Neurology 74:313–320. [DOI] [PMC free article] [PubMed] [Google Scholar]
- Soddu A, Boly M, Nir Y, Noirhomme Q, Vanhaudenhuyse A, Demertzi A, Arzi A, Ovadia S, Stanziano M, Papa M, Laureys S, Malach R (2009): Reaching across the abyss: Recent advances in functional magnetic resonance imaging and their potential relevance to disorders of consciousness. Prog Brain Res 177:261–274. [DOI] [PubMed] [Google Scholar]
- Sonuga‐Barke EJS, Castellanos FX (2007): Spontaneous attentional fluctuations in impaired states and pathological conditions: A neurobiological hypothesis. Neurosci Biobehav Rev 31:977–986. [DOI] [PubMed] [Google Scholar]
- Talairach J, Tournoux P (1988): Co‐Planar Stereotaxic Atlas of the Human Brain. Stuttgart: Thieme. [Google Scholar]
- Torrence C, Compo GP (1998): A practical guide to wavelet analysis. Bull Am Math Soc 79:61–78 (Software for wavelet analysis available at http://paos.colorado.edu/research/wavelets/). [Google Scholar]
- Towle VL, Bolanos J, Suarez D, Tan K, Grzeszczuk R, Levin DN, Cakmur R, Frank SA, Spire JP (1993): The spatial location of EEG electrodes: Locating the best‐fitting sphere relative to cortical anatomy. Electroencephalogr Clin Neurophysiol 86:1–6. [DOI] [PubMed] [Google Scholar]
- Vanhaudenhuyse A, Noirhomme Q, Tshibanda LJ, Bruno MA, Boveroux P, Schnakers C, Soddu A, Perlbarg V, Ledoux D, Brichant JF, Moonen G, Maquet P, Greicius MD, Laureys S, Boly M (2010): Default network connectivity reflects the level of consciousness in non‐communicative brain‐damaged patients. Brain 133:161–171. [DOI] [PMC free article] [PubMed] [Google Scholar]
- Vogt BA, Laureys S (2005): Posterior cingulate, precuneal and retrosplenial cortices: Cytology and components of the neural network correlates of consciousness. Prog Brain Res 150:205–217. [DOI] [PMC free article] [PubMed] [Google Scholar]
- von Stein A, Sarnthein J (2000): Different frequencies for different scales of cortical integration: From local gamma to long range alpha/theta synchronization. Int J Psychophysiol 38:301–313. [DOI] [PubMed] [Google Scholar]
- Voss HU, Ulug AM, Dyke JP, Watts R, Kobylarz EJ, McCandliss BD, Heier LA, Beattie BJ, Hamacher KA, Vallabhajosula S, Goldsmith SJ, Ballon D, Giacino JT, Schiff ND (2006): Possible axonal regrowth in late recovery from the minimally conscious state. J Clin Invest 116:2005–2011. [DOI] [PMC free article] [PubMed] [Google Scholar]
- Welch PD (1967): The use of Fast Fourier Transform for the estimation of power spectra: A method based on time averaging over short, modified periodograms. IEEE Trans Audio Electroacoust AU‐15:70–73. [Google Scholar]
- Wu DY, Cai G, Yuan Y, Liu L, Li GQ, Song WQ, Wang MB (2011): Application of nonlinear dynamics analysis in assessing unconsciousness: A preliminary study. Clin Neurophysiol 122:490–498. [DOI] [PubMed] [Google Scholar]
- Yener G, Güntekin B, Başar E (2008): Event‐related delta oscillatory responses of Alzheimer patients. Eur J Neurol 15:540–547. [DOI] [PubMed] [Google Scholar]
Associated Data
This section collects any data citations, data availability statements, or supplementary materials included in this article.
Supplementary Materials
Supporting Information Figure 1
Supporting Information Figure 2
Supporting Information Table 1