

Abstract
Attending to the spatial location or to nonspatial features of a stimulus modulates neural activity in cortical areas that process its perceptual attributes. The feature‐based attentional selection of the direction of a moving stimulus is associated with increased firing of individual neurons tuned to the direction of the movement in area V5/MT, while responses of neurons tuned to opposite directions are suppressed. However, it is not known how these multiplicatively scaled responses of individual neurons tuned to different motion‐directions are integrated at the population level, in order to facilitate the processing of stimuli that match the perceptual goals. Using functional magnetic resonance imaging (fMRI) the present study revealed that attending to the movement direction of a dot field enhances the response in a number of areas including the human MT region (hMT) as a function of the coherence of the stimulus. Attending the opposite direction, however, lead to a suppressed response in hMT that was inversely correlated with stimulus‐coherence. These findings demonstrate that the multiplicative scaling of single‐neuron responses by feature‐based attention results in an enhanced direction‐selective population response within those cortical modules that processes the physical attributes of the attended stimuli. Our results provide strong support for the validity of the “feature similarity gain model” on the integrated population response as quantified by parametric fMRI in humans. Hum Brain Mapp, 2011. © 2011 Wiley Periodicals, Inc.
Keywords: feature‐based attention, motion, coherence, fMRI, human MT
INTRODUCTION
The detection of a moving object, indicative of the appearance of another living and perhaps dangerous being, is of vital importance to survival. Psychophysical performance in motion‐detection tasks has been directly linked to the responses of direction‐selective neurons within the visual area V5/MT [Britten et al.,1992,1996; Newsome et al.,1989]. These neurophysiological investigations in primates revealed a nearly linear correlation between the motion‐coherence of a stimulus and the firing rate of individual V5/MT neurons tuned to that direction. A similar relationship has also been observed at the population‐level in human studies using functional magnetic resonance imaging (fMRI) and magnetoencephalography (MEG), [Handel et al.,2007; Nakamura et al.,2003; Rees et al.,2000; Siegel et al.,2007].
In addition to the physical characteristics of the stimuli, the detection performance can also be markedly affected by attention, resulting in a concurrent modulation of the firing‐rate of direction‐selective neurons within area V5/MT [Cook and Maunsell,2002a,b,2004]. These attentional modulations have been shown to modify the response profile of direction‐selective neurons within V5/MT in a multiplicative manner: neurons whose feature‐preference closely matches the attended motion‐direction increase their firing rate, while the firing of neurons tuned to opposite directions is suppressed [Martinez‐Trujillo and Treue,2004; Treue and Martinez Trujillo,1999]. These findings gave rise to the “feature‐similarity gain model” that postulates that an individual neuron's response depends on the feature‐similarity between a current behaviorally relevant target and the feature‐preference of that neuron. This multiplicative attentional modulation at the individual‐neuron level has been proposed to result in an improved selectivity for the attended feature at the population level.
Similar feature‐based attentional modulations have also been demonstrated using fMRI in humans for moving stimuli presented within or outside the focus of spatial attention [O'Craven et al.,1997; Saenz et al.,2002] and even in absence of direct visual stimulation [Chawla et al.,1999]. However, direction‐selective attentional modulations throughout multiple stages of the human visual cortex thus far have only been demonstrated using pattern classification methods for fMRI data analysis [Kamitani and Tong,2006; Serences and Boynton,2007]. In these studies, direction‐selective information could be decoded from multiple areas across the visual hierarchy, which, however, does not necessarily imply the existence of direction‐selective neuronal populations within all of these regions [Serences and Boynton,2007]. The response profile of a given voxel within these regions also could reflect feedforward and/or feedback activations instead of true direction‐selective population‐activity [Sillito et al.,2006].
In the present study direction‐selective attention and stimulus‐coherence were simultaneously manipulated to investigate direction‐selective population activity in the human brain using fMRI. To this end, we parametrically manipulated the coherence of dots within an aperture while attention was either directed to the main direction of the dots (left or right) or to the opposite direction. This experimental setup permitted to test predictions from the feature similarity‐gain model [Martinez‐Trujillo and Treue,2004] at the population level in human motion‐responsive areas. The highest responses were expected when the properties of the presented stimulus perfectly match the attended feature, e.g., at 100% coherence in the attended direction. When the opposite direction is attended, the responses were expected to correlate inversely with stimulus coherence, i.e., to decrease with rising coherence.
MATERIALS AND METHODS
Subjects
Twelve healthy right‐handed subjects (nine females), all with normal or corrected‐to‐normal vision, participated as paid volunteers in the study [mean age: 25.0 ± 0.8 (SEM) years]. All participants gave informed consent, were paid for participation and the local ethics committee of the University of Magdeburg approved the study.
Stimuli and Experimental Design
Stimuli were presented against a dark background (45 cd m−2) within a square region (8° × 8°) that was presented above a central fixation cross (4° to the lower edge of the square) and centered on the vertical meridian. Within this square, one hundred stationary white dots (brightness 200 cd m−2) were present continuously during the inter‐trial intervals (see Fig. 1). The mean contrast of the stimulus within the squared aperture was 30.4 cd m−2 (the stimulus contrast was quantified as the SD of local luminance values [Moulden et al.,1990], and computed as previously described for comparable stimulus‐configurations [Martinez‐Trujillo and Treue,2002]). In each trial a certain proportion (100, 85, and 70%) of the dots moved coherently in the same direction (either to the left or to the right) for 300 ms and thus was perceived as a transparent surface. The motion velocity of the transparent surface could either be slow (4° s−1) or fast (6° s−1) predefined on a pseudo‐random basis. All remaining dots were randomly displaced with the same motion speed as the transparent surface. The inter‐trial interval varied randomly between 1 and 7 s following a gamma function to allow trial separation in an event‐related analysis [Hinrichs et al.,2000]. Subjects received six scanning runs of 8 min, which consisted of 10 blocks of 20 trials, resulting in 212–233 trials per condition. Before each block, a central cue (a white arrow pointing to the left or right) replacing the fixation cross for 2 s indicated which direction of motion the subjects had to attend. Subjects were required to make a speeded button‐press response after detecting a fast movement of the transparent surface into the attended direction. Such fast movements (targets) occurred in 20% of the cases while in 80% of the trials the movements were slow (standards). Thus we were able to compare the neuronal modulations elicited by moving transparent surfaces of variable coherence (100, 85, and 70%) while their motion direction was attended or opposite to the attended direction.
Figure 1.
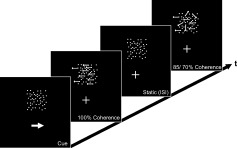
Schematic illustration of the experimental design. At the beginning of each block an arrow indicated which direction of motion had to be attended (left‐ or rightward motion). The dots remained stationary during the inter‐stimulus interval and at the beginning of each trial moved either left‐ or rightwards for 300 ms. There were three alternative coherence‐levels for both motion‐directions (100, 85, and 70%). On some trials, the dots moved with a higher velocity, and subjects responded to those in the attended direction as targets independent of the motion‐coherence of the dots.
fMRI Data Acquisition
fMRI data acquisition was performed on a 3‐Tesla MR scanner (Siemens Magnetom Trio, Erlangen, Germany) using an eight‐channel head coil. An LCD projector back‐projected the stimuli onto a screen positioned behind the head coil, while subjects viewed the stimuli via a mirror attached to the coil reflecting the images displayed on the screen. Thirty slices (thickness = 4 mm, in plane resolution 64 × 64 mm2, FoV 224 × 224 mm2, no gap, resulting voxel size = 3.5 × 3.5 × 4 mm3, AC‐PC oriented) were acquired with a T2*‐weighted echo planar imaging (EPI) gradient sequence (TR = 2,000 ms, TE = 30 ms, flip angle = 80°) in an odd‐even interleaved sequence. Each scanning session consisted of 205 vol. In a structural session, sagittal whole‐head T1‐weighted images were collected (48 slices, thickness = 4 mm, 64 × 64 matrix, FoV 224 × 224 mm2, gap = 0.8 mm, spatial resolution = 0.9 × 0.9 × 4 mm3, TE = 4.9 ms, TR = 15,000 ms).
fMRI Data Analysis
Data analysis was performed using SPM5 software (Wellcome Department of Cognitive Neurology, University College London, UK) and MATLAB 7.4 (The Mathwork). Following correction for differences in slice acquisition time, EPI volumes were realigned to the first volume and spatially normalized to an EPI template in standard MNI space with sub‐sampling to a resultant voxel size of 2 × 2 × 2 mm3. The normalized images were spatially smoothed using an 8‐mm full‐width at half‐maximum isotropic Gaussian kernel. Statistical analysis of the data was performed employing the standard hemodynamic‐response function implemented in SPM5 in an event‐related design for each subject that additionally included the movement parameters derived from the realignment procedure as covariates. Contrasts of parameter estimates comparing trials of different motion coherence levels vs. baseline were calculated for both attention conditions and the corresponding contrast images were subsequently entered into a random effects analysis. Stereotactic coordinates for voxels with maximal F‐values within activation clusters are reported in the MNI standard space (significance threshold at a whole‐brain corrected false discovery rate (FDR) of P < 0.01 with a minimum cluster extent of k = 20 contiguous voxels). For visualization of the data, activation maps were superimposed on a semitransparent surface‐based representation of the MNI canonical brain using the SPM surfrend toolbox (http://spmsurfrend.sourceforge.net) and NeuroLens (http://www.neurolens.org/NeuroLens/Home.html).
For direct comparison of the magnitude of hemodynamic modulations induced by the different conditions a region of interest (ROI) analysis was performed using the MarsBar toolbox in SPM5 [Brett et al.,2002]. The ROIs were functionally defined based on the local activation maxima given by the overall effects of interest F‐contrast of a second‐level 2 × 3 factorial ANOVA including all six condition of interest (2 attention × 3 motion coherence levels; see Table I for the activation‐maxima of the main effect and Table II for coordinates of the ROIs), treating inter‐subject variability as a random effect to account for inter‐individual variance. For all ROIs [anterior cingulated cortex (ACC), fundus of the intraparietal sulcus (fIPS), human analogue of the middle temporal area (hMT), lateral parietal cortex, superior frontal gyrus (SFG), superior parietal lobe (SPL), thalamus, and V3a] mean beta values were extracted from the individual subjects' data. These data were subjected to a repeated‐measures analysis of variance (repeated‐measures ANOVA) with the factors region, hemisphere (left vs. right), attention condition (direction attended vs. anti‐direction attended), and motion coherence (100, 85, and 70%). The significance threshold was set to P < 0.05 following Greenhouse‐Geisser correction for nonsphericity if necessary. Because no significant main effect or interactions were observed for the factor hemisphere, data were collapsed over both hemispheres for analysis of each individual ROI. The data for each ROI were separately subjected to repeated measures ANOVAs with the factors attention condition and motion coherence.
Table I.
Peak activation foci to motion‐stimuli in the group random‐effects analysis
| Anatomical structure | cluster‐size (voxels) | FDR‐corrected P‐value | Hemisphere | Maximum F‐value | MNI coordinates (x,y,z) | ||
|---|---|---|---|---|---|---|---|
| ACC | 143 | <0.01 | L | 15.13 | −10 | 40 | 32 |
| 274 | <0.01 | R | 18.10 | 4 | 38 | 38 | |
| Cuneus | 213 | <0.001 | L | 32.20 | −10 | −78 | 2 |
| 231 | <0.001 | R | 36.66 | 16 | −76 | 4 | |
| Dorsolateral PFC | 96 | <0.005 | L | 22.86 | −42 | 10 | 30 |
| 185 | <0.005 | R | 22.89 | 42 | 4 | 30 | |
| FEF | 148 | <0.001 | L | 38.60 | −48 | −4 | 58 |
| 173 | <0.001 | R | 27.12 | 36 | −4 | 54 | |
| FG | 476 | <0.001 | L | 92.21 | −44 | −70 | −4 |
| 498 | <0.001 | R | 95.33 | 34 | −76 | −2 | |
| fIPS | 36 | <0.005 | L | 24.64 | −24 | −70 | 42 |
| 215 | <0.001 | R | 32.14 | 26 | −72 | 42 | |
| hMT | 512 | <0.001 | L | 261.33 | −42 | −74 | 22 |
| 514 | <0.001 | R | 437.43 | 42 | −68 | 18 | |
| Inferior frontal gyrus | 229 | <0.001 | L | 38.24 | −48 | 40 | 10 |
| Lateral parietal cortex | 283 | <0.001 | L | 28.55 | −38 | −66 | 54 |
| 178 | <0.001 | R | 29.78 | 52 | −70 | 40 | |
| SFG | 102 | <0.01 | L | 17.45 | −14 | 36 | 52 |
| 265 | <0.001 | R | 34.60 | 16 | 22 | 60 | |
| SMA | 156 | <0.005 | L | 24.43 | −10 | 12 | 44 |
| 71 | <0.001 | R | 26.56 | 8 | 14 | 52 | |
| SMG | 229 | <0.001 | L | 35.61 | −54 | −30 | 26 |
| 311 | <0.001 | R | 56.35 | 50 | −26 | 28 | |
| SPL | 143 | <0.001 | L | 38.75 | −22 | −38 | 70 |
| 397 | <0.001 | R | 84.34 | 22 | −40 | 72 | |
| Thalamus | 240 | <0.001 | L | 32.93 | −10 | −14 | 2 |
| 158 | <0.001 | R | 39.86 | 16 | −14 | 6 | |
| V3a | 439 | <0.001 | L | 73.46 | −10 | −90 | 30 |
| 417 | <0.001 | R | 62.74 | 10 | −90 | 26 | |
FDR‐corrected cluster P‐value <0.01; extent threshold k = 25; distance for main submaxima > 16 mm.
Abbreviations: ACC, anterior cingulate cortex; FEF, frontal eye field; FG, fusiform gyrus; fIPS, fundus of the intraparietal sulcus; PFC, prefrontal cortex; SFG, superior frontal gyrus; SMA, supplementary motor area; SMG, supramarginal gyrus; SPL, superior parietal lobe; hMT, human analogue of the middle temporal area.
Table II.
MNI‐coordinates of the regions of interest (ROIs)
| MNI coordinates (left hemisphere) | MNI coordinates (right hemisphere) | |||||
|---|---|---|---|---|---|---|
| x | y | z | x | y | z | |
| ACC | −10± 4 | 40 ± 4 | 32 ± 4 | 4 ± 4 | 38 ± 4 | 38 ± 4 |
| fIPS | −24 ± 4 | −70 ± 6 | 39 ± 5 | 27 ± 5 | −72 ± 6 | 38 ± 6 |
| hMT | −43 ± 5 | −73 ± 5 | 21 ± 5 | 45 ± 5 | −71 ± 7 | 15 ± 5 |
| Lateral parietal | −46 ± 4 | −66 ± 4 | 52 ± 4 | 46 ± 4 | −62 ± 4 | 42 ± 4 |
| SFG | −14 ± 4 | 36 ± 4 | 52 ± 4 | 16 ± 4 | 22 ± 4 | 60 ± 4 |
| SPL | −22 ± 4 | −38 ± 4 | 70 ± 4 | 22 ± 4 | −40 ± 4 | 72 ± 4 |
| Thalamus | −10 ± 4 | −15 ± 7 | 3 ± 5 | 15 ± 3 | −15 ± 3 | 2 ± 4 |
| V3a | −20 ± 4 | −82 ± 4 | 32 ± 4 | 12 ± 4 | −92 ± 4 | 24 ± 4 |
Abbreviations: ACC, anterior cingulated cortex; fIPS, fundus of the intraparietal sulcus; SFG, superior frontal gyrus; SPL, superior parietal lobe; hMT, human analogue of the middle temporal area.
RESULTS
Behavioral Results
Mean reaction times (mean ± standard error of the mean (SEM): 701 ± 46 ms) and the percentage of correct responses (mean ± SEM: 73.1% ± 6.3%) were separately submitted to a repeated‐measures ANOVA with the factor motion coherence (100, 85, and 70% coherence). These analyses revealed a significant main effect of motion coherence on the hit rate (F(2,22) = 8.7, P < 0.005) but not on the reaction times (F(2,22) = 1.6, P > 0.2), consistent with a speed‐accuracy trade‐off under increased perceptual demands (low coherence‐levels). The main effect of motion coherence on the percentage of correct responses resulted from a significantly higher hit rate on full coherent stimuli in comparison to 70% coherent motion (P < 0.01) and an almost significantly higher hit rate on 85% coherent stimuli in comparison to 70% coherent motion (P = 0.07).
fMRI Results
The effects of interest contrast from the 2 × 3 factorial ANOVA group analysis identified clusters of significant attention and/or coherency‐dependent activations in fronto‐parietal [anterior cingulated cortex (ACC), frontal eye field (FEF), lateral parietal cortex, superior parietal lobe (SPL), superior frontal gyrus (SFG), and supplementary motor area (SMA)], extrastriate visual [fusiform gyrus (FG), human analogue of the middle temporal area (hMT), fundus of the intraparietal sulcus (fIPS), and V3a] and thalamic regions (see Fig. 2 and Table I for MNI coordinates and F‐values). To directly assess the influence of feature‐based attention on the magnitude of neural modulations induced by stimuli of varying signal‐to‐noise characteristics (different coherence‐levels), a region of interest (ROI) analysis was performed within fronto‐parietal and extrastriate regions identified by the group analysis (see Table II for the corresponding MNI coordinates of the ROIs).
Figure 2.
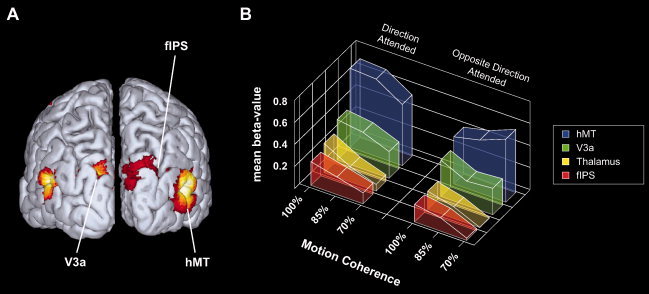
(A) Group random‐effects analysis showing regions more active during (non‐target) motion‐trials than during presentation of stationary dots. The activation map displays activations from the effects of interest F‐contrast from the 2 × 3 ANOVA group analysis. The threshold for significance was set at a (corrected) family‐wise error level of P < 0.05. (B) Attentional modulation of neural activations to visual motion coherence within extrastriate and thalamic regions. The mean beta values to each level of motion‐coherence are depicted for both attention conditions. Activity profiles are averaged over all subjects (n = 12) and both hemispheres for each ROI. Note that in contrast to all other regions, hMT displays an inverse linear relationship between motion‐coherence and the magnitude of the signal estimate for attended and unattended conditions. Abbreviations: fIPS, fundus of the intraparietal sulcus; hMT, human analogue of the middle temporal area.
Region of Interest Analyses
The ROI‐data were analyzed by a repeated measures ANOVA with the factors region (ACC, fIPS, lateral parietal cortex, SFG, SPL, thalamus, V3a, hMT), hemisphere (left vs. right), coherence (100, 85, and 70% coherence) and attention condition (direction attended vs. anti‐direction attended). This analysis showed significant main effects for the factors region (F(7,77) = 66.9, P < 0.001) and attention (F(1,11) = 6.1, P < 0.05), as well as a significant threeway (region × attention × coherence) interaction between factors (F(6,66) = 4.9, P < 0.005). Because neither a significant main effect, nor a significant interaction could be observed for the factor hemisphere, data were collapsed over hemispheres before further analysis. For direct comparison of attention‐ and coherence‐dependent effects the data for each ROI were separately subjected to repeated measures ANOVA with the factors attention condition and motion coherence.
These analyses revealed remarkable differences in the activation pattern between lower‐tier regions of the visual cortex (fIPS, thalamus, V3a, and hMT; see Fig. 2) and higher‐tier attentional control structures (ACC, lateral parietal cortex, SPL, and SFG; see Fig. 3). The intraparietal and thalamic ROIs showed a nearly linear relationship between the magnitude of the hemodynamic response and the coherence of the moving transparent surface. This was reflected by a significant main effect for the factor motion coherence (F(2,22) = 7.2, P < 0.005 for the fIPS and F(2,22) = 10.1, P < 0.001 for the thalamus) in absence of a main effect of attention or an interaction between both factors. For V3a the analysis of the ROI‐data showed no significant main effects or interactions for the factors attention and motion coherence. In contrast, hMT showed a significant main effect for the factor attention (F(1,11) = 28.9, P < 0.001) and a significant attention x motion coherence interaction (F(2,22) = 5.5, P < 0.05), which was due to an opposite near‐linear coherence‐dependency for the attended and unattended motion direction, respectively. When the direction of the moving transparent surface was attended, the hemodynamic modulation in hMT showed a positive linear relationship with motion coherence, while it was inversely correlated with the coherence of the stimuli when their motion direction had to be ignored (see Fig. 2B).
Figure 3.
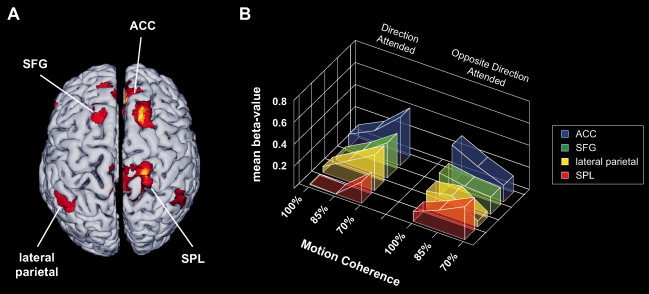
(A) Group random‐effects analysis showing regions more active during presentation of attended incoherent (70% coherence) than attended coherent (100% coherence) motion‐trials. The threshold for significance was set at a P < 0.001 (uncorrected). (B) Attentional modulation of neural activations to visual motion coherence within frontal and parietal attentional control structures. The mean beta values to each level of motion‐coherence are depicted for both attention conditions. Activity profiles are averaged over all subjects (n = 12) and both hemispheres for each ROI. Abbreviations: ACC, anterior cingulated cortex; SFG, superior frontal gyrus; SPL, superior parietal lobe.
Analyses of the ROI‐data from frontal and parietal attentional control regions revealed an entirely different pattern: the SPL showed main effects of attention (F(1,11) = 16.3, P < 0.005) and motion coherence (F(2,22) = 16.5, P < 0.001) but no attention x motion coherence interaction. The attentional main effect was due to higher modulations to unattended than attended stimulus motion, whereas the main effect of motion coherence was reflected by an inverse linear dependency of the modulation magnitude on the coherence of the stimuli irrespective of attention. In contrast, the ACC, the SFG and the lateral parietal ROIs showed no main effects for the factors attention and motion coherence but a significant interaction between both factors (F(2,22) = 24.1, P < 0.001 for the ACC; F(2,22) = 9.3 P < 0.001 for the SFG and F(2,22) = 4.5, P < 0.05 for the lateral parietal cortex). The hemodynamic modulations within these regions were opposed to the pattern observed for area hMT: when the direction was attended, the highest modulations occurred for the least coherent stimuli, while for stimuli moving opposed to the attended direction the magnitude of the modulation showed a positive linear relationship with stimulus‐coherence (see Fig. 3B). The pattern observed in fronto‐parietal areas is consistent with previous reports demonstrating higher activation magnitudes within attentional control regions [Culham et al.,2001; Jovicich et al.,2001; Lavie,2005] under conditions of increased perceptual demands (e.g., low coherence‐levels).
DISCUSSION
In the present study we manipulated the direction and the coherence of moving dots within a squared aperture under two different attention conditions, in which either the direction or the opposite direction of the stimulus was attended. This approach permitted us to investigate activity changes in motion responsive regions as a function of attention and motion coherence under identical physical stimulus properties. We found the hemodynamic activity within area hMT to be strongly and specifically modulated by the attended direction of motion and the coherence of the stimulus. Similar to the behavioral performance, the activity in hMT was positively correlated with the stimulus coherence when its direction was attended. Importantly, when the opposite direction was attended we observed a relative suppression of the response, with a reversed relationship in which the hMT activation was inversely correlated with stimulus coherence. Strikingly, out of all activated areas, hMT was the only to exhibit such a specific pattern of responses.
In agreement with neurophysiological investigations in primates, previous fMRI studies in humans have also demonstrated feature‐based attentional modulations in hMT. These modulations were observed when a moving transparent surface was attended as opposed to an overlapping stationary stimulus [O'Craven et al.,1997], or even in absence of direct visual stimulation [Chawla et al.,1999]. Furthermore, feature‐based attention can spread to moving stimuli outside the focus of spatial attention if they match the attended feature [Saenz et al.,2002]. These neuroimaging studies have repeatedly demonstrated attention‐related changes of activity in area hMT; nevertheless none of the studies specifically investigated attentional modulations as a function of individual changes within a single feature dimension. To date, with the exception of two studies that employed classifiers [Kamitani and Tong,2006; Serences and Boynton,2007], fMRI studies have failed to show direction selectivity, a hallmark of MT neurons in neurophysiological measurements. The most plausible explanation is that the native responses of hMT neurons to different motion‐directions are too small in view of the spatial and temporal resolution of the employed methods. The two recent fMRI studies that used pattern‐classification algorithms could show that attention influences direction‐selective activity within multiple stages of the visual cortex [Kamitani and Tong,2006; Serences and Boynton,2007]. The interpretation of these results, however, requires some caution because the neural processes underlying classification accuracy are not entirely understood [Bartels et al.,2008]. It has to be kept in mind that although direction‐selective information could be decoded from multiple stages throughout the visual hierarchy, the results do not necessarily imply the existence of direction‐selective neuronal populations within all of these visual areas [Serences and Boynton,2007]. The response profile across a population within a given voxel could also reflect feedback activity from higher order visual areas [Sillito et al.,2006] instead of true direction‐selective population‐responses within a particular region.
The results of the present study are consistent with current theories on feature‐based attention like the “feature‐similarity gain” [Martinez‐Trujillo and Treue,2004] model. This model posits that attention modulates an individual neuron's response according to the similarity between a currently attended feature and the feature‐preference of that neuron. This multiplicative attentional modulation has in fact been demonstrated using single‐cell recordings in non‐human primates [Martinez‐Trujillo and Treue,2004; Treue and Martinez Trujillo,1999] and may as recently shown vary in dependence of the contrast of the presented stimuli [Khayat et al.,2010a]. It is important to note that such feature‐based attentional modulations in the motion‐domain have recently been also demonstrated using recordings of LFP power in the γ‐band [Khayat et al.,2010b], suggestive of an improved selectivity for the attended feature also at the population‐level. Our results strongly support this notion by demonstrating that feature‐based attention enhances direction‐selective responses within cortical area hMT as assessed by fMRI. Notably, responses to stimuli in the attended direction are enhanced while those to stimuli in the opposite direction are suppressed (see Fig. 2). In this way the difference between a stimulus in the attended and a stimulus in the opposite direction is much higher than the native hMT responses to such stimuli when no direction is specifically attended. As a consequence of the multiplicative attentional modulation the direction selectivity in hMT becomes observable not only with pattern classifiers but also with classical analysis approaches. Moreover our results emphasize the notion that the integration of these direction‐selective responses (multiplicatively scaled by feature‐based attention) occurs in cortical area hMT in dependence of the signal‐to‐noise characteristics of the presented stimuli, thereby enhancing their neural representations according to the current perceptual goal of the observer.
In contrast to hMT, the area V3a displayed a robust response to the stimulation that did not vary much as a function of attention or stimulus coherence. This at first glance surprising result is most likely due to the task of attending a specific motion direction and to the less prevalent direction sensitivity of this area [Galletti et al.,1990; Gaska et al.,1988; Vanduffel et al.,2001; Zeki,1978]. Most of the studies that found strong attentional modulations in area V3a have either employed spatial attention [Tootell et al.,1997] or directed attention to global motion [Buchel et al.,1998; Chawla et al.,1999]. An earlier study did also report coherence‐dependent modulations in V3a [Rees et al.,2000]. However, the coherence‐dependency reported there followed a nonlinear U‐shaped function, which for high coherence‐levels was only determined by virtue of two measuring points at 100 and 50% coherence. The stimulus material employed in the current study only encompassed a range of 70–100% motion coherence. Therefore, it is most likely that the previously observed second‐order coherence‐dependency is more pronounced at lower coherence levels. The previous studies that used full coherent stimuli are well in line with the current results. Directing feature‐based attention to a specific motion direction under full coherence conditions elicits either small [Stoppel et al.,2007] or no modulations at all in area V3a [Schoenfeld et al.,2003,2007].
We also observed coherence‐dependent activations of the fIPS and the thalamus that did not vary as a function of attention. This does not necessarily mean that these areas are not at all under the influence of feature‐based attention. It is rather plausible that attention‐related modulations were relatively small, and therefore not detected by our analysis. Importantly, the activity in these regions varied as a function of stimulus coherence with higher values for higher coherence levels, indexing the involvement of these areas in the qualitative processing of motion. In contrast to the activation pattern observed in hMT, hemodynamic activity in the fIPS and thalamus was positively correlated with motion‐coherence for movements both into the attended and the unattended direction. Previous fMRI studies have shown that moving stimuli robustly activate the IPS [Liu et al.,2003; Shulman et al.,1999], and a recent single‐unit study demonstrated that the majority of IPS neurons display direction‐selective tuning [Fanini and Assad,2009]. Visual thalamic nuclei also encode direction‐selective information [Casanova et al.,2001; Kastner et al.,2006] and integrate the global motion‐direction of transparent surfaces composed of incoherently moving elements [Dumbrava et al.,2001]. Beyond this rough direction‐selectivity both regions are modulated by spatial attention [Corbetta and Shulman,2002; Kastner et al.,2006; Stoner et al.,2005; Van Essen,2005], but only sparse evidence suggests an involvement of these regions in feature‐based attentional selection [Liu et al.,2003; Schenkluhn et al.,2008; Vanduffel et al.,2000]. Our present data are in line with previous results, by showing that hemodynamic activity within the fIPS and the thalamus depend on the coherence of the motion signal, without being strongly modulated when attention is directed to an individual aspect of the feature motion such as its direction.
Numerous studies have revealed a positive linear correlation between motion coherence and the magnitude of evoked neural signals within extrastriate visual areas as assessed by single‐cell electrophysiology in monkeys [Britten et al.,1992; Newsome et al.,1989; Shadlen et al.,1996] as well as MEG [Aspell et al.,2005; Handel et al.,2007,2008; Siegel et al.,2007] and fMRI [Rees et al.,2000] in humans. The present data are fully consistent with these findings, by showing a linear relationship between the strength of the visual motion signal and hemodynamic modulations within the fIPS, hMT and—beyond previous reports—in bilateral thalamic regions. Importantly, the modulations of fIPS and the thalamus activity as a function of coherence were independent of the attended direction of motion. In contrast, the activity in area hMT was highly dependent on the attended direction of motion. While activity to attended stimuli was positively correlated with motion coherence, the inverse pattern (a negative correlation) was observed for stimuli moving into the unattended direction. This is a perfect match with the predictions from the feature‐similarity gain model, suggesting neural population‐responses to reflect changes in the signal‐to‐noise characteristics of the stimuli [Martinez‐Trujillo and Treue,2004]. In addition to the modulations within extrastriate visual cortex, activations were also observed within attentional control structures including the anterior cingulate, superior frontal, superior parietal and the lateral parietal cortex (see Fig. 3B). These regions exhibited an activation pattern different from the one observed within area hMT: hemodynamic activations correlated negatively with motion‐coherency when the motion‐direction of the stimulus was attended (all fronto‐parietal regions depicted in Fig. 3B) and the ACC also showed a positive correlation with motion‐coherence when the stimuli moved into the opposite direction (see Fig. 3B). From a signal detection point of view stimuli of lower coherence contain noise resulting in a higher ambiguity therefore requiring more attention to identify the prominent direction of movement. Within this framework, the patterns observed in superior frontal, superior parietal and lateral parietal cortex fit well to earlier observations that activity within attentional control structures varies as a function of the attentional requirements of the task [Culham et al.,2001; Jovicich et al.,2001; Lavie,2005]. Thereby endogenous signals about the subjects' current goals (e.g., the attended motion‐direction) are complemented with information about the current stimulus contingencies to provide optimal top‐down signals to bias the processing of appropriate stimulus features and locations in early visual regions [Corbetta et al.,2008]. Thus, increased processing resources (e.g., through modulation of superior frontal, superior parietal, and lateral parietal activity) are recruited when stimulus‐ambiguity is high. However, the pattern of hemodynamic activity within the ACC only is compatible with this notion if the motion‐direction of the stimulus was attended, while it displayed an inverse relationship when the stimulus moved into the opposite direction (see Fig. 3B). It has to be kept in mind that the appearance of an opposite movement when attending a certain movement direction represents a perceptual conflict. The observed pattern of activation within the ACC is consistent with its role in the detection of perceptual conflicts [Weissman et al.,2003,2005; Zimmer et al.,2010] and provides evidence for the interplay between higher‐tier regions and perceptual lower‐tier regions during top‐down attention.
In conclusion, the present results demonstrate that feature‐based attention modulates hemodynamic activity within hMT in a direction‐selective manner. These attentional modulations and the corresponding behavioral performance were positively correlated with the coherence of the motion signal, whereas activity within the fIPS and the thalamus occurred irrespective of feature‐based attention. In contrast, attentional control regions displayed an activation pattern opposed to the one observed within hMT, matching the predictions drawn from a signal‐detection theory perspective. These results provide strong support for models of feature‐based attention [Martinez‐Trujillo and Treue,2004], suggesting that attention improves behavioral performance by modulation of direction‐selective population‐activity within cortical area hMT.
Acknowledgements
The authors thank Dr. Michael Scholz for technical advice.
REFERENCES
- Aspell JE, Tanskanen T, Hurlbert AC ( 2005): Neuromagnetic correlates of visual motion coherence. Eur J Neurosci 22: 2937–2945. [DOI] [PubMed] [Google Scholar]
- Bartels A, Logothetis NK, Moutoussis K ( 2008): fMRI and its interpretations: An illustration on directional selectivity in area V5/MT. Trends Neurosci 31: 444–453. [DOI] [PubMed] [Google Scholar]
- Brett M, Anton J‐L, Valabregue R, Poline J‐B ( 2002): Region of interest analysis using an SPM toolbox. 8th International Conference on Functional Mapping of the Human Brain. Sendai, Japan. [Google Scholar]
- Britten KH, Shadlen MN, Newsome WT, Movshon JA ( 1992): The analysis of visual motion: A comparison of neuronal and psychophysical performance. J Neurosci 12: 4745–4765. [DOI] [PMC free article] [PubMed] [Google Scholar]
- Britten KH, Newsome WT, Shadlen MN, Celebrini S, Movshon JA ( 1996): A relationship between behavioral choice and the visual responses of neurons in macaque MT. Vis Neurosci 13: 87–100. [DOI] [PubMed] [Google Scholar]
- Buchel C, Josephs O, Rees G, Turner R, Frith CD, Friston KJ ( 1998): The functional anatomy of attention to visual motion. A functional MRI study. Brain 121 ( Part 7): 1281–1294. [DOI] [PubMed] [Google Scholar]
- Casanova C, Merabet L, Desautels A, Minville K ( 2001): Higher‐order motion processing in the pulvinar. Prog Brain Res 134: 71–82. [DOI] [PubMed] [Google Scholar]
- Chawla D, Rees G, Friston KJ ( 1999): The physiological basis of attentional modulation in extrastriate visual areas. Nat Neurosci 2: 671–676. [DOI] [PubMed] [Google Scholar]
- Cook EP, Maunsell JH ( 2002a): Attentional modulation of behavioral performance and neuronal responses in middle temporal and ventral intraparietal areas of macaque monkey. J Neurosci 22: 1994–2004. [DOI] [PMC free article] [PubMed] [Google Scholar]
- Cook EP, Maunsell JH ( 2002b): Dynamics of neuronal responses in macaque MT and VIP during motion detection. Nat Neurosci 5: 985–994. [DOI] [PubMed] [Google Scholar]
- Cook EP, Maunsell JH ( 2004): Attentional modulation of motion integration of individual neurons in the middle temporal visual area. J Neurosci 24: 7964–7977. [DOI] [PMC free article] [PubMed] [Google Scholar]
- Corbetta M, Shulman GL ( 2002): Control of goal‐directed and stimulus‐driven attention in the brain. Nat Rev Neurosci 3: 201–215. [DOI] [PubMed] [Google Scholar]
- Corbetta M, Patel G, Shulman GL ( 2008): The reorienting system of the human brain: From environment to theory of mind. Neuron 58: 306–324. [DOI] [PMC free article] [PubMed] [Google Scholar]
- Culham JC, Cavanagh P, Kanwisher NG ( 2001): Attention response functions: Characterizing brain areas using fMRI activation during parametric variations of attentional load. Neuron 32: 737–745. [DOI] [PubMed] [Google Scholar]
- Dumbrava D, Faubert J, Casanova C ( 2001): Global motion integration in the cat's lateral posterior‐pulvinar complex. Eur J Neurosci 13: 2218–2226. [DOI] [PubMed] [Google Scholar]
- Fanini A, Assad JA ( 2009): Direction selectivity of neurons in the macaque lateral intraparietal area. J Neurophysiol 101: 289–305. [DOI] [PMC free article] [PubMed] [Google Scholar]
- Galletti C, Battaglini PP, Fattori P ( 1990): “Real‐motion” cells in area V3A of macaque visual cortex. Exp Brain Res 82: 67–76. [DOI] [PubMed] [Google Scholar]
- Gaska JP, Jacobson LD, Pollen DA ( 1988): Spatial and temporal frequency selectivity of neurons in visual cortical area V3A of the macaque monkey. Vis Res 28: 1179–1191. [DOI] [PubMed] [Google Scholar]
- Handel B, Lutzenberger W, Thier P, Haarmeier T ( 2007): Opposite dependencies on visual motion coherence in human area MT+ and early visual cortex. Cereb Cortex 17: 1542–1549. [DOI] [PubMed] [Google Scholar]
- Handel B, Lutzenberger W, Thier P, Haarmeier T ( 2008): Selective attention increases the dependency of cortical responses on visual motion coherence in man. Cereb Cortex 18: 2902–2908. [DOI] [PubMed] [Google Scholar]
- Hinrichs H, Scholz M, Tempelmann C, Woldorff MG, Dale AM, Heinze HJ ( 2000): Deconvolution of event‐related fMRI responses in fast‐rate experimental designs: Tracking amplitude variations. J Cogn Neurosci 12 ( Suppl 2): 76–89. [DOI] [PubMed] [Google Scholar]
- Jovicich J, Peters RJ, Koch C, Braun J, Chang L, Ernst T ( 2001): Brain areas specific for attentional load in a motion‐tracking task. J Cogn Neurosci 13: 1048–1058. [DOI] [PubMed] [Google Scholar]
- Kamitani Y, Tong F ( 2006): Decoding seen and attended motion directions from activity in the human visual cortex. Curr Biol 16: 1096–1102. [DOI] [PMC free article] [PubMed] [Google Scholar]
- Kastner S, Schneider KA, Wunderlich K ( 2006): Beyond a relay nucleus: Neuroimaging views on the human LGN. Prog Brain Res 155: 125–143. [DOI] [PubMed] [Google Scholar]
- Khayat PS, Niebergall R, Martinez‐Trujillo JC ( 2010a): Attention differentially modulates similar neuronal responses evoked by varying contrast and direction stimuli in area MT. J Neurosci 30: 2188–2197. [DOI] [PMC free article] [PubMed] [Google Scholar]
- Khayat PS, Niebergall R, Martinez‐Trujillo JC ( 2010b): Frequency‐dependent attentional modulation of local field potential signals in macaque area MT. J Neurosci 30: 7037–7048. [DOI] [PMC free article] [PubMed] [Google Scholar]
- Lavie N ( 2005): Distracted and confused?: Selective attention under load. Trends Cogn Sci 9: 75–82. [DOI] [PubMed] [Google Scholar]
- Liu T, Slotnick SD, Serences JT, Yantis S ( 2003): Cortical mechanisms of feature‐based attentional control. Cereb Cortex 13: 1334–1343. [DOI] [PubMed] [Google Scholar]
- Martinez‐Trujillo J, Treue S ( 2002): Attentional modulation strength in cortical area MT depends on stimulus contrast. Neuron 35: 365–370. [DOI] [PubMed] [Google Scholar]
- Martinez‐Trujillo JC, Treue S ( 2004): Feature‐based attention increases the selectivity of population responses in primate visual cortex. Curr Biol 14: 744–751. [DOI] [PubMed] [Google Scholar]
- Moulden B, Kingdom F, Gatley LF ( 1990): The standard deviation of luminance as a metric for contrast in random‐dot images. Perception 19: 79–101. [DOI] [PubMed] [Google Scholar]
- Nakamura H, Kashii S, Nagamine T, Matsui Y, Hashimoto T, Honda Y, Shibasaki H ( 2003): Human V5 demonstrated by magnetoencephalography using random dot kinematograms of different coherence levels. Neurosci Res 46: 423–433. [DOI] [PubMed] [Google Scholar]
- Newsome WT, Britten KH, Movshon JA ( 1989): Neuronal correlates of a perceptual decision. Nature 341: 52–54. [DOI] [PubMed] [Google Scholar]
- O'Craven KM, Rosen BR, Kwong KK, Treisman A, Savoy RL ( 1997): Voluntary attention modulates fMRI activity in human MT‐MST. Neuron 18: 591–598. [DOI] [PubMed] [Google Scholar]
- Rees G, Friston KJ, Koch C ( 2000): A direct quantitative relationship between the functional properties of human and macaque V5. Nat Neurosci 3: 716–723. [DOI] [PubMed] [Google Scholar]
- Saenz M, Buracas GT, Boynton GM ( 2002): Global effects of feature‐based attention in human visual cortex. Nat Neurosci 5: 631–632. [DOI] [PubMed] [Google Scholar]
- Schenkluhn B, Ruff CC, Heinen K, Chambers CD ( 2008): Parietal stimulation decouples spatial and feature‐based attention. J Neurosci 28: 11106–11110. [DOI] [PMC free article] [PubMed] [Google Scholar]
- Schoenfeld MA, Tempelmann C, Martinez A, Hopf JM, Sattler C, Heinze HJ, Hillyard SA ( 2003): Dynamics of feature binding during object‐selective attention. Proc Natl Acad Sci USA 100: 11806–11811. [DOI] [PMC free article] [PubMed] [Google Scholar]
- Schoenfeld MA, Hopf JM, Martinez A, Mai HM, Sattler C, Gasde A, Heinze HJ, Hillyard SA ( 2007): Spatio‐temporal analysis of feature‐based attention. Cereb Cortex 17: 2468–2477. [DOI] [PubMed] [Google Scholar]
- Serences JT, Boynton GM ( 2007): Feature‐based attentional modulations in the absence of direct visual stimulation. Neuron 55: 301–312. [DOI] [PubMed] [Google Scholar]
- Shadlen MN, Britten KH, Newsome WT, Movshon JA ( 1996): A computational analysis of the relationship between neuronal and behavioral responses to visual motion. J Neurosci 16: 1486–1510. [DOI] [PMC free article] [PubMed] [Google Scholar]
- Shulman GL, Ollinger JM, Akbudak E, Conturo TE, Snyder AZ, Petersen SE, Corbetta M ( 1999): Areas involved in encoding and applying directional expectations to moving objects. J Neurosci 19: 9480–9496. [DOI] [PMC free article] [PubMed] [Google Scholar]
- Siegel M, Donner TH, Oostenveld R, Fries P, Engel AK ( 2007): High‐frequency activity in human visual cortex is modulated by visual motion strength. Cereb Cortex 17: 732–741. [DOI] [PubMed] [Google Scholar]
- Sillito AM, Cudeiro J, Jones HE ( 2006): Always returning: Feedback and sensory processing in visual cortex and thalamus. Trends Neurosci 29: 307–316. [DOI] [PubMed] [Google Scholar]
- Stoner GR, Mitchell JF, Fallah M, Reynolds JH ( 2005): Interacting competitive selection in attention and binocular rivalry. Prog Brain Res 149: 227–234. [DOI] [PubMed] [Google Scholar]
- Stoppel CM, Boehler CN, Sabelhaus C, Heinze HJ, Hopf JM, Schoenfeld MA ( 2007): Neural mechanisms of spatial‐ and feature‐based attention: A quantitative analysis. Brain Res 1181: 51–60. [DOI] [PubMed] [Google Scholar]
- Tootell RB, Mendola JD, Hadjikhani NK, Ledden PJ, Liu AK, Reppas JB, Sereno MI, Dale AM ( 1997): Functional analysis of V3A and related areas in human visual cortex. J Neurosci 17: 7060–7078. [DOI] [PMC free article] [PubMed] [Google Scholar]
- Treue S, Martinez Trujillo JC ( 1999): Feature‐based attention influences motion processing gain in macaque visual cortex. Nature 399: 575–579. [DOI] [PubMed] [Google Scholar]
- Van Essen DC ( 2005): Corticocortical and thalamocortical information flow in the primate visual system. Prog Brain Res 149: 173–185. [DOI] [PubMed] [Google Scholar]
- Vanduffel W, Tootell RB, Orban GA ( 2000): Attention‐dependent suppression of metabolic activity in the early stages of the macaque visual system. Cereb Cortex 10: 109–126. [DOI] [PubMed] [Google Scholar]
- Vanduffel W, Fize D, Mandeville JB, Nelissen K, Van Hecke P, Rosen BR, Tootell RB, Orban GA ( 2001): Visual motion processing investigated using contrast agent‐enhanced fMRI in awake behaving monkeys. Neuron 32: 565–577. [DOI] [PubMed] [Google Scholar]
- Weissman DH, Giesbrecht B, Song AW, Mangun GR, Woldorff MG ( 2003): Conflict monitoring in the human anterior cingulate cortex during selective attention to global and local object features. Neuroimage 19: 1361–1368. [DOI] [PubMed] [Google Scholar]
- Weissman DH, Gopalakrishnan A, Hazlett CJ, Woldorff MG ( 2005): Dorsal anterior cingulate cortex resolves conflict from distracting stimuli by boosting attention toward relevant events. Cereb Cortex 15: 229–237. [DOI] [PubMed] [Google Scholar]
- Zeki SM ( 1978): The third visual complex of rhesus monkey prestriate cortex. J Physiol 277: 245–272. [DOI] [PMC free article] [PubMed] [Google Scholar]
- Zimmer U, Roberts KC, Harshbarger TB, Woldorff MG ( 2010): Multisensory conflict modulates the spread of visual attention across a multisensory object. Neuroimage 52: 606–616. [DOI] [PMC free article] [PubMed] [Google Scholar]