

Abstract
The dorsal premotor cortex (PMd) is thought to play a significant role in movement preparation cued by sensory information rather than in self‐initiated movements. The evidence in humans for this contention is still circumstantial. Here we explored the effects of modulation of PMd by excitability decreasing 1 Hz repetitive transcranial magnetic stimulation (rTMS) versus excitability increasing 5 Hz rTMS on two forms of movement related cortical potentials: contingent negative variation (CNV) versus Bereitschaftspotential (BP) reflecting externally cued versus self‐triggered movement preparation. Ten healthy right‐handed subjects performed visually cued or self‐triggered simple sequential finger movements with their right hand. CNV and BP were recorded by 25 EEG electrodes covering the fronto‐centro‐parietal cortex and divided into an early (1500–500 ms before a go‐signal or movement onset) and a late potential (500–0 ms). MRI‐navigated 1 Hz rTMS of the left PMd resulted in significant increase of the late CNV over the left central region predominantly contralateral to the prepared right hand movement, while 5 Hz rTMS had no effect on CNV. In contrast, 1 and 5 Hz rTMS did not modify BP. Control experiments of 1 Hz rTMS of the supplementary motor area (SMA) and of low‐intensity 1 Hz rTMS of the left primary motor cortex did not change CNV, but 1 Hz SMA‐rTMS increased late BP. This double dissociation of effects of PMd‐rTMS versus SMA‐rTMS on CNV versus BP provides direct evidence that the left PMd in humans is more involved in preparatory processes of externally cued rather than self‐initiated movements, contrasting with an opposite role of the SMA. Hum Brain Mapp 2012. © 2011 Wiley Periodicals, Inc.
Keywords: bereitschaftspotential, contingent negative variation, dorsal premotor cortex, supplementary motor area, preparation for movement, repetitive transcranial magnetic stimulation, human
INTRODUCTION
The dorsal premotor cortex (PMd) plays a pivotal role for selection, planning and execution of voluntary movements [Crammond and Kalaska2000; Rushworth, et al.2003; Wise1985; Wise, et al.1986]. Preparation of volitional movements is associated with activation in partially different neuronal networks depending on whether the movement is externally cued or self‐initiated. Although this distinction is by no means absolute, preparation of externally cued movements relies more strongly on neuronal activity in the PMd rather than in the supplementary motor area (SMA), while preparation of self‐initiated movements involves more strongly the SMA than the PMd [Jenkins, et al.2000; Kurata and Wise1988; Mushiake, et al.1991; Okano and Tanji1987].
In intact humans, preparatory cortical activity can be assessed non‐invasively by multi‐channel high resolution electroencephalography (EEG). The contingent negative variation (CNV) reflects neuronal activity during preparation of externally cued movements, while the Bereitschaftspotential (BP) reflects preparation of self‐initiated movements. The CNV is a slow negative cortical potential that occurs between two successive contingent stimuli, a warning stimulus followed by a response stimulus [Walter, et al.1964]. The CNV was divided into an early component (CNV1), which largely reflects sensory information of the warning stimulus, and a late component (CNV2), which mainly represents motor readiness and preparatory activity of the forthcoming motor response [Hamano, et al.1997; Rohrbaugh, et al.1976,1986]. In contrast, the BP is generated during self‐initiated movements without any external cueing. The premovement phase of the BP was also subdivided into two components: the early component (BP1) is closely related to preparatory aspects of the forthcoming movement such as motor intention, selection or preparatory set, whereas the late component (BP2) is particularly related to its executive aspects, such as amplitude, precision or complexity (for review, [Shibasaki and Hallett2006]). CNV2 and BP2 can be affected differentially in patients with cerebellar lesions and in patients with Parkinson's disease, suggesting at least partially dissociable subcortical generators [Ikeda, et al.1994,1997]. The cortical generators of CNV2 versus BP2 can be determined with sufficient precision only by using invasive recording methods such as subdural grid electrodes. There is only one study available that compared both movement related cortical potentials (MRCPs) directly in the same patients and found that CNV2 is predominantly generated in prefrontal cortex, including PMd, whereas BP2 is generated in SMA, primary motor cortex (M1) and primary somatosensory cortex [Hamano, et al.1997]. These findings are consistent with those of other subdural grid recordings that investigated either CNV2 [Ikeda, et al.1999] or BP2 [Ikeda, et al.1992; Neshige, et al.1988] in separate studies.
Repetitive transcranial magnetic stimulation (rTMS) is a safe and convenient technique to produce temporary perturbation of function of the stimulated cortex in humans (for review, [Pascual‐Leone, et al.1999]) and changes in excitability outlasting the rTMS train (for review, [Ziemann, et al.2008]). Low‐frequency 1 Hz rTMS of PMd produced long‐term suppression of corticospinal excitability [Gerschlager, et al.2001; Rizzo, et al.2004], while high‐frequency 5 Hz rTMS resulted in an increase [Rizzo, et al.2004] as measured by changes in motor evoked potential (MEP) amplitude.
Modulating effects of PMd stimulation on CNV or BP have been tested in only one study up to date, which demonstrated that excitability depressing continuous theta‐burst stimulation [Huang, et al.2005] had no effect on BP amplitude [Ortu, et al.2009]. In contrast, several studies revealed effects on volitional preparatory motor activity when M1 was stimulated: 1 Hz M1‐rTMS and continuous theta burst stimulation resulted in a topographically nonspecific BP reduction [Ortu, et al.2009; Rossi, et al.2000], 5 Hz M1‐rTMS led to local increase of CNV over the stimulated M1 [Holler, et al.2006] and excitability enhancing paired associative stimulation [Müller‐Dahlhaus, et al.2010] generated a local reduction of BP2 over the stimulated M1 [Lu, et al.2009]. As M1 is the common final executive stage for externally and internally generated motor commands these studies are not suitable to distinguish between the putatively different neuronal networks upstream from M1 that are involved in the preparation of externally cued versus self‐initiated movements. Here we sought to extend the previous findings by contrasting the effects of rTMS applied to the PMd on externally cued versus self‐triggered volitional preparatory motor activity. According to the view that neuronal activity in the PMd contributes more significantly to externally cued rather than self‐triggered movements [Wise1985; Wise, et al.1997], we hypothesized that PMd‐rTMS would modify CNV but not BP. In additional experiments, we also investigated the effects of SMA‐rTMS on CNV and BP. According to the hypothesized preferential involvement of the SMA in the preparation of self‐initiated rather than externally cued movements, we expected modification of BP but not CNV.
METHODS
Main Experiment
Subjects
Ten healthy subjects were recruited for this study (mean age ± SD, 27.9 ± 6.9 years; range, range, 21–39 years; 6 male). All 10 subjects participated in the CNV 1 Hz PMd‐rTMS protocol, 7 subjects (28.3 ± 8.0 years, 4 male) participated in the CNV 5 Hz PMd‐rTMS protocol, 9 subjects (28.4 ± 7.1 years, 5 male) in the BP 1 Hz PMd‐rTMS protocol, and 7 subjects (29.6 ± 7.7 years, 4 male) in the BP 5 Hz PMd‐rTMS protocol. Sessions in the same subject were separated by at least 3 days, and the order of sessions was pseudo‐randomized. All subjects were right‐handed according to the Edinburgh Handedness Inventory [Oldfield1971]. All gave their written informed consent prior to the study. The experimental procedures were in accord with the latest version of the Declaration of Helsinki and were approved by the local Ethics Committee of the medical faculty of the Goethe‐University of Frankfurt (reference number 98/00).
Experimental design
Subjects were seated on a comfortable chair with a test table in front of them. Heights of the chair and the table were adjusted individually to allow a relaxed placement of the subjects' pronated right forearm and hand on the table. Fingers II–V rested in an in‐house manufactured device to record motor reaction time and inter‐finger movement time (Fig. 1A). Button presses indicated index finger abduction (green button in Fig. 1A) or little finger abduction (yellow button in Fig. 1A) and triggered marker events in the EEG recording system, using Presentation Version 0.70 and NeuroScan® SynAmps, Neurosoft, Inc. (Sterling, VA).
Figure 1.
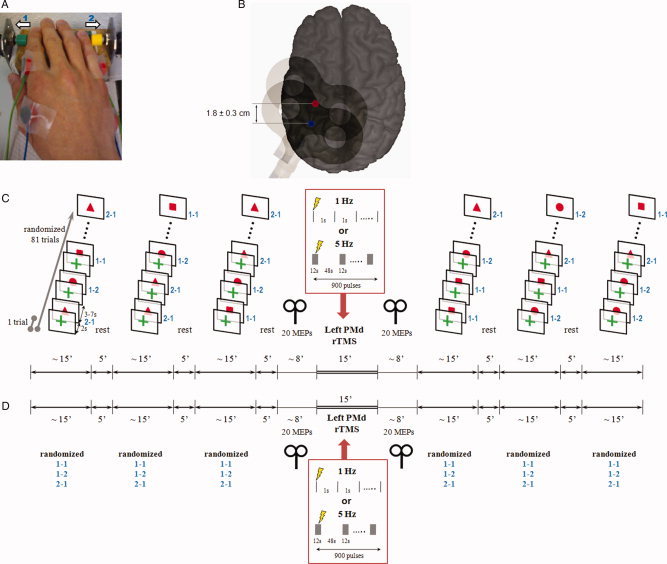
A: Right task hand of one subject resting in pronated position on the test table. Surface electromyography was recorded simultaneously from first dorsal interosseus (FDI) and abductor digiti minimi (ADM) muscles, the primary movers of index finger and little finger abductions, respectively. The in‐house manufactured device for recording button presses by index finger abduction (green button, 1) and little finger abduction (yellow button, 2) triggered automatic marker events in the EEG recording system. B: Sites of focal TMS (figure‐of‐eight coil indicated) over the hand area of the left primary motor cortex (M1, blue spot) and the left dorsal premotor cortex (PMd, red spot) shown on a 3D MRI reconstruction of one individual brain. The site of PMd stimulation was targeted by MR‐navigation (see Methods) and was located, on average, 1.8 ± 0.3 cm anterior of the M1 stimulation site. The M1 site was used for testing corticospinal excitability, the PMd site was used for application of rTMS (see below). C: Experimental protocol for the contingent negative variation (CNV) sessions. Subjects performed 3 × 81 CNV trials before and after left PMd‐rTMS (either 1 Hz or 5 Hz rTMS in separate sessions). Each CNV trial consisted of a warning stimulus (green cross) followed 2 s later by an imperative go‐signal (all signals presented on a screen in front of the subjects) instructing on the motor response to be performed (red square: index finger abduction repeated two times; red circle: index finger abduction followed by little finger abduction; red triangle: little finger abduction followed by index finger abduction). The order of go‐signal conditions was pseudo‐randomized. The interval from the go‐signal to the warning signal of the next trial varied between 3–7 s. Corticospinal excitability of the hand area of the left M1 was tested immediately before and after PMd‐rTMS by recording 20 MEPs in the resting FDI of the right‐hand. D: Experimental protocol for the Bereitschaftspotential (BP) sessions. This protocol were identical to the CNV protocol, except that the 2‐item right hand finger abduction task (same movement conditions as in the CNV trials) was performed self‐initiated without external cuing (∼1 trial every 7 s). The subjects had to select internally one of three motor conditions for the upcoming next trial and were instructed to randomize these conditions over the 3 × 81 trials before and after left PMd‐rTMS.
CNV protocol
Subjects were instructed to react as fast as possible to the visually imperative response signal (S2) two seconds after a warning signal (S1) with a two‐item finger movement sequence. Signals were shown at the center of a 14‐inch Extended Graphics Array (XGA) screen (Compaq Presario 1700) 60 cm away from the subjects' eyes on white background for 250 ms each (Fig. 1C). S1 did not contain cuing information on the type of the next movement and consisted of a green cross (length 2.5 cm, thickness 0.7 cm). S2 contained full information on the type of the next movement: the red square (side length 3 cm) instructed index finger abduction repeated two times, the red circle (diameter, 3.3 cm) index finger abduction followed by little finger abduction, and the red triangle (side length 3 cm) little finger abduction followed by index finger abduction. Two‐item finger movement sequences rather than single movements were chosen for the present CNV and BP experiments because they result in better expressed MRCPs [Kitamura, et al.1993; Simonetta, et al.1991]. One trial consisted of one S1 followed by one S2. Intervals from S2 of one trial to S1 of the next trial varied between 5, 7, and 9 s to limit anticipation of the next trial (Fig. 1C). The probability of occurrence of these three inter‐trial intervals was equal so that the mean inter‐trail interval in the CNV experiments was 7 s. Three blocks of 81 trials (randomized order of S2 conditions) separated by 5‐minute breaks were run before and another 3 blocks after PMd‐rTMS (Fig. 1C). Before the actual CNV recordings, subjects practiced for 5 min to familiarize with the task.
BP protocol
Subjects performed three blocks of 81 trials of the same 2‐item fingers movement sequences as in the CNV protocol before and after PMd‐rTMS (Fig. 1D). They were instructed to execute the 2‐item finger movements as fast as possible. However, in contrast to the CNV protocol, movements were not externally cued but were internally selected and self‐paced. Subjects were instructed to choose randomly one of the three 2‐item movement sequences for the upcoming trial, and to perform one movement sequence approximately every 7 s (Fig. 1D). The mean inter‐trial intervals were 7.90 ± 2.18 s (1 Hz PMd‐rTMS), 7.28 ± 1.61 s (5 Hz PMd‐rTMS), and 8.51 ± 2.06 s (1 Hz SMA‐rTMS, Control Experiment 2, see below). None of these mean intervals was significantly different from the mean inter‐trail interval of 7 s in the CNV experiments (all P > 0.05, one‐sample two‐sided t‐tests).
PMd‐rTMS
RTMS was applied through a figure‐of‐eight coil (diameter of each wing, 70 mm) while the EEG cap remained on the scalp with electrode leads disconnected from the EEG amplifiers. The coil was connected to a Magstim Rapid stimulator (The Magstim Company, Carmarthenshire, Wales, UK) with a biphasic current waveform. Positioning of the coil was accomplished by a frameless MR‐navigation system (TMS navigator, Localite GmbH, Sankt Augustin, Germany) using the 3D‐reconstructed T1‐weighted magnetic resonance image (MRI) of the individual's brain (Fig. 1B). First, the coil was held tangential to the cap‐on‐scalp over the hand area of the left M1, with the coil handle pointing backwards and ∼45° away from the midline, so that the initial phase of the induced current in the brain flowed from lateral‐posterior to medial‐anterior. The coil was placed at the site that resulted consistently in largest MEPs in the right first dorsal interosseus (FDI) muscle. This optimal site for M1 stimulation was typically over the hand knob of the precentral gyrus (blue dot in Fig. 1B). Active motor threshold (AMT) for the right FDI was determined to the nearest 1% of maximum stimulator output while the subjects maintained ∼10% of their maximal voluntary FDI contraction. AMT was defined as the minimum stimulus intensity sufficient to produce a MEP of = 200 μV in peak‐to‐peak amplitude in at least five out of 10 consecutive trials [Rossini, et al.1999]. For subsequent left PMd‐rTMS, the coil was shifted on average 1.8 ± 0.3 cm anterior so that the junction of the coil targeted the posterior‐most part of the middle frontal gyrus close to the caudal end of the superior prefrontal sulcus (red dot in Fig. 1B). This area is thought to correspond to the human PMd [Fink, et al.1997]. Two different rTMS frequencies were applied in separate sessions: 1 Hz PMd‐rTMS was delivered continuously for 15 min (900 pulses); in contrast, 5 Hz PMd‐rTMS was given in 15 trains of 12 s interrupted by inter‐train intervals of 48 s. Therefore, the two PMd‐rTMS protocols were matched for duration (15 min) and number of pulses (900, Fig. 1C,D). PMd‐rTMS intensity was set to 110% AMT because this intensity produced significant electrophysiological and behavioral effects in previous studies [Boyd and Linsdell2009; Terao, et al.2007]. Both PMd‐rTMS protocols are in accord with the recently revised TMS safety guidelines [Rossi, et al.2009]. Possible current spread to the adjacent left M1 was controlled for in “Control Experiment 3” (see below). Correct coil placement was monitored throughout by MR‐navigation.
Corticomotoneuronal excitability (MEP amplitude)
Corticomotoneuronal excitability was measured in the CNV and BP protocols by recording 20 MEPs with surface EMG (sEMG) from the resting FDI of the right hand immediately before and after PMd‐rTMS (Fig. 1C,D). Ag—AgCl electrodes were taped in a muscle‐tendon montage (Fig. 1A). SEMG signals were bandpass filtered (20 Hz − 2 k Hz; Counterpoint Mk2 Electromyograph; Dantec, Skovlunde, Denmark). A single‐pulse Magstim 200 magnetic stimulator with a monophasic current waveform connected to a figure‐of‐eight coil (diameter of each wing, 70 mm) was used for these measurements, with the coil handle pointing backwards and ∼45° away from the midline. Prior to PMd‐rTMS, TMS intensity was adjusted to produce MEPs of on average 1 mV in peak‐to‐peak amplitude (MEP1mV) in the FDI. The same intensity was used for the measurements after PMd‐rTMS. The inter‐trial interval varied randomly from 7.5 to 12.5 s to reduce anticipation of the next trial. EMG signals were digitized at a rate of 5 k Hz (CED Micro 1401; Cambridge Electronic Design, Cambridge, UK) and stored in a laboratory computer for offline analysis (Spike2 for Windows, Version 3.05, CED).
Recording of CNV and BP
Fifty‐six Ag—AgCl scalp electrodes were used for EEG recording (Fig. 2A). One electrode was placed below the left outer canthus to record the electrooculogram (EOG). Impedance of all electrodes was kept below 5 kΩ. All electrodes were referenced to linked earlobe electrodes. Raw signals were filtered with a bandpass of 0.05–70 Hz (NeuroScan® SynAmps, Neurosoft, Inc. (Sterling, VA), digitized at a rate of 2 k Hz and stored for offline analysis.
Figure 2.
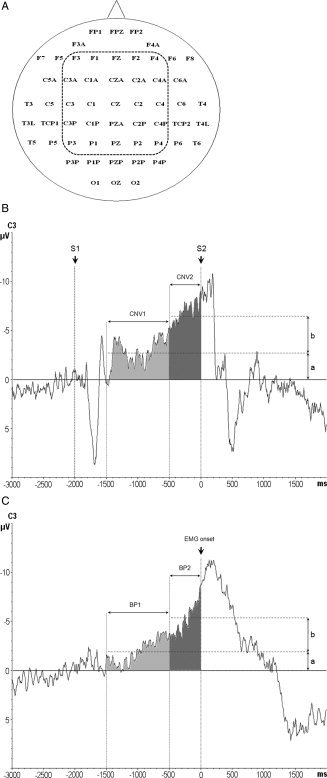
A: The 56 EEG recording electrodes (nomenclature according to the International 10–20 EEG system) and the 25 central electrodes of interest (enclosed by the dashed line) selected for the statistical analysis. B: CNV recordings from electrode C3. CNV1 was determined 1.500–500 ms prior to the go‐signal (S2, time 0 ms) as the mean amplitude of the CNV signal in this time window, indicated by the lower horizontal dashed line with amplitude a. CNV2 was measured 500–0 ms prior to S2, and calculated as the difference b of the mean amplitudes of CNV2 (indicated by the upper horizontal dashed line) minus CNV1. S1: warning signal (2.000 ms prior to S2). C: Representative Bereitschaftspotential (BP) recordings from electrode C3. BP1 was measured 1.500–500 ms prior to the onset of the volitional EMG burst (time 0 ms) of the first movement of the two‐item finger movement sequence as the mean amplitude of the BP signal in this time window, indicated by the lower horizontal dashed line with amplitude a. BP2 was measured 500–0 ms prior to sEMG onset, and calculated as the difference b of the mean amplitudes of BP2 (indicated by the upper horizontal dashed line) minus BP1.
Motor performance
Amplitude and kinematics of a movement may influence the MRCP [Shibasaki and Hallett2006]. Movement performance was assessed by sEMG recordings (simultaneous with the CNV or BP recordings) of the voluntary EMG burst in the right FDI and ADM during the index and little finger abductions, respectively, using the same electrodes as for the MEP recordings (Fig. 1A). The sEMG signals were single‐trial rectified, filtered at a bandpass of 30–200 Hz, digitized at a rate of 2 kHz and stored for offline analysis.
Data Analysis and Statistics
Corticomotoneuronal excitability (MEP amplitude)
Averages of MEP amplitude (in mV) were calculated in the right FDI of each subject from the 20 trials of each recording block before versus after PMd‐rTMS. Effects of PMd‐rTMS on MEP amplitude were analyzed by a two‐way repeated measures analysis of variance (rmANOVA) with the within‐subject factor of time (pre‐rTMS, post‐rTMS) and with the between‐subject factor of frequency (1 Hz, 5 Hz).
Motor performance
Performance of the motor task during the CNV and BP recordings was assessed by a quantitative analysis of the peak amplitude and the onset‐to‐peak time of the rectified sEMG bursts in the right FDI and ADM. Analysis was pooled for the three 2‐item movements because movement Condition had no effect on the MRCP results (see below). Therefore, a three‐way rmANOVA with the within‐subject factors of muscle (FDI, ADM) and time (pre‐rTMS, post‐rTMS) and the between‐subject factor of frequency (1 Hz, 5 Hz) was performed.
In addition, during the CNV recordings, reaction time (interval between S2 and the EMG burst onset in the primary mover of the first item of the 2‐item finger movement), the inter‐finger‐movement interval (IFMI) and the error rate were analyzed by two‐way rmANOVAs with the within‐subject factor of time (pre‐rTMS, post‐rTMS) and the between‐subject factor of frequency (1 Hz, 5 Hz).
CNV1 and CNV2 amplitude
EEG epochs were segmented from 3.000 ms prior to 2.000 ms after S2 onset (time, 0 ms). The mean EEG amplitude from 2.250–2.000 ms prior to S2 was assigned as offset of each epoch. EEG segments contaminated by blink artifacts in the EOG or muscle artifacts were discarded from further analysis. Artifact‐free EEG epochs were then averaged according to time (pre‐rTMS vs. post‐rTMS) and rTMS frequency (1 vs. 5 Hz). Two periods of the CNV were analyzed: CNV1 was determined 1.500–500 ms prior to S2 as the mean amplitude of the CNV signal (indicated by the lower horizontal dashed line with amplitude a in Fig. 2B). CNV2 was measured 500–0 ms prior to S2. The amplitude of the CNV2 (indicated by b in Fig. 2B) was calculated by subtracting the mean amplitude of CNV1 from the mean amplitude of CNV2 (indicated by the upper horizontal dashed line in Fig. 2B) to estimate PMd‐rTMS effects on CNV2 independent from those on CNV1.
Since the major CNV and BP activity localizes over the central scalp, statistical analysis was focused on the 25 central electrodes (Fig. 2A). CNV1 and CNV2 were analyzed separately, initially by four‐way rmANOVAs with the within‐subject factors of Movement Condition (2× index finger abduction, index finger abduction followed by little finger abduction, little finger abduction followed by index finger abduction), time (pre‐rTMS, post‐rTMS) and electrode (25 levels), and the between‐subject factor of frequency (1 Hz, 5 Hz). As neither movement condition nor its interactions revealed any significant effects, data were pooled across movement conditions and three‐wav rmANOVAs with the remaining effects of time, electrode and frequency were performed.
BP1 and BP2 amplitude
EEG epochs were segmented from 3.000 ms prior to 2.000 ms after the onset of the voluntary sEMG burst. The mean EEG amplitude of the period from 2.250–2.000 ms prior to sEMG burst onset served as the baseline of each epoch. After rejection of artifact‐contaminated trials, EEG epochs were averaged according to time (pre‐rTMS vs. post‐rTMS) and rTMS frequency (1 Hz vs. 5 Hz). The early BP was analyzed from 1.500–500 ms before sEMG burst onset (BP1; Fig. 2C) and the late BP from 500–0 ms before sEMG burst onset (BP2; Fig. 2C). The amplitudes of BP1 and BP2 (values “a” and “b”, respectively, in Fig. 2C) were analyzed the same way as those of CNV1 and CNV2, as described above.
Mapping of rTMS effects
Mean scalp voltage difference maps (post‐rTMS minus pre‐rTMS) were calculated at each of the 56 electrode positions separately for the two rTMS frequencies (1 Hz vs. 5 Hz) and MRCP measures (CNV1, CNV2, BP1, BP2) and plotted using Brain Vision Analyzer (Version 2.0.0.3031, Brain Products GmbH, Germany).
For all rmANOVAs, the Huynh‐Feldt correction was used to correct for non‐sphericity. Conditional on a significant F value, post‐hoc t tests were performed. A P‐value < 0.05 was considered significant. Data are reported as means ± SD if not stated otherwise.
Control Experiment 1
We were concerned about the topographical specificity of the 1 Hz PMd‐rTMS effects on CNV (cf. results of main experiment). The SMA proper was selected as rTMS control target area. We speculated that 1 Hz SMA‐rTMS should not result in significant effects on CNV because the SMA is involved predominantly in self‐initiated rather than sensory cued movements. The same subjects as in the 1 Hz PMd‐rTMS experiment were investigated. The SMA proper was targeted individually by the MR‐navigation system, and was located on average 3.6 ± 1.1 cm anterior to the vertex. RTMS intensity was set to 110% AMT of the right FDI determined over the hand area of the left M1. The figure‐of‐eight stimulating coil was held tangentially to the skull with the handle pointing to the left so that the biologically more effective second phase of the biphasic induced current in the brain was directed towards the left SMA.
Control Experiment 2
The findings of Control Experiment 1 demonstrated the expected absence of an effect of 1 Hz SMA‐rTMS on CNV amplitude (see results). Although the same coil orientation and rTMS intensity over SMA proper were effective in inducing significant long‐term change of M1 excitability in one previous study [Matsunaga, et al.2005], it remains a possibility that the null findings with respect to CNV amplitude in Control Experiment 1 merely reflect non‐effective SMA stimulation. Therefore, we conducted Control Experiment 2, in which we applied 1 Hz SMA‐rTMS the same way as in Control Experiment 1 in a subset of 6 subjects (27.0 ± 7.3 years; 3 male), but now recorded BP rather than CNV. The BP protocol was identical to the one in the main experiment. According to the main hypothesis outlined in the introduction, we expected to demonstrate effective SMA stimulation by obtaining a significant effect of 1 Hz SMA‐rTMS on BP amplitude.
Control Experiment 3
Finally, we were concerned that current spread from the left PMd to the left M1 might have been a significant source for the observed 1 Hz PMd‐rTMS effects on CNV2 (cf. Results). Therefore, a control experiment was added, in which the stimulating coil was centered over the optimal site of the hand area of the left M1 for eliciting MEPs in the right FDI. Six subjects (26.8 ± 7.1 years; 2 male) participated. Compared to the stimulus intensity of 110% AMT used in the PMd‐rTMS experiments, stimulus intensity of M1‐rTMS was reduced according to an earlier described procedure [Gerschlager, et al.2001]: First, AMTs were determined over PMd and M1 (always higher over PMd) with the Magstim Rapid stimulator. The percentage difference between the two values was calculated and used to reduce the intensity for rTMS over M1: (AMTM1/AMTPMd) × AMTM1 × 110%. For instance, if AMTM1 was 50% of maximum stimulator output and AMTPMd was 75% of maximum stimulator output, then the adjusted stimulus intensity for M1–rTMS was calculated as (50 / 75) * 50 * 110% = 37% of maximum stimulator output. For comparison, PMd‐rTMS in the main experiments would have been AMTM1 × 110% = 50 × 110% = 55% of maximum stimulator output. Apart from applying the lower intensity M1‐rTMS, experimental procedures and analyses of CNV1 and CNV2 were identical to the main experiment.
RESULTS
None of the subjects experienced any noticeable adverse effects during or after the study. All subjects were cooperative and alert throughout the experiments.
PMd‐rTMS (Main Experiment)
Corticomotoneuronal Excitability (MEP Amplitude)
CNV protocol
Mean MEP amplitudes for the 1 Hz PMd‐rTMS protocol were 1.05 ± 0.17 mV (pre‐rTMS) versus 0.95 ± 0.33 mV (post‐rTMS), and for the 5 Hz PMd‐rTMS protocol 1.02 ± 0.18 mV (pre‐rTMS) versus 0.88 ± 0.20 mV (post‐rTMS). The rmANOVA did not reveal any significant effects of time (F 1,15 = 2.56, P = 0.13) or frequency (F 1,15 = 0.31, P = 0.59) or their interaction (F 1,15 = 0.05, P = 0.83).
BP protocol
Mean MEP amplitudes for the 1 Hz PMd‐rTMS protocol were 0.99 ± 0.15 mV (pre‐rTMS) versus 0.80 ± 0.19 mV (post‐rTMS), and for the 5 Hz PMd‐rTMS protocol 0.96 ± 0.11 mV (pre‐rTMS) versus 0.97 ± 0.25 mV (post‐rTMS). The rmANOVA did not reveal any significant effects of time (F 1,14 = 2.65, P = 0.12) or frequency (F 1,14 = 0.81, P = 0.38) or their interaction (F 1,14 = 3.40, P = 0.09).
These are important null results because the observed PMd‐rTMS effects on CNV (see below) cannot be explained by changes in M1 excitability.
Motor performance
CNV protocol
RmANOVA revealed a significant main effect of time for the peak amplitude of the voluntary sEMG burst (F 1,15 = 15.3, P = 0.001), which was caused by a higher mean amplitude pre‐rTMS (158.9 ± 62.3 μV) compared to post‐rTMS (128.7 ± 53.6 μV, P = 0.001) (cf. grand averages of the voluntary sEMG bursts in Fig. 3A). The other main effects of muscle and rTMS frequency, and their interactions with time were all not significant (all P > 0.1). Therefore, the effect of time on sEMG burst peak amplitude is unspecific and may reflect a practice effect. RmANOVA did not reveal any significant effects for the onset‐to‐peak time of the sEMG burst (all P > 0.1). Additional rmANOVAs on the reaction time, the IFMI and the error rate did not show any significant main effects of time and frequency, or of their interaction (all P > 0.1).
Figure 3.
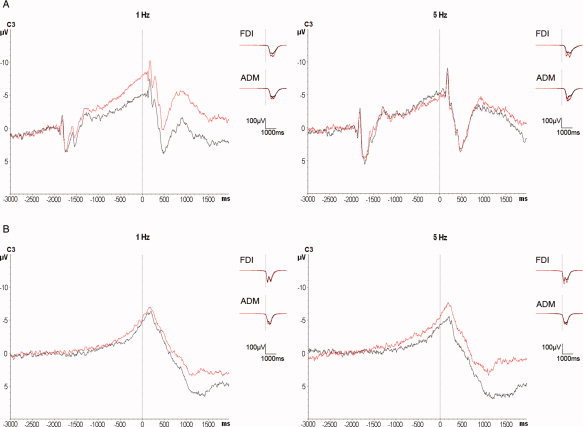
A: Superimposition of the grand averages of CNV before (black traces) and after (red traces) 1 Hz (n = 10 subjects, left panel) and 5 Hz left PMd‐rTMS (n = 7 subjects, right panel) at electrode C3. Note the significant increase of CNV2 after 1 Hz PMd‐rTMS while 5 Hz PMd‐rTMS had not effect. Grand averages of the surface EMG recordings from right FDI and right ADM (right part of each panel) show a nonspecific slight increase of the voluntary EMG burst amplitude after both PMd‐rTMS conditions. B: Superimposition of the grand averages of BP before (black traces) and after (red traces) 1 Hz (n = 9 subjects, left panel) and 5 Hz left PMd‐rTMS (n = 7 subjects, right panel) at electrode C3. There was no statistically significant difference of BP before versus after PMd‐rTMS for either rTMS frequency. Grand averages of the surface EMG recordings from the right FDI and right ADM show a non‐specific slight increase of the voluntary EMG burst amplitude after both PMd‐rTMS conditions.
BP protocol
RmANOVA of the peak amplitude of the voluntary sEMG burst showed a significant main effect of time (F 1,14 = 7.9, P = 0.014; post‐rTMS: 146.2 ± 78.6 μV, pre‐rTMS: 128.8 ± 68.3 μV; cf. grand averages of the voluntary sEMG bursts in Fig. 3B), but not of the other main effects of muscle and rTMS frequency, or any of their interactions with time (all P > 0.1). Similarly to the findings in the CNV protocol, the main effect of time is unspecific and most likely accounted for by a practice effect. In addition, rmANOVA of the onset‐to‐peak time of the voluntary sEMG burst showed a significant main effect of muscle (F 1,14 = 10.4, P = 0.0061; FDI: 248.6 ± 133.0 ms, ADM: 362.8 ± 92.7 ms) but no significances for the other main effects or any of their interactions (all P > 0.1). The effect of muscle was explained by the fact that self‐paced abductions of the little finger are naturally performed slower than those of the index finger.
CNV amplitude
Of the recorded EEG epochs, 75.1%, were artifact‐free and used for CNV analysis. RmANOVA of CNV1 showed a significant main effect of electrode position (F 24,360 = 5.77, P < 0.001; Table I) but no significances of the other main effects or their interactions. RmANOVA of CNV2 disclosed a significant main effect of electrode (F 24,360 = 4.08, P = 0.025), a significant interaction between time and frequency (F 1,15 = 8.92, P = 0.009), and a triple interaction of time, electrode and frequency (F 24,360 = 2.44, P = 0.023). The main effect of electrode reflects the typical distribution of CNV with predominant location over the central scalp (cf. Table II). The interaction between time and frequency was explained by an increase of the mean CNV2 after 1 Hz PMd‐rTMS (pre‐rTMS: −1.63 ± 1.54 μV versus post‐rTMS: −2.34 ± 1.46 μV, P = 0.005) but not after 5 Hz PMd‐rTMS (pre‐rTMS: −1.87 ± 1.75 μV versus post‐rTMS: −1.56 ± 1.41 μV, P = 0.35). The triple interaction was explored further by paired two‐tailed t‐tests at each of the electrodes and separately for the 1 Hz and 5 Hz conditions (Table II). This post hoc analysis revealed specific locations in predominantly right‐hemispheric frontal and predominantly left‐hemispheric central regions where CNV2 was significantly increased after 1 Hz PMd‐rTMS (Table II). In contrast, 5 Hz PMd‐rTMS had no effect on CNV2 at any of the analyzed electrodes. The left panel of Figure 3A shows the grand average CNV recordings of all subjects to demonstrate the 1 Hz PMd‐rTMS effects on CNV at electrode C3 (motor cortex region contralateral to the task hand).
Table I.
RmANOVA of the PMd‐rTMS effects on CNV and BP
| CNV1 | CNV2 | BP1 | BP2 | |||||||
|---|---|---|---|---|---|---|---|---|---|---|
| d.f. | F | P | F | P | d.f. | F | P | F | P | |
| Within‐subject factors | ||||||||||
| Timea | 1.15 | 1.72 | 0.21 | 1.33 | 0.27 | 1,14 | 2.25 | 0.16 | 3.01 | 0.10 |
| Electrodeb | 24.360 | 5.77 | <0.001 ** | 4.08 | 0.025 * | 24,336 | 3.33 | 0.016 * | 5.82 | 0.006 ** |
| Between‐subject factor | ||||||||||
| rTMS Frequencyc | 1.15 | 0.004 | 0.95 | 0.14 | 0.72 | 1.14 | 0.62 | 0.45 | 0.01 | 0.92 |
| Time × Electrode | 24.360 | 0.51 | 0.79 | 0.74 | 0.64 | 24.336 | 1.16 | 0.33 | 0.90 | 0.50 |
| Time × rTMS Frequency | 1.15 | 1.10 | 0.31 | 8.92 | 0.009 ** | 1.14 | 0.86 | 0.37 | 0.006 | 0.94 |
| Time × Electrode × rTMS Frequency | 24.360 | 0.33 | 0.91 | 2.44 | 0.023 * | 24.336 | 1.43 | 0.19 | 0.85 | 0.54 |
P < 0.05;
P < 0.01; d.f. degrees of freedom.
2 levels (pre‐rTMS and post‐rTMS).
25 levels (electrodes of interest, see Fig. 2A).
2 levels (1 Hz rTMS and 5 Hz rTMS).
Table II.
Mean amplitudes of CNV2 (in μV) at the electrodes of interest, divided by rTMS Frequency and Time
| 1 Hz Rtms | 5 Hz rTMS | |||
|---|---|---|---|---|
| Pre | Post | Pre | Post | |
| F3 | −0.72 ± 2.08 | −1.78 ± 2.05* | −1.30 ± 2.34 | −0.74 ± 2.09 |
| F1 | −0.55 ± 1.82 | −1.58 ± 1.93* | −1.55 ± 3.16 | −0.97 ± 2.42 |
| FZ | −0.63 ± 2.53 | −1.87 ± 2.90** | −1.43 ± 2.93 | −1.05 ± 2.35 |
| F2 | −0.37 ± 1.60 | −1.40 ± 1.70** | −1.44 ± 2.74 | −0.91 ± 2.27 |
| F4 | −0.42 ± 1.84 | −1.32 ± 1.68* | −1.48 ± 2.58 | −0.79 ± 2.31 |
| C3A | −1.98 ± 2.19 | −2.32 ± 1.59 | −1.86 ± 2.04 | −1.53 ± 2.14 |
| C1A | −1.81 ± 2.46 | −2.93 ± 2.13* | −2.52 ± 2.81 | −2.14 ± 2.39 |
| CZA | −1.40 ± 2.32 | −2.66 ± 2.61* | −2.43 ± 2.93 | −2.02 ± 2.84 |
| C2A | −1.49 ± 2.27 | −2.35 ± 2.03* | −1.89 ± 2.24 | −1.51 ± 1.72 |
| C4A | −1.35 ± 1.47 | −1.61 ± 1.10 | −1.54 ± 1.67 | −1.42 ± 1.93 |
| C3 | −2.34 ± 2.05 | −3.43 ± 2.41** | −2.52 ± 2.06 | −1.88 ± 1.47 |
| C1 | −2.42 ± 1.99 | −3.57 ± 2.25** | −2.63 ± 2.24 | −2.37 ± 1.75 |
| CZ | −2.31 ± 1.95 | −3.43 ± 2.18** | −2.52 ± 2.28 | −2.26 ± 1.74 |
| C2 | −1.78 ± 1.66 | −2.86 ± 2.18* | −2.54 ± 2.13 | −1.99 ± 1.71 |
| C4 | −2.24 ± 1.76 | −2.46 ± 1.56 | −2.34 ± 2.12 | −1.76 ± 1.52 |
| C3P | −2.40 ± 2.18 | −2.75 ± 1.73 | −1.85 ± 1.21 | −1.60 ± 1.07 |
| C1P | −2.25 ± 1.81 | −2.71 ± 1.54 | −2.00 ± 1.49 | −1.98 ± 1.48 |
| PZA | −2.33 ± 1.84 | −3.08 ± 1.96* | −2.23 ± 1.61 | −1.88 ± 1.33 |
| C2P | −1.84 ± 1.74 | −2.40 ± 1.56 | −2.00 ± 1.34 | −1.93 ± 0.98 |
| C4P | −1.76 ± 1.33 | −2.17 ± 1.39 | −1.99 ± 1.56 | −1.64 ± 0.86 |
| P3 | −1.13 ± 1.61 | −1.43 ± 1.30 | −0.80 ± 0.99 | −0.77 ± 1.05 |
| P1 | −1.78 ± 1.65 | −1.92 ± 1.43 | −1.21 ± 1.25 | −1.25 ± 1.25 |
| PZ | −2.20 ± 1.78 | −2.53 ± 1.37 | −1.66 ± 1.20 | −1.65 ± 0.98 |
| P2 | −1.84 ± 1.43 | −2.20 ± 1.36 | −1.61 ± 1.34 | −1.62 ± 1.01 |
| P4 | −1.42 ± 1.49 | −1.60 ± 1.29 | −1.28 ± 0.98 | −1.13 ± 0.75 |
P < 0.05,
P < 0.01 (paired two‐tailed t tests).
BP amplitude
87.7 % of the recorded EEG epochs were artifact‐free and used for analysis. RmANOVA of BP1 and BP2 revealed only a significance of the main effect of electrode (BP1: F 24,360 = 3.33, P = 0.016; BP2: F 24,360 = 5.82, P = 0.006; Table I) while none of the other main effects of time or rTMS frequency or any of their interactions was significant. These null results are reflected by the grand averages of the BP recordings in the 1 Hz and 5 Hz PMd‐rTMS experiments as shown for electrode C3 in Figure 3B.
Mapping of PMd‐rTMS effects
The topographic distributions of the CNV and BP scalp voltage changes induced by left PMd‐rTMS are shown in Figure 4. These plots illustrate the PMd‐rTMS induced increase in CNV2 but not any of the other measures (CNV1, BP1, or BP2), which was selective for rTMS frequency (only 1 Hz but not 5 Hz PMd‐rTMS was effective) and location (predominantly right‐hemispheric frontal ipsilateral to the task hand, and predominantly left‐hemispheric central electrodes contralateral to the task hand).
Figure 4.
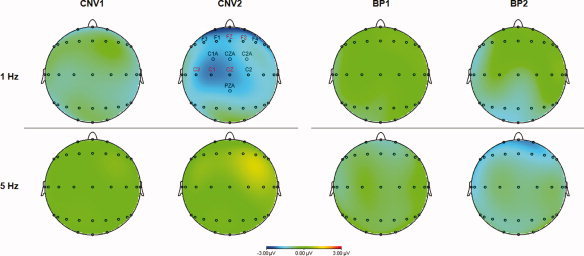
Scalp potential maps of the CNV and BP voltage change (post‐rTMS minus pre‐rTMS) induced by left PMd‐rTMS. Note the selective increase of the CNV2 negativity after 1 Hz PMd‐rTMS. The distribution of this voltage change was most prominent over the right frontal and left central scalp areas. Electrode positions with statistically significant voltage difference are labeled (black, P < 0.05; red, P < 0.01; paired‐sample two‐tailed t‐tests).
Control Experiment 1 (CNV 1 Hz SMA‐rTMS)
MEP amplitude
One Hertz SMA‐rTMS resulted in a significant reduction of MEP amplitude (t = 3.73, P = 0.005; pre‐rTMS: 1.11 ± 0.14 mV versus post‐rTMS: 0.87 ± 0.18 mV). This MEP decrease is in accord with a MEP increase after high‐frequency 5 Hz SMA‐rTMS reported in one previous study [Matsunaga, et al.2005], and indicates that the SMA was stimulated effectively.
Motor performance
RmANOVAs revealed no significant change in motor performance (amplitude and onset‐to‐peak time of the voluntary sEMG burst, reaction time, IFMI and error rate; all P > 0.05; cf. grand averages the voluntary sEMG bursts in Fig. 5A).
Figure 5.
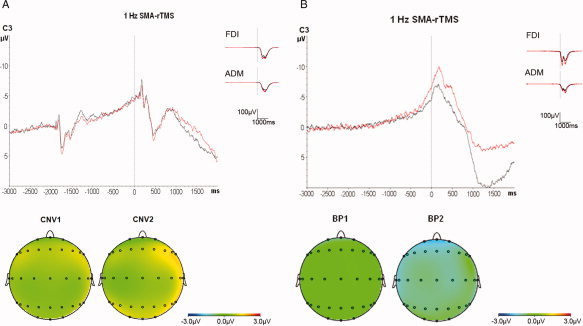
Superimposition of the grand averages of CNV (A, n = 10 subjects) and BP (B, n = 6 subjects) recorded from electrode C3 before (black traces) and after (red traces) 1 Hz SMA‐rTMS (top panels), and scalp potential maps of the CNV and BP (bottom panels). Note the absence of any change in CNV but a significant global increase in BP2 amplitude after 1 Hz SMA‐rTMS. Grand averages of the surface EMG recordings from the right FDI and right ADM show no significant change.
CNV amplitude
RmANOVA of CNV1 showed a significant effect of electrode (F 24,216 = 4.63, P < 0.001) but no effect of time (F 1,9 = 3.72, P = 0.09) or the interaction between electrode and time (F 24,216 = 0.78, P = 0.77). Similarly, rmANOVA of CNV2 revealed a significant effect of electrode (F 24,216 = 4.00, P < 0.001) but no effect of time (F 1,9 = 0.21, P = 0.66; CNV2 amplitude across all electrodes pre‐rTMS: −1.44 ± 1.58 μV versus post‐rTMS: −1.22 ± 1.45 μV) or its interaction with electrode (F 24,216 = 1.28, P = 0.18; cf. Table III and grand averages of CNV recordings at electrode C3 in Fig. 5A). These null results strongly suggest that 1 Hz SMA‐rTMS, in contrast to 1 Hz PMd‐rTMS (see above) does not affect CNV and, therefore, point to a topographically specific effect of PMd‐rTMS, consistent with our hypothesis formulated in the introduction.
Table III.
RmANOVA of the 1 Hz SMA‐rTMS effects on CNV and BP
| CNV1 | CNV2 | BP1 | BP2 | |||||||
|---|---|---|---|---|---|---|---|---|---|---|
| d.f. | F | P | F | P | d.f. | F | P | F | P | |
| Within‐subject factors | ||||||||||
| Timea | 1.9 | 3.72 | 0.09 | 0.21 | 0.66 | 1.5 | 1.35 | 0.30 | 20.47 | 0.0063 ** |
| Electrodeb | 24.216 | 4.63 | <0.001 ** | 4.00 | <0.001 ** | 24.120 | 3.32 | <0.001 ** | 9.03 | <0.001 ** |
| Time × Electrode | 24.216 | 0.78 | 0.77 | 1.28 | 0.18 | 24.120 | 0.52 | 0.97 | 0.47 | 0.98 |
P < 0.01; d.f. degrees of freedom.
2 levels (pre‐rTMS and post‐rTMS).
25 levels (electrodes of interest, see Fig. 2A).
Control Experiment 2 (BP 1 Hz SMA‐rTMS)
MEP amplitude
One Hertz SMA‐rTMS resulted in a significant reduction of MEP amplitude (t = 3.12, P = 0.026; pre‐rTMS: 1.01 ± 0.20 mV versus post‐rTMS: 0.71 ± 0.12 mV), consistent with Control Experiment 1, and indicative of effective SMA stimulation.
Motor performance
RmANOVA of the peak amplitude of the voluntary sEMG burst showed a significant main effect of muscle (F 1,5 = 18.23, P = 0.008; FDI: 150.1 ± 68.2 μV, ADM: 87.7 ± 51.1 μV) but not of the main effect of TIME or their interaction (all P > 0.05). Similarly as in the BP main experiment, the effect of muscle was explained by the fact that self‐paced abductions of the little finger are naturally performed weaker than those of the index finger. RmANOVA revealed no effect of time or muscle on the onset‐to‐peak time of the voluntary sEMG burst (all P > 0.05; cf. grand averages of the voluntary sEMG bursts in Fig. 5B).
BP amplitude
RmANOVA of BP1 showed a significant effect of electrode (F 24,120 = 3.32, P < 0.001) but no effect of time (F 1,5 = 1.35, P = 0.30) or the interaction between electrode and time (F 24,120 = 0.52, P = 0.97). In contrast, rmANOVA of BP2 revealed a significant effect of electrode (F 24,120 = 9.03, P < 0.001) and a significant effect of time (F 1,5 = 20.47, P = 0.0063; BP2 amplitude across all electrodes pre‐rTMS: −1.69 ± 1.84 μV versus post‐rTMS: −2.69 ± 1.53 μV), while the interaction of time with electrode was not significant (F 24,120 = 0.47, P = 0.98; Table III, and grand averages of BP recordings at electrode C3 in Fig. 5B). The observed increase in BP2 amplitude and the absence of any effect on CNV amplitude after 1 Hz SMA‐rTMS are strongly supportive of our hypothesis formulated in the introduction that neuronal activity in the SMA is more closely related to internally rather than externally triggered movements.
Control Experiment 3 (1 Hz M1‐rTMS of Adjusted Very Low Intensity)
MEP amplitude
Low intensity 1 Hz M1‐rTMS did not result in significant alterations of MEP amplitude.
Motor performance
RmANOVA revealed no effect of 1 Hz M1‐rTMS on motor performance (peak amplitude and onset‐to‐peak time of the voluntary sEMG burst, reaction time, IFMI and error rate; all P > 0.05).
CNV amplitude
RmANOVA of CNV1 showed a significant effect of electrode (F 24,120 = 2.97, P < 0.001) but no effect of time (F 1,5 = 0.50, P = 0.51) or the interaction between electrode and time (F 24,120 = 1.04, P = 0.43). Similarly, rmANOVA of CNV2 revealed a significant effect of electrode (F 24,120 = 3.48, P < 0.001) but no effect of time (F 1,5 = 0.13, P = 0.74; mean CNV2 amplitude over all electrodes pre‐rTMS: −2.39 ± 0.66 μV versus post‐rTMS: −2.26 ± 0.70 μV) or its interaction with electrode (F 24,120 = 1.47, P = 0.09; Fig. 6). These are important null findings which indicate that the increase of CNV2 after 1 Hz PMd‐rTMS observed in the main experiment cannot be explained by current spread to M1.
Figure 6.
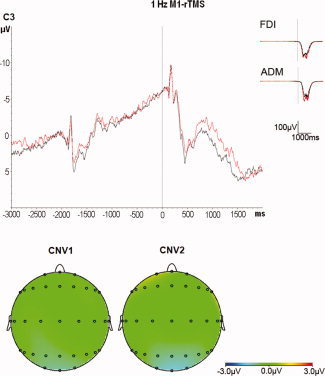
Superimposition of the grand averages of CNV recorded from electrode C3 before (black traces) and after (red traces) 1 Hz M1‐rTMS at low intensity (n = 6 subjects, top panel), and scalp potential maps of the CNV (bottom panel). Note the absence of any change in CNV after 1 Hz M1‐rTMS. Grand averages of the surface EMG recordings from the right FDI and right ADM show no significant change.
DISCUSSION
The main finding of this study is that rTMS of the left PMd modifies neuronal preparatory activity of externally cued movements indexed by CNV but not neuronal preparatory activity of self‐initiated movements indexed by BP. Although overlap between the neural circuits controlling externally versus internally cued movements certainly exists, the present findings strongly support the general view that the PMd is more significantly involved in the preparation of externally than internally cued movements [Chouinard and Paus2006; Wise1985; Wise, et al.1997]. The following paragraphs discuss in detail the observations of this study.
Modification of CNV2 but not CNV1
The CNV was divided into an early component (CNV1), which is thought to largely reflect sensory information of the warning stimulus, and a late component (CNV2), which represents motor readiness and preparatory activity of the forthcoming motor response [Hamano, et al.1997; Rohrbaugh, et al.1976,1986]. The neuronal generators of CNV1 and CNV2 are different: While CNV1 originates from a wider area of prefrontal cortex [Cui, et al.2000; Hamano, et al.1997; Matsumoto, et al.2003] the sources of CNV2 have been located into the PMd contralateral to the upcoming movement [Hultin, et al.1996; Ikeda, et al.1999; Matsumoto, et al.2003]. This topographical dissociation can explain why focal PMd‐rTMS affected selectively CNV2 in this study.
Sign of CNV2 Change After 1 Hz PMd‐rTMS
Why did excitability depressing 1 Hz PMd‐rTMS result in an increase of CNV2 amplitude? There are two parsimonious explanations. The first one posits that the putative decrease in excitability of PMd neurons required more volitional preparatory activity or compensatory activity in other parts of the network to maintain a constant motor performance, and that it is this additional activity, which is reflected by the increase in CNV2. The other possible and mutually nonexclusive explanation is that 1 Hz PMd‐rTMS resulted, in addition to a local decrease of neuronal excitability, in increased functional or effective connectivity within the neuronal network involved in externally cued movement preparation. Previous studies demonstrated such an increase in connectivity after 1 Hz rTMS of M1 [Lee, et al.2003; Rounis, et al.2005; Strens, et al.2002]. Even the same volitional preparatory neuronal activity would then result in a stronger EEG signal, that is, CNV2 amplitude, because an increased number of neurons in the network would be driven to firing action potentials when other connected neurons in the network are volitionally activated [Lu, et al.2009]. The present findings are apparently in contrast to three other rTMS studies which demonstrated a decrease of BP after excitability decreasing rTMS protocols [Ortu, et al.2009; Rossi, et al.2000] or an increase of CNV after excitability increasing 5 Hz rTMS [Holler, et al.2006], that is, in those studies the sign of movement related potential change was in the same direction as the sign of excitability change. However, those studies differ in two important aspects from the present study. First, simple rather than sequential finger movements were investigated. PMd is particularly involved in the preparation of externally cued sequential finger movements and this preparatory activity is correlated with the complexity of the movement sequence [Harrington, et al.2000]. Excitability decreasing 1 Hz rTMS or continuous theta burst stimulation of the left PMd does not alter the performance of visually cued selection of finger movements [O'Shea, et al.2007] or movement time of sequential finger movements [Stinear, et al.2009]. These null findings were explained by compensatory activity in the non‐stimulated right PMd [O'Shea, et al.2007] or an increase in excitability in the left M1 adjacent to the stimulated left PMd [Stinear, et al.2009], supporting the above notion that additional compensatory activity after 1 Hz PMd‐rTMS helped to maintain motor performance in the present experiments. The observed topographically specific increase of CNV2 over the left central and right frontal electrodes (Fig. 4) is consistent with compensatory activity in the left M1 and the right PMd, respectively. The other important difference is that M1 was stimulated in the previous studies [Holler, et al.2006; Ortu, et al.2009; Rossi, et al.2000], whereas PMd was stimulated in the present experiments. M1 and PMd differ substantially with regard to their anatomical connectivity: M1 largely connects to the non‐primary motor and somatosensory cortices while connections to higher order association cortices are sparse [Matelli and Luppino1997]. In contrast, PMd is part of a long‐range parieto‐frontal neuronal network that transforms sensory information into actions [Chouinard, et al.2003; Matelli and Luppino2000; Rizzolatti, et al.1998]. It is well possible that this more extensive connectivity of the PMd is a prerequisite for occurrence of effective compensatory activity in other nodes of the network, thus leading to an increase of the MRCP amplitude after excitability depressing perturbation while the limited connectivity of the M1 is not sufficient to provide this opportunity, resulting a decrease of the MRCP amplitude. Importantly, Control Experiment 3 excluded a significant contribution of current spread from PMd to M1 (Fig. 6) which is a precondition for this line of arguments. Control Experiment 3 does not rule out that M1‐rTMS at higher stimulation intensity may have resulted in significant change of CNV amplitude. This was indeed observed in one previous study but was limited topographically specifically to the stimulated M1 [Holler, et al.2006].
Why modification of CNV2 occurred by 1 Hz but not 5 Hz PMd‐rTMS can only be speculated upon. The dissociating effects of putatively excitability decreasing versus increasing PMd‐rTMS of the present study are in line with similar observations from previous studies [Stinear, et al.2009; Suppa, et al.2008]. First, the local changes in PMd excitability after 1 Hz versus 5 Hz PMd‐rTMS are unknown but may be different from those typically observed in M1 after M1‐rTMS. For instance, continuous versus intermittent theta burst stimulation, which produce excitability decreasing versus increasing effects in M1 [Huang, et al.2005] both produce excitability decreasing effects in PMd [Koch, et al.2007]. Therefore, one straightforward explanation for the lack of any 5 Hz PMd‐rTMS effect in the present experiments is that 5 Hz PMd‐rTMS did not induce significant change in local PMd excitability. Another possibility is that the putative local excitability increase and connectivity decrease induced by 5 Hz PMd‐rTMS [Rounis, et al.2005] were balanced and, therefore, did not lead to changes in CNV.
Modification of CNV2 but not BP2
The major finding of this study is the modification of CNV2 but not BP2 by 1 Hz PMd‐rTMS. It may be argued that BP is generally less sensitive to perturbation than CNV, but this is unlikely because several studies showed significant BP alteration after repetitive stimulation of M1 [Lu, et al.2009; Ortu, et al.2009; Rossi, et al.2000]. The absent effect of PMd‐rTMS on BP2 is in agreement with one previous study, which demonstrated a decrease of BP2 amplitude after corticospinal excitability depressing continuous theta burst stimulation of the left M1 but no effect on BP2 when the same stimulation was applied to the left PMd [Ortu, et al.2009]. In conjunction with the significant increase of CNV2 after 1 Hz PMd‐rTMS these findings strongly support the notion that PMd is more significantly involved in preparation of externally cued than self‐initiated movements.
This view is based on broad evidence from single cell recordings in monkeys that show that high portions of PMd cells are involved in visually instructed rather than self‐initiated movements [Mushiake, et al.1991], are active preceding the instructional cue signal, thus reflecting anticipation of the time and nature of this instruction [Mauritz and Wise1986], and, as so called motor set‐related cells, are coding information of an instructional cue before the go‐signal [di Pellegrino and Wise1993; Godschalk, et al.1985; Kurata and Wise1988; Weinrich and Wise1982; Wise and Mauritz1985]. Perturbing neuronal activity in the monkey PMd by injection of the GABAA receptor agonist muscimol results in specific behavioral deficits of direction errors of visually cued movements, directly proving the significance of neuronal activity in PMd for preparation of a forthcoming movement [Kurata and Hoffman1994]. Evidence in humans for a particular role of the PMd in externally cued movement preparation is, however, circumstantial and so far limited to mapping results in neuroimaging studies [Deiber, et al.1996; Grafton, et al.1998; Lee, et al.1999; Simon, et al.2002; Toni, et al.1999] and MRCP studies [Hamano, et al.1997; Ikeda, et al.1992,1999; Neshige, et al.1988]. The present study demonstrated that rTMS‐induced perturbation of neuronal activity in PMd modifies CNV2 but not BP2. It can be concluded that these findings provide, to the best of our knowledge for the first time in humans, a direct link between the left PMd and neuronal activity in preparation preferentially for externally cued rather than self‐initiated movements. This effect was topographically specific because perturbation of neuronal activity of the SMA did not result in modification of CNV2 (Control Experiment 1). In addition, Control Experiment 2 demonstrated that 1 Hz SMA‐rTMS increased BP2 amplitude. This double dissociation of modification of CNV2 but not BP2 by 1 Hz PMd‐rTMS (main experiment) versus modification of BP2 but not CNV2 by 1 Hz SMA‐rTMS (Control Experiments 1 and 2) completes supportive evidence for the notion outlined in the introduction that the SMA proper, in contrast to the left PMd, is preferentially involved in self‐initiated rather than externally cued movements.
PMd‐rTMS Effects on MEP Amplitude
Both, 1 Hz and 5 Hz PMd‐rTMS did not affect corticospinal excitability as measured by MEP amplitude in the FDI muscle. At first sight, this null finding is at variance with previous reports that demonstrated a MEP decrease after 1 Hz PMd‐rTMS [Chouinard, et al.2003; Gerschlager, et al.2001; Rizzo, et al.2004; Suppa, et al.2008] and a MEP increase after 5 Hz PMd‐rTMS [Rizzo, et al.2004]. An important difference between those studies and the present experiments is that only the present study required a significant amount of volitional motor activity before PMd‐rTMS (Fig. 1). Volitional motor activity prior to rTMS can significantly reduce the expression of rTMS‐induced change in corticospinal excitability [Gentner, et al.2008] and, thus, volitional motor activity may have prevented significant MEP change in the present experiments. Those studies that involved relevant volitional motor activity prior to PMd‐rTMS showed, on the other hand, rather inconsistent results with the expected MEP decrease after excitability decreasing PMd‐rTMS is some studies [O'Shea, et al.2007; Ortu, et al.2009] but a MEP increase in one other study [Stinear, et al.2009]. Therefore, the present results are not in contradiction with previous studies. It appears that direction and magnitude of modulation of corticospinal excitability after PMd‐rTMS depend on many details of the experimental protocol which renders a prediction of this effect difficult.
CONCLUSIONS
RTMS of the left PMd resulted in modification of CNV2 but not BP2. Control experiments showed that this effect was not caused by current spread to M1. Further control experiments showed that rTMS of the SMA proper resulted in a modification of BP2 but not CNV2. This double dissociation of PMd‐rTMS versus SMA‐rTMS effects on MRCP amplitudes provides direct evidence in support of the notion that neuronal activity of the left PMd in humans is preferentially involved in the preparation of externally cued movements rather than self‐initiated movements, contrasting with an opposite role of the SMA proper. The experiments exemplify that focal rTMS in combination with high resolution EEG recordings provide a powerful tool to explore the functional significance of neuronal activity in the human brain.
Acknowledgements
The authors wish to thank Mr. Robert Liao for his assistance in manufacturing the button press device used for reaction time recording and Dr. Patrick Jung for valuable data discussion. This study was supported in part by Taiwan Department of Health Clinical Trial and Research Center of Excellence (DOH100‐TD‐B‐111‐004).
REFERENCES
- Boyd LA, Linsdell MA ( 2009): Excitatory repetitive transcranial magnetic stimulation to left dorsal premotor cortex enhances motor consolidation of new skills. BMC Neurosci 10: 72. [DOI] [PMC free article] [PubMed] [Google Scholar]
- Chouinard PA, Paus T ( 2006): The primary motor and premotor areas of the human cerebral cortex. Neuroscientist 12: 143–152. [DOI] [PubMed] [Google Scholar]
- Chouinard PA, Van Der Werf YD, Leonard G, Paus T ( 2003): Modulating neural networks with transcranial magnetic stimulation applied over the dorsal premotor and primary motor cortices. J Neurophysiol 90: 1071–1083. [DOI] [PubMed] [Google Scholar]
- Crammond DJ, Kalaska JF ( 2000): Prior information in motor and premotor cortex: activity during the delay period and effect on pre‐movement activity. J Neurophysiol 84: 986–1005. [DOI] [PubMed] [Google Scholar]
- Cui RQ, Egkher A, Huter D, Lang W, Lindinger G, Deecke L ( 2000): High resolution spatiotemporal analysis of the contingent negative variation in simple or complex motor tasks and a non‐motor task. Clin Neurophysiol 111: 1847–1859. [DOI] [PubMed] [Google Scholar]
- Deiber MP, Ibanez V, Sadato N, Hallett M ( 1996): Cerebral structures participating in motor preparation in humans: a positron emission tomography study. J Neurophysiol 75: 233–247. [DOI] [PubMed] [Google Scholar]
- di Pellegrino G, Wise SP ( 1993): Visuospatial versus visuomotor activity in the premotor and prefrontal cortex of a primate. J Neurosci 13: 1227–1243. [DOI] [PMC free article] [PubMed] [Google Scholar]
- Fink GR, Frackowiak RS, Pietrzyk U, Passingham RE ( 1997): Multiple nonprimary motor areas in the human cortex. J Neurophysiol 77: 2164–2174. [DOI] [PubMed] [Google Scholar]
- Gentner R, Wankerl K, Reinsberger C, Zeller D, Classen J ( 2008): Depression of Human Corticospinal Excitability Induced by Magnetic Theta‐burst Stimulation: Evidence of Rapid Polarity‐Reversing Metaplasticity. Cereb Cortex 18: 2046–2053. [DOI] [PubMed] [Google Scholar]
- Gerschlager W, Siebner HR, Rothwell JC ( 2001): Decreased corticospinal excitability after subthreshold 1 Hz rTMS over lateral premotor cortex. Neurology 57: 449–455. [DOI] [PubMed] [Google Scholar]
- Godschalk M, Lemon RN, Kuypers HG, van der Steen J ( 1985): The involvement of monkey premotor cortex neurones in preparation of visually cued arm movements. Behav Brain Res 18: 143–157. [DOI] [PubMed] [Google Scholar]
- Grafton ST, Fagg AH, Arbib MA ( 1998): Dorsal premotor cortex and conditional movement selection: A PET functional mapping study. J Neurophysiol 79: 1092–1097. [DOI] [PubMed] [Google Scholar]
- Hamano T, Luders HO, Ikeda A, Collura TF, Comair YG, Shibasaki H ( 1997): The cortical generators of the contingent negative variation in humans: a study with subdural electrodes. Electroencephalogr Clin Neurophysiol 104: 257–268. [DOI] [PubMed] [Google Scholar]
- Harrington DL, Rao SM, Haaland KY, Bobholz JA, Mayer AR, Binderx JR, Cox RW ( 2000): Specialized neural systems underlying representations of sequential movements. J Cogn Neurosci 12: 56–77. [DOI] [PubMed] [Google Scholar]
- Holler I, Siebner HR, Cunnington R, Gerschlager W ( 2006): 5 Hz repetitive TMS increases anticipatory motor activity in the human cortex. Neurosci Lett 392: 221–225. [DOI] [PubMed] [Google Scholar]
- Huang Y‐Z, Edwards MJ, Rounis E, Bhatia KP, Rothwell JC ( 2005): Theta Burst Stimulation of the Human Motor Cortex. Neuron 45: 201–206. [DOI] [PubMed] [Google Scholar]
- Hultin L, Rossini P, Romani GL, Hogstedt P, Tecchio F, Pizzella V ( 1996): Neuromagnetic localization of the late component of the contingent negative variation. Electroencephalogr Clin Neurophysiol 98: 435–448. [DOI] [PubMed] [Google Scholar]
- Ikeda A, Luders HO, Burgess RC, Shibasaki H ( 1992): Movement‐related potentials recorded from supplementary motor area and primary motor area. Role of supplementary motor area in voluntary movements. Brain 115( Pt 4): 1017–1043. [DOI] [PubMed] [Google Scholar]
- Ikeda A, Shibasaki H, Nagamine T, Terada K, Kaji R, Fukuyama H, Kimura J ( 1994): Dissociation between contingent negative variation and Bereitschaftspotential in a patient with cerebellar efferent lesion. Electroencephalogr Clin Neurophysiol 90: 359–364. [DOI] [PubMed] [Google Scholar]
- Ikeda A, Shibasaki H, Kaji R, Terada K, Nagamine T, Honda M, Kimura J ( 1997): Dissociation between contingent negative variation (CNV) and Bereitschaftspotential (BP) in patients with parkinsonism. Electroencephalogr Clin Neurophysiol 102: 142–151. [DOI] [PubMed] [Google Scholar]
- Ikeda A, Yazawa S, Kunieda T, Ohara S, Terada K, Mikuni N, Nagamine T, Taki W, Kimura J, Shibasaki H ( 1999): Cognitive motor control in human pre‐supplementary motor area studied by subdural recording of discrimination/selection‐related potentials. Brain 122( Pt 5): 915–931. [DOI] [PubMed] [Google Scholar]
- Jenkins IH, Jahanshahi M, Jueptner M, Passingham RE, Brooks DJ ( 2000): Self‐initiated versus externally triggered movements. II. The effect of movement predictability on regional cerebral blood flow. Brain 123( Pt 6): 1216–1228. [DOI] [PubMed] [Google Scholar]
- Kitamura J, Shibasaki H, Takagi A, Nabeshima H, Yamaguchi A ( 1993): Enhanced negative slope of cortical potentials before sequential as compared with simultaneous extensions of two fingers. Electroencephalogr Clin Neurophysiol 86: 176–182. [DOI] [PubMed] [Google Scholar]
- Koch G, Franca M, Mochizuki H, Marconi B, Caltagirone C, Rothwell JC ( 2007): Interactions between pairs of transcranial magnetic stimuli over the human left dorsal premotor cortex differ from those seen in primary motor cortex. J Physiol 578( Pt 2): 551–562. [DOI] [PMC free article] [PubMed] [Google Scholar]
- Kurata K, Hoffman DS ( 1994): Differential effects of muscimol microinjection into dorsal and ventral aspects of the premotor cortex of monkeys. J Neurophysiol 71: 1151–1164. [DOI] [PubMed] [Google Scholar]
- Kurata K, Wise SP ( 1988): Premotor and supplementary motor cortex in rhesus monkeys: neuronal activity during externally‐ and internally‐instructed motor tasks. Exp Brain Res 72: 237–248. [DOI] [PubMed] [Google Scholar]
- Lee KM, Chang KH, Roh JK ( 1999): Subregions within the supplementary motor area activated at different stages of movement preparation and execution. Neuroimage 9: 117–123. [DOI] [PubMed] [Google Scholar]
- Lee L, Siebner HR, Rowe JB, Rizzo V, Rothwell JC, Frackowiak RS, Friston KJ ( 2003): Acute remapping within the motor system induced by low‐frequency repetitive transcranial magnetic stimulation. J Neurosci 23: 5308–5318. [DOI] [PMC free article] [PubMed] [Google Scholar]
- Lu MK, Bliem B, Jung P, Arai N, Tsai CH, Ziemann U ( 2009): Modulation of preparatory volitional motor cortical activity by paired associative transcranial magnetic stimulation. Hum Brain Mapp 30: 3645–3656. [DOI] [PMC free article] [PubMed] [Google Scholar]
- Matelli M, Luppino G ( 1997): Functional anatomy of human motor cortical areas In: Grafman J, Boller F, editors. Handbook of neuropsychology. Amsterdam: Elsevier; pp 9–26. [Google Scholar]
- Matelli M, Luppino G ( 2000): Parietofrontal circuits: parallel channels for sensory‐motor integrations. Adv Neurol 84: 51–61. [PubMed] [Google Scholar]
- Matsumoto R, Ikeda A, Ohara S, Matsuhashi M, Baba K, Yamane F, Hori T, Mihara T, Nagamine T, Shibasaki H ( 2003): Motor‐related functional subdivisions of human lateral premotor cortex: epicortical recording in conditional visuomotor task. Clin Neurophysiol 114: 1102–1115. [DOI] [PubMed] [Google Scholar]
- Matsunaga K, Maruyama A, Fujiwara T, Nakanishi R, Tsuji S, Rothwell JC ( 2005): Increased corticospinal excitability after 5 Hz rTMS over the human supplementary motor area. J Physiol 562( Pt 1): 295–306. [DOI] [PMC free article] [PubMed] [Google Scholar]
- Mauritz KH, Wise SP ( 1986): Premotor cortex of the rhesus monkey: neuronal activity in anticipation of predictable environmental events. Exp Brain Res 61: 229–244. [DOI] [PubMed] [Google Scholar]
- Müller‐Dahlhaus F, Ziemann U, Classen J ( 2010): Plasticity resembling spike‐timing dependent synaptic plasticity: the evidence in human cortex. Front Syn Neurosci 2: 1–11. [DOI] [PMC free article] [PubMed] [Google Scholar]
- Mushiake H, Inase M, Tanji J ( 1991): Neuronal activity in the primate premotor, supplementary, and precentral motor cortex during visually guided and internally determined sequential movements. J Neurophysiol 66: 705–718. [DOI] [PubMed] [Google Scholar]
- Neshige R, Lüders H, Shibasaki H ( 1988): Recording of movement‐related potentials from scalp and cortex in man. Brain 111( Pt 3): 719–736. [PubMed] [Google Scholar]
- Okano K, Tanji J ( 1987): Neuronal activities in the primate motor fields of the agranular frontal cortex preceding visually triggered and self‐paced movement. Exp Brain Res 66: 155–166. [DOI] [PubMed] [Google Scholar]
- Oldfield RC ( 1971): The assessment and analysis of handedness: the Edinburgh inventory. Neuropsychologia 9: 97–113. [DOI] [PubMed] [Google Scholar]
- Ortu E, Ruge D, Deriu F, Rothwell JC ( 2009): Theta Burst Stimulation over the human primary motor cortex modulates neural processes involved in movement preparation. Clin Neurophysiol 120: 1195–1203. [DOI] [PubMed] [Google Scholar]
- O'Shea J, Johansen‐Berg H, Trief D, Gobel S, Rushworth MF ( 2007): Functionally specific reorganization in human premotor cortex. Neuron 54: 479–490. [DOI] [PubMed] [Google Scholar]
- Pascual‐Leone A, Bartres‐Faz D, Keenan JP ( 1999): Transcranial magnetic stimulation: studying the brain‐behaviour relationship by induction of ‘virtual lesions’. Phil Trans R Soc Lond B 354: 1229–1238. [DOI] [PMC free article] [PubMed] [Google Scholar]
- Rizzo V, Siebner HR, Modugno N, Pesenti A, Münchau A, Gerschlager W, Webb RM, Rothwell JC ( 2004): Shaping the excitability of human motor cortex with premotor rTMS. J Physiol 554( Pt 2): 483–495. [DOI] [PMC free article] [PubMed] [Google Scholar]
- Rizzolatti G, Luppino G, Matelli M ( 1998): The organization of the cortical motor system: new concepts. Electroencephalogr Clin Neurophysiol 106: 283–296. [DOI] [PubMed] [Google Scholar]
- Rohrbaugh JW, Syndulko K, Lindsley DB ( 1976): Brain wave components of the contingent negative variation in humans. Science 191: 1055–1057. [DOI] [PubMed] [Google Scholar]
- Rohrbaugh JW, McCallum WC, Gaillard AW, Simons RF, Birbaumer N, Papakostopoulos D ( 1986): ERPs associated with preparatory and movement‐related processes. A review. Electroencephalogr Clin Neurophysiol Suppl 38: 189–229. [PubMed] [Google Scholar]
- Rossi S, Pasqualetti P, Rossini PM, Feige B, Ulivelli M, Glocker FX, Battistini N, Lucking CH, Kristeva‐Feige R ( 2000): Effects of repetitive transcranial magnetic stimulation on movement‐ related cortical activity in humans. Cereb Cortex 10: 802–808. [DOI] [PubMed] [Google Scholar]
- Rossi S, Hallett M, Rossini PM, Pascual‐Leone A ( 2009): Safety, ethical considerations, and application guidelines for the use of transcranial magnetic stimulation in clinical practice and research. Clin Neurophysiol 120: 2008–2039. [DOI] [PMC free article] [PubMed] [Google Scholar]
- Rossini PM, Berardelli A, Deuschl G, Hallett M, Maertens de Noordhout AM, Paulus W, Pauri F ( 1999): Applications of magnetic cortical stimulation. Electroencephalogr Clin Neurophysiol Suppl 52: 171–185. [PubMed] [Google Scholar]
- Rounis E, Lee L, Siebner HR, Rowe JB, Friston KJ, Rothwell JC, Frackowiak RS ( 2005): Frequency specific changes in regional cerebral blood flow and motor system connectivity following rTMS to the primary motor cortex. Neuroimage 26: 164–176. [DOI] [PubMed] [Google Scholar]
- Rushworth MF, Johansen‐Berg H, Gobel SM, Devlin JT ( 2003): The left parietal and premotor cortices: motor attention and selection. Neuroimage 20 ( Suppl 1): S89–100. [DOI] [PubMed] [Google Scholar]
- Shibasaki H, Hallett M ( 2006): What is the Bereitschaftspotential? Clin Neurophysiol 117: 2341–2356. [DOI] [PubMed] [Google Scholar]
- Simon SR, Meunier M, Piettre L, Berardi AM, Segebarth CM, Boussaoud D ( 2002): Spatial attention and memory versus motor preparation: premotor cortex involvement as revealed by fMRI. J Neurophysiol 88: 2047–2057. [DOI] [PubMed] [Google Scholar]
- Simonetta M, Clanet M, Rascol O ( 1991): Bereitschaftspotential in a simple movement or in a motor sequence starting with the same simple movement. Electroencephalogr Clin Neurophysiol 81: 129–134. [DOI] [PubMed] [Google Scholar]
- Stinear CM, Barber PA, Coxon JP, Verryt TS, Acharya PP, Byblow WD ( 2009): Repetitive stimulation of premotor cortex affects primary motor cortex excitability and movement preparation. Brain Stimul 2: 152–162. [DOI] [PubMed] [Google Scholar]
- Strens LH, Oliviero A, Bloem BR, Gerschlager W, Rothwell JC, Brown P ( 2002): The effects of subthreshold 1 Hz repetitive TMS on cortico‐cortical and interhemispheric coherence. Clin Neurophysiol 113: 1279–1285. [DOI] [PubMed] [Google Scholar]
- Suppa A, Bologna M, Gilio F, Lorenzano C, Rothwell JC, Berardelli A ( 2008): Preconditioning rTMS of premotor cortex can reduce but not enhance short‐term facilitation of primary motor cortex. J Neurophysiol 99: 564–570. [DOI] [PubMed] [Google Scholar]
- Terao Y, Furubayashi T, Okabe S, Mochizuki H, Arai N, Kobayashi S, Ugawa Y ( 2007): Modifying the cortical processing for motor preparation by repetitive transcranial magnetic stimulation. J Cogn Neurosci 19: 1556–1573. [DOI] [PubMed] [Google Scholar]
- Toni I, Schluter ND, Josephs O, Friston K, Passingham RE ( 1999): Signal‐, set‐ and movement‐related activity in the human brain: an event‐related fMRI study. Cereb Cortex 9: 35–49. [DOI] [PubMed] [Google Scholar]
- Walter WG, Cooper R, Aldridge VJ, McCallum WC, Winter AL ( 1964): Contingent Negative Variation: an Electric Sign of Sensorimotor Association and Expectancy in the Human Brain. Nature 203: 380–384. [DOI] [PubMed] [Google Scholar]
- Weinrich M, Wise SP ( 1982): The premotor cortex of the monkey. J Neurosci 2: 1329–1345. [DOI] [PMC free article] [PubMed] [Google Scholar]
- Wise SP ( 1985): The primate premotor cortex: past, present, and preparatory. Annu Rev Neurosci 8: 1–19. [DOI] [PubMed] [Google Scholar]
- Wise SP, Mauritz KH ( 1985): Set‐related neuronal activity in the premotor cortex of rhesus monkeys: effects of changes in motor set. Proc R Soc Lond B Biol Sci 223: 331–354. [DOI] [PubMed] [Google Scholar]
- Wise SP, Weinrich M, Mauritz KH ( 1986): Movement‐related activity in the premotor cortex of rhesus macaques. Prog Brain Res 64: 117–131. [DOI] [PubMed] [Google Scholar]
- Wise SP, Boussaoud D, Johnson PB, Caminiti R ( 1997): Premotor and parietal cortex: corticocortical connectivity and combinatorial computations. Annu Rev Neurosci 20: 25–42. [DOI] [PubMed] [Google Scholar]
- Ziemann U, Paulus W, Nitsche MA, Pascual‐Leone A, Byblow WD, Berardelli A, Siebner HR, Classen J, Cohen LG, Rothwell JC ( 2008): Consensus: Motor cortex plasticity protocols. Brain Stimulation 1: 164–182. [DOI] [PubMed] [Google Scholar]