

Abstract
Increases in striatal activity have been suggested to mediate training‐related improvements in working‐memory ability. We investigated the temporal dynamics of changes in task‐related brain activity following training of working memory. Participants in an experimental group and an active control group, trained on easier tasks of a constant difficulty in shorter sessions than the experimental group, were measured before, after about 1 week, and after more than 50 days of training. In the experimental group an initial increase of working‐memory related activity in the functionally defined right striatum and anatomically defined right and left putamen was followed by decreases, resulting in an inverted u‐shape function that relates activity to training over time. Activity increases in the striatum developed slower in the active control group, observed at the second posttest after more than 50 days of training. In the functionally defined left striatum, initial activity increases were maintained after more extensive training and the pattern was similar for the two groups. These results shed new light on the relation between activity in the striatum (especially the putamen) and the effects of working memory training, and illustrate the importance of multiple measurements for interpreting effects of training on regional brain activity. Hum Brain Mapp, 2013. © 2012 Wiley Periodicals, Inc.
Keywords: working memory, striatum, training, fMRI
INTRODUCTION
Working memory performance, the holding and manipulation of information over short periods of time [Baddeley, 1996], can be enhanced by means of training [e.g., Klingberg, 2010; Schmiedek et al., 2010b]. Studies on cortical brain activity report both increases [Hempel et al., 2004; Olesen et al., 2004; Westerberg and Klingberg, 2007] as well as decreases [Dahlin et al., 2008; Hempel et al., 2004; Kelly and Garavan, 2005; Kelly et al., 2006; Kühn et al., 2011] of fronto‐parietal activation during task performance after training. The basal ganglia are also involved in working memory [Cools et al., 2008; McNab and Klingberg, 2008]. The striatum, in particular, has been shown to increase in activity after working memory training [Dahlin et al., 2008; Olesen et al., 2004; but see Landau et al., 2004; Tomasi et al., 2004; for review, see Dahlin et al., 2009]. Thus, training‐related effects include increases as well as decreases in task‐related activity, and this discrepancy between findings has not yet been resolved. One candidate explanation refers to differences in the amount of training across studies. To directly address this issue, neural changes need to be monitored during extended periods of training instead of being assessed only twice, that is, before and after the intervention.
For cortical brain regions, a study by Hempel et al. [ 2004] demonstrated that a limited amount of training on an n‐back task resulted in activity increases in the frontal and parietal lobes, and that fronto‐parietal activity decreased after more extensive training. Because prefrontal brain regions are strongly connected to the basal ganglia, one would expect a similar inverted u‐shape pattern of brain activity for subcortical brain regions as well. Frank et al. [ 2001] postulated that the frontal cortex is involved in active maintenance of information, whereas the basal ganglia promote a selective and dynamic gating process that enables frontal memory representations to be updated. This mechanism also allows for the filtering of irrelevant information [McNab and Klingberg, 2008] and could become more efficient and therefore possibly less activated over more extended periods of working‐memory training. The involvement of the striatal dopaminergic system in updating [Bäckman et al., 2011; Cools et al., 2008; Frank et al., 2001; McNab and Klingberg, 2008] may also suggest an inverted u‐shape pattern of striatal activity as a function of training. Specifically, previous studies have linked the blood‐oxygen‐level‐dependent (BOLD) response in the striatum to release of dopamine [Schott et al., 2008] and dopaminergic neuromodulation may change in a nonlinear manner in response to working memory training [McNab et al., 2009]. Thus, striatal activity during working memory performance may relate nonlinearly to training over time. We therefore set out to investigate the temporal dynamics of changes in task‐related brain activity following training of updating in working memory with an adapted version of a numerical memory updating task [Salthouse et al., 1991] and a spatial n‐back task [Cohen et al., 1997]. Participants in an experimental group and an active control group, trained on easier tasks of a constant difficulty in shorter sessions than the experimental group, underwent fMRI measurements before (Scan 1), after about 1 week (Scan 2), and after more than 50 days of training (Scan 3).
METHOD
Participants
A healthy sample consisting of 46 adults (M age = 25.0; SDage = 2.7, rangeage 20–31) was recruited through flyers and word‐of‐mouth recommendation circulated in Berlin, Germany. Participants were right‐handed, had normal or corrected‐to‐normal vision, and reported no history of cardiovascular disease, diabetes, neurological or psychiatric conditions, or drug/alcohol abuse. They reported no use of antiseizure or antidepressant drugs. All considered participants completed three imaging sessions without producing imaging artefacts or displaying brain abnormalities.
Participants were first matched on sex and global cognitive performance [Digit‐Symbol Substitution (DS); Wechsler, 1981] and then randomly assigned to either one of two groups: one experimental (n = 26; M age = 24.7; SDage = 2.3, rangeage 20–29; 13 women, 13 men) and one active control group (n = 20; M age = 25.4; SDage = 3.1, rangeage 20–31; 10 women, 10 men). Our previous experience with cognitive training [Lövdén et al., 2011, in press; Schmiedek et al., 2010b] and other reports [e.g., Dahlin et al., 2008] suggested that a sample size of around 20 provided adequate power; more subjects were assigned to the experimental group to increase the statistical power for detecting correlations in this group. DS performance did not differ across groups at Scan 1 (M experimental = 68.1; SDexperimental = 11.3; M control = 70.3; SDcontrol = 10.5; t (44) = 0.67, P > 0.50). Participants in both groups were paid between 300 and 700 Euro, depending on the number of completed sessions and the amount of improvement in performance from Scans 1 to 3. The criterion performance was estimated from the session collecting performance data outside of the scanner around the time points of Scans 1 and 3 (see Materials and Procedure). Participants in the experimental group completed 5.04 sessions (2 h 46 min) between Scan 1 and 2 and 49.8 sessions (24 h 53 min) between Scan 2 and 3; in the control group a comparable number of sessions shorter in time were completed: 4.55 sessions (23 min) between Scan 1 and 2 and 49.3 sessions (4 h 7 min) between Scan 2 and 3.
The ethical review board of the Charité University Medicine approved the study.
Materials and Procedure
Participants practiced computerized tasks individually during on average 54 sessions on their home computers [for software details, see Schmiedek et al., 2010a]. Functional MRI measurements and assessments of cognitive performance were conducted before training started (Scan 1), after an average five training sessions (Scan 2; M experimental = 5, SDexperimental = 1; M control = 5, SDcontrol = 1), and after on average 54 training sessions (Scan 3; M experimental = 55, SDexperimental = 8; M control = 54, SDcontrol = 6).
Training
The tasks for the experimental group comprised adapted versions of a numerical memory updating task [Salthouse et al., 1991] and a spatial n‐back task [Cohen et al., 1997]. On every session, the updating task was administered over several blocks at different load levels: one block of Load 2, six blocks of Load 4, and six blocks of Load 6. The n‐back task included one block of 1‐back, one block of 2‐back, three blocks of 3‐back, and three blocks of 4‐back. Both tasks were presented in an easy‐to‐hard scheme, with increasingly faster presentation times over the training period. For the control group, each session consisted of one updating block at load 2, one updating block at load 4, one block of 1‐back, one block of 2‐back, and one block of 3‐back. For the control group, training was thus administered with a fixed difficulty level and it was less extensive and less difficult. The tasks are described in more detail below.
In each updating block, two (load 2), four (load 4), or six (load 6) single digits (ranging from 0 to 9) were presented simultaneously in cells situated horizontally for 4,000 ms. After an interstimulus interval (ISI) of 500 ms, a sequence of eight updating operations was presented in a second row of cells below the first one. These updating operations were additions and subtractions within a range of ‐8 to +8. Those updating operations had to be applied to the digits memorized from the corresponding cells above and the updated results had to be memorized. For the Load 4 and 6 blocks administered to the experimental group, presentation times of the updating operations were 2,750 ms for session 1–10, 2,000 ms for sessions 11–20, 1,500 ms for sessions 21–30, and 1,250 ms for all session thereafter. Presentation time was always 2,750 ms for the control group. ISI was always 250 ms. At the end of each trial, the end results had to be entered in the cells in the upper row while the lower row was blank.
In each n‐back block, a sequence of 39 black dots appeared at varying locations in a 4 by 4 grid. Participants indicated with button presses whether each dot was in the same position as the dot two (2‐back), three (3‐back), or four (4‐back) steps earlier in the sequence or not. Dots appeared at random locations with the constraints that 12 items were targets and dots did not appear in the same location in consecutive steps. For the 3‐back and 4‐back blocks administered to the experimental group, the ISI between the dots was 2,500 ms for session 1–10, 2,000 ms for sessions 11–20, 1,750 ms for sessions 21–30, and 1,500 ms for all session thereafter. ISI was always 2,500 ms for the control group. The presentation time for the dots was always 500 ms.
We monitored training compliance by means of an online database in which we checked whether participants performed their daily training sessions. If for 2 days in a row no training data was recorded we called participants and provided assistance if there were technical problems.
Additional Assessment of Cognitive Performance
These sessions lasted ∼ 2 h, were conducted under controlled conditions in the laboratory, and included cognitive tests intermixed with self‐report questionnaires. The sessions were always administered a day or two after the corresponding brain‐imaging session (Scans 1, 2, and 3), with no training sessions in between.
The training tasks were administered under the easiest presentation times (n‐back = 2,500 ms; updating = 2,750 ms) for all participants. The numerical updating task included six blocks of load 2, six blocks of load 4, and six blocks of load 6. The n‐back task included two block of 2‐back, two blocks of 3‐back, and two blocks of 4‐back. Performance accuracies were averaged across blocks in a condition to form the dependent variables.
Two tasks assessing transfer within working memory were administered. In two blocks of a numerical 3‐back, two‐choice decisions on whether the current stimulus matched the stimulus 3 steps earlier in the sequence were required. The 39 stimuli in each block were one‐digit numbers (1–9). Presentation time was 3,000 ms with an ISI of 1,000 ms. Six blocks of a spatial memory updating task were also administered. In each block of this task, a display of a 4 × 4 grids was first shown for 4,000 ms. In each grid, a black dot was present in one of the sixteen locations. These locations had to be memorized and updated according to shifting operations, which were indicated by arrows appearing below the corresponding field. Presentation time of the arrows was 2,750 ms with an ISI of 250 ms. After six updating operations, the four grids reappeared and the resulting end positions had to be clicked on. For both tasks, performance accuracies were averaged across block to form single dependent variables.
Two tests assessing transfer to logical reasoning were administered at the behavioural session around scan 1 and scan 3 only. These paper‐and‐pencil tests of figural and numerical reasoning performance were taken from the Berlin Intelligence Structure Test [Jäger et al., 1997].
Behavioral Tasks in MRI Scanner
The numerical updating task (see Fig. 1) was administered in the scanner. The task consisted of a top row of numbers presented for 4,000 ms, after which four updating operations (‐8 to +8) were consecutively shown in a bottom row for 1,000 ms each. ISI was 2,000 ms. The response format was different compared to the training sessions: A probe with numbers presented in the top row was shown and participants had to indicate whether all numbers were correct (right button) or not (left button). The task consisted of three runs, each comprising 15 blocks of the load conditions 2, 4, and 6 intermixed. Each run additionally contained six fixation periods of 14,000 ms each.
Figure 1.

Schematic drawing of the experimental paradigm.
MRI Procedures
Images were collected with a 3T Magnetom Trio MRI scanner system (Siemens Medical Systems, Erlangen, Germany) using a 12‐channel radiofrequency head coil. First, high‐resolution anatomical images were acquired using a T1‐weighted 3D MPRAGE sequence (TR = 1,550 ms, TE = 2.34 ms, TI = 900ms, acquisition matrix = 256 × 256 × 176, sagittal FOV = 244 mm, flip angle = 9°, voxel size = 1 × 1 × 1 mm3). Whole brain functional images were collected using a T2*‐weighted EPI sequence sensitive to BOLD contrast (TR = 2,000 ms, TE = 30 ms, image matrix = 64 × 64, FOV = 216 mm, flip angle = 80°, slice thickness = 3.0 mm, distance factor = 0%, voxel size 3 × 3 × 3 mm3, 36 axial slices, using GRAPPA). Image volumes were acquired aligned to AC‐PC.
fMRI Data Analysis
Preprocessing
The fMRI data were analysed using the SPM5 software (Wellcome Department of Cognitive Neurology, London, UK). The first three volumes of all EPI series were excluded from the analysis to allow the magnetisation to approach a dynamic equilibrium. Data processing started with slice time correction and realignment of the EPI datasets. A mean image for all EPI volumes was created, to which individual volumes were spatially realigned by means of rigid body transformations. The high resolution structural image was coregistered with the mean image of the EPI series. Then the structural image was normalised to the Montreal Neurological Institute (MNI) template, and the normalisation parameters were applied to the EPI images to ensure an anatomically informed normalisation. A commonly applied filter of 8 mm FWHM (full‐width at half maximum) was used. Low‐frequency drifts in the time domain were removed by modelling the time series for each voxel by a set of discrete cosine functions to which a cut‐off of 128 s was applied.
Statistical analyses
The single‐subject‐level statistical analyses were performed using a general linear model (GLM). We modelled the number set presentation (4,000 ms duration), the updating phase (12,000 ms duration) as well as the probe phase (4,000 ms duration) separately for the three load conditions. Incorrect trials were modelled separately (target, updating and probe phase separately independent of load condition). Vectors containing the event onsets were convolved with the canonical hemodynamic response function (HRF) to form the main regressors in the design matrix (the regression model). The vectors were also convolved with the temporal derivatives and the resulting vectors were entered into the model. In addition, the design matrix included the six realignment parameters to further correct for head motion. The statistical parameter estimates were computed separately for each voxel for all columns in the design matrix. Contrast (t) images were constructed from each individual to compare the relevant parameter estimates for the regressors containing the canonical HRF.
Next, group‐level random effects analysis was performed. We computed the contrast of the updating phase of all load conditions against the implicit baseline for each time point (Scans 1, 2, and 3) separately. Note that this updating phase contained no overt motor demand. To identify brain regions that show activation changes between Scans 1 and 2 (i.e., after about 5 days of training) and between Scans 2 and 3 (i.e., after about 49 additional training days) in the experimental group we compared the contrast images between Scans 2 and 1 as well as between Scans 3 and 2. The resulting statistical values were thresholded with a level of significance of P < 0.001 (z > 3.09, uncorrected) and a significant effect was reported when the volume of the cluster was greater than the Monte Carlo simulation determined minimum cluster size (>22 voxels) above which the probability of type I error was < 0.05 [AlphaSim, Ward, 2000]. The resulting statistical maps were overlaid onto a normalized T1 weighted MNI single subject template (colin27). To identify task‐related brain activity, we additionally computed the contrast of all loads and all time points and both groups against the implicit baseline. We computed overlap between the resulting thresholded contrasts to determine the brain regions showing increases or decreases between Scan 1 and 2, increases or decreases between Scans 2 and 3, in task‐related activity.
From the resulting regions and from an a priori anatomical region of interest (ROI) in bilateral putamen [Anatomical Automatic Labeling Atlas, Tzourio‐Mazoyer et al., 2002] we extracted percentage signal changes by means of MarsBaR [http://marsbar.sourceforge.net/, Brett et al., 2002]. For each subject, region, and condition separately the mean percent signal change over a time window of 4–16 s after stimulus onset was computed. The extracted percentage signal changes were analyzed with mixed ANOVAs with the factors group (experimental vs. control), time (Scans 1, 2, and 3), and load (2, 4, 6) to investigate group differences in training‐related changes. To exclude that the control group showed similar activation changes across time with only slightly different locations of activation, we also conducted separate analyses of the control group and, additionally, extracted percentage signal changes from both group based on anatomically defined regions‐of‐interest.
RESULTS
Behavioural Data
Training tasks
A mixed ANOVA on numerical updating performance at Scan 1 with the factors group (experimental vs. control) and load (2, 4, 6) revealed significant linear, F(1,44) = 364.1, P < 0.001, and quadratic, F(1,44) = 21.5, P < 0.001, effects of load. No other effects were significant. Importantly, the absence of a group effect, F < 1, indicates that the groups were comparable on criterion performance at Scan 1.
An extension of the mixed ANOVA above on numerical updating performance to include also the effects of time (Scans 1, 2, and 3) showed significant linear, F(1,44) = 21.5, P < 0.001, and quadratic, F(1,44) = 21.5, P < 0.001, effects of load. The linear, F(1,44) = 183.8, P < 0.001, and quadratic, F(1,44) = 4.3, P < 0.05, effects of time were also significant. These main effects were qualified by linear interactions between group and time, F(1,44) = 12.3, P < 0.001, group and load, F(1,44) = 10.8, P < 0.01, and load and time, F(1,44) = 104.4, P < 0.001. In addition, the linear three‐way interaction among group, time, and load reached significance, F(1,44) = 9.3, P < 0.01. No other effects were significant. An inspection of Figure 2 reveals that the experimental group improved more in updating performance from training than the control group, and that this differential improvement was especially pronounced under higher load.
Figure 2.
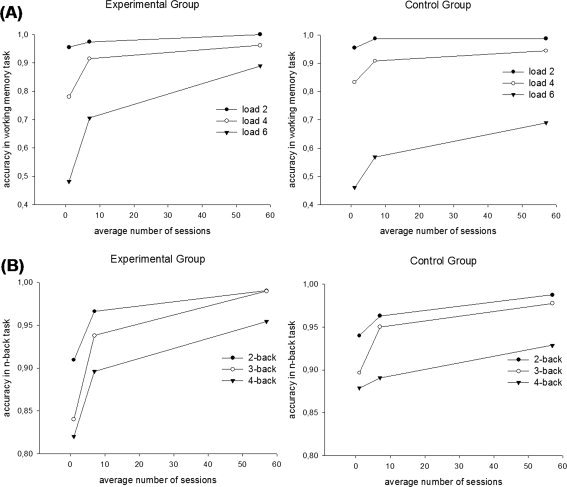
(A) Mean numerical updating performance as function of group (experimental vs. control) at time (Scan 1, 2, and 3), and load (2, 4, 6), (B) mean n‐back performance as function of group (experimental vs. control) at time (Scan 1, 2, and 3), and n‐back (2, 3, 4).
A similar mixed group × time × load ANOVA on spatial n‐back performance revealed a significant linear effect of load, F(1,44) = 76.5, P < 0.001, and a significant linear effect of time, F(1,44) = 192.2, P < 0.001. These main effects were qualified by linear interactions between group and time, F(1,44) = 22.5, P < 0.001, and load and time, F(1,44) = 4.2, P < 0.05. No other effects were significant. Similar to memory updating performance, the experimental group thus improved more in n‐back performance due to training than the control group.
Transfer Tasks
Separate mixed ANOVAs with the factors group (experimental vs. control) and time (Scans 1, 2, and 3) on numerical n‐back and spatial updating performance showed significant linear and quadratic effects of time for both measures, all Fs(1,44) > 4.5, Ps < 0.04. No other effects reached significance, but the linear interactions between group and time displayed nonsignificant trends for larger improvement over time for the experimental group, F(1,44) = 3.9, P = 0.053 for numerical n‐back performance and F(1,44) = 3.5, P = 0.069 for spatial updating performance.
Separate mixed ANOVAs with the factors group (experimental vs. control) and time (Scan 1 vs. 3) on figural and numerical reasoning performance showed significant effects of time for both measures, F(1,44) = 47.8, P < 0.001 for figural reasoning and F(1,44) = 18.4, P < 0.001 for numerical reasoning performance. No other effects reached significance.
fMRI Data
We compared brain activity of the experimental group between Scans 1 and 2 as well as between Scans 2 and 3, focussing on changes in the contrast of all three load conditions against the implicit baseline. We further identified the working memory network by computing the contrast of all load conditions against implicit baseline, averaged over both groups and all three time points (P < 0.001; cluster > 22; Fig. 3, Table I). Because we were interested in changes of brain activity in task‐related brain regions only, we restricted further analyses to areas that revealed a difference over any two time points and were located within the working memory network.
Figure 3.
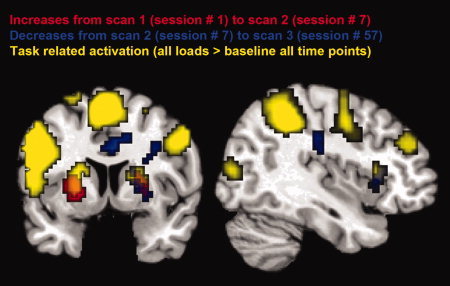
Activation map averaged over 26 subjects of the experimental group (P < 0.001, cluster extent threshold of P < 0.05) mapped onto an MNI T1‐weighted template. Significant increases in brain activity from Scan 1 to 2 are depicted in red. Significant decreases in brain activity from Scan 2 to 3 are depicted in blue. Working‐memory related activation averaged across all loads and all time points are depicted in yellow. On the left coronal slice, overlap is seen in bilateral striatum. On the right sagittal slice, overlap is present in the right IFG.
Table I.
Brain areas of working memory task related activation
| Area | BA | Peak coordinates (MNI) | T‐score | Extent |
|---|---|---|---|---|
| Bilateral visual cortex, extending up to bilateral parietal cortex | 17,18,7, 40 | 15, −96, 3 | 20.45 | 4248 |
| Supplementary motor cortex extending into bilateral premotor cortex | 6 | −3, 0, 63 | 15.31 | 2901 |
| Bilateral striatum extending into right inferior frontal gyrus | 45, 13 | 21, 0, 15 | 5.18 | 198 |
| Right middle frontal gyrus | 46, 10 | 39, 39, 27 | 4.88 | 55 |
| Left inferior parietal lobule | 40 | −57, −45, 18 | 4.38 | 35 |
Contrast of all load conditions against implicit baseline averaged over group and time point, P < 0.001, cluster extent threshold of P < 0.05.
Initial increases from Scans 1 to 2 within the working memory network were found in bilateral striatum (putamen), decreases from Scans 2 to 3 were found in the right striatum (putamen) and the right inferior frontal gyrus (IFG) (Fig. 3). No regions showing significant decreases from Scans 1 to 2 were found, and no significant increases from Scans 2 to 3 were detected.
We extracted percentage signal changes of the regions within the identified working memory network that also displayed changes, and computed separate repeated measures ANOVA with the factors group (experimental vs. control), load (2, 4, 6), and time (Scans 1, 2, and 3) on these signal changes. In right striatum (MNI: 25, 0, 6), where we observed the hypothesized inverted U‐shape pattern of an initial increase and a subsequent decrease in activity within the task‐related network, the percentage signal changes (Fig. 4A) showed a main effect of load, F(1,44) = 8.4, P < 0.01, and a significant quadratic group × time interaction, F(2,88) = 4.82, P < 0.05. In the left striatum (MNI: ‐20, 5, 3), where we found an increase from Scan 1 to scan 2 within the task network but no subsequent change, percentage signal changes (Fig. 4B) revealed a main effect of load F(1,44) = 10.63, P < 0.01, a main effect of time F(1,44) = 4.64, P < 0.05 and a linear and quadratic time × load interaction Fs(2,88) > 4.6, Ps < 0.05. In the right IFG (MNI: 43, 20, 6), where we found a decrease from Scan 2 to 3 within the working‐memory network, the percentage signal changes (Fig. 4C) revealed a main effect of load, F(1,44) = 55.97, P < 0.001, and a quadratic effect of time, F(1,44) = 5.96, P < 0.05 and a time × load interaction F(2,88) = 4.70, P < 0.05.
Figure 4.

Percent signal changes extracted from regions of overlap in (A) right striatum (overlap of increases from Scan 1 to 2, decreases from Scan 2 to 3, and task‐related activity), (B) left striatum (overlap of increases from Scan 1 to 2 and task‐related activity), (C) right IFG (overlap of decreases from Scan 2 to 3 and task‐related activity). *indicates significant t tests (P < 0.05).
The most relevant and a priori hypothesized quadratic group × time interaction in the right striatum survives multiple comparison correction when applying Bonferroni correction with an overall P‐value of P < 0.05 to the three brain activity based ROIs tested.
To exclude that the control group shows a u‐shape pattern of activation across time with only slightly different location we explored possible initial increases from Scan 1 to 2 and decreases from Scan 2 to 3 in the control group. No significant regions of increase from Scan 1 to 2 or decrease from Scan 2 to 3 were found (P = 0.001, cluster > 10).
To verify the effects observed in putamen in a ROI that was not derived from the present data set we used an anatomical ROI of bilateral putamen. In line with our data‐driven ROI we observed the hypothesized inverted U‐shape pattern of an initial increase and a subsequent decrease in activity in the experimental group for right as well as left putamen (Fig. 5). Statistically the interaction of group × time was significant, F(2,88) = 9.64, P < 0.001 (quadratic, P < 0.001) in right putamen same as in left putamen, F(2,88) = 5.36, P < 0.01 (quadratic, P < 0.01).
Figure 5.

Percent signal changes extracted from anatomical region in right and left putamen. *indicates significant t tests (P < 0.05).
When applying Bonferroni correction with an overall P‐value of p < 0.05 to all five ROIs used (three brain activity based ROIs and two anatomically defined ROIs), the quadratic group × time interaction in the right striatum survives multiple comparison correction.
DISCUSSION
This study investigated the dynamics of changes in working‐memory related brain activity as a function of training of updating in working memory. Participants in an experimental group and in an active control group that trained on easier tasks with fixed difficulty in shorter daily sessions than the experimental group were measured before, after about 1 week, and after more than 50 days of training.
Results revealed larger increases in performance for the experimental group than for the active control group. Improvements on untrained working‐memory tasks displayed nonsignificant trends for being larger in the experimental group than in the control group. Improvements on reasoning tasks did not differ between groups. It is possible that the inclusion of the active control group resulted in smaller net transfer effects than what has been reported in previous studies using the suboptimal [Sternberg, 2008] no‐contact control group design [see Klingberg, 2010, for review].
The experimental group showed bilateral increases of working‐memory related activity in the striatum (specifically, putamen) after about 1 week of daily training. In the right striatum, this initial and rapid increase was followed by decreases, resulting in an inverted u‐shape function relating activity to training over time. These changes were selective for the experimental group: within the functionally defined ROIs activity increases in the right striatum emerged first in the second posttest after more than 50 days of training for the active control group. In the left striatum, the initial increases were maintained after more extensive training and the overall pattern was similar for the two groups. Within the anatomically defined ROIs of putamen we found a significant u‐shape pattern of activity selective for the experimental group on the right as well as on the left side.
The basal ganglia are involved in working memory [Cools et al., 2008; Frank et al., 2001; McNab and Klingberg, 2008], and may promote selective and dynamic updating of memory representations that are actively maintained in the frontal cortex [Frank et al., 2001]. This mechanism may also allow for the filtering of irrelevant information [McNab and Klingberg, 2008]. Working‐memory‐related activity in the basal ganglia, particularly in the striatum, has previously been shown to increase in activity after relatively extensive working memory training [Dahlin et al., 2008; Olesen et al., 2004; see Dahlin et al., 2009, for review]. Dahlin et al. [ 2008] demonstrated that activity increases in the left striatum (namely in left putamen) overlapped with activity increases for an untrained working‐memory task. This finding has been interpreted to suggest that increased striatal activity mediates changes in underlying working‐memory ability [Dahlin et al., 2008, 2009].
The training demands in these previous studies correspond roughly to 20–30 sessions of the present training protocol for the experimental group. Our study reveals that increases in striatal activity emerge much earlier in training than this. In addition, the changes for the active control group indicate that relatively little daily practice on easy tasks with fixed difficulty does also result in these increases, though it took longer time for them to emerge in the right striatum under such conditions. Our results also clearly show that striatal activity relates to training in a nonlinear manner over time. For the experimental group, these nonlinear changes are even non‐monotonic in the functionally defined right striatum as well as bilateral anatomically defined putamen: The initial increases of task‐related activity were followed by decreases. These findings suggest that the interpretation of striatal increases as mediating improvements in an underlying working memory ability must be elaborated. Specifically, if striatal increases reflect improvements in underlying ability, then one would predict that these changes would increase at least monotonically and that they would be more pronounced in the group receiving more demanding training [e.g., Lövdén et al., 2010]. The changes in the right striatum and bilateral anatomically defined putamen are clearly inconsistent with this prediction: The group receiving more demanding training displayed a decrease in activity following more extended training and task‐related activity tended to be lower in this group after 50 session of training than it was for the active control group. The similar pattern of changes in the functionally defined left striatum for the two groups is also inconsistent with this prediction. Though the experimental group increases more in performance than the active control group, increases in task‐related activity in the left striatum are very similar in the two groups.
Several accounts of the present findings are possible. For example, previous studies have linked the BOLD response in the striatum to release of dopamine [Schott et al., 2008], have shown that working memory capacity is related to dopamine synthesis in the striatum [Cools et al., 2008] and have shown enhanced dopamine release within the striatum after working memory training [Bäckman et al., 2011]. The dopaminergic system is highly dynamic. For example, psychostimulants may rapidly increase extracellular dopamine in the nucleus accumbens [Hemby et al., 1997], but longer‐term use may cause compensatory adaptations that lead to dopaminergic depletion [Jacobsen et al., 2001; Schwartz et al., 2007]. In line with such dynamics, the dopaminergic system changes in a non‐linear manner in response to working memory training [McNab et al., 2009]. Our present results could indicate that, after long‐term working memory training, the dopaminergic system adapts to an increase in extracellular dopamine induced by the novel levels of working memory demands, with functional brain activity returning to baseline. Nevertheless, we find an account framed in theories of the dynamics between frontal and striatal regions in skill acquisition and learning [e.g., Packard and Knowlton, 2002; Seger and Miller, 2010] more plausible. Specifically, one may argue that task‐related activity rapidly increases in the striatum when knowledge of the task‐rules proceeds from episodic representations to the process of being automatized. This notion is consistent with the finding that striatal load‐dependent activity emerges first after the baseline assessment. The subsequent reduction of activity in the functionally defined right striatum and anatomically defined bilateral putamen may reflect more efficient processing [Kelly and Garavan, 2005; Poldrack, 2000] or reflect fully automatized task‐rules. In this vein, it is important to note that the updating period that we modelled in the analyses contained no overt motor demand, so that the observed activity changes solely reflect the cognitive demands of updating in working memory. We also note that the change in speed during training of the experimental group may have fostered use of new strategies which could be considered as an alternative hypothesis for the changes we observe over time. However, this notion does not explain why the active control group shows the same effects in striatal BOLD signal change but only at the third measurement, despite the fact that the training of this group had constant difficulty.
In addition to nonlinear activity changes in the striatum, we also observed a significant quadratic trend of activity in the right IFG for both groups, with an initial nonsignificant trend for small increases followed by robust decreases. Both training‐related increases [Hempel et al., 2004; Olesen et al., 2004; Westerberg and Klingberg, 2007] as well as decreases [Dahlin et al., 2008; Hempel et al., 2004; Kelly and Garavan, 2005; Kelly et al., 2006; Kühn et al., 2011] of fronto‐parietal activation during working memory task performance have been reported. It has not been resolved how to interpret these mixed findings. Our findings are consistent with a study by Hempel et al. [ 2004] that demonstrated that a limited amount of training on an n‐back task resulted in activity increases in the frontal and parietal lobes, and that fronto‐parietal activity decrease after more extensive training.
We thus conclude that both fronto‐parietal and striatal activity may relate nonlinearly and nonmonotonically to working‐memory training over time, and that activity changes in the right striatum and in particular bilateral putamen vary in timing with different training demands. These results illustrate the importance of multiple measurements for interpreting effects of cognitive training on regional brain activity. Depending on training dosage, increases, decreases, or no changes may be found. With three measurement points only, it is likely that we did not capture the whole curve ‐ relating activity to training over time. For example, it is possible that activity in the functionally defined left striatum continued to increase for a couple of sessions after our second measurement point and then decreased, so that the true curve is actually similar in shape to the inverted u‐shape pattern found for the functionally defined right striatum and the anatomically defined right and left putamen. Future studies should include dense measurements of brain activity as a function of training to further clarify the temporal dynamics of task‐related activity during working‐memory related skill acquisition.
Acknowledgements
The authors thank all research assistants.
REFERENCES
- Bäckman L, Nyberg L, Soveri A, Johansson J, Andersson M, Dahlin E, Neely AS, Virta J, Laine M, Rinne JO ( 2011): Effects of working‐memory training on striatal dopamine release. Science 333: 718. [DOI] [PubMed] [Google Scholar]
- Baddeley A ( 1996): Exploring the central executive. Quart J Exp Psychol 49: 5–28. [Google Scholar]
- Cohen JD, Perlstein WM, Braver TS, Nystrom LE, Noll DC, Jonides J, Smith EE ( 1997): Temporal dynamics of brain activation during a working memory task. Nature 386: 604–608. [DOI] [PubMed] [Google Scholar]
- Cools R, Gibbs SE, Miyakawa A, Jagust W, D'Esposito M ( 2008): Working memory capacity predicts dopamine synthesis capacity in the human striatum. J Neurosci 28: 1208–1212. [DOI] [PMC free article] [PubMed] [Google Scholar]
- Dahlin E, Stigsdotter Neely A, Larsson A, Bäckman L, Nyberg L ( 2008): Transfer of learning after updating training mediated by the striatum. Science 320: 1510–1512. [DOI] [PubMed] [Google Scholar]
- Dahlin E, Bäckman L, Stigsdotter Neely A, Nyberg L ( 2009): Training of the executive component of working memory: Subcortical areas mediate transfer effects. Restor Neurol Neurosci 27: 405–419. [DOI] [PubMed] [Google Scholar]
- Frank MJ, Loughry B, O'Reilly RC ( 2001): Interactions between frontal cortex and basal ganglia in working memory: A computational model. Cogn Affect Behav Neurosci 1: 137–160. [DOI] [PubMed] [Google Scholar]
- Hemby SE, Co C, Koves TR, Smith JE, Dworkin SI ( 1997): Differences in extracellular dopamine concentrations in the nucleus accumbens during response‐dependent and response‐ independent cocaine administration in the rat. Psychopharmacology 133: 7–16. [DOI] [PubMed] [Google Scholar]
- Hempel A, Giesel FL, Garcia Caraballo NM, Amann M, Meyer H, Wüstenberg T, Essig M, Schröder J ( 2004): Plasticity of cortical activation related to working memory during training. Am J Psychiatry 161: 745–747. [DOI] [PubMed] [Google Scholar]
- Jacobsen LK, Giedd JN, Gottschalk C, Kosten TR, Krystal JH ( 2001): Quantitative morphology of the caudate and putamen in patients with cocaine dependence. Am J Psychiatry 158: 486–489. [DOI] [PubMed] [Google Scholar]
- Jaeggi SM, Buschkuehl M, Jonides J, Perrig WJ ( 2008): Improving fluid intelligence with training on working memory. Proc Natl Acad Sci USA 105: 6829–6833. [DOI] [PMC free article] [PubMed] [Google Scholar]
- Jäger AO, Süß H‐M, Beauducel A ( 1997): Berliner Intelligenzstruktur‐Test, BIS‐Test. Form 4. Handanweisung. Göttingen, Germany: Hogrefe. [Google Scholar]
- Kelly C, Garavan H ( 2005): Human functional neuroimaging of brain changes associated with practice. Cereb Cortex 15: 1089–1102. [DOI] [PubMed] [Google Scholar]
- Kelly C, Foxe JJ, Garavan H ( 2006): Pattern of normal human brain plasticity after practice and their implications for neurorehabilitation. Arch Phys Med Rehab 87: 20–28. [DOI] [PubMed] [Google Scholar]
- Klingberg T ( 2010): Training and plasticity of working memory. Trends Cogn Sci 14: 317–324. [DOI] [PubMed] [Google Scholar]
- Kühn S, Schmiedek F, Schott B, Ratcliff R, Heinze HJ, Düzel E, Lindenberger U, Lövden M ( 2011): Brain areas consistently linked to individual differences in perceptual decision‐making in younger as well as older adults before and after training. J Cogn Neurosci 23: 2147–2158. [DOI] [PubMed] [Google Scholar]
- Landau SM, Schumacher EH, Garavan H, Druzgal TJ, D'Esposito M ( 2004): A functional MRI study of the influence of practice on component processes of working memory. NeuroImage 22: 211–221. [DOI] [PubMed] [Google Scholar]
- Lövdén M, Bäckman L, Lindenberger U, Schaefer S, Schmiedek F ( 2010): A theoretical framework fort he study of adult cognitive plasticity. Psychol Bull 136: 659–676. [DOI] [PubMed] [Google Scholar]
- Lövdén M, Schaefer S, Noack H, Kanowski M, Kaufmann J, Tempelmann C, Bodammer NC, Kühn S, Heinze HJ, Lindenberger U, Düzel E, Bäckman L ( 2011): Performance‐related increases in hippocampal N‐acetylaspartate (NAA) induced by spatial navigation training are restricted to BDNF Val homozygotes. Cereb Cortex 21: 1435–1442. [DOI] [PubMed] [Google Scholar]
- Lövdén M, Schaefer S, Noack H, Bodammer NC, Kühn S, Heinze HJ, Düzel E, Bäckmann L, Lindenberger U: Spatial navigation training protects the hippocampus against age‐related changes during early and late adulthood. Neurobiol Aging (in press). [DOI] [PubMed] [Google Scholar]
- McNab F, Klingberg T ( 2008): Prefrontal cortex and basal ganglia control access to working memory. Nat Neurosci 11: 103–107. [DOI] [PubMed] [Google Scholar]
- McNab F, Varrone A, Farde L, Jucaite A, Bystritsky P, Forssberg H, Klingberg T ( 2009): Changes in cortical dopamine D1 receptor binding associated with cognitive training. Science 323: 800–802. [DOI] [PubMed] [Google Scholar]
- Olesen PJ, Westerberg H, Klingberg T ( 2004): Increased prefrontal and parietal activity post‐training of working memory. Nat Neurosci 7: 75–79. [DOI] [PubMed] [Google Scholar]
- Packard MG, Knowlton BJ ( 2002): Learning and memory functions of the basal ganlia. Annu Rev Neurosci 25: 563–593. [DOI] [PubMed] [Google Scholar]
- Poldrack RA ( 2000): Imaging brain plasticity: Conceptual and method‐ ological issues—A theoretical review. NeuroImage 12: 1–13. [DOI] [PubMed] [Google Scholar]
- Salthouse TA, Babcock RL, Shaw RJ ( 1991): Effects of adult age on structural and operational capacities in working memory. Psychol Aging 6: 118–127. [DOI] [PubMed] [Google Scholar]
- Schmiedek F, Bauer C, Lövdén M, Brose A, Lindenberger U ( 2010a): Cognitive enrichment in old age: Web‐based training programs. GeroPsych 23: 59–67. [Google Scholar]
- Schmiedek F, Lövdén M, Lindenberger U ( 2010b): Hundred days of cognitive training enhance broad cognitive abilities in adulthood: Findings from the COGITO study. Front Aging Neurosci 2: 1–10. [DOI] [PMC free article] [PubMed] [Google Scholar]
- Schott BH, Minuzzi L, Krebs RM, Elmenhorst D, Lang M, Winz OH, Seidenbecher CI, Coenen HH, Heinze H‐J, Zilles K, Düzel E, Bauer A ( 2008): Mesolimbic functional magnetic resonance imaging activations during reward anticipation correlate with reward‐related ventral Striatal dopamine release. J Neurosci 28: 14311–14319. [DOI] [PMC free article] [PubMed] [Google Scholar]
- Seger CA, Miller EK ( 2010): Category learning in the brain. Annu Rev Neurosci 33: 203–219. [DOI] [PMC free article] [PubMed] [Google Scholar]
- Schwartz K, Nachman R, Yossifoff M, Sapir R, Weizman A, Rehavi M ( 2007): Cocaine, but not amphetamine, short term treatment elevates the density of rat brain vesicular monoamine transporter. J Neural Transm 114: 427–430. [DOI] [PubMed] [Google Scholar]
- Sternberg RJ ( 2008): Increasing fluid intelligence is possible after all. Proc Natl Acad Sci USA 105: 6791–6792. [DOI] [PMC free article] [PubMed] [Google Scholar]
- Tomasi D, Ernst T, Caparelli EC, Chang L ( 2004): Practice induced changes of brain function during visual attention: A parametric fMRI study at 4 Tesla. NeuroImage 23: 1414–1421. [DOI] [PubMed] [Google Scholar]
- Tzourio‐Mazoyer N, Landeau B, Papathanassiou D, Crivello F, Etard O, Delcroix N, Bernard Mazoyer B, Joliot M ( 2002): Automated anatomical labelling of activations in SPM using a macroscopic anatomical parcellation of the MNI MRI single‐subject brain. NeuroImage 15: 273–289. [DOI] [PubMed] [Google Scholar]
- Ward BD ( 2000): Simultaneous inference for fMRI data. AFNI AlphaSim Documentation, Medical College of Wisconsin, stuff.mit.edu/afs/sipb.mit.edu/project/seven/doc/AFNI/AlphaSim.ps.