

Abstract
Multiple sclerosis (MS) is characterized by extensive damage in the central nervous system. Within this field, there is a strong need for more advanced, functional imaging measures, as abnormalities measured with structural imaging insufficiently explain clinicocognitive decline in MS. In this study we investigated functional connectivity changes in MS using resting‐state magnetoencephalography (MEG). Data from 34 MS patients and 28 age and gender‐matched controls was assessed using synchronization likelihood (SL) as a measure of functional interaction strength between brain regions, and graph analysis to characterize topological patterns of connectivity changes. Cognition was assessed using extensive neuropsychological evaluation. Structural measures included brain and lesion volumes, using MRI. Results show SL increases in MS patients in theta, lower alpha and beta bands, with decreases in the upper alpha band. Graph analysis revealed a more regular topology in the lower alpha band in patients, indicated by an increased path length (λ) and clustering coefficient (γ). Attention and working memory domains were impaired, with decreased brain volumes. A stepwise linear regression model using clinical, MRI and MEG parameters as predictors revealed that only increases in lower alpha band γ predicted impaired cognition. Cognitive impairments and related altered connectivity patterns were found to be especially predominant in male patients. These results show specific functional changes in MS as measured with MEG. Only changes in network topology were related to poorer cognitive outcome. This indicates the value of graph analysis beyond traditional structural and functional measures, with possible implications for diagnostic and/or prognostic purposes in MS. Hum Brain Mapp, 2013. © 2011 Wiley Periodicals, Inc.
Keywords: multiple sclerosis, MEG, connectivity, graph analysis, cognition, atrophy
INTRODUCTION
Multiple sclerosis (MS) is a chronic, inflammatory demyelinating and neurodegenerative disease, with focal lesions developing in the gray and white matter, and with diffuse changes indicative of axonal damage in tissue surrounding lesions. Brain atrophy and cognitive impairment are also common in this disease [Calabrese et al., 2009; Chiaravalloti and DeLuca, 2008]. In MS, a “clinico‐radiological paradox” has been observed, i.e., structural damage alone only modestly explains clinical and cognitive functioning [Barkhof, 2002; Kincses et al., 2011]. In view of the widespread structural damage, it may be expected that MS patients display changes in brain network connectivity. As cognition requires efficient and integrated communication between different brain areas, a loss of functional connectivity between different brain areas may be expected to cause cognitive impairment.
Connectivity‐based studies are commonly used to study neurological disease. This field, recently termed “connectomics” [Sporns et al., 2005], has shown several clinically relevant findings in neurological disorders using functional [Stam, 2010], as well as structural [Roosendaal et al., 2009] measures of connectivity. Resting state functional connectivity studies are becoming more common in the assessment of whole‐brain connectivity in neurological disease. It has been shown that networks that are active during the resting state relate closely to brain structure [Honey et al., 2009], although that interrelationship is not fully understood.
Resting state MEG analyses have been successfully applied to study functional brain network changes in several conditions, such as Alzheimer's disease (AD) [Stam et al., 2009], Parkinson's disease (PD) [Stoffers et al., 2008] and brain tumors [Douw et al., 2008]. Graph analysis of this data can be used for an overall description of whole‐brain networks in neurological disease and is based on the representation of a network as a graph which displays a network as a set of nodes (vertices) and their weighted connections (links or edges, with a number representing the strength of the connection on a scale between 0 and 1). Using this graph, network architecture is analyzed using various measures such as clustering coefficient, a measure of local connectivity, and path length, a measure of overall network efficiency [Bullmore and Sporns, 2009]. These distinct measures are very suitable for relating the amount of structural damage to functional changes in the brain, and to relate aforementioned functional changes to clinicocognitive measures.
Data on MS using MEG are limited [Cover et al., 2006; Dell'Acqua et al., 2010; Tecchio et al., 2008]. As multiple sclerosis features extensive neuroaxonal damage, it may be expected that patterns of connectivity and network topology will be altered, which may then be measured by graph analytical parameters. Especially the relationship between such functional changes and clinical/cognitive functioning in MS is as of yet unclear. In this study, we used resting‐state MEG to study changes in functional connectivity in MS patients. By investigating changes in the different frequency bands in MS combined with cognition and brain volumetry we aim to illustrate the brain's functional response to MS structural damage, and to investigate the clinical relevance of these functional changes.
METHODS
Participants
Thirty‐four patients (17 males, mean age 41.4 ± 8.0 years, disease duration 8.1 ± 1.6 years) and 28 controls (14 males, mean age 39.8 ± 10.5 years) were matched for age and level of education [Verhage, 1964]. All patients were diagnosed with clinically‐definite multiple sclerosis (CDMS) [Polman et al., 2005], specifically the relapsing remitting form of MS (RRMS) [Lublin and Reingold, 1996], and were part of a cohort that has been followed for five to seven years since diagnosis. Physical disability was measured using the Expanded Disability Status Scale (EDSS) [Kurtzke, 1983] and found to be relatively mild (median, 2; range, 0–4.5). In all subjects, functional connectivity as determined by resting‐state MEG and cognitive function were measured. All controls, and all but two patients who refused assessment due to claustrophobia, underwent MRI scanning. In all subjects who underwent MRI scanning, lesion and brain volumes were assessed. The study was approved by the institutional ethics review board and all subjects gave written informed consent prior to participation.
Magnetoencephalography
MEG scans were recorded using a 151‐channel whole‐head MEG system (CTF systems; Port Coquitlam, BC, Canada) while participants were in a supine position in a magnetically shielded room (Vacuumschmelze, Hanau, Germany). A third‐order software gradient [Vrba et al., 1999] was used with a recording passband of 0.25–125 Hz and a sample frequency of 625 Hz. Participants had to be free of any metal. Magnetic fields were recorded during a no‐task, eyes‐closed condition for five consecutive minutes. At the beginning and end of each recording, the head position relative to the coordinate system of the helmet was determined by leading small alternating currents through three head position coils attached to the left and right preauricular points and the nasion on the subjects' head. Changes in head position of <1.5 cm during a recording condition were accepted. Fourteen channels were excluded due to scanner‐related artefacts in several subjects, leaving 137 channels from which five artefact‐free epochs per subject were selected, resulting in 30 s of data per subject. All epochs were visually screened for head or eye movements or other muscle artifacts by experienced raters (MvdM and MS). These were band‐pass filtered into standard frequency bands: delta (0.5–4 Hz), theta (4–8 Hz), lower alpha (8–10 Hz), upper alpha (10–13 Hz), beta (13–30 Hz), and gamma (30–45 Hz).
Magnetic Resonance Imaging
Two patients refused additional MRI due to claustrophobia, but had received previous MRI scans confirming their diagnosis. All other subjects underwent an MRI scan using a 3T‐MR system (GE Signa HDXT, V15M), using a 3D‐T1 FSPGR sequence (TR 7.8 ms, TE 3.0 ms, TI 450 ms, 1 mm3 voxel size), as well as 2D dual echo PD/T2 (TR 9680 ms, TE 22/112 ms) and 2D spin echo T1‐weighted imaging (TR 475 ms, TE 9.0 ms), containing 48 slices of 3 mm, covering the entire brain with an in‐plane resolution of 0.4 mm × 0.4 mm for PD/T2‐ and T1. All scans were visually inspected and lesions were marked by an experienced rater (MS). Subsequently, lesion volumes were quantified. All lesion volumetric analyses were performed using Alice (Perceptive informatics Inc.) applying a local thresholding technique. The ratio between T1‐ and T2‐based volumes was used as a measure of lesion damage for regression analyses. Total gray matter, total white matter, and whole brain volumes, corrected for head size, were measured using the FSPGR images and SIENAX [Smith et al., 2002] version 2.5 (part of FSL 4.1, FMRIB's Software Library, http://www.fmrib.ox.ac.uk/fsl).
Neuropsychological Evaluation
All subjects underwent a comprehensive set of neuropsychological tests. As part of this set, the Brief Repeatable Battery for Neurological disease (BRB‐N) [Rao, 1990] was used, consisting of the selective reminding test (SRT), the 10/36 spatial recall test (SPART), the symbol digit modalities test (SDMT), the paced auditory serial addition test (PASAT) and the word list generation test (WLG). In addition to the BRB‐N, in all but two patients and three controls, the concept shifting test (CST), the Stroop color‐word test and the memory comparison test (MCT) were also administered [Lezak, 2004].
The PASAT was post hoc excluded from further analyses as all patients had performed this task repeatedly in the past and showed significant learning effects compared with controls.
Individual test scores were converted to z‐scores, using the means and standard deviations of the entire control group. Z‐scores were summarized into seven cognitive domains: executive functioning (CST, WLG), verbal memory (SRT), information processing speed (SDMT), visuospatial memory (SPART), working memory (MCT), attention (Stroop), and psychomotor speed (CST, SDMT). Construction of these domains with comparable cognitive tests has been reported previously and was based on a principal component analysis using varimax rotation with Kaiser normalization performed on the z‐scores of a large group of healthy controls [Klein et al., 2003].
MEG Functional Connectivity
Synchronization
To reliably and sensitively detect changes in connectivity the brain MEG time series were entered into locally developed software DIGEEGXP2, where synchronization likelihood (SL) [Montez et al., 2006; Stam and van Dijk, 2002] was applied to calculate the level of synchronization between all included channels in each of the analyzed frequency bands. Using SL, two dynamic systems are assumed, for instance two neural networks designated X and Y. Time series x i and y i are recorded from both neural networks. The general problem is to infer functional interactions between X and Y from x i and y i. The current assumption regarding functional connectivity states that the more x i and y i display statistical interdependence the stronger X and Y interact. This resemblance can be quantified by several measures, such as coherence or cross‐correlation. However, it has been shown that X and Y can interact even when x i and y i do not resemble each other in a simple way. This more complicated concept, called generalized synchronization, implies that the state of Y is a function of the state of X. SL is a way to quantify this generalized synchronization [Rulkov et al., 1995] and takes linear as well as nonlinear synchronization between two time series into account. This is done by dividing each time series into a series of short patterns (brief intervals of time series containing a few cycles of the dominant frequency). Synchronization likelihood is then the chance that recurrences in X coincide with recurrences in Y, irrespective of the simple resemblance between x i and y i. SL fluctuates around P ref (a small positive value) in the case of fully independent signals, and reaches 1 in the case of fully synchronized signals. The variable P ref has to be chosen, and was set at 0.01 (the most commonly used value) in the current study. It therefore represents the small but nonzero chance of pattern recurrence in independent time series. All other variables needed for computing SL are automatically determined using a process described in [Montez et al., 2006] (see also for more in‐depth description of SL). It should be noted that SL suffers from the same common source confounds as other benchmark measures like coherence, leaving some inherent level of error due to volume conduction, although this is expected to be equal between groups. SL has been applied to many EEG and MEG datasets (some examples below) as well as fMRI [Sanz‐Arigita et al., 2010] and has also been compared with coherence in a dataset comparing Alzheimer's disease patients to controls [Stam et al., 2006].
Synchronization likelihoods between all combinations of the 137 included channels were determined, providing us with a 137 × 137 matrix of SL values. To reduce noise and the number of comparisons, three averages of connectivity were calculated per band, a procedure which has been used on many datasets [Douw et al., 2008; Olde Dubbelink et al., 2008; Stoffers et al., 2008; van Duinkerken et al., 2009]: (1) short‐distance: synchronization within one region, respectively left and right frontal, parietal, central, occipital, and temporal, (2) intrahemispheric: synchronization between two different regions in the ipsilateral hemisphere, respectively the fronto‐temporal, fronto‐parietal, parieto‐occipital, and occipito‐temporal regions, both for the left and right hemisphere, and (3) interhemispheric: synchronization between the left and right frontal, central, parietal, temporal, and occipital MEG regions.
Graph analysis
Graph analysis [Bullmore and Sporns, 2009] was used to analyze various properties of the functional networks. Here, SL matrices were used to calculate two weighted graph analytical parameters, namely the clustering coefficient (C w) and the characteristic path length (L w). C w measures local connectivity of a region, specifically the likelihood that neighbors of a vertex will also be connected, indicating the tendency to form local clusters. The average weighted path length L w signifies the average highest connectivity of edges connecting any two vertices and is a measure for global integration of the network. Whole‐network averages of C w and L w were calculated. All parameters were based on a weighted representation of a network, i.e., C w and L w instead of C and L, describing nonthresholded networks represented by one node per channel, and one weighted vertex per functional connection. For a more detailed description of calculation of the weighted clustering coefficient C w and weighted average shortest path length L w, see [Stam et al., 2009]. To be able to compare functional network parameters optimally, each graph parameter was also divided by averaged parameters of 50 randomly generated networks (C w‐s and L w‐s), generated by randomly reshuffling edge weights as described in [Humphries and Gurney, 2008]. The resulting values (C w/C w‐s, also named γ, and L w/L w‐s, λ) therefore describe how close a person's network topology is to that of random networks, enabling an estimation of how random or regular the network of a person is, with small‐world networks [Watts and Strogatz, 1998] typically displaying beneficial aspects of both regular and random networks.
Statistical Analysis
Variables were checked for normality using the Kolmogorov‐Smirnov test in SPSS 15.0 for Windows together with histogram inspection. Where normality was not found, variables were transformed to normality. All MEG variables were transformed to normality using (1/x). All analyses used gender as a covariate.
Synchronization likelihood
Similar to earlier studies [Douw et al., 2008; Olde Dubbelink et al., 2008; Stoffers et al., 2008; van Duinkerken et al., 2009], a repeated measures general linear model (GLM) was used to analyze each frequency band regarding SL differences between patients and controls. Per frequency band, three analyses were performed, one for each synchronization average (short‐distance, intrahemispheric and interhemispheric). Here, the synchronization values were used as the repeated measures factor and group (patient or control) as between‐subjects factor. Those variables that displayed a significant main effect for group or an interaction effect involving group (P values of Greenhouse‐Geisser correction for sphericity) were entered into a subsequent post‐hoc multivariate GLM analysis to identify specific SL differences per band. This process was done to reduce the number of variables for the post‐hoc GLM, as well as to account for the nature of MEG signals, treating them as repeated measurements of the same system (i.e., the brain). As the MEG measurements can be divided into three different groups (short‐distance, intra‐ and interhemispheric), these were separately analyzed. This statistical process is identical to earlier studies (see above), ensuring between‐study comparability. To illustrate the reproducibility and to highlight possible effects induced by choosing a specific connectivity measure, the abovementioned connectivity analysis was also repeated using the benchmark measure phase coherence (PC). Graph analysis and relations with cognition were only explored using SL.
Graph analysis, cognition, and brain volume
Graph analytical parameters, cognitive domain Z‐scores and brain volumes were analyzed using three multivariate GLM analyses, with group (patient or control) as a fixed factor to determine differences between patients and controls. Relations between connectivity, atrophy and cognition were investigated using linear regression of the data, see below.
Linear regression of cognitive domains
Stepwise linear regression was used to predict cognition. To limit multiple comparison problems, only those cognitive, MRI, SL, and graph analytical parameters found to be significantly different between patients and controls were used as predictors in the regression model. Synchronization values that were significantly different between patients and controls were averaged into one mean per band to reduce the amount of variables. To avoid problems regarding the averaging of unrelated synchronization values, all synchronization values were converted into Z‐scores before averaging. Cognitive Z‐scores were predicted using the mean SL Z‐values, significant graph analytical parameters, normalized whole‐brain volume (NBV), EDSS (dichotomized into above or below the median, i.e. 2), gender and T1/T2 lesion volume ratio. Spearman's rho was used to assess correlation strengths with the main predictor of cognition and the individual cognitive domain.
RESULTS
Synchronization Likelihood: Repeated Measures GLM
Repeated measures GLM analyses revealed an interaction between group (patient or control) and synchronization type (short‐distance, intrahemispheric and interhemispheric) for theta (F[1,59] = 3.75 P = 0.02) and upper alpha (F[1,59] = 4.30 P < 0.01) interhemispheric synchronization (Greenhouse‐Geisser corrected p value for both). A main effect of group was found for lower alpha (F[1,59] = 6.16, P = 0.02), theta (F[1,59] = 7.98, P = 0.006) and beta (F[1,59] = 5.89, P = 0.02) intrahemispheric synchronization.
Synchronization Likelihood: Post‐Hoc Multivariate GLM
See Table II and Figure 1 for post‐hoc multivariate GLM results, revealing interhemispheric synchronization to be increased in occipital and parietal regions in the theta band, while the interhemispheric temporal synchronization is lowered in the upper alpha band. Intrahemispheric increases in synchronization are seen bilaterally in the theta (left temporo‐ and parieto‐occipital and right fronto‐parietal, fronto‐temporal and temporo‐occipital areas), lower alpha (left and right parieto‐occipital, as well as right temporo‐occipital areas) and beta bands (left and right parieto‐occipital, as well as right fronto‐temporal, and temporo‐occipital areas). See Figure 2 for means and standard deviations of significantly changed SL values.
Table II.
Synchronization Likelihood and graph measures in bands and regions showing differences between patients and controls
| Connectivity | Controls | Patients | ||||
|---|---|---|---|---|---|---|
| Mean | SD | Mean | SD | F | P | |
| Theta band | ||||||
| *, aLeft parieto‐occipital | 0.032 | 0.008 | 0.040 | 0.012 | 12.52 | 0.001 |
| *Left temporo‐occipital | 0.022 | 0.004 | 0.024 | 0.003 | 10.27 | 0.002 |
| Right fronto‐parietal | 0.013 | 0.002 | 0.013 | 0.002 | 6.30 | 0.02 |
| Right fronto‐temporal | 0.021 | 0.004 | 0.023 | 0.005 | 4.30 | 0.04 |
| Right temporo‐occipital | 0.021 | 0.003 | 0.023 | 0.004 | 6.27 | 0.02 |
| *Interhemispheric occipital | 0.040 | 0.010 | 0.051 | 0.014 | 12.03 | 0.001 |
| interhemispheric parietal | 0.033 | 0.008 | 0.043 | 0.014 | 11.79 | 0.001 |
| Lower alpha band | ||||||
| *, aLeft parieto‐occipital | 0.043 | 0.015 | 0.054 | 0.020 | 8.32 | 0.005 |
| *, aRight parieto‐occipital | 0.040 | 0.011 | 0.051 | 0.022 | 7.57 | 0.008 |
| *, aRight temporo‐occipital | 0.028 | 0.006 | 0.034 | 0.013 | 6.78 | 0.01 |
| *, aClustering coefficient (γ) | 1.26 | 0.07 | 1.29 | 0.07 | 6.02 | 0.02 |
| Characteristic path length (λ) | 1.24 | 0.06 | 1.28 | 0.08 | 5.17 | 0.03 |
| Upper alpha band | ||||||
| Interhemispheric temporal | 0.033 | 0.011 | 0.027 | 0.007 | 9.56 | 0.003 |
| Beta band | ||||||
| Left parieto‐occipital | 0.030 | 0.007 | 0.036 | 0.011 | 6.71 | 0.01 |
| Right fronto‐temporal | 0.017 | 0.002 | 0.019 | 0.004 | 5.44 | 0.02 |
| Right parieto‐occipital | 0.028 | 0.006 | 0.033 | 0.008 | 6.79 | 0.01 |
| Right temporo‐occipital | 0.019 | 0.002 | 0.020 | 0.002 | 5.61 | 0.02 |
Indicates gender as a significant covariate.
Indicates significant differences in male patients only.
Figure 1.

Synchronization likelihood changes in MS patients compared with healthy controls in each significant frequency band (red indicates increases, blue decreases).
Figure 2.

Barchart of mean Synchronization Likelihood (SL) values (and standard deviations) that are significantly different between patients and controls (note that original, untransformed values are represented here). F, frontal; P, parietal; T, temporal; O, occipital; inter, interhemispheric.
Phase Coherence
The abovementioned analysis was repeated using PC, which showed similar results in theta (F[1,59] = 5.67 P < 0.01) and upper alpha (F[1,59] = 4.57 P < 0.01) interhemispheric PC, as well as lower alpha (F[1,59] = 4.27, P = 0.04), theta (F[1,59] = 7.51, P = 0.008), and beta (F[1,59] = 5.81, P = 0.02) intrahemispheric PC. Unlike SL, an effect for interhemispheric PC was also found in the beta band (F[1,59] = 3.89, P = 0.02) as well as local PC in the theta (F[1,59] = 4.96, P = 0.03) and beta (F[1,59] = 5.80, P = 0.02) bands. Post‐hoc analyses revealed largely similar patterns in group differences to SL in all bands, while some small differences were also present. The theta band lacked an effect of right fronto‐parietal and fronto‐temporal PC, while additional effects for right parieto‐occipital and local bilateral local occipital PC were found. In the lower alpha band no effect in right temporo‐occipital areas was found. In the upper alpha band results were identical, while the beta band showed no effect for right fronto‐temporal PC, with additional effects for bilateral local occipital PC, as well as interhemispheric PC in frontal, central, parietal and occipital areas.
Graph Analysis
Graph analytical parameters (i.e., clustering coefficient, γ, and characteristic path length, λ) were only found to be significantly different in the lower alpha band (γ: F[1,59] = 6.02, P = 0.02, λ: F[1,59] = 5.17, P = 0.03), where both parameters were significantly increased in patients, indicating a more regular (or less randomly organized) network.
Cognition and Brain Volume
Of the cognitive domains assessed, only working memory (F[1,52] = 4.24, P = 0.04) and attention (F[1,52] = 7.36, P = 0.009) were significantly impaired in the patient group (see Table I). Normalized grey (NGMV), white (NWMV) and whole‐brain (NBV) volumes were reduced in the patient group (NGMV: F[1,57] = 7.27, P = 0.009, NWMV: F[1,57] = 11.89, P = 0.001, NBV: F[1,57] = 12.38, P = 0.001).
Table I.
Descriptive variables for controls and patients
| Controls | Patients | |||||
|---|---|---|---|---|---|---|
| Mean | SD | Mean | SD | F | P | |
| Age (yrs) | 39.82 | 10.54 | 41.38 | 8.04 | t = −0.66 | 0.51 |
| Education (1–7) | 5.46 | 1.73 | 5.15 | 1.42 | Z = −0.29 | 0.77 |
| NGMV (l) | 0.85 | 0.05 | 0.82 | 0.04 | 7.27 | <0.01 |
| NWMV (l) | 0.69 | 0.04 | 0.66 | 0.03 | 11.89 | <0.01 |
| NBV (l) | 1.54 | 0.07 | 1.48 | 0.06 | 12.38 | <0.01 |
| Executive Functioning (Z) | 0.03 | 0.70 | −0.25 | 1.06 | 1.08 | 0.30 |
| Verbal Memory (Z) | 0.03 | 0.79 | −0.49 | 1.10 | 2.32 | 0.13 |
| Information Processing (Z) | 0.01 | 1.08 | −0.14 | 1.37 | 0.37 | 0.55 |
| Visuospatial Memory (Z) | 0.09 | 1.13 | −0.04 | 0.90 | 0.42 | 0.52 |
| Working Memory (Z) | 0.10 | 0.91 | −0.50 | 1.05 | 4.25 | 0.04 |
| Attention (Z) | 0.10 | 0.52 | −0.34 | 0.80 | 7.36 | 0.01 |
| Psychomotor Speed (Z) | 0.02 | 0.83 | −0.21 | 1.19 | 0.87 | 0.36 |
| EDSS (1–10)a | 2 | (0−4.5) | ||||
| T1 volume (ml) | 1.11 | 1.68 | ||||
| T2 volume (ml) | 2.48 | 2.83 | ||||
| T1/T2 ratio | 0.43 | 0.19 | ||||
NGMV, normalized gray matter volume; NWMV, normalized white matter volume; NBV, normalized brain volume; EDSS, expanded disability status scale.
Indicates median and range.
Linear Regression of Cognition
Linear stepwise regression of attention (model adjusted R 2 = 0.14, F[1,29] = 5.71, P = 0.024) and working memory (model adjusted R 2 = 0.19, F[1,29] = 7.81, P = 0.009) using clinical, MRI, and MEG parameters resulted only one significant predictor in both domains: The lower alpha band clustering coefficient (standardized β = −0.41, t = 2.39, P = 0.02 and standardized β = −0.46, t = 2.80, P = 0.009, respectively). Interestingly, no structural brain measure predicted cognition in this model. Note that this automatically resulted in these measures being used as covariates in the regression analysis. On its own γ displayed a positive correlation with attention in women, and a negative correlation in men, although not significantly (Spearman's rho = 0.48, P = 0.06 in women, rho = −0.43, P = 0.08 in men).
Gender Effects
In the GLM models gender was a significant covariate for six out of fifteen MEG synchronization parameters (see Table II), i.e., three in the theta band (average F[3,59] = 6.84, P = 0.01) and three in the lower alpha band (average F[3,59] = 7.98, P = 0.01). Gender was also a significant covariate for lower alpha band γ (F[3,59] = 10.85, P = 0.002), NGMV (F[3,57] = 4.25, P = 0.04), NWMV (F[3,57] = 4.63, P = 0.04) and both cognitive domains (working memory, F[3,52] = 4.42, P = 0.04, and attention, F[3,52] = 4.05, P = 0.05). These variables were assessed further using a final multivariate GLM model, using a four level group factor (male/female control or patient). Post‐hoc Bonferroni analyses revealed men with MS to display significant changes in four of the synchronization parameters compared to healthy men (all increased, one in the theta band (left parieto‐occipital SL, P = 0.007), three in the lower alpha band (average P = 0.02, see Table II), as well as NGMV and NWMV (decreased, P = 0.02 and 0.002, respectively) and attention (decreased, P = 0.04). Female patients did not show any significant differences with female controls on any of these variables at this stage of the disease. See Figures 3 and 4 for lower alpha band γ and cognitive Z‐score values for male and female patients and controls.
Figure 3.

Boxplot of lower alpha band clustering coefficient (γ) for all groups (female and male controls and patients).
Figure 4.
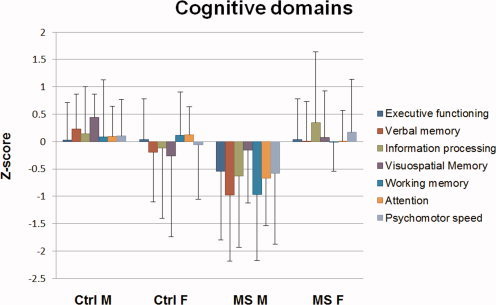
Cognitive domains (mean and standard deviation of Z‐scores) for male (M) and female (F) controls (Ctrl) and MS patients.
Mann‐Whitney U‐tests revealed no differences between male and female patients regarding disease duration (mean 7.86 (±0.93) and 8.32 (±2.04), respectively, Z = −0.05, P = 0.97), EDSS (mean 1.94 (±1.09) and 2.12 (±1.28), respectively, Z = −0.45, P = 0.65), T1‐volume (mean 12.70 (±22.65) and 9.71 (±9.63), respectively, Z = −0.36, P = 0.72) or T2‐volume (mean 32.23 (±37.53) and 18.16 (±14.94), respectively, Z = −0.74, P = 0.46).
DISCUSSION
MEG recordings showed increased synchronization in the theta, lower alpha and beta bands and decreased synchronization in the upper alpha band of MS patients. Regional changes were mainly seen in bilateral occipital, parietal and temporal, and right frontal regions. The lower alpha band additionally displayed increased clustering coefficient and path length values, indicating a change towards a more regular network topology [Bullmore and Sporns, 2009; Watts and Strogatz, 1998]. This is the first time this pattern of MEG findings is described in MS, with the exception of decreased interhemispheric synchronization in the alpha band, which has previously been found [Cover et al., 2006].
Patients were also found to have cognitive impairments in attention and working memory, which were related to lower alpha band γ especially. Although SL changes were found in the beta and theta bands in MS patients, this was not related directly to cognitive disturbances. Previous research has shown decreased theta coherence to be especially present in progressive MS patients with cognitive impairment [Leocani et al., 2000], although a direct relationship was not described. The lower alpha band has previously been related to attention [Klimesch et al., 1998] and working memory [Stam, 2000] during task states. It is interesting, however, that specific regional increases in synchronization could not be related to cognition in this study, perhaps due to a lack of statistical power. Interestingly, for both cognitive domains affected in these patients, we only found a relationship with the clustering coefficient of the lower alpha band, describing local network topology, but not regional SL changes. The increase in γ indicates that a move towards regular topology disrupts cognitive functioning. Theoretically, any move from the normal small‐world topology of the brain should result in a decrease of the efficiency of information processing and/or transfer. In the case of MS, the observed increased localization (clustering) of brain function may therefore indeed be expected to result in a reduced efficiency of communication between networks. In the case of Alzheimer's disease, a disease with extensive cognitive dysfunction, a more random network is present [Stam et al., 2008], underlining that any deviation from “normal” could potentially be detrimental to cognition. More research is required, however, to determine the exact relevance of having a particular type of network to cognitive function. No other functional or structural measure apart from lower alpha band γ was found to be related to cognition, although atrophy was apparent. However, atrophy and cognitive impairment are known to be related [Filippi et al., 2010], thus more sensitive (regional) atrophy measures are probably required at this stage of the disease. These results indicate the value of graph analysis beyond traditional structural measures, i.e., lesion volumes and whole‐brain atrophy, and functional measures, i.e., regional synchronization, and may indicate a possible added value for graph analysis in diagnostic and/or prognostic purposes in MS.
Interestingly, these results show increases in synchronization in MS patients. Previous functional MRI research in RRMS has so far only shown increased activation at the earliest stage of the disease, namely in clinically isolated syndrome [Roosendaal et al., 2010], a group with largely preserved cognitive functioning. In fact, changes in synchronization have not been found in RRMS before, whereas in progressive stages of the disease, decreases in synchronization were already described [Rocca et al., 2010]. This discrepancy might be explained by the fundamental differences between fMRI and MEG, as fMRI cannot detect high frequency changes.
What this increased synchronization exactly represents in terms of underlying pathobiological mechanisms remains unclear. It could represent compensation in the network, i.e., a “boosted” synchronous activity to compensate for the increased structural damage present in the brain. Given that in healthy subjects the lower alpha band has been shown to be related with attention and working memory, i.e., the cognitive domains that were impaired in our patient group, increased synchronization in this band, accompanied by decreased synchronization in the higher alpha band, together might indicate a compensatory mechanism to maintain cognitive function. More specifically, the decreased synchronization in the higher alpha band might entail a shift in alpha band activity to lower frequencies. However, these results should not be overinterpreted, as the measured change in γ (equally based on SL measures) in the lower alpha band was directly related to poorer cognitive performance. The increased synchronization in the theta and beta bands is more difficult to explain, as they did not appear to be related to cognition directly and no additional information could be obtained for these bands through a more sophisticated network measure like γ.
One possible cause for the overall increase in synchronization in MS patients could be a loss of inhibition (e.g., due to damaged inhibitory interneurons, although obviously excitatory neurons might be damaged as well). This is, however, speculation at this point in time, where MEG measures in a complex disease like MS are still largely being explored. As previous research in fMRI studies has shown increases in activity to be prevalent already in the earliest stages of the disease, further MEG research in different patient groups (i.e., CIS and SPMS) is now certainly opportune.
With several different connectivity methods available, it may be difficult to determine which measure best applies to the particular question at hand. The current study adopted SL as an analysis method, but future systematic studies should investigate in more detail the relative usefulness of different connectivity measures and their putative complementarity or relative strengths/weaknesses, both in the fields of EEG/MEG and fMRI research. To illustrate the reproducibility and robustness of the connectivity analysis, it was repeated using a different measure, i.e, PC, which showed largely similar results. Small (topological) differences between SL and PC were also detected, which emphasizes that different connectivity measures may be complementary. This should be investigated in a future study that is specifically designed to answer this question. Although beyond the scope of the current study, this important aspect of connectivity research has yet to be investigated thoroughly.
In this group of patients, matched for age and level of education, gender was shown to be of influence on several SL values, as well as on γ, NGMV, NWMV, and cognition, which all differed from controls in male patients only. As patients did not differ regarding disability, disease duration and lesion load, this finding indicates that men are especially affected at this stage of the disease, as compared with women with RRMS. Interestingly, it appears that the move towards regular topology in the lower alpha band could initially be beneficial to cognition in less severely affected patients, as seen by the trend for a positive correlation between γ and attention in the female patient group of this study. A larger move towards regularity, however, can be associated with cognitive decline, as seen by the trend for a negative correlation in the male group, who also displayed more atrophy and cognitive disturbances. However, these results will have to be verified in a larger group, as insufficient statistical power hampers these conclusions here.
Our results indicate a specific pattern of changes in functional connectivity in MS patients, and especially in men. The relationship of these specific regional changes to cognition could not be shown in the current study, probably due to power issues, which also limits the possibility for strong conclusions regarding gender. It seems plausible, however, that specific regional changes influence cognition more than others, as some structures relate closer to cognition than others. The specific locations of SL changes will need to be investigated further in larger groups and/or with more advanced techniques such as modularity, as these could provide more specific and/or different information regarding MS pathology. Future research is also required to investigate whether this pattern of change in connectivity is due to structural damage only or if patients also display additional, uniquely functional, changes that may be relatively independent.
CONCLUSION
In summary, we have demonstrated functional changes in MS as measured with resting state MEG. These functional connectivity changes are clinically relevant, especially those in the lower alpha band, and show gender‐specific patterns of change in the different frequency bands.
REFERENCES
- Barkhof F ( 2002): The clinico‐radiological paradox in multiple sclerosis revisited. Curr Opin Neurol 15: 239–245. [DOI] [PubMed] [Google Scholar]
- Bullmore E, Sporns O ( 2009): Complex brain networks: Graph theoretical analysis of structural and functional systems. Nat Rev Neurosci 10: 186–198. [DOI] [PubMed] [Google Scholar]
- Calabrese M, Agosta F, Rinaldi F, Mattisi I, Grossi P, Favaretto A, Atzori M, Bernardi V, Barachino L, Rinaldi L, Perini P, Gallo P, Filippi M ( 2009): Cortical lesions and atrophy associated with cognitive impairment in relapsing‐remitting multiple sclerosis. Arch Neurol 66: 1144–1150. [DOI] [PubMed] [Google Scholar]
- Chiaravalloti ND, DeLuca J ( 2008): Cognitive impairment in multiple sclerosis. Lancet Neurol 7: 1139–1151. [DOI] [PubMed] [Google Scholar]
- Cover KS, Vrenken H, Geurts JJ, van Oosten BW, Jelles B, Polman CH, Stam CJ, van Dijk BW ( 2006): Multiple sclerosis patients show a highly significant decrease in alpha band interhemispheric synchronization measured using MEG. Neuroimage 29: 783–788. [DOI] [PubMed] [Google Scholar]
- Dell'Acqua ML, Landi D, Zito G, Zappasodi F, Lupoi D, Rossini PM, Filippi MM, Tecchio F ( 2010): Thalamocortical sensorimotor circuit in multiple sclerosis: an integrated structural and electrophysiological assessment. Hum Brain Mapp 31: 1588–1600. [DOI] [PMC free article] [PubMed] [Google Scholar]
- Douw L, Baayen H, Bosma I, Klein M, Vandertop P, Heimans J, Stam K, de MJ, Reijneveld J ( 2008): Treatment‐related changes in functional connectivity in brain tumor patients: a magnetoencephalography study. Exp Neurol 212: 285–290. [DOI] [PubMed] [Google Scholar]
- Filippi M, Rocca MA, Benedict RH, DeLuca J, Geurts JJ, Rombouts SA, Ron M, Comi G ( 2010): The contribution of MRI in assessing cognitive impairment in multiple sclerosis. Neurology 75: 2121–2128. [DOI] [PMC free article] [PubMed] [Google Scholar]
- Honey CJ, Sporns O, Cammoun L, Gigandet X, Thiran JP, Meuli R, Hagmann P ( 2009): Predicting human resting‐state functional connectivity from structural connectivity. Proc Natl Acad Sci USA 106: 2035–2040. [DOI] [PMC free article] [PubMed] [Google Scholar]
- Humphries MD, Gurney K ( 2008): Network ‘small‐world‐ness’: A quantitative method for determining canonical network equivalence. PLoS One 3: e0002051. [DOI] [PMC free article] [PubMed] [Google Scholar]
- Kincses Z, Ropele S, Jenkinson M, Khalil M, Petrovic K, Loitfelder M, Langkammer C, Aspeck E, Wallner‐Blazek M, Fuchs S, Jehna M, Schmidt R, Vecsei L, Fazekas F, Enzinger C ( 2011): Lesion probability mapping to explain clinical deficits and cognitive performance in multiple sclerosis. Mult Scler 17: 681–689. [DOI] [PubMed] [Google Scholar]
- Klein M, Engelberts NH, van der Ploeg HM, Kasteleijn‐Nolst Trenite DG, Aaronson NK, Taphoorn MJ, Baaijen H, Vandertop WP, Muller M, Postma TJ, Heimans JJ ( 2003): Epilepsy in low‐grade gliomas: The impact on cognitive function and quality of life. Ann Neurol 54: 514–520. [DOI] [PubMed] [Google Scholar]
- Klimesch W, Doppelmayr M, Russegger H, Pachinger T, Schwaiger J ( 1998): Induced alpha band power changes in the human EEG and attention. Neurosci Lett 244: 73–76. [DOI] [PubMed] [Google Scholar]
- Kurtzke JF ( 1983): Rating neurologic impairment in multiple‐sclerosis—An expanded disability status scale (Edss). Neurology 33: 1444–1452. [DOI] [PubMed] [Google Scholar]
- Leocani L, Locatelli T, Martinelli V, Rovaris M, Falautano M, Filippi M, Magnani G, Comi G ( 2000): Electroencephalographic coherence analysis in multiple sclerosis: Correlation with clinical, neuropsychological, and MRI findings. J Neurol Neurosurg Psychiatry 69: 192–198. [DOI] [PMC free article] [PubMed] [Google Scholar]
- Lezak ( 2004): Neuropsychological Assessment. Oxford: Oxford University Press. [Google Scholar]
- Lublin FD, Reingold SC ( 1996): Defining the clinical course of multiple sclerosis: Results of an international survey. Neurology 46: 907–911. [DOI] [PubMed] [Google Scholar]
- Montez T, Linkenkaer‐Hansen K, van Dijk BW, Stam CJ ( 2006): Synchronization likelihood with explicit time‐frequency priors. Neuroimage 33: 1117–1125. [DOI] [PubMed] [Google Scholar]
- Olde Dubbelink KT, Felius A, Verbunt JP, van Dijk BW, Berendse HW, Stam CJ, Delemarre‐van de Waal HA ( 2008): Increased resting‐state functional connectivity in obese adolescents; a magnetoencephalographic pilot study. PLoS One 3: e2827. [DOI] [PMC free article] [PubMed] [Google Scholar]
- Polman CH, Reingold SC, Edan G, Filippi M, Hartung HP, Kappos L, Lublin FD, Metz LM, McFarland HF, O'Connor PW, Sandberg‐Wollheim M, Thompson AJ, Weinshenker BG, Wolinsky JS ( 2005): Diagnostic criteria for multiple sclerosis: 2005 Revisions to the “McDonald Criteria”. Ann Neurol 58: 840–846. [DOI] [PubMed] [Google Scholar]
- Rao SM ( 1990): A manual for the Brief Repeatable Battery of Neuropsychological Tests in Multiple Sclerosis: Medical College of Wisconsin: Milwaukee, WI. [Google Scholar]
- Rocca MA, Valsasina P, Absinta M, Riccitelli G, Rodegher ME, Misci P, Rossi P, Falini A, Comi G, Filippi M ( 2010): Default‐mode network dysfunction and cognitive impairment in progressive MS. Neurology 74: 1252–1259. [DOI] [PubMed] [Google Scholar]
- Roosendaal SD, Geurts JJ, Vrenken H, Hulst HE, Cover KS, Castelijns JA, Pouwels PJ, Barkhof F ( 2009): Regional DTI differences in multiple sclerosis patients. Neuroimage 44: 1397–1403. [DOI] [PubMed] [Google Scholar]
- Roosendaal SD, Schoonheim MM, Hulst HE, Sanz‐Arigita EJ, Smith SM, Geurts JJ, Barkhof F ( 2010): Resting state networks change in clinically isolated syndrome. Brain 133: 1612–1621. [DOI] [PubMed] [Google Scholar]
- Rulkov NF, Sushchik MM, Tsimring LS, Abarbanel HD ( 1995): Generalized synchronization of chaos in directionally coupled chaotic systems. Phys Rev E Stat Phys Plasmas Fluids Relat Interdiscip Topics 51: 980–994. [DOI] [PubMed] [Google Scholar]
- Sanz‐Arigita EJ, Schoonheim MM, Damoiseaux JS, Rombouts SA, Maris E, Barkhof F, Scheltens P, Stam CJ ( 2010): Loss of ‘small‐world’ networks in Alzheimer's disease: Graph analysis of FMRI resting‐state functional connectivity. PLoS One 5: e13788. [DOI] [PMC free article] [PubMed] [Google Scholar]
- Smith SM, Zhang YY, Jenkinson M, Chen J, Matthews PM, Federico A, De Stefano N ( 2002): Accurate, robust, and automated longitudinal and cross‐sectional brain change analysis. Neuroimage 17: 479–489. [DOI] [PubMed] [Google Scholar]
- Sporns O, Tononi G, Kötter R ( 2005): The human connectome: A structural description of the human brain. PLoS Comput Biol 1: e42. [DOI] [PMC free article] [PubMed] [Google Scholar]
- Stam CJ ( 2000): Brain dynamics in theta and alpha frequency bands and working memory performance in humans. Neurosci Lett 286: 115–118. [DOI] [PubMed] [Google Scholar]
- Stam CJ ( 2010): Use of magnetoencephalography (MEG) to study functional brain networks in neurodegenerative disorders. J Neurol Sci 289: 128–134. [DOI] [PubMed] [Google Scholar]
- Stam CJ, de HW, Daffertshofer A, Jones BF, Manshanden I, van Cappellen van Walsum AM, Montez T, Verbunt JP, de Munck JC, van Dijk BW, Berendse HW, Scheltens P ( 2009): Graph theoretical analysis of magnetoencephalographic functional connectivity in Alzheimer's disease. Brain 132: 213–224. [DOI] [PubMed] [Google Scholar]
- Stam CJ, van Dijk BW ( 2002): Synchronization likelihood: An unbiased measure of generalized synchronization in multivariate data sets. Physica D‐Nonlinear Phenomena 163: 236–251. [Google Scholar]
- Stam CJ, Jones BF, Manshanden I, van Cappellen van Walsum AM, Montez T, Verbunt JP, de Munck JC, van Dijk BW, Berendse HW, Scheltens P ( 2006): Magnetoencephalographic evaluation of resting‐state functional connectivity in Alzheimer's disease. Neuroimage 32: 1335–1344. [DOI] [PubMed] [Google Scholar]
- Stoffers D, Bosboom JL, Deijen JB, Wolters EC, Stam CJ, Berendse HW ( 2008): Increased cortico‐cortical functional connectivity in early‐stage Parkinson's disease: An MEG study. Neuroimage 41: 212–222. [DOI] [PubMed] [Google Scholar]
- Tecchio F, Zito G, Zappasodi F, Dell' Acqua ML, Landi D, Nardo D, Lupoi D, Rossini PM, Filippi MM ( 2008): Intra‐cortical connectivity in multiple sclerosis: A neurophysiological approach. Brain 131: 1783–1792. [DOI] [PubMed] [Google Scholar]
- van Duinkerken E, Klein M, Schoonenboom NS, Hoogma RP, Moll AC, Snoek FJ, Stam CJ, Diamant M ( 2009): Functional brain connectivity and neurocognitive functioning in patients with long‐standing type 1 diabetes with and without microvascular complications: A magnetoencephalography study. Diabetes 58: 2335–2343. [DOI] [PMC free article] [PubMed] [Google Scholar]
- Verhage F ( 1964): Intelligentie en leeftijd: onderzoek bij Nederlanders van twaalf tot zevenenzeventig jaar. van Gorcum, Assen. [Google Scholar]
- Vrba J, Anderson G, Betts K ( 1999): 151‐Channel whole‐cortex MEG system for seated or supine positions In: Yoshimoto T, Kotani M, Kuriki S, et al., editors. Recent Advances in Biomagnetism. Sendai, Japan: Tohoku University Press. [Google Scholar]
- Watts DJ, Strogatz SH ( 1998): Collective dynamics of ‘small‐world’ networks. Nature 393: 440–442. [DOI] [PubMed] [Google Scholar]