

Abstract
Secondary sensorimotor regions are involved in sensorimotor integration and movement preparation. These regions take part in parietal‐premotor circuitry that is not only active during motor execution but also during movement observation and imagery. This activation particularly occurs when observed movements belong to one's own motor repertoire, consistent with the finding that motor imagery only improves performance when one can actually make such movement. We aimed to investigate whether imagery or observation of a movement that was never made before causes parietal‐premotor activation or that the ability to perform this movement is indeed a precondition. Nine subjects [group Already Knowing It (AKI)] could abduct their hallux (moving big toe outward). Seven subjects initially failed to make such movement (Absolute Zero A0 group). They had to imagine, observe, or execute this movement, whereas fMRI data were obtained both before and after training. Contrasting abduction observation between the AKI‐group and A0‐group showed increased left SII and supplementary motor area activation. Comparing the observation of hallux flexion with abduction showed increased bilateral SII activation in the A0 and not in the AKI group. Prolonged training resulted in equal performance and similar cerebral activation patterns in the two groups. Thereby, conjunction analysis of the correlations on subject's range of abduction during execution, imagery, and observation of hallux abduction showed exclusive bilateral SII activation. The reduced SII involvement in A0 may imply that effective interplay between sensory predictions and feedback does not take place without actual movement experience. However, this can be acquired by training. Hum Brain Mapp, 2011. © 2010 Wiley‐Liss, Inc.
Keywords: motor learning, fMRI, motor imagery, Mirror Neuron System, corollary discharge, secondary sensory
INTRODUCTION
The successful execution of purposeful movements requires an effective interplay between motor commands and somatosensory feedback [Naito, 2004]. The role of this feedback type is illustrated by, for example, the loss of somatosensory input, which may lead to severe sensory ataxia [Sainburg et al., 1995]. However, somatosensory information is implemented after movement execution has started. To establish purposeful movements, (pre‐)motor areas not only send efferent signals to the spinal cord but also to cortical somatosensory areas, especially the anterior parietal cortex. By also using “corollary discharges” [McCloskey, 1981; Poulet and Hedwig, 2007], both actual feedback stimuli and predicted feedback contribute to the optimal preparation of effective motor commands [Jäncke et al., 2001; Jenmalm et al., 2006]. The role of the anterior parietal cortex in the interaction between somatosensory feedback and the organization of motor commands is further revealed by movement disorders that arise when this part of the brain is affected by a lesion [Binkofski et al., 1998, 2001; Freund, 2003].
Higher‐order sensorimotor interactions, processed in parietal‐premotor circuitry, are not only implicated in the actual execution of movements but may also play a role during Motor Imagery (MoIm) [Decety, 1996; Jeannerod, 1994, 2001], and even in movement observation [Decety, 1996; Gazzola and Keysers, 2008; Grafton et al., 1996]. The similarity between neuronal responses during either the observation or the execution of a distinct movement was, in this respect, a reason to refer to the involved regions as the Mirror Neuron System (MNS) [Rizzolatti and Craighero, 2004]. One should consider in this respect that the MNS is a term referring to the areas where mirror neurons have been found or which show familiar features in functional imaging studies. MNS activation during motor observation appeared to occur only when movements belong to one's own motor repertoire [Buccino et al., 2004]. In conditions of an activated MNS, it could be manipulated by motor learning [Catmur et al., 2007]. This has been proposed to occur through Hebbian associations between motor activity during execution and both the vision and proprioception of our own movements [Keysers and Perrett, 2004]. Recently, our group has provided support for the importance of an existing movement repertoire by demonstrating that MoIm only leads to improved performance when one is actually able to make the imagined movement [Mulder et al., 2004]. These skill‐dependent activations in sensorimotor regions thus raise the question whether imagery or observation of a movement never made before can induce activation of parietal‐premotor circuitry or whether one needs to be able to make the actual movement before such activation takes place.
The present fMRI study aims to disentangle the role of parietal‐premotor regions in the organization of a movement subjects had never made before and which does not belong to their natural voluntary movement repertoire. Hallux abduction is such a movement many people are unable to perform when they are asked to do so for the first time, whereas after practice they can [Mulder et al., 2004]. We therefore asked subjects to respectively imagine, execute, and observe hallux abduction, which we named Unfamiliar Movement. By comparing a group of subjects that was able to abduct their hallux, the Already Knowing It (AKI) group, with a group that was not, the Absolute Zero (A0) group, we had the opportunity to study the performance of such movement and its relation with higher‐order sensorimotor regions. The AKI group was compared with the A0 group during motor imagery and movement observation of hallux abduction, both before and after training. In the imagery condition of the AKI group, we expected to see an activation of anterior parietal and premotor circuitry similar to patterns related to movement imagery of foot movements described in literature [Lafleur et al., 2002; Orr et al., 2008].
Because our group had previously demonstrated that subjects in the A0 group could not improve this “unfamiliar” movement by means of movement imagery [Mulder et al., 2004], we assumed ineffective recruitment of this motor repertoire from parietal‐premotor circuitry, and we thus expected less anterior parietal and premotor activations in these subjects compared to the AKI group. Less activation of particularly anterior parietal cortex was indeed expected during imagining a movement never made before (hallux abduction), due to the lack of somatosensory‐based information required for an effective motor representation [de Jong et al., 2002; Duffy and Burchfiel, 1971; Naito et al., 2005]. As a consequence, we assumed motor imagery of such abduction in the A0 group to be more visually oriented, nonmotor, and external‐based [Goldenberg et al., 1989], and we therefore expected more activation in visuomotor areas in the posterior parietal cortex [de Lange et al., 2005; Hyvärinen, 1982] when comparing AO with subjects in the AKI group.
During the observation of a familiar movement (flexion–extension movement of the hallux), we expected similar activations in the two groups. Furthermore, because the A0 group practiced and gained the skill to perform hallux abduction between the two scanning sessions, we expected that the cerebral activation patterns in the two groups during both imagining and observing the unfamiliar movements would become similar in the second scanning session.
MATERIALS AND METHODS
Sixteen subjects (11 females) with a dominance of the right leg and hand participated in this study (mean age, 27.6 years; SD ±5.7). None of the subjects suffered from neurological, ophthalmological, or lower extremity disorders. Nine of sixteen subjects (6 females; mean age, 25.4 years; SD ±1.9) were initially able to abduct their hallux more than 4°, that is, the AKI group, and seven could not abduct their hallux [range of motion (ROM) = 0°]. The latter (5 females; mean age, 27.4 years; SD ±3.5) constituted the A0 group. Both groups were thus matched for age and gender. Handedness was assessed using the Edinburgh Inventory of Handedness [Oldfield, 1971], which indicated a distinct dominance of the right hand and foot in all subjects. Vividness of movement imagery was assessed using the Vividness of Motor Imagery Questionnaire (VMIQ [Isaac et al., 1986]. A cut‐off value of 72 was used for inclusion. The VMIQ includes 24 items concerning imagery of movements from a first‐person perspective. For each of these items, vividness of the imagined movement has to be indicated on a five‐point scale ranging from 1 (excellent imagination) to 5 (no image at all), resulting in a summed range of 24–120. All subjects signed an informed consent to a protocol approved by the medical ethics committee of the University Medical Center Groningen.
Experimental Task Equipment
In the imagery and execution conditions, auditory stimuli (pitch 1205 Hz, duration 0.3 s) were presented via air tubes while subjects had their eyes closed. In the observation conditions, they watched a screen (display dimension 44 × 34 cm) showing a video of a moving or stationary hallux of the right foot. These scenes were projected with a beamer (resolution 1024 × 768 pixels) from an egocentric perspective. Subjects viewed the screen via a mirror placed 11 cm in front of their face. The distance between mirror and screen was 64 cm. Stimuli were presented using the “Presentation” program (Neuro Behavioral Systems, CA). To assess whether unwanted movements were made during the imagery and observation conditions, EMG recordings were obtained during the entire experiment. After cleaning the skin with alcohol, an electrode (Ag/Ag‐Cl) was placed above the right abductor hallucis longus and the reference electrode at the malleolus. The electrode wires were twisted and connected to an MR‐compatible amplifier (Brain Products, München, Germany). The EMG signal was converted into an optical signal and sent to a personal computer in the operator room (sample frequency 5000 Hz; high‐pass filter 10 Hz). During scanning, a camera provided the opportunity to watch the subject's movements.
Experimental Procedures
MR images were acquired in two sessions with a 1‐week interval. The experimental paradigm consisted of four experimental conditions and two baseline conditions (six conditions in total, Fig. 1). Before each scanning session, for each subject, the maximal abduction of the right hallux abduction in degrees deviation from the neutral position was measured (ROM). A scanning session consisted of two runs of 16 min. In the first run, the motor imagery (MoIm) and execution (MoEx) conditions were performed, and, in the second run, the two observation conditions were performed. Because of this order, we avoided that movement imagery would be influenced by observation.
Figure 1.
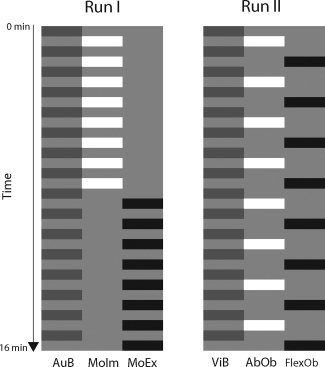
Experimental conditions. Presentation of the experimental conditions in the two runs. Each block represents the presentation of one of the experimental conditions (black or white) or their control condition (dark gray). Each block (consisting of eight stimuli) lasted 27 s (3‐s instruction followed by 24 s of stimulus presentation. Each run lasted ∼16 min.
Run 1
In the MoIm (1) and MoEx (2) condition, subjects were instructed to respectively imagine or execute right hallux abduction in response to an auditory cue, with their eyes closed. Conditions were presented in blocks that lasted 24 s. They were preceded by an auditory instruction that indicated the subsequent condition, that is, MoIm or MoEx, by the words “imagine” or “execute” (3 s, including a silent interval). In each block, eight auditory stimuli, consisting of high‐pitched beeps, were presented. To avoid stimulus anticipation, stimuli were presented with varying pseudorandomized intervals between 2 and 4 s. In the auditory baseline (AuB) condition (3), identical cues were provided, but no MoIm or MoEx had to be performed. Before either MoIm or MoEx, the auditory baseline condition (24 s) was placed, which was also auditory instructed by the word “rest.” The two experimental conditions were presented eight times each. Consequently, the AuB condition was presented 16 times. There was no low‐level baseline other than AuB, which was followed by silent intervals varying between 2 and 4 s. The MoIm blocks preceded MoEx. They were not arranged in random order as to avoid an effect of hallux abduction on imagining this movement (in AKI). This enabled the optimal comparison of MoIm between AKI and AO.
Run 2
In the observation condition, subjects watched a video of right hallux abduction (AbOb; condition 4) followed by observation of right hallux flexion (FlexOb; condition 5). The latter is a familiar movement that all subjects were able to execute. In the visual baseline (ViB) condition (6), subjects watched a picture of a stationary right foot.
The AbOb and FlexOb conditions were presented alternately in blocks that lasted 24 s each and were each followed by the ViB condition (24 s). Each observation condition was preceded by a written instruction that indicated the condition (3 s). In each of the AbOb and FlexOb blocks, eight stimuli of hallux movement were presented. Each stimulus (1 s) was followed by a pseudorandomized interval of a stationary foot varying from 1 to 3 s. The AbOb and FlexOb conditions were each presented eight times and, consequently, the ViB condition was presented 16 times. In between the two runs, an anatomical T1 weighted scan (7 min) was made.
Each subject was rescanned according to the same protocol after 1 week. One and two days before rescanning, the subjects in the A0 group trained the hallux abduction during 10 intervals of 1 min, interspersed with 30 s of rest. Subjects belonging to the AKI group did not train between the two sessions, because we aimed to avoid additional motor improvement due to learning in this group.
MRI Characteristics
Data acquisition was performed by using a 3 T Philips MR system (Best, The Netherlands) with a standard six‐channel SENSE head coil. A T1‐weighted 3D anatomical scan was acquired to obtain high‐resolution anatomical information, matrix size = 256 × 256 in axial orientation. Functional images were acquired with a gradient‐echo T2* blood oxygen dependent level contrast technique using the following scanning parameters: TR = 3,000 ms, TE = 35 ms, 41 slices, isotropic voxels 3.5 × 3.5 × 3.5 mm, axial orientation, 323 volumes per run.
Behavioral and EMG Analysis
The differences between ROM in both groups and sessions were analyzed by means of a 2 × 2 ANOVA for repeated measures from which individual contrasts were obtained by means of post hoc analyses. Brain Vision analyzer was used to apply MR artefact corrections on the EMG signal similar to [van Duinen et al., 2005]. The EMG signal was further low‐pass filtered (500 Hz) and downsampled to 2,500 Hz. Bipolar derivations were calculated and exported to Spike 2 (CED, Cambridge, UK) resulting in an EMG signal suitable for visual inspection.
fMRI Analysis
Image processing and statistical analyses were conducted with Statistical Parameter Mapping (SPM) version 5 (2005, Welcome Department of Cognitive Neurology London, UK; http://www.fil.ion.ucl.ac.uk/spm). A mean image of all volumes was created, to which individual volumes were spatially realigned by means of rigid body transformation. The realigned images were normalized to the Montreal Neurological Institute (MNI) T2* template and thus transformed into a standard stereotactic space. After this, a Gaussian filter of 8‐mm full width at half maximum was applied to smooth the data spatially. Cortical activations were either rendered onto the surface or projected on slices of a standard MNI brain. To analyze differences between the experimental conditions (including the FlexOb), preprocessed fMRI time series were modeled in a blocked design and contrasted with baseline conditions at subject level. The baseline was modeled to overcome time effects between the MoIm and MoEx baseline condition. Because the data were analyzed in a block design with repeated stimuli, the auditory stimuli were not separately modeled. For the MoIm and MoEx condition, these contrasts were compared using a two‐way ANOVA (flexible factorial design) in which group (AKI or A0) and scan session (first or second) were modeled at second level. The AbOb and FlexOb condition were compared using a three‐way ANOVA in which group (AKI or A0) and scan session (first or second) as well as condition (AbOb or FlexOb) were modeled at second level. In the ANOVA, conditions and scan sessions were assumed to be dependent and equally variant, whereas subjects were assumed to be independent and equally variant. An initial statistical threshold of P < 0.001 (at voxel level) was applied with extend threshold k = 20 voxels. Resulting clusters of increased activation were considered statistically significant at cluster‐level P < 0.05 (corrected for the entire brain volume). Based on our hypotheses, small volume correction was additionally applied to clusters in the anterior parietal cortex, consisting of BA 39/40 also including the parietal operculum. To that end, a radius of 15 mm was used (and a cluster size threshold of 20).
To look at effects exclusively determined by the actual ability to abduct the right hallux, linear regressions were made of the subject's ROM of both the first and second session and the individual contrasts of each of the four experimental conditions with their baseline conditions. Contrasts that were obtained from the second level GLM were used for the assessment of main effects in the regression analysis. These contrasts were used for three independent design matrices that formed three independent T maps, which were combined using SPM05 application “imcalc” (logical and; threshold T = 2). To look at the shared activation of the experimental conditions determined by this particular motor skill, a conjunction analysis testing the global null was performed on the obtained regression maps. The activation clusters obtained from the conjunction analysis were modeled as regions of interest (ROI) using the MarsBar toolbox [Brett et al., 2002] for SPM. The difference between activations in the experimental conditions and those in their baseline condition were expressed as a percentage of the overall error term and plotted against subject's ROM. An initial threshold at voxel level of T > 2 was used with a cluster size threshold of 20.
RESULTS
Behavioral and EMG Data
The inability to abduct the toe in the A0 group was demonstrated by the initial ROM of 0°, whereas the AKI group had an initial ROM of 7.3° ± 2.3° (mean ± SD) (see Fig. 2). Before the onset of the second scanning session, all subjects of the A0 group were able to execute hallux abduction. The posttraining ROM of the A0 group was 6.2° ± 1.8° that of the AKI group 8.4° ± 2.7°. The ROM showed significant differences between sessions [F(1,15) = 50.00; P < 0.001] and groups [F(1,6) = 20.23; P = 0.004], respectively. Comparing the ROM between the first and second scanning session in the A0 group showed a significant increase (6.2°, P < 0.01). In the AKI group, the difference between the first and second scanning session was not statistically significant (1.1°, P = 0.09). Comparing the ROM between the A0 group and the AKI group in the first session showed significantly smaller values in the A0 group (difference 7.3°; P < 0.01). In the second session, the 2.3° difference did not reach statistical significance (P = 0.08).
Figure 2.
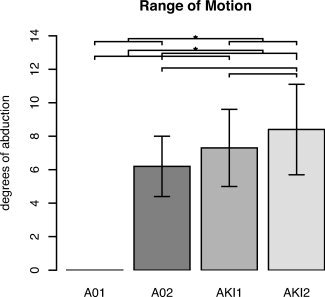
Behavioral data. Range of motion(ROM) expressed in degrees of abduction for each group and session. For each group, the mean ROM (±SD) is presented. Statistical analysis of differences between groups and sessions was performed with a two‐way ANOVA, of which the results are given in the text. *, Significant difference. A01/A02, Absolute Zero group in sessions 1 and 2; AKI1/AKI2, Already Knowing It in sessions 1 and 2.
Visual inspection of the filtered EMG signal showed sharp signal increase compared to baseline during the MoEx condition, which did not occur during the MoIm and observation conditions. Although no abduction movements occurred in the first session of the A0 group, the EMG signal showed increased activation together with movement artefacts. These artefacts in the EMG signal during the first MoEx condition, induced by ineffective muscle contractions, were more frequently present in the A0 group (six of seven subjects) than in the AKI group (two of nine subjects).
fMRI Data
In the following paragraphs, SPM of differences between the four experimental conditions and their base‐line conditions is reported for the two groups. Next, differences between the two scanning sessions are treated, and, finally, correlations between regional activation increases and the quantitative movements parameters concerning prescanning hallux abduction are presented.
Activation of the Primary Motor Cortex (M1)
In the AKI group, the comparison of MoEx condition (hallux abduction) with the AuB condition (AKI: MoEx > AuB) was in each of the two sessions related with increased activation in the primary motor cortex (M1) located in the medial wall of the left hemisphere (Table I and Fig. 3A). Increased activation at this location was also present in the A0 group during MoEx (AO: MoEx > AuB), even in the first session when only ineffective muscle contraction occurred (Table I and Fig. 3A).
Table I.
Abduction right hallux: execution/ imagery versus auditory baseline
| Brain region, Brodmann's area (BA) | Stereotactic coordinates/T value | |||||||
|---|---|---|---|---|---|---|---|---|
| Left | Right | |||||||
| x | y | z | T | x | y | z | T | |
| A Absolute Zero: Execution | ||||||||
| Primary motor cortex, toe area (4) | −10 | −22 | 62 | 4.1 | ||||
| Supplementary motor area (6) | 0 | 2 | 52 | 8.7 | ||||
| Dorsal premotor cortex (6) | −18 | 0 | 60 | 7.0 | 20 | 0 | 66 | 6.1 |
| Precentral gyrus (6) | −56 | 8 | 28 | 6.2 | 46 | 2 | 48 | 4.6 |
| Frontal Operculum | −54 | 4 | 14 | 5.8 | 50 | 8 | 12 | 5.4 |
| Supramarginal gyrus (40) | −58 | −38 | 30 | 4.6 | 64 | −22 | 34 | 6.4 |
| Putamen | −24 | 4 | 6 | 5.0 | ||||
| Cerebellum (c6) | −22 | −68 | −26 | 4.8 | 28 | −54 | −26 | 5.8 |
| Cerebellum (c4/5) | 18 | −42 | −24 | 3.8 | ||||
| Vermis (4/5) | 4 | −60 | −6 | 4.3 | ||||
| B Already Knowing It: Execution | ||||||||
| Primary motor cortex, toe area (4) | −10 | −22 | 62 | 6.3 | ||||
| Supplementary motor area (6) | −2 | 0 | 52 | 11.7 | 10 | −12 | 66 | 8.0 |
| Dorsal premotor cortex (6) | −34 | −10 | 58 | 8.7 | 40 | −2 | 56 | 7.6 |
| Precentral gyrus (6) | −56 | 8 | 30 | 8.1 | 54 | 10 | 34 | 7.6 |
| Cingulate gyrus mid (32) | −6 | 12 | 44 | 8.9 | 8 | 20 | 42 | 7.5 |
| Inferior frontal gyrus p. opercularis (44) | −56 | 6 | 16 | 8.0 | 58 | 14 | 22 | 8.8 |
| Insula | −44 | −2 | 10 | 8.8 | 34 | 22 | 10 | 6.7 |
| Frontal operculum | −54 | 4 | 14 | 8.1 | 50 | 10 | 6 | 7.4 |
| Supramarginal gyrus(40) | −50 | −32 | 38 | 7.4 | 54 | −24 | 36 | 8.2 |
| Middle temporal gyrus(21) | 54 | −50 | 4 | 5.6 | ||||
| Inferior parietal cortex(40) | −34 | −50 | 54 | 5.6 | 40 | −42 | 56 | 5.5 |
| Thalamus | −18 | −8 | 2 | 6.8 | 12 | −18 | 8 | 5.1 |
| Putamen | −30 | 4 | 4 | 6.7 | 24 | 4 | 4 | 5.4 |
| Cerebellum (c6) | −26 | −68 | −26 | 10.0 | 28 | −56 | −26 | 10.1 |
| Cerebellum (c4/5) | 16 | −40 | −24 | 6.9 | ||||
| Vermis (4/5) | 2 | −50 | −8 | 6.7 | ||||
| Vermis (6) | 4 | −70 | −14 | 6.7 | ||||
| Mecencephalon | 0 | −28 | −18 | 5.9 | 4 | −28 | −18 | 5.9 |
| C Absolute Zero: Imagery | ||||||||
| Supplementary motor area (6) | −2 | 4 | 54 | 6.1 | 4 | −2 | 64 | 6.9 |
| Dorsal premotor cortex (6) | −18 | 8 | 60 | 8.0 | ||||
| Precentral gyrus (6) | −50 | 4 | 30 | 6.6 | 44 | 2 | 46 | 5.8 |
| Inferiorfrontal gyrus p. opercularis (44) | −52 | 10 | 12 | 5.6 | 58 | 8 | 16 | 4.7 |
| Inferiorfrontal gyrus p. triangularis (45) | 40 | 36 | 12 | 4.1 | ||||
| Cingulate gyrus mid (32) | −6 | 10 | 32 | 3.8 | 8 | 18 | 34 | 4.8 |
| Insula | −40 | 0 | 2 | 4.4 | ||||
| Frontal operculum | −52 | 10 | 12 | 5.6 | 58 | 8 | 16 | 4.7 |
| Supramarginal gyrus (40) | −58 | −38 | 26 | 5.5 | ||||
| Inferior parietal lobule (40) | −48 | −38 | 26 | 5.5 | ||||
| Caudate | −18 | −6 | 22 | 4.1 | ||||
| D Already Knowing It: Imagery | ||||||||
| Primary motor cortex, toe area (4) | −8 | −22 | 60 | 5.1 | ||||
| Supplementary motor area (6) | −6 | 4 | 52 | 8.8 | 14 | 2 | 64 | 8.1 |
| Dorsal premotor cortex (6) | −30 | −8 | 60 | 6.7 | ||||
| Precentral gyrus (6) | −58 | 2 | 20 | 6.0 | 54 | 8 | 38 | 8.6 |
| Inferior frontal gyrus p. opercularis (44) | −52 | 8 | 14 | 7.6 | 48 | 10 | 6 | 8.0 |
| Cingulate gyrus mid (32) | −2 | 18 | 44 | 8.1 | 4 | 20 | 36 | 9.4 |
| Insula | −30 | 18 | 8 | 7.9 | 40 | 22 | 2 | 8.2 |
| Frontal operculum | −48 | 0 | 10 | 8.0 | ||||
| Supramarginal gyrus (40) | −44 | −40 | 30 | 6.7 | 62 | −36 | 36 | 6.4 |
| Inferior parietal cortex (40) | −52 | −36 | 40 | 6.7 | 52 | −44 | 48 | 7.0 |
| Superior temporal gyrus (42) | −58 | −40 | 18 | 6.6 | ||||
| Thalamus | −8 | −18 | 2 | 6.2 | ||||
| Putamen | 26 | 10 | 10 | 6.3 | ||||
| Caudate | −16 | −8 | 20 | 7.4 | ||||
| Pallidum | 22 | 6 | 2 | 6.5 | ||||
| Cerebellum (c6) | −34 | −58 | −30 | 7.9 | 32 | −66 | −24 | 7.3 |
| Vermis (6) | 2 | −44 | −16 | 6.5 | ||||
| Vermis (8) | −4 | −64 | −30 | 6.1 | ||||
| E AKI versus A0: Imagery | ||||||||
| Superior frontal gyrus | 32 | 62 | 12 | 5.0* | ||||
| Supramarginal gyrus (40) | 54 | −42 | 38 | 4.0* | ||||
| Insula | 48 | 22 | −4 | 4.0* | ||||
Coordinates refer to the voxels of maximum activation (session 1) within significant clusters (P < 0.05, whole brain corrected at cluster level) k > 20. For comparison E, we also report clusters that reached significance only at uncorrected level (marked with *). An initial statistical threshold for voxel response height of P < 0.001 (uncorrected) was used. Positive x,y,z coordinates (in mm) indicate locations, respectively, right, anterior, and superior to the middle of the anterior commissure. The activations that resulted from comparisons A to E are depicted in Figure 3.
Figure 3.
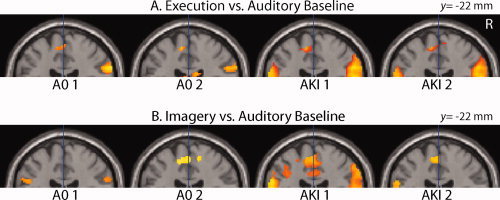
Primary motor cortex activation. SPM 〈Z〉 of cerebral activations that resulted from the comparisons of the Motor Execution (MoEx, A) and Motor Imagery (MoIm, B) condition with the Auditory Baseline (AuB) condition are projected on a coronal plane of a standard anatomical brain volume (Montreal Neurological Institute). It illustrates the representation of the right toe in the left primary motor cortex on the medial wall of the left hemisphere. All slices are 22 mm posterior to a vertical traversing the anterior commissure (VCA). All regional activations above initial significance threshold, P < 0.001, k = 20 (voxel level, uncorrected), are depicted. Coordinates and T values of clusters that reached statistical significance after whole‐brain correction for multiple comparisons are reported in Tables I and II. R, right side of the brain. [Color figure can be viewed in the online issue, which is available at wileyonlinelibrary.com.]
Also, in the absence of executed movements (AKI: MoIm > AuB), M1 activation was present during the two sessions of MoIm in the AKI group (Table I and Fig. 3B). In the first MoIm session of the A0 group, however, M1 activation did not reach statistical significance, while it did in the second (Fig. 3B). In all afore‐reported contrasts, M1 activation was restricted to the most dorsal extension of the precentral gyrus of the medial surface on the left hemisphere. A difference with MoIm was that, in the MoEx condition, this contralateral activation of M1 was accompanied with ipsilateral (right) cerebellar activation (Table I).
Movement Execution
In addition to the activations in the contralateral M1 and ipsilateral cerebellum related to MoEx (relative to AuB), increased activation with the highest T values was seen in the supplementary motor area (SMA) (Table I and Fig. 4A). Next to this, both the AKI and the AO group showed left‐premotor cortex (PMC) and putamen activations sessions 1 and 2 (session 1 is reported in Table I and Fig. 4A). There was no significant difference between the AKI and A0 groups (Table I and Fig. 4A). In general, the two groups showed activation patterns related to MoEx that were more widely distributed, with foci of activation that had higher T values in the first than in the second session.
Figure 4.
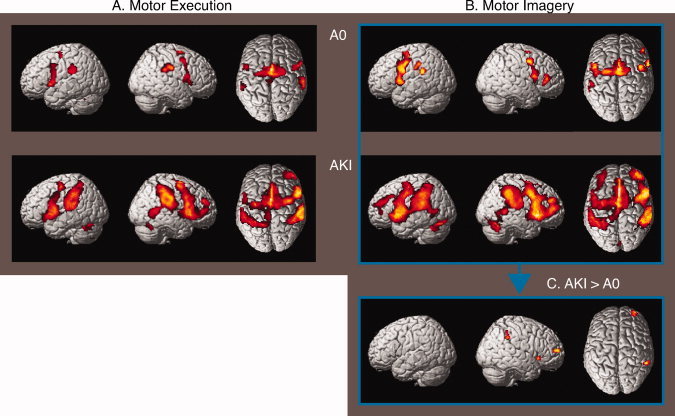
Cerebral activations related to execution/imagery of hallux abduction. SPM 〈Z〉 of cerebral activations that resulted from the comparisons of the Motor Execution (MoEx, A) and Motor Imagery (MoIm, B) condition with the Auditory Baseline (AuB) condition (session 1) are rendered on a standard anatomical brain volume (Montreal Neurological Institute). The upper row depicts the activations compared to baseline for the “Absolute Zero” (A0) group, and the lower row depicts the results for the “Already Knowing It” (AKI) group. The comparisons of the MoIm condition between the AKI and A0 group (C) are depicted on the right bottom‐side of the figure. All regional activations above initial significance threshold, P < 0.001, k > 20 (voxel level, uncorrected), are depicted. Coordinates and T values of clusters that reached statistical significance after whole‐brain correction for multiple comparisons are reported in Table I. [Color figure can be viewed in the online issue, which is available at wileyonlinelibrary.com.]
Motor Imagery
When comparing the MoIm condition with the AuB condition, increased activation was most prominent in the PMC (Table I and Fig. 4B). This was the case for each of the two groups and in each of the two sessions. Similar to MoEx, activations related to MoIm were more robust (with higher T values) in the first than in the second session. Comparing MoIm in the AKI group with the A0 group in the first session (MoIm: AKI > AO) revealed increased activation of the right anterior parietal cortex (Table I and Fig. 4C). This difference did not reach significance after correction for the entire brain volume. Applying small volume correction on this cluster that was proposed in our hypothesis resulted in statistical significance (P = 0.004). In the opposite contrast (MoIm: A0 > AKI) in the first session, no significant increases were present. In the second session, no significant differences in MoIm were present between the two groups.
Movement Observation
When FlexOb and AbOb were successively compared with ViB, robust activation of the lateral extra‐striate visual cortex was seen (Table II and Fig. 5). This was the case for each of the two groups, both in sessions 1 and 2. Similar to the activations in MoIm and MoEx, these task‐related activations were stronger in the first than in the second session. During the FlexOb condition (FlexOb > ViB), the patterns of increased activation further comprised activation of the left primary visual cortex, the bilateral PMC, and the bilateral parietal operculum (putative OP 1) (Table II and Fig. 5) in each of the two groups and sessions. No differences were present between the A0 and AKI group with regard to the FlexOb condition, in neither session 1 nor in session 2.
Table II.
Abduction/flexion observation versus visual baseline
| Brain region, Brodmann's area (BA) | Stereotactic coordinates/T value | |||||||
|---|---|---|---|---|---|---|---|---|
| Left | Right | |||||||
| x | y | z | T | x | y | z | T | |
| A Absolute Zero: Abduction | ||||||||
| Middle temporal gyrus (37) | 48 | −60 | 2 | 8.4 | ||||
| Middle occipital gyrus (19) | −44 | −74 | 2 | 8.0 | ||||
| B Already Knowing It: Abduction | ||||||||
| Calcarine gyrus (17) | −6 | −94 | −6 | 8.4 | ||||
| Middle temporal gyrus (37) | −44 | −54 | 4 | 5.8 | 50 | −62 | 2 | 9.3 |
| Middle occipital gyrus (19/18) | −40 | −80 | −2 | 8.2 | 30 | −90 | 4 | 6.3 |
| Parietal operculum, OP 1 | −52 | −28 | 20 | 8.0 | 62 | −20 | 24 | 6.5 |
| Inferior parietal lobule (40) | −34 | −54 | 54 | 6.7 | 38 | −44 | 56 | 6.4 |
| Precentral gyrus(6) | −42 | −6 | 44 | 6.1 | 54 | 6 | 38 | 6.9 |
| Supplementary motor area (6) | −4 | −6 | 58 | 5.8 | 14 | 8 | 60 | 4.9 |
| Cingulate gyrus mid (32) | −8 | 0 | 42 | 5.3 | 10 | 4 | 40 | 4.8 |
| Inferior frontal gyrus p. triangularis (47) | 46 | 22 | 0 | 5.6 | ||||
| Middle frontal gyrus (44) | 50 | 12 | 48 | 6.5 | ||||
| Hippocampus | −16 | −24 | −12 | 4.7 | ||||
| Thalamus | −20 | −22 | 16 | 5.5 | ||||
| Cerebellum (7b) | −16 | −76 | −44 | 6.7 | ||||
| C AKI versus A0: Abduction | ||||||||
| Parietal operculum, OP 1 | −54 | −26 | 20 | 4.7 | ||||
| Supplementary motor area(6) | −12 | −14 | 60 | 4.6 | 16 | 6 | 62 | 4.1 |
| Cingulate gyrus mid (32) | −8 | 0 | 42 | 4.2 | 12 | 2 | 40 | 4.5 |
| Hippocampus | −16 | −24 | −12 | 4.2 | ||||
| Thalamus | −16 | −14 | 10 | 4.3 | ||||
| Cerebellum (7b) | −14 | −76 | −42 | 4.3 | ||||
| D Absolute Zero: Flexion | ||||||||
| Calcarine gyrus (17) | −4 | −94 | 8 | 5.7 | ||||
| Middle temporal gyrus (37) | −44 | −54 | 8 | 5.7 | 48 | −60 | 2 | 11.0 |
| Middle occipital gyrus (19/18) | −44 | −74 | 4 | 11.1 | 32 | −84 | 4 | 5.9 |
| Parietal operculum, OP 1 | −48 | −32 | 24 | 6.2 | 56 | −34 | 24 | 6.4 |
| Inferior parietal lobule (40) | −36 | −54 | 56 | 6.6 | 34 | −34 | 48 | 5.9 |
| Postcentral gyrus (2/1) | −40 | −40 | 58 | 6.3 | 54 | −30 | 56 | 3.8 |
| Precentral gyrus (6) | −42 | −4 | 38 | 5.4 | 42 | 2 | 44 | 5.7 |
| Cerebellum, c1 | −14 | −82 | −18 | 5.6 | ||||
| E Already Knowing It: Flexion | ||||||||
| Calcarine gyrus (17) | −6 | −94 | −6 | 9.7 | ||||
| Middle temporal gyrus (37) | −56 | −60 | 8 | 7.2 | 50 | −62 | 2 | 11.7 |
| Inferior occipital gyrus (19) | −40 | −80 | −2 | 10.6 | 42 | −78 | −4 | 11.4 |
| Parietal operculum,OP 1 | −52 | −28 | 18 | 9.6 | 48 | −30 | 24 | 7.7 |
| Superior parietal lobule (7/40) | −24 | −50 | 58 | 6.9 | 36 | −44 | 56 | 8.8 |
| Postcentral gyrus (2) | −54 | 4 | 38 | 7.6 | 62 | −20 | 24 | 8.5 |
| Precentral gyrus (6) | −40 | −8 | 54 | 7.4 | 56 | 6 | 36 | 8.3 |
| Supplementary motor area (6) | −8 | −8 | 62 | 6.2 | 4 | 6 | 64 | 4.6 |
| Middle frontal gyrus (46/6) | −36 | 36 | 32 | 5.3 | 46 | 2 | 54 | 6.8 |
| Thalamus | −14 | −22 | 14 | 6.7 | ||||
| Cerebellum, 7b/6 | −14 | −76 | −44 | 9.2 | 30 | −58 | −46 | 6.1 |
| F Absolute Zero: Flexion versus Abduction | ||||||||
| Parietal operculuxm, OP1 | −46 | −24 | 34 | 4.0* | 66 | −26 | 28 | 5.1 |
| Dorsal premotor cortex (6) | −20 | −8 | 52 | 4.8* | ||||
Figure 5.
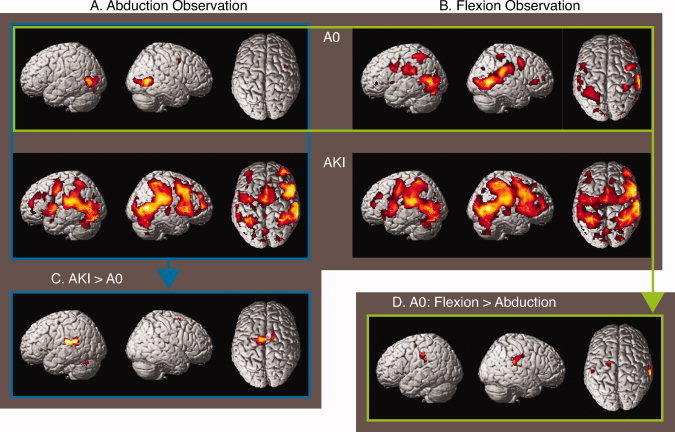
Cerebral activations related to observation. SPM 〈Z〉 of cerebral activations that resulted from the comparisons of, respectively, the Abduction Observation (AbOb) and Flexion Observation (FlexOb) condition with the Visual Baseline (ViB) condition (session 1) are rendered on a standard anatomical brain volume (Montreal Neurological Institute). The upper row depicts the results for the “Absolute Zero” (A0) group in session 1. The second row depicts the increases of activation for the “Already Knowing Its” (AKI) group. The results of comparing AbOb between the AKI and A0 group (C) as well as activation increases related to FlexOB relative to AbOb in the A0 group (D) are depicted on the third row. Conventions as in figure 4. Coordinates and T values of clusters that reached statistical significance after whole‐brain correction for multiple comparisons are reported in Table II. [Color figure can be viewed in the online issue, which is available at wileyonlinelibrary.com.]
The comparison of AbOb in the AKI group with AbOb in the A0 group during the first session (AbOB: AKI > AO) resulted in a significant increase of cerebral activations distributed over the left‐parietal operculum (putative OP 1), the SMA, and the medial cingulate gyrus (Table II and Fig. 5C). This pattern of increased activation was further accompanied by left hippocampal, thalamic, and cerebellar activations. In the opposite contrast (AbOb: A0 > AKI) during the first session, no significant increases were present. With regard to the AbOb condition of the second session, no significant differences were present between the A0 and AKI groups.
Contrasting the FlexOb to the AbOb condition in the first session of the A0 group (AO: FlexOb > AbOb) revealed bilateral increased activation of both the parietal operculum (OP 1) and left‐dorsal PMC (Table II and Fig. 5D). In the second session, this activation was restricted to only the left middle frontal gyrus (Brodmann's area BA44; x = −36, y = 12, z = 40). In the AKI group, no differences were found between the FlexOb and AbOb conditions. No increases in activation were found in AbOb when contrasted to FlexOb. This was the case for both groups and both sessions.
Time Effects
As reported in the previous paragraphs, overall activations in the second scan session were less robust than in the first one. This was the case for all tasks and might be due to a general repeat effect [Henson and Rugg, 2003; Higuchi et al., 2008] or an increase of activations in the baseline conditions. For these reasons of uncertainty, we were reluctant to draw conclusions from the changes in activations over time. Nevertheless, the difference in S2 activation between AKI and AO during AbOb decreased over time [AbOb: (AKI.1 − AO.1) − (AKI.2 − AO.2)]. This interaction resulted in activation of left S2 at x = −56, y = −24, and z = 20 (T‐value 3.7; P < 0.001 uncorrected) that was based on a signal increase for AO and a signal decrease for AKI over time.
Parametric Modulations
Using subject's ROM's that were obtained before scanning in the first and second session as regressor, a high ROM correlated with increased activation of the right parietal operculum (putative OP 1) in the MoEx condition (Table III and Fig. 6). In the MoIm condition, the same correlation existed with increased activation of the right parietal operculum (OP 1), but now an additional increase of activation was identified in the right‐dorsolateral PFC (DLPFC) extending toward the right‐rostral PFC (Table III and Fig. 6B). In the AbOb condition, a high ROM was associated with increased activation of the left hippocampus and subthreshold activation of the left parietal operculum (OP 1; Table III and Fig. 6C). In the FlexOb condition, a high ROM was associated with increased activation of the precuneus (Table III). A low ROM was not correlated with increased activation in any condition. Conjunction analysis of the positive correlations obtained in the MoIm, MoEx, and AbOb condition revealed that a shared increase of activation was exclusively present in the parietal operculum (OP 1) of both hemispheres (Table III and Fig. 6D). The ROI analyses of these two clusters revealed that the magnitude of activation induced by the experimental condition was lower in the second than in the first session in each of the three conditions. Figure 6 further illustrates that the task‐related effects in the parietal operculum did not result from the dominance of a few outliers.
Table III.
Correlation range of motion and changes in activation
| Brain region, Brodmann's area (BA) | Stereotactic coordinates/T value | |||||||
|---|---|---|---|---|---|---|---|---|
| Left | Right | |||||||
| x | y | z | T | x | y | z | T | |
| A Execution, positive | ||||||||
| Parietal operculum, OP 1 | 54 | −24 | 22 | 3.6 | ||||
| B Imagery, positive | ||||||||
| Parietal operculum, OP 1 | 36 | −16 | 22 | 4.1 | ||||
| Middle frontal gyrus (46) | 28 | 38 | 22 | 4.1 | ||||
| Superior frontal gyrus (10) | 30 | 64 | 12 | 3.1 | ||||
| C Abduction Observation, positive | ||||||||
| Parietal operculum, OP1 | −50 | −42 | 20 | 3.7* | ||||
| Hippocampus | −38 | −24 | 10 | 3.7 | ||||
| Hippocampus | −38 | −10 | −20 | 4.2 | ||||
| Flexion Observation, positive | ||||||||
| Precuneus (7) | −6 | −72 | 38 | 3.3 | 4 | −70 | 42 | 3.5 |
| D Common Activation Increases A, B, and C | ||||||||
| Parietal operculum, OP1 | −52 | −34 | 14 | 2.2 | 48 | −26 | 22 | 2.9 |
Coordinates refer to the voxels of maximum activation within clusters that reached significance only at uncorrected level (P < 0.05) k > 20. A statistical threshold of T > 2 (voxel level, uncorrected) was used. A cluster that did not reach significance in comparison G is marked with *. SPM 〈Z〉 I represents the shared activations of the SPM 〈Z〉 of A, C, & G each at a statistical threshold of T > 2 (voxel level, uncorrected). Coordinate conventions are as in Table I. The activations that resulted from comparisons A, C, F, and I are depicted in Figure 6.
Figure 6.
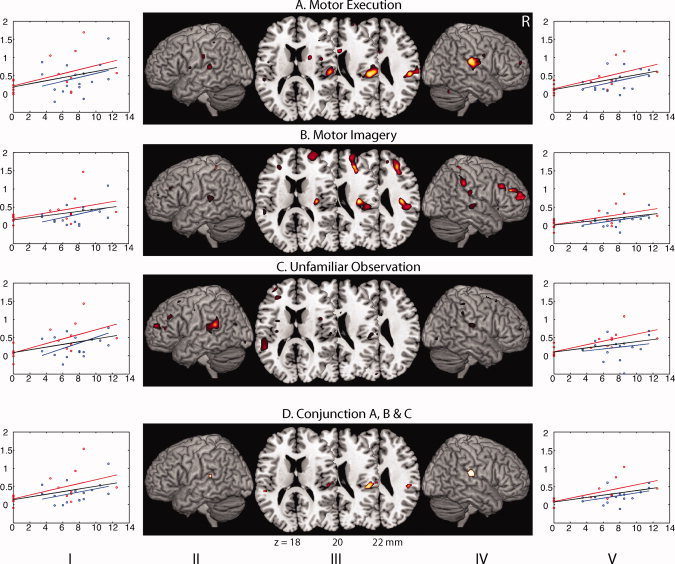
Positive correlations with range of motion. (a) Motor execution; (b) motor imagery; (c) unfamiliar observation; (d) conjunction a, b, and c; SPM 〈Z〉 correlated with subjects ROM in the execution, imagery, and abduction observation condition projected on axial planes (III) and rendered onto the surface of (II/IV) a standard anatomical brain volume (Montreal Neurological Institute, MRIcron). Individual values are plotted (I/V) for the first (red) and second (blue) session (ROM on x‐axis (in degree); signal fluctuation relative to baseline on y‐axis (in %). The red lines depict the linear regressions of the first session, and the blue those of the second session. The black lines depict the combined regression. All regional activations above initial significance threshold T > 2 (voxel level, uncorrected) are depicted. In the axial planes, the distance from the plane through the posterior and anterior commissures is (ac‐pc) is indicated by the z coordinate in mm. The shared activations of the comparisons on the upper three rows are depicted on the bottom (lowest) row. Coordinates and T values of clusters that reached statistical significance after whole‐brain correction for multiple comparisons are reported in Table III. R, right side of the brain.
DISCUSSION
The aim of this study was to investigate whether imagery and observation of totally new movement would fail to induce activation of circuitry comprising anterior parietal and premotor cortical regions. The obtained data provided support for our hypothesis that one indeed needs the proprioceptive experience of previous performance before somatosensory‐related regions become functionally involved in motor preparation. When the experimental conditions of the AKI group were compared to baseline, the resulting patterns of increased activation were consistent with activations that have previously been implicated in respectively motor imagery [Ehrsson et al., 2003; Gieteling et al., 2008], execution, and observation [Gazzola and Keysers, 2008]. This similarity indicated that the paradigm was indeed robust enough to explore the cerebral architecture involved in our experimental conditions and to allow further comparisons between them. A major finding that emerged from our data was the consistently observed involvement of the parietal operculum (OP 1), functionally corresponding to the second somatosensory area [SII, Eickhoff et al., 2007], when conditions associated with the ability to move the hallux were compared to circumstances of abduction inability. Furthermore, these differences diminished when subjects in the A0 group trained and mastered the skill to execute this movement, which point at plasticity in higher‐order sensorimotor regions driven by experience.
Motor Execution
The MNI coordinates of the hallux M1 activation in the primary motor cortex (−10, −28, 64) corresponded with the coordinates obtained in a previous fMRI study in which toe movements were both imagined and executed (−8, −28, 64, [Ehrsson et al., 2003]. The ipsilateral site of activation in the (right) anterior cerebellum during motor execution in our paradigm corresponded to the cerebellar representation of foot movements as previously described [Grodd et al., 2001]. Compared to the auditory baseline condition, M1 activation was not only present during abduction movement in the AKI group, as expected, but also in the A0 group during session 1, a condition without overt hallux abduction. The latter might be due to the subjects' attempt to execute the instructed movement, whereas it only resulted in an increased muscle tone of various toe muscles. This was supported by the EMG signal of these subjects that evidently showed muscle contractions.
Motor Imagery
The most prominent activations that were seen in relation to MoIm were found in the SMA and the dorsal PMC. This was found in both groups. The dominant role of these two premotor regions is in line with earlier reports on motor imagery [Kasess et al., 2008; Owen et al., 2006]. A major characteristic of MoIm by A0 in the first session was the absence of both suprathreshold M1 activation and right‐anterior parietal activation (supramarginal gyrus). If the extensive PMC activation is considered to reflect attempted movement preparation, this suggests that no effective information is guided from the PMC toward execution areas (M1) in this group. Such ineffective PMC function may result from inadequate interaction with anterior parietal regions such as SII and the supramarginal gyrus. This idea is supported by an earlier conducted MoIm paradigm in which the primary motor cortex was only activated in kinesthetic and not in visual imagery [Solodkin et al., 2004]. In this respect, we assume that imagery related with the ability of hallux abduction is in a similar domain as imagery associated with a kinesthetic feeling.
The low‐anterior parietal activation in the A0 group relative to the AKI group, in session 1, fitted our hypothesis of a somatosensory embedding of the imagery process. The experience‐dependent activity of this area has also been reported in motor imagery of both lower‐ [Lafleur et al., 2002] and upper extremities [Guillot et al., 2008a]. Recently, this anterior parietal involvement was also reported in kinesthetic and not in visual imagery [Guillot et al., 2008b]. After the A0 group had acquired the ability to abduct their hallux, the comparison between the two groups did not show differences in cerebral activation patterns any longer. This suggests that a functional reorganization had occurred in the A0 group.
We did not find increased posterior parietal activation in A0 in session 1, which we hypothesized to occur as a more visually based imagining strategy in circumstances without somatosensory embedded (kinesthetic) motor imagery [Guillot et al., 2008b]. One might speculate that such posterior parietal function is hardly implicated in motor aspects of the toe, given the differences with the functional organization of hand movement as explained earlier. Indeed, even the parietal activation during MoIm of a familiar toe movement did not extend as posterior as in earlier imaging studies conducted on motor imagery of the hand [de Vries et al., 2008; Gieteling et al., 2008]. Such difference between imagining of toe‐ and finger movement has also been reported by Ehrsson et al. [ 2003] and supports the view that the hallux is less involved in targetdirected visuospatial processes than the hand. Indeed, even simple hand movements may already induce activation of posterior parietal regions [Stenekes et al., 2006] indicating its intrinsic relationship with more complex movements.
Movement Observation
In the AbOb and FlexOb conditions, contrasted to the ViB of a static toe, clusters with the strongest (maximum) activation were consistently found in the lateral occipital cortex. This increased activation related to visual motion logically included the visual motion area V5/MT [Dumoulin et al., 2000; Watson et al., 1993]. In the A0 group, activation related to unfamiliar movements in session 1 was restricted to the lateral occipital cortices. In the AKI group, the wider distribution of activations included parietal‐premotor regions, which indicated that the observed toe movements were mapped onto existing action representations. This finding is consistent with the restricted activation in putatively MT/V5 related to the observation of non‐naturalistic (virtual‐reality) actions [Perani et al., 2001], which would imply that if a subject observes limb movements it is unable to perform, cortical regions implicated in effective movement preparation are not recruited. On the other hand, it has been reported that the observation of unnatural movements may induce cerebral activation beyond the lateral occipital cortices [Costantini et al., 2005].
Anterior Parietal Involvement
The role of the anterior parietal cortex, including SII, in successful hallux abduction was particularly evident in the movement observation conditions. Increased activation of the parietal operculum, functionally corresponding to SII [Eickhoff et al., 2007], was identified by (1) comparing the observation of familiar with unfamiliar movements in the A0 group, (2) comparing the AKI group with the A0 group during the observation of unfamiliar movements in the first scanning session, and (3) using subjects ROM as a regressor in the MoIm, MoEx, and AbOb condition both separately and combined. The relation between decreased SII activation and the inability to perform hallux abduction (AO, session 1) is an argument against the notion that the observed difference in activation might be due to an increased effort to overcome such inability or sense of discomfort.
Activation of SII by action observation has been demonstrated before [Avikainen et al., 2002; Gazzola and Keysers, 2008]. This is in line with earlier studies on SII activation in which somatosensory stimuli caused ipsi and/or contralateral SII activation [Eickhoff et al., 2008; Simoes et al., 2002; Wegner et al., 2000]. Indeed, the vast majority of literature about SII is based on somatosensory stimulation, but next to this, its involvement in movement execution has been demonstrated [Inoue et al., 2002; Wasaka et al., 2007]. The cause of variations in the lateralization of SII activation, both in our and in previous studies, remains to be elucidated.
Our inference from the present results is that the lack of SII activation, associated with the inability to abduct a hallux, reflected an initial lack of somatosensory embedding required to make a voluntary movement. This idea is supported by data indicating that sensorimotor integration is facilitated by SII [Hinkley et al., 2007] next to its role in proprioceptive processing [Alary et al., 2002]. It was, in this respect intriguing to see the strong PMC activation during the first session in the A0 group, which may indicate that the connections between the PMC and SII [Krubitzer and Kaas, 1990] fail to establish effective interaction between the two concerning hallux abduction. This would explain why (an attempt to) movement preparation during motor imagery of the A0 group was initially associated with increased PMC activation in the relative absence of anterior parietal activation. In other words, subjects who do not master hallux abduction do not generate the appropriate proprioceptive information and do not “feel how it is” to make the imagined or observed movement. In this perspective, the understanding of observed movements might be based on internal simulation; one puts oneself literary into the shoes of the observed performer [Jeannerod, 1994, 1999]. By doing this, the somatosensory consequences of the observed movement are predicted. The internal representations of different motor acts, regardless whether they appear in execution, imagery, or observation, are thus closely interrelated with proprioceptive processing. It is important to notice, in this respect, that although the acquisition of complex motor acts such as dancing or playing a guitar by expert subjects has been demonstrated to modulate observation‐related responses in the MNS including SII [Calvo‐Merino et al., 2005; Cross et al., 2006; Vogt et al., 2007], observation by unskilled subjects did also activate this basic MNS [Cross et al., 2006]. This underscores the unique circumstance of AO being unable to make a distinct simple movement, in which recruitment of particularly SII fails during the observation of such movement.
With regard to the relation between proprioceptive processing and movement representation, SII may be fundamental for matching sensory input onto one's own body schema to code the potency of actually performing the same actions. SII may thus constitute the neural substrate for storage of kinesthetic limb postures and map these representations onto the premotor and motor regions containing the corresponding motor programs [Sirigu et al., 1996]. The interplay between parietal and premotor regions fit the concept of corollary discharge in which efference copies of generated movements are conveyed to sensory circuitry before feedback from muscles and joints takes place [McCloskey, 1981; Poulet and Hedwig, 2007]. By doing this, incoming proprioceptive information can be filtered from information induced by motor commands [Grush, 2004]. In other words, movement‐induced sensory feedback can be distinguished from predicted feedback. For the upper extremity such functional connection between the (left) anterior parietal and PMC is present and is involved in (body‐scheme referenced) object manipulation [Binkofski et al., 1998; de Jong et al., 2001; Sakata et al., 1997]. This is further supported by the (left) anterior parietal involvement that was present when comparing first‐person perspective based motor‐imagery with third‐person motor imagery [Ruby and Decety, 2001].
Conclusion
Taken together, we found a deficit in the representation of a command function for a movement never made before. Particularly, the lack of SII recruitment was a consistent feature related to the inability to perform such unfamiliar movement. The fact that SII also failed to contribute to imagery or observation of these unfamiliar and not of familiar movements indicates that actual experience is a prerequisite for vivid movement observation and imagery. This is further supported by the fact that these differences disappeared after skill acquisition by training. The proposed role of SII in linking overt and covert motor performance provides further insight in mechanisms by which motor imagery may improve both rehabilitation in motor lesions and achievements in sport.
Acknowledgements
We thank Dr. R. J. Renken, Dr. Valeria Gazzola, and Prof. Christian Keysers for supporting the analysis of the data and providing comments on the manuscript.
REFERENCES
- Alary F, Simoes C, Jousmaki V, Forss N, Hari R ( 2002): Cortical activation associated with passive movements of the human index finger: An MEG study. NeuroImage 15: 691–696. [DOI] [PubMed] [Google Scholar]
- Avikainen S, Forss N, Hari R ( 2002): Modulated activation of the human SI and SII cortices during observation of hand actions. NeuroImage 15: 640–646. [DOI] [PubMed] [Google Scholar]
- Binkofski F, Dohle C, Posse S, Stephan KM, Hefter H, Seitz RJ, Freund HJ ( 1998): Human anterior intraparietal area subserves prehension: A combined lesion and functional MRI activation study. Neurology 50: 1253–1259. [DOI] [PubMed] [Google Scholar]
- Binkofski F, Kunesch E, Classen J, Seitz RJ, Freund HJ. ( 2001): Tactile apraxia: Unimodal apractic disorder of tactile object exploration associated with parietal lobe lesions. Brain 124 ( Pt 1): 132–144. [DOI] [PubMed] [Google Scholar]
- Brett M, Anton J, Valabregue R, Poline JB. ( 2002): Region of interest analysis using an SPM toolbox. Proceedings of the 8th International Conference on Functional Mapping of the Human Brain, Sendai, Japan.
- Buccino G, Lui F, Canessa N, Patteri I, Lagravinese G, Benuzzi F, Porro CA, Rizzolatti G ( 2004): Neural circuits involved in the recognition of actions performed by nonconspecifics: An FMRI study. J Cogn Neurosci 16: 114–126. [DOI] [PubMed] [Google Scholar]
- Calvo‐Merino B, Glaser DE, Grèzes J, Passingham RE, Haggard P ( 2005): Action observation and acquired motor skills: An FMRI study with expert dancers. Cereb Cortex 15: 1243–1249. [DOI] [PubMed] [Google Scholar]
- Catmur C, Walsh V, Heyes C ( 2007): Sensorimotor learning configures the human mirror system. Curr Biol 17: 1527–1531. [DOI] [PubMed] [Google Scholar]
- Costantini M, Galati G, Ferretti A, Caulo M, Tartaro A, Romani G, Aglioti SM ( 2005): Neural systems underlying observation of humanly impossible movements: An FMRI study. Cereb Cortex 15: 1761–1767. [DOI] [PubMed] [Google Scholar]
- Cross ES, Hamilton AF, Grafton ST ( 2006): Building a motor simulation de novo: Observation of dance by dancers. NeuroImage 31: 1257–1267. [DOI] [PMC free article] [PubMed] [Google Scholar]
- de Jong BM, van der Graaf FH, Paans AM ( 2001): Brain activation related to the representations of external space and body scheme in visuomotor control. NeuroImage 14: 1128–1135. [DOI] [PubMed] [Google Scholar]
- de Jong BM, Leenders KL, Paans AMJ ( 2002): Right parieto‐premotor activation related to limb‐independent antiphase movement. Cereb Cortex 12: 1213–1217. [DOI] [PubMed] [Google Scholar]
- de Lange FP, Hagoort P, Toni I ( 2005): Neural topography and content of movement representations. J Cogn Neurosci 17: 97–112. [DOI] [PubMed] [Google Scholar]
- de Vries P, Johnson KA, de Jong BM, Gieteling EW, Bohning DE, George MS, Leenders KL ( 2008): Changed patterns of cerebral activation related to clinically normal hand movement in cervical dystonia. Clin Neurol Neurosurg 110: 120–128. [DOI] [PubMed] [Google Scholar]
- Decety J ( 1996): Do imagined and executed actions share the same neural substrate? Brain Res Cogn Brain Res 3: 87–93. [DOI] [PubMed] [Google Scholar]
- Duffy FH, Burchfiel JL ( 1971): Somatosensory system: Organizational hierarchy from single units in monkey area 5. Science 172: 273–275. [DOI] [PubMed] [Google Scholar]
- Dumoulin SO, Bittar RG, Kabani NJ, Baker CL, Le Goualher G, Bruce Pike G, Evans AC ( 2000): A new anatomical landmark for reliable identification of human area V5/MT: A quantitative analysis of sulcal patterning. Cereb Cortex 10: 454–463. [DOI] [PubMed] [Google Scholar]
- Ehrsson HH, Geyer S, Naito E ( 2003): Imagery of voluntary movement of fingers, toes, and tongue activates corresponding body‐part‐specific motor representations. J Neurophysiol 90: 3304–3316. [DOI] [PubMed] [Google Scholar]
- Eickhoff SB, Stephan KE, Mohlberg H, Grefkes C, Fink G, Amunts K, Zilles K ( 2005): A new SPM toolbox for combining probabilistic cytoarchitectonic maps and functional imaging data. NeuroImage 25: 1325–1335. [DOI] [PubMed] [Google Scholar]
- Eickhoff SB, Grefkes C, Zilles K, Fink GR ( 2007): The somatotopic organization of cytoarchitectonic areas on the human parietal operculum. Cereb Cortex 17: 1800–1811. [DOI] [PubMed] [Google Scholar]
- Eickhoff SB, Grefkes C, Fink G, Zilles K. ( 2008): Functional lateralization of face, hand, and trunk representation in anatomically defined human somatosensory areas. Cereb Cortex 18: 2820–2830. [DOI] [PMC free article] [PubMed] [Google Scholar]
- Freund HJ ( 2003): Somatosensory and motor disturbances in patients with parietal lobe lesions. Adv Neurol 93: 179–193. [PubMed] [Google Scholar]
- Gazzola V, Keysers C ( 2008): The observation and execution of actions share motor and somatosensory voxels in all tested subjects: Single‐subject analyses of unsmoothed fMRI data. Cereb Cortex 19: 1239–1255. [DOI] [PMC free article] [PubMed] [Google Scholar]
- Gieteling EW, Vanrijn M, De Jong BM, Hoogduin JM, Renken R, Vanhilten J, Leenders KL ( 2008): Cerebral activation during motor imagery in complex regional pain syndrome type 1 with dystonia. Pain 134: 302–309. [DOI] [PubMed] [Google Scholar]
- Goldenberg G, Podreka I, Steiner M, Willmes K, Suess E, Deecke L ( 1989): Regional cerebral blood flow patterns in visual imagery. Neuropsychologia 27: 641–664. [DOI] [PubMed] [Google Scholar]
- Grafton ST, Arbib MA, Fadiga L, Rizzolatti G ( 1996): Localization of grasp representations in humans by positron emission tomography. II. Observation compared with imagination. Exp Brain Res 112: 103–111. [DOI] [PubMed] [Google Scholar]
- Grodd W, Hülsmann E, Lotze M, Wildgruber D, Erb M ( 2001): Sensorimotor mapping of the human cerebellum: fMRI evidence of somatotopic organization. Hum Brain Mapp 13: 55–73. [DOI] [PMC free article] [PubMed] [Google Scholar]
- Grush R ( 2004): The emulation theory of representation: Motor control, imagery, and perception. Behav Brain Sci 27: 377–442. [DOI] [PubMed] [Google Scholar]
- Guillot A, Collet C, Nguyen VA, Malouin F, Richards C, Doyon J ( 2008a): Functional neuroanatomical networks associated with expertise in motor imagery. NeuroImage 41: 1471–1483. [DOI] [PubMed] [Google Scholar]
- Guillot A, Collet C, Nguyen VA, Malouin F, Richards CL, Doyon J ( 2008b): Brain activity during visual versus kinesthetic imagery: An fMRI study. Hum Brain Mapp 30: 2157–2172. [DOI] [PMC free article] [PubMed] [Google Scholar]
- Henson RN, Rugg MD ( 2003): Neural response suppression, haemodynamic repetition effects, and behavioural priming. Neuropsychologia 41: 263–270. [DOI] [PubMed] [Google Scholar]
- Higuchi S, Roberts N, Eickhoff S, Vogt S. ( 2008): Pure observational vs imitation practice of hand actions: Correlation between behavioural outcome and neural activations. NeuroImage 41 ( Suppl 1). p 145.18374603 [Google Scholar]
- Hinkley LB, Krubitzer LA, Nagarajan SS, Disbrow EA ( 2007): Sensorimotor integration in S2, PV, and parietal rostroventral areas of the human sylvian fissure J Neurophysiol 97: 1288–1297. [DOI] [PMC free article] [PubMed] [Google Scholar]
- Hyvärinen J ( 1982): Posterior parietal lobe of the primate brain. Physiol Rev 62: 1060–1129. [DOI] [PubMed] [Google Scholar]
- Inoue K, Yamashita T, Harada T, Nakamura S ( 2002): Role of human SII cortices in sensorimotor integration. Clin Neurophysiol 113: 1573–1578. [DOI] [PubMed] [Google Scholar]
- Isaac A, Marks D, Russell D ( 1986): An instrument for assessing imagery of movement: The Vividness of Movement Imagery Questionnaire (VMIQ). J Mental Imagery 10: 23–30. [Google Scholar]
- Jäncke L, Kleinschmidt A, Mirzazade S, Shah NJ, Freund HJ ( 2001): The role of the inferior parietal cortex in linking the tactile perception and manual construction of object shapes. Cereb Cortex 11: 114–121. [DOI] [PubMed] [Google Scholar]
- Jeannerod M ( 1994): The representing brain: Neural correlates of motor intention and imagery. Behav Brain Sci 17: 187–245. [Google Scholar]
- Jeannerod M ( 1999): The 25th Bartlett Lecture. To act or not to act: Perspectives on the representation of actions. Q J Exp Psychol A 52: 1–29. [DOI] [PubMed] [Google Scholar]
- Jeannerod M ( 2001): Neural simulation of action: A unifying mechanism for motor cognition. NeuroImage 14( 1 Pt 2): S103–S109. [DOI] [PubMed] [Google Scholar]
- Jenmalm P, Schmitz C, Forssberg H, Ehrsson HH ( 2006): Lighter or heavier than predicted: Neural correlates of corrective mechanisms during erroneously programmed lifts. J Neurosci 26: 9015–9021. [DOI] [PMC free article] [PubMed] [Google Scholar]
- Kasess CH, Windischberger C, Cunnington R, Lanzenberger R, Pezawas L, Moser E ( 2008): The suppressive influence of SMA on M1 in motor imagery revealed by fMRI and dynamic causal modeling. NeuroImage 40: 828–837. [DOI] [PubMed] [Google Scholar]
- Keysers C, Perrett DI ( 2004): Demystifying social cognition: A Hebbian perspective. Trends Cogn Sci 8: 501–507. [DOI] [PubMed] [Google Scholar]
- Krubitzer LA, Kaas JH ( 1990): The organization and connections of somatosensory cortex in marmosets. J Neurosci 10: 952–974. [DOI] [PMC free article] [PubMed] [Google Scholar]
- Lafleur MF, Jackson PL, Malouin F, Richards CL, Evans AC, Doyon J ( 2002): Motor learning produces parallel dynamic functional changes during the execution and imagination of sequential foot movements. NeuroImage 16: 142–157. [DOI] [PubMed] [Google Scholar]
- McCloskey DI ( 1981): Corollary discharges: Motor commands and perception. Handb Physiol 32: 1415–1447. [Google Scholar]
- Mulder T, Zijlstra S, Zijlstra W, Hochstenbach J ( 2004): The role of motor imagery in learning a totally novel movement. Exp Brain Res 154: 211–217. [DOI] [PubMed] [Google Scholar]
- Naito E ( 2004): Sensing limb movements in the motor cortex: How humans sense limb movement. Neurosci 10: 73–82. [DOI] [PubMed] [Google Scholar]
- Naito E, Roland PE, Grefkes C, Choi HJ, Eickhoff S, Geyer S, Zilles K, Ehrsson HH ( 2005): Dominance of the right hemisphere and role of area 2 in human kinesthesia. J Neurophysiol 93: 1020–1034. [DOI] [PubMed] [Google Scholar]
- Oldfield RC ( 1971): The assessment and analysis of handedness: The Edinburgh inventory. Neuropsychologia 9: 97–113. [DOI] [PubMed] [Google Scholar]
- Orr EL, Lacourse MG, Cohen MJ, Cramer SC ( 2008): Cortical activation during executed, imagined, and observed foot movements. Neuroreport 19: 625–630. [DOI] [PubMed] [Google Scholar]
- Owen AM, Coleman MR, Boly M, Davis MH, Laureys S, Pickard JD ( 2006): Detecting awareness in the vegetative state. Science 313: 1402. [DOI] [PubMed] [Google Scholar]
- Perani D, Fazio F, Borghese NA, Tettamanti M, Ferrari S, Decety J, Gilardi MC ( 2001): Different brain correlates for watching real and virtual hand actions. NeuroImage 14: 749–758. [DOI] [PubMed] [Google Scholar]
- Poulet JF, Hedwig B ( 2007): New insights into corollary discharges mediated by identified neural pathways. Trends Neurosci 30: 14–21. [DOI] [PubMed] [Google Scholar]
- Rizzolatti G, Craighero L ( 2004): The mirror‐neuron system. Annu Rev Neurosci 27: 169–192. [DOI] [PubMed] [Google Scholar]
- Ruby P, Decety J ( 2001): Effect of subjective perspective taking during simulation of action: A PET investigation of agency. Nat Neurosci 4: 546–550. [DOI] [PubMed] [Google Scholar]
- Sainburg RL, Ghilardi MF, Poizner H, Ghez C ( 1995): Control of limb dynamics in normal subjects and patients without proprioception. J Neurophysiol 73: 820–835. [DOI] [PMC free article] [PubMed] [Google Scholar]
- Sakata H, Taira M, Kusunoki M, Murata A, Tanaka Y ( 1997): The TINS Lecture. The parietal association cortex in depth perception and visual control of hand action. Trends Neurosci 20: 350–357. [DOI] [PubMed] [Google Scholar]
- Simoes C, Alary F, Forss N, Hari R ( 2002): Left‐hemisphere‐dominant SII activation after bilateral median nerve stimulation. NeuroImage 15: 686–690. [DOI] [PubMed] [Google Scholar]
- Sirigu A, Duhamel JR, Cohen L, Pillon B, Dubois B, Agid Y ( 1996): The mental representation of hand movements after parietal cortex damage. Science 273: 1564–1568. [DOI] [PubMed] [Google Scholar]
- Solodkin A, Hlustik P, Chen EE, Small SL ( 2004): Fine modulation in network activation during motor execution and motor imagery. Cereb Cortex 14: 1246–1255. [DOI] [PubMed] [Google Scholar]
- Stenekes MW, Hoogduin JM, Mulder T, Geertzen JH, Leenders KL, Nicolai JP, de Jong BM ( 2006): Functional dominance of finger flexion over extension, expressed in left parietal activation. NeuroImage 32: 676–683. [DOI] [PubMed] [Google Scholar]
- van Duinen H, Zijdewind I, Hoogduin H, Maurits N ( 2005): Surface EMG measurements during fMRI at 3T: Accurate EMG recordings after artifact correction. NeuroImage 27: 240–246. [DOI] [PubMed] [Google Scholar]
- Vogt S, Buccino G, Wohlschläger AM, Canessa N, Shah NJ, Zilles K, Eickhoff SB, Freund HJ, Rizzolatti G, Fink GR ( 2007): Prefrontal involvement in imitation learning of hand actions: Effects of practice and expertise. NeuroImage 37: 1371–1383. [DOI] [PubMed] [Google Scholar]
- Wasaka T, Kida T, Nakata H, Akatsuka K, Kakigi R ( 2007): Characteristics of sensori‐motor interaction in the primary and secondary somatosensory cortices in humans: A magnetoencephalography study. Neuroscience 149: 446–456. [DOI] [PubMed] [Google Scholar]
- Watson JD, Myers R, Frackowiak RS, Hajnal JV, Woods RP, Mazziotta JC, Shipp S, Zeki S ( 1993): Area V5 of the human brain: Evidence from a combined study using positron emission tomography and magnetic resonance imaging. Cereb Cortex 3: 79–94. [DOI] [PubMed] [Google Scholar]
- Wegner K, Forss N, Salenius S ( 2000): Characteristics of the human contra‐ versus ipsilateral SII cortex. Clin Neurophysiol 111: 894–900. [DOI] [PubMed] [Google Scholar]