Abstract
The objectives of this study were to examine the reproducibility of the MEGA‐editing J‐difference technique and to determine the normal variation in the γ‐aminobutyric acid (GABA) level depending on the cerebral region and its fluctuation according to the menstrual cycle as baseline data for clinical application. The participants consisted of 15 normal adult volunteers (eight men and seven women), and all measurements were repeated twice in all participants. The MEGA‐editing pulses were incorporated into point‐resolved spectroscopy on a 3 T instrument to obtain the J‐difference editing spectra from a voxel located in the lentiform nuclei (LN), left frontal lobe (FL), and anterior cingulate cortex (AC). The GABA levels in the gray matter (GM) were compensated by the fraction ratios of the gray and white matters and cerebrospinal fluid in the measurement volume. The extent of the variation in GABA was almost the same as that observed in the major metabolites, and its reproducibility was also maintained (intraclass correlation coefficient > 0.7). GABA level was highest in LN and lowest in AC. A difference in the GABA level between the follicular and luteal phases of the menstrual cycle was found in both LN and FL, but not in AC. This technique showed the differences in the GABA levels in the GM and the region‐specific decrease in the GABA levels during the women's luteal phase. Hum Brain Mapp, 2011. © 2010 Wiley‐Liss, Inc.
Keywords: MEGA, GABA, menstrual cycle, MRS, reproducibility
INTRODUCTION
Gamma‐aminobutyric acid (GABA) is the major inhibitory neurotransmitter in the human brain and is related to various neurotransmission disorders. Proton MR spectroscopy (MRS) can detect GABA resonance, and a MEGA‐editing technique incorporated on point‐resolved spectroscopy (PRESS) has been introduced as MEGA‐PRESS by Mescher et al. [1998] to detect small GABA signals. In this study, MEGA‐PRESS was installed into a clinical 3 T MRI instrument for daily practical application during patient evaluation, and the LCModel [Provencher,1993] was used for the postprocessing analysis to diminish the contamination by macromolecules (MM) and increase the reliability of the curve fitting with quality control of the obtained spectrum by the Cramer‐Rao lower bounds, which are estimates of % SD.
A large difference in GABA concentration between the gray matter (GM) and the white matter (WM) has been demonstrated [Petrof et al.1988]. Therefore, segmentation of the cerebrospinal fluid (CSF), GM, and WM in the measurement volume was conducted in this study to calibrate the differences in the GM fraction for the GABA measurements.
This study was conducted first to examine the reproducibility of the MEGA‐editing J‐difference technique and, next, to determine the normal variation or difference in the GABA level depending on cerebral region as well as its fluctuation in relation to the female menstrual cycle in the different cerebral regions after compensation for the GM fraction. These data may provide important reference values when this technique is applied to patients in the clinical setting.
MATERIALS AND METHODS
Fifteen normal young adult volunteers (eight men and seven women; average, 22 years of age) participated in this study, and measurements were conducted twice on all participants to evaluate the measurement reproducibility in the men and the influence of the menstrual cycle in the women. An informed consent for this study was given by each participant according to procedures approved by the Institutional Review Board (No. 207). The two measurements in the men were conducted within 1 week under the same measurement conditions, and those in the women were conducted during the follicular and luteal phases, as determined by their menstrual periods, which were determined by the onset of menstruation and change of basal oral temperature, which is elevated at ovulation and remains elevated throughout the luteal phase. The follicular and luteal phases occurred within 5 days after the completion of menstrual bleeding and within 7 days before the next menstruation, respectively. A urine sample was taken early in the morning on the day of the MRS measurement to confirm the change in ovarian hormones (pregnanediol‐3‐glucuronide).
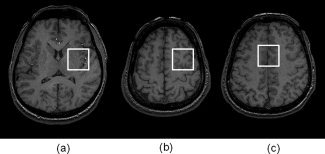
All experiments were performed with a clinical 3 T MRI instrument (Signa 3T HD, GE, Milwaukee, WI) and a standard volume birdcage type headcoil for the RF transmission and receiver. This MRI instrument is usually used for routine clinical examinations and is not used for research purposes except in the case of this study, as approved by the Institutional Review Board. MEGA was incorporated into a spin echo sequence (PRESS) as described in previous reports by Mescher et al. [1996, 1998]. With the MEGA scheme, a spectral editing of GABA was achieved using Gaussian 180° refocused pulses; as the counterpart, a nonrefocused J evolution spectrum for the GABA resonances at 3.02 ppm was obtained. Therefore, the difference in the acquired spectra provided an edited spectrum of GABA (3.02 ppm). MEGA‐PRESS with repetition time (TR) = 1.5 s, echo time (TE) = 68 ms, and sum of signals = 256 were acquired from a voxel (size = 3 × 3 × 3 cm3) located in the lentiform nuclei (LN), left frontal lobe (FL), or anterior cingulate cortex (AC), as shown in Figure 1. The reasons for the selection of these brain areas were both because of their vulnerability to neurological or psychological diseases, such as, schizophrenia or autism, and the possibility of obtaining stable MRS measurements with high quality. Furthermore, LN was chosen because of the related area with the main GABAergic projections. These locations were measured not only in men but, also in women, and the changes in the GABA level influenced by the menstrual cycle were compared in the different brain areas in order to investigate the regional differences in ovarian hormonal influence. Segmentation of the GM, WM, and CSF within the voxel was carried out on 3D‐Spoiled Gradient Recalled echo (SPGR) images with TR = 10 ms, TE = 4.2 ms, slice thickness = 0.8 mm, matrix = 256 × 256, field of view = 24 × 24 cm, and flip angle = 15° on the basis of the intensity of each voxel. The FMRIB's Automated Segmentation Tool (FAST, Image Analysis Group at Oxford University) and the MEDx imaging software package (version 3.4.3, Medical Numerics, Germantown, MD) were used for segmentation.
Figure 1.

Three locations for measurement of GABA. Voxel placed on the (a) lentiform nuclei (LN), (b) frontal lobe (FL), and (c) anterior cingulate cortex (AC).
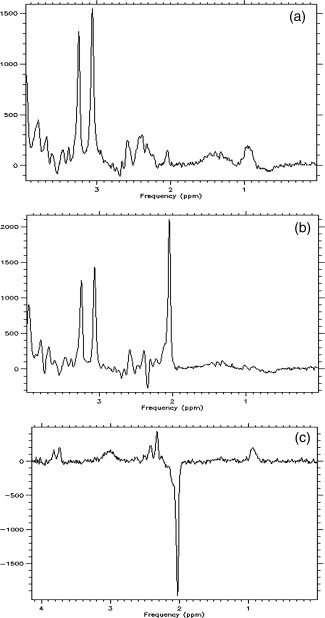
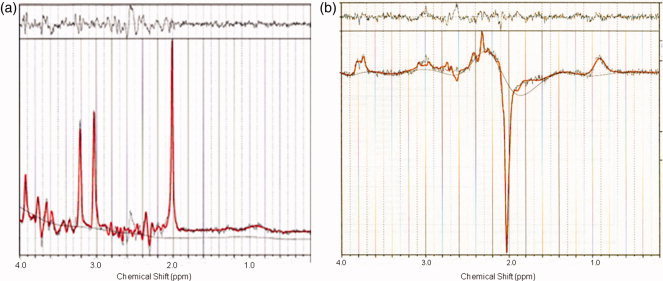
In a single measurement of each cerebral location, two spectra (a J evolution refocused spectrum and a nonrefocused conventional spectrum) and a subtracted spectrum were obtained, as shown in Figure 2. The postprocessing of each spectrum was conducted using the LCModel (version 6.2) [Provencher,1993], as shown in Figure 3. To prepare a basis set for the LCModel, the in vitro spectrum of the following chemicals were obtained under the same conditions as those in the human study: GABA, glutamine (Gln), glutamate (Glu), N‐acetyl aspartate (NAA), N‐acetylaspartylglutamate, creatinine (Cr), phosphocreatine, myo‐inositol, glycerophosphocholine, phosphorylcholine, glycine, taurine, glucose, and lactate. A basis‐set for nonrefocused spectra was made from the in vitro spectra of all chemicals. The in vitro spectra of GABA, Gln, Glu, and NAA were incorporated into a basis‐set for J‐difference editing spectra measured by MEGA‐PRESS. The model spectrum of MM supplied with the LCModel package was also incorporated into our original basis‐set. The GABA signal was quantified relative to the Cr signal at 3.03 ppm in the nonrefocused spectrum by the Cr concentration of 8 mM according to the literature value [Harada et al.,1999]. To evaluate the reproducibility of the quantitations of the major metabolites, the NAA and choline signals observed by nonrefocused spectra were calibrated on the basis of the Cr signal using LCModel analysis. Because the relaxation effects of Cr and GABA were typically comparable and assumed to be identical on the basis of previous studies (Terpstra et al.,2002, 2003), the relaxation effect was considered to have a negligible influence on quantitation in this study. The criteria for selecting reliable metabolite concentrations were based on the % SD of the fit for each metabolite. Only results with % SD < 20% were included in the analysis.
Figure 2.

Three spectra obtained by the J‐difference editing method. The upper spectrum (a) is a 1.9 ppm MEGA‐editing refocused spectrum, the middle one (b) is the nonrefocused spectrum, and the lower one (c) is a subtracted J‐difference editing spectrum. The signal from GABA is found at 3.0 ppm.
Figure 3.

Postprocessing using the LCModel of the nonrefocused spectrum (a) and J‐difference editing spectrum (b).
GABA level in the GM fraction was calculated on the basis of the concentration ratio according to the following equation: r = (GABA in WM)/(GABA in GM) between GM and WM, which was previously reported in biopsy specimens:
 |
where vGM, vWM, and vCSF represent the segmented volume ratios (%) of GM, WM, and CSF in a voxel, respectively. The value for r was set at 0.57 according to Petrof et al. [1988].
The statistical difference between two measurements in the same participant was evaluated by the paired t test, and the comparison between different individuals was conducted using the Mann–Whitney U test. Intraclass correlation coefficient (ICC) and coefficient of variance were calculated to evaluate the reproducibility and variation according to previous findings [Harada et al.,1999; Kubo et al.,2003].
RESULTS
The segmented fractions in the voxels are shown in Table I, and the CSF ratios were not significantly different at the three locations. However, the GM ratio of the voxel in FL was smaller than those in LN and AC; this was due to the increase in the WM ratio in FL. GM and WM volume ratios were not significantly different between LN and AC.
Table I.
Tissue segmentation and segmented volume ratios (%) in a voxel (mean ± SD)
| Cerebrospinal fluid | Gray matter | White matter | |
|---|---|---|---|
| Lentiform nucleus | 3.2 ± 1.8 | 66.6 ± 5.3 | 30.2 ± 4.8 |
| Frontal lobe | 2.8 ± 1.7 | 59.4 ± 1.1 | 37.8 ± 1.4 |
| Cingulate | 2.2 ± 1.3 | 68.7 ± 4.1 | 29.1 ± 3.9 |
The reproducibility and variation in the two measurements in the eight men are shown in Table II, and the difference between the first and second measurements was not significant. The extent of variation in GABA was almost the same as that in the other major metabolites, and the ICC of GABA remained at the level of more than 0.7, although it was slightly lower than that of the others.
Table II.
Quantified result of repeated measurements of male subjects to evaluate reproducibility of this technique
| First measurement | Second measurement | ICC | |||
|---|---|---|---|---|---|
| Mean (mM) | CV (%) | Mean (mM) | CV (%) | ||
| GABA | 0.93 | 4.6 | 0.92 | 6.8 | 0.72 |
| NAA | 12.8 | 4.5 | 12.6 | 4.9 | 0.82 |
| Cho | 2.1 | 3.4 | 2.1 | 3.3 | 0.89 |
CV, coefficient of variance; ICC, intraclass correlation coefficient.
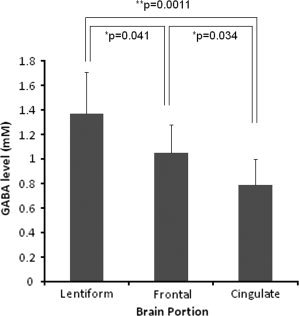
The various GABA levels in relation to the measurement locations in the men are shown in Figure 4. The quantified GABA level in LN (1.37 ± 0.34 mM) was the highest of the three locations, and that of AC (0.79 ± 0.21 mM) was the lowest, with significant differences.
Figure 4.

Quantified GABA level measured by the J‐difference editing spectrum using LCModel curve fitting. GABA levels vary depending on the measurement location with statistical significance (**P < 0.01, *P < 0.05). Error bars represent standard error.
The results of the two measurements in the women are summarized in Table III. The values of pregnanediol‐3‐glucuronide in the follicular phase were from 0.39 to 0.61 (mean ± SD: 0.5 ± 0.07; unit: μg/mL), and those in the luteal phase were from 1.6 to 2.9 (mean ± SD: 2.0 ± 0.25; unit: μg/mL). All of the values in the luteal phase were above the cut‐off value (1.3 μg/mL) at which a participant was considered to be in the luteal phase. Significant differences in the GABA level between the follicular and luteal phases of the menstrual cycle were found in LN and FL; however, in AC, the difference was small, and a significant difference could not be found between the two phases. The GABA levels in LN and FL were decreased in the luteal phase compared with the follicular phase. The dependency of the GABA level on location in the women showed almost the same relationships in the follicular phase as in the men; that is, they were highest in LN and lowest in AC. However, such a difference became ambiguous in the luteal phase because of the decrease in the GABA level in LN and FL.
Table III.
Change in the cortical GABA level depending on female menstrual cycle (unit: mM, mean ± SD)
| Follicular phase | Luteal phase | P value | |
|---|---|---|---|
| Lentiform nucleus | 1.46 ± 0.16 | 1.12 ± 0.13 | 0.0006 |
| Frontal lobe | 1.30 ± 0.22 | 1.07 ± 0.12 | 0.0031 |
| Cingulate | 1.10 ± 0.15 | 0.99 ± 0.22 | 0.360 |
GABA level at the lentiform nucleus and frontal lobe was higher in the follicular phase than in the luteal phase, but that at the cingulate gyrus showed no significant difference during the menstrual cycle by the paired t‐test.
DISCUSSION
The reproducibility of the measurement method is considered to be important, and our results showed that the reproducibility of the GABA measurement method was acceptable compared with that for the measurement of the other major metabolites.
It has been reported that glutamine released by astrocytes is the major source of GABA carbon [Patel et al.,2001], and the glutamate/GABA‐glutamine cycle is associated with the transfer of carbon and nitrogen units [Bak et al.,2006]. Glutamate decarboxylase (GAD) is the principal enzyme involved in the synthesis of GABA, and it is regulated through its interaction with the cofactor pyridoxal‐P [Martin,1987; Martin and Rimvall,1993]. Sutoo et al. [2000] examined the distribution of GAD as a neurochemical and immunohistochemical marker for GABAergic neurons. They reported that the highest levels of GAD were observed in the globus pallidus and hypothalamus, and relatively high levels were localized in the caudate nucleus and putamen. In our study, the GABA level was highest in LN, including the putamen and globus pallidus, which is consistent with the results of Sutoo and others.
In an autographic study with benzodiazepine receptor ligands that interacted with the GABA receptors, Dennis et al. [1988] showed that there were high densities in the lamina IV of the neocortex and that the relative density in the gyrus frontalis was higher than that in the gyrus cinguli. This result is almost consistent with our data, in which the GM GABA level in was higher than that in AC. The variations in GABA level obtained for the men in our study were about 25–27%, which were higher than those of the women in the same menstrual phase. It is thought that the GABA level may be influenced by factors that include the use of nicotine, alcohol, caffeine, or childhood trauma [Enoch et al.,2010; Philibert et al.,2009]. Although we confirmed that the participants did not have a recent smoking habit, we speculated that the large variation among the men may have resulted from the differences in past life history including alcohol consumption and favorite foods.
We observed a difference in the GABA level in FL and LN from the study of the GABA level relative to the menstrual cycle, which is consistent with the result reported by Epperson et al. [2002, 2005]. This difference is thought to be the result of a menstrual cycle‐related fluctuation of the GABA level in the brain and variation in the progesterone and estrogen levels [Lovick,2008; Maguire and Mody,2007]. Our study might indicate that this fluctuation of GABA in the frontal cortex is more prominent than that in the cingulate gyrus. These results suggest that the influence of the menstrual cycle is different depending on the cerebral region. The variation in the GABA level in the AC during the luteal phase was increased (22%), and this may be due to the large hormonal variation during the luteal phase.
However, there still remain several limitations concerning the methodology. One is inherent in the editing technique; specifically, the coediting of the MM coherences and their contamination at the 3.0 ppm peak of GABA. The current analysis using the LCModel minimized the contamination by the MM signal in the GABA quantitation, but the effect of MM contamination might not have been completely eliminated. Another problem is the difficulty of measuring GABA within each separated tissue, that is, the GM and WM. Several studies have been conducted so far concerning the effect of GM and WM on GABA concentration [Choi et al.,2006, 2007; Jensen et al.,2005; Petrof et al.,1988]; however, GM to WM GABA ratios were highly variable from 1.8 to 8.1. Because this variation may depend on differences in either the methods or the threshold for tissue segmentation, the reliability of tissue separation in the measurement of GABA remains to be resolved.
Although several limitations may exist in this study, the MEGA‐editing J‐difference technique at 3 T showed acceptable reproducibility and utility for noninvasive measurement of the GABA level.
REFERENCES
- Bak LK, Schousboe A, Waagepetersen HS ( 2006): The glutamate/GABA‐glutamine cycle: aspects of transport, neurotransmitter homeostasis and ammonia transfer. J Neurochem 98: 641–653. [DOI] [PubMed] [Google Scholar]
- Choi C, Bhardwaj PP, Kalra S, Casault CA, Yasmin US, Allen PS, Coupland NJ ( 2007): Measurement of GABA and contaminants in gray and white matter in human brain in vivo. Magn Reson Med 58: 27–33. [DOI] [PubMed] [Google Scholar]
- Choi I‐Y, Lee S‐P, Merkle H, Shen J ( 2006): In vivo detection of gray and white matter differences in GABA concentration in the human brain. NeuroImage 33: 85–93. [DOI] [PubMed] [Google Scholar]
- Dennis T, Dubois A, Benavides J, Scatton B ( 1988): Distribution of central ω1 (Benzodiazepine1) and ω2 (Benzodiazepine2) receptor subtypes in the monkey and human brain. An autographic study with [3H] Flunitrazepam and the ω1 selective ligand [3H]Zolpidem J Pharmacol Exp Ther 247: 309–322 [PubMed] [Google Scholar]
- Epperson CN, Haga K, Mason GF, Sellers E, Gueorguieva R, Zhang W, Weiss E, Rothman DL, Krystal JH ( 2002): Cortical γ‐aminobutyric acid levels across the menstrual cycle in healthy women and those with premenstrual dysphoric disorder. Arch Gen Psychiatry 59: 851–858. [DOI] [PubMed] [Google Scholar]
- Epperson CN, O'Malley S, Czarkowski KA, Gueorguieva R, Jatlow P, Sanacor G, Rothman DL, Krystal JH, Mason GF ( 2005): Sex, GABA, and Nicotine: The impact of smoking on cortical GABA levels across the menstrual cycle as measured with proton magnetic resonance spectroscopy Biol Psychiatry 57: 44–48. [DOI] [PMC free article] [PubMed] [Google Scholar]
- Enoch MA, Hodgkinson CA, Yuan Q, Shen PH, Goldman D, Roy A ( 2010): The influence of GABRA2, childhood trauma, and their interaction on alcohol, heroine, and cocaine dependence. Biol Psychiatry 67: 20–27. [DOI] [PMC free article] [PubMed] [Google Scholar]
- Harada M, Miyoshi H, Uno M, Okada T, Hisaoka S, Hori A, Nishitani H ( 1999): Neuronal impairment of adult moyamoya disease detected by quantified proton MRS and comparison with cerebral perfusion by SPECT with Tc‐99m HM‐PAO: A trial of clinical quantification of metabolites. J Magn Reson Imaging 10: 124–129. [DOI] [PubMed] [Google Scholar]
- Jensen JE, de B. Frederick B, Renshaw PF ( 2005): Grey and white matter GABA level differences in the human brain using two‐dimensional, J‐resolved spectroscopic imaging. NMR Biomed 18: 570–576. [DOI] [PubMed] [Google Scholar]
- Kubo H, Harada M, Sakama M, Nishitani H ( 2003): Reproducibility of metabolite concentration evaluated by intraclass correlation coefficient using clinical MR apparatus. J Comput Assist Tomogr 27: 449–453. [DOI] [PubMed] [Google Scholar]
- Lovick TA ( 2008): GABA in the female brain—oestrous cycle‐related changes in GABAergic function in the periaqueductal grey matter. Pharmacol Biochem Behav 90: 43–50. [DOI] [PubMed] [Google Scholar]
- Maguire J, Mody I ( 2007): Neurosteroid synthesis‐mediated regulation of GABA(A) receptors: Relevance to the ovarian cycle and stress. J Neurosci 28: 2155–2162. [DOI] [PMC free article] [PubMed] [Google Scholar]
- Martin DL ( 1987): Regulatory properties of brain glutamate decarboxylase. Cell Mol Neurobiol 7: 237–253. [DOI] [PMC free article] [PubMed] [Google Scholar]
- Martin DL, Rimvall K ( 1993): Regulation of gamma‐aminobutyric acid synthesis in the brain. J Neurochem 60: 395–407. [DOI] [PubMed] [Google Scholar]
- Mescher M, Tannus A, Johnson MO, Garwood M ( 1996): Solvent suppression using selective echo dephasing. J Magn Reson (Series A) 123: 226–229. [Google Scholar]
- Mescher M, Merkle H, Kirsch J, Garwood M, Gruetter R ( 1998): Simultaneous in vivo spectral editing and water suppression. NMR Biomed 11: 266–272. [DOI] [PubMed] [Google Scholar]
- Patel AB, Rothman DL, Cline GW, Behar KL ( 2001): Glutamine is the major precursor for GABA synthesis in rat neocortex in vivo following acute GABA‐transaminase inhibition. Brain Res 919: 207–220. [DOI] [PubMed] [Google Scholar]
- Petrof OAC, Ogino T, Alger JR ( 1988): High‐resolution proton magnetic resonance spectroscopy of rabbit brain: Regional metabolite levels and postmortem changes. J Neurochem 51: 163–171. [DOI] [PubMed] [Google Scholar]
- Philibert RA, Gunter TD, Beach SR, Brody GH, Hollenbeck N, Andersen A, Adams W ( 2009): Role of GABRA2 on risk for alcohol, nicotine, and cannabis dependence in the Iowa adoption studies. Psychiatr Genet 19: 91–98. [DOI] [PMC free article] [PubMed] [Google Scholar]
- Provencher SW ( 1993): Estimation of metabolite concentrations from localized in vivo proton NMR spectra. Magn Resona Med 30: 672–679. [DOI] [PubMed] [Google Scholar]
- Sutoo D, Akiyama K, Yabe K ( 2000): Quantitative maps of GABAergic and glutamatergic neuronal systems in the human brain. Hum Brain Mapping 11: 93–103. [DOI] [PMC free article] [PubMed] [Google Scholar]
- Terpstra M, Ugurbil K, Gruetter R ( 2002): Direct in vivo measurement of human cerebral GABA concentration using MEGA‐editing at 7 Tesla. Magn Reson Med 47: 1009–1012. [DOI] [PubMed] [Google Scholar]
- Terpstra M, P‐G Henry, Gruetter R ( 2003): Measurement of reduced glutathione (GSH) in human brain using LCModel analysis of difference‐edited spectra. Magn Reson Med 50: 19–23. [DOI] [PubMed] [Google Scholar]


