

Abstract
Resting‐state functional magnetic resonance imaging (fMRI) can be used to study the functional connectivity in the somatosensory system. However, the relationship between sensory network connectivity, sensory deficits, and structural abnormality remains poorly understood. Previously, we investigated the motor network in children with congenital hemiparesis due to middle cerebral artery strokes (MCA, n = 6) or periventricular lesions (PL, n = 8). In the present study, we validate the use of interleaved resting‐state data from blocked fMRI designs to investigate the somatosensory network in these patients. The approach was validated by assessing the predicted “crossed‐over” connectivity between the cerebral cortex and the cerebellum. Furthermore, the impact on the volume of gray‐matter (GM) in primary (S1) and secondary (S2) somatosensory cortex on functional connectivity measures was investigated. We were able to replicate the well‐known “crossed‐over” pattern of functional connectivity between cerebral and cerebellar cortex. The MCA group displayed more sensory deficit and significantly reduced functional connectivity in the lesioned S2 (but not in lesioned S1) when compared with the PL group. However, when accounting for GM volume loss, this difference disappeared. This study demonstrates the applicability of analyzing resting‐state connectivity in patients with brain lesions. Reductions of functional connectivity within the somatosensory network were associated with sensory deficits, but were fully explained by the underlying GM damage. This underlines the influence of cortical GM volume on functional connectivity measures. Hum Brain Mapp, 2012. © 2011 Wiley Periodicals, Inc.
Keywords: sensory system, cerebral palsy, resting‐state, functional connectivity, fMRI, lateralization index, hemiparesis, gray‐matter volume
INTRODUCTION
Functional connectivity magnetic resonance imaging (fcMRI) is known as the temporal co‐occurrence of neuronal activation between anatomically separate brain regions [Friston et al.,1993; Lee et al.,2003]. In the recent years, resting‐state functional MRI is increasingly used to complement traditional task‐based fcMRI. The concept behind resting‐state is that spontaneous activation fluctuations can be observed when the brain is not involved in an externally cued task. Biswal et al. [1995] demonstrated that the spontaneous low‐frequency (<0.08 Hz) blood oxygen level‐dependent signal fluctuations exhibited a significant level of spatial coherence within the sensorimotor network in a task‐free (or “rest”) setting. These brain resting‐state networks were found to be largely consistent with other measurements of the brain organization such as task‐evoked activations [Smith et al.,2009] and anatomical connectivity [Damoiseaux and Greicius,2009]. Moreover, Fair et al. [2007] showed that the interleaved resting‐state data taken from previous blocked‐related functional magnetic resonance imaging (fMRI) designs are well‐suited for resting‐state fcMRI analyses.
However, how functional connectivity is related to the underlying cortical changes or damages remains to be understood. Although one expects the functional outcome of brain damage to be linked to gray‐matter (GM) alterations [Pinter et al.,2001], a recent study in schizophrenia did not find a correlation between cortical GM reduction and functional connectivity [Lui et al.,2009]. On the other hand, the known changes of cortical GM volume during development have been linked to changes in functional connectivity [Jolles et al., in press; Uddin et al.,2010].
Early brain lesions have been shown to induce substantial neural reorganization owing to the higher plasticity in the developing brain. It has previously been shown that unilateral injury to the developing brain can lead to different patterns of reorganisation of the motor system [Holmström et al.,2010; Staudt et al.,2004]. Many patients with pre‐ or perinatally acquired, unilateral lesions to the motor cortex or the cortico‐spinal tract develop ipsilateral cortico‐spinal pathways to control the paretic hand with the contra‐lesioned hemisphere. This type of reorganization is often observed following unilateral periventricular brain lesions, which damage the cortico‐spinal tracts in the periventricular white matter [Staudt et al.,2002]. Consequently, in this group of patients with periventricular lesions (PL), the primary motor cortex (M1) has been found to be represented in the precentral gyrus ipsilateral to the paretic side. On the contrary, in patients with perinatal unilateral middle cerebral artery (MCA) stroke, M1 has been reorganized to the contralateral precentral gyrus. But despite these inter‐ or intra‐hemispheric reorganizations of motor functions, the primary somatosensory cortex (S1) has been demonstrated to remain in the lesioned hemisphere in both groups [Staudt et al.,2006a; Wilke et al.,2009b].
In recent fMRI study [Wilke et al.,2009b], regarding the pattern of brain activation following sensory stimulation tasks of the paretic hand, we could further demonstrate that the predicted inverse relation between the cerebral cortex and the cerebellum was preserved in these patients, that is, passive movement of the paretic hand activated predominantly the ipsilateral cerebellum and the contralateral S1. This well‐known “crossed‐over” pattern was recently confirmed by O'Reilly et al. [2010] in a group of healthy subjects using resting‐state functional MRI.
Therefore, the first purpose of the current work was to validate the approach of resting‐state fcMRI in the context of reorganized functional networks following early brain lesions. Our patients with unilateral PL present an interesting model to validate this approach. If fcMRI correctly characterizes the functional networks in such patients, it should be able to detect a crossed connectivity between S1 in the lesioned hemisphere and the contra‐lesional cerebellum [O'Reilly et al.,2010], as predicted from the activation fMRI experiments [Wilke et al.,2009b]. The most critical portion here will be the analysis of connectivity between the S1 in the nonlesioned hemisphere and the contralateral cerebellum, because this might be “contaminated” by the ipsilateral M1 in the immediate cortical vicinity.
The second purpose of the current work was to enhance our understanding of the relationship between sensory deficits, changes in functional connectivity, and structural brain changes due to the underlying brain lesion. For this purpose, patients with PL are less suited, because they hardly show somatosensory deficits. Indeed, in our previous work [Wilke et al.,2009b], we detected a higher sensory impairment in patients with unilateral cortico‐subcortical infarctions in the territory of the MCA than in patients with PL lesions. This was tested by the two‐point discrimination test (2‐pd), assessing the distance below which two points of tactile stimulation on both thumbs could not be distinguished anymore [Williams et al.,2006]. This parameter was shown to correlate well with extensive sensory assessments batteries [Williams et al.,2006]. We therefore also investigated patients with MCA lesions, who show variable degrees of somatosensory deficits and cortical GM reduction due to their lesion. As the latter group has more somatosensory deficits than the patients with PL ([Wilke et al.,2009b], see also Table I), it is hypothesized that the MCA patients have less functional connectivity in their somatosensory cortical networks. To rule out an unspecific effect of cortical GM damage, functional connectivity is related to GM damage.
Table I.
Demographic data and the gray‐matter volume from both groups
| Group | Subject | Sex | Age (year) | 2‐pd (ph/nph) | Gray‐matter volume in (arbitrary unit) | |||
|---|---|---|---|---|---|---|---|---|
| Lesioned S1 | Nonlesioned S1 | Lesioned S2 | Nonlesioned S2 | |||||
| MCA | 1 | F | 16 | 2.5/0.15 | 5031.49 | 8666.69 | 0.01 | 1945.67 |
| 2 | M | 20 | 8.5/0.1 | 7443.46 | 10563.55 | 1479.94 | 2515.38 | |
| 3 | F | 19 | 4.4/0.2 | 2713.52 | 6646.25 | 8.47 | 1686.59 | |
| 4 | M | 30 | 4.3/0.4 | 3366.29 | 7944.18 | 154.31 | 2294.21 | |
| 5 | M | 12 | 6/0.5 | 8107.55 | 9948.02 | 1734.22 | 2246.88 | |
| 6 | F | 11 | 1.2/0.2 | 8142.90 | 9108.94 | 2004.99 | 2342.82 | |
| Median | 17.5 | 4.35/0.20 | 6237.00 | 8888.00 | 817.10 | 2271.00 | ||
| PL | 1 | F | 11 | 0.4/0.2 | 7797.20 | 8571.45 | 1657.78 | 2397.10 |
| 2 | M | 12 | 0.3/0.2 | 8702.29 | 12207.24 | 2265.37 | 3085.72 | |
| 3 | F | 21 | 0.6/0.1 | 9472.77 | 10167.99 | 2172.89 | 2384.52 | |
| 4 | M | 12 | 0.7/0.4 | 7854.38 | 10709.32 | 2065.25 | 2750.57 | |
| 5 | M | 19 | 0.3/0.1 | 6084.03 | 8403.59 | 1563.29 | 2452.96 | |
| 6 | M | 16 | 0.5/0.3 | 9834.86 | 11781.63 | 2284.49 | 2740.93 | |
| 7 | F | 30 | 0.8/0.5 | 6007.95 | 7505.73 | 1641.81 | 2047.01 | |
| 8 | M | 11 | 1.5/0.4 | 8827.45 | 10181.99 | 1990.51 | 2182.12 | |
| Median | 14 | 0.55/0.25 | 8278.00 | 10170.00 | 2028.00 | 2425.00 | ||
| P | 0.63 | 0.66 | 0.001*/0.85 | 0.08 | 0.28 | 0.03* | 0.11 | |
Comparison between the two groups (χ2‐test for gender, Mann–Whitney U test for all other variables). Subject numbers correspond to Figure 1. ph/nph, paretic hand/nonparetic hand. *Statistically significant (P < 0.05)..
METHODS
Subjects
Two groups of subjects (n = 14, 8 male, age range, 11–30 years, mean age 17 years) were recruited as part of our previous work investigating the somatosensory system after perinatally acquired unilateral lesions [Juenger et al.,2007; Staudt et al.,2002; Wilke et al.,2009b]. Demographic details are summarized in Table I. One group had a preserved cortical representation of primary motor cortex in the lesioned hemisphere contralateral to the paretic hand as assessed by fMRI and transcranial magnetic stimulation (TMS). This group suffered from a perinatal MCA infarct (MCA group: n = 6, 3 male, mean age 18 years). In the second group, TMS demonstrated a reorganization of M1 in the contra‐lesioned hemisphere ipsilateral to their paretic hand. In these subjects, a PL was the cause of their hemiparesis (PL) (PL group: n = 8, 5 male, mean age 16.5 years). For all subjects in both groups, S1 was identified in the lesioned hemisphere using magnetoencephalography (see Fig. 1 for a comparison of the group characteristics.) Additional demographic and clinical details are given elsewhere [Wilke et al.,2009b]. Informed written consent from patients/parents and approval from the ethical committee of the medical faculty of the University of Tuebingen, Germany, were obtained.
Figure 1.
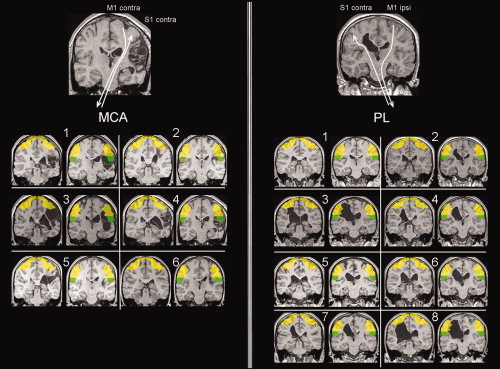
Illustration of lesion type and individual lesion topology. Top part of postcentral mask (S1, yellow; y = −23), and bottom part of postcentral mask (S2, green; y = −33) are shown for all subjects. Top panels: illustration of the organization patterns for motor and somatosensory cortical representation. Subject numbers correspond to Table I. [Color figure can be viewed in the online issue, which is available at wileyonlinelibrary.com.]
Image Acquisition
All experiments were performed on a 1.5‐T Siemens AVANTO scanner. Image acquisition comprised both structural T1‐weighted 3D data sets (FLASH, TR/TE = 11/4.94 ms, resolution = 1 mm3) and a whole‐brain multislice echo‐planar imaging sequence (TR = 3.75 s, TE = 50 ms, 36 axial slices of 3‐mm slice thickness with 3 × 3‐mm2 in‐plane resolution, and 0.75 mm gap). For each subject, the interleaved resting‐state data were taken from previous blocked fMRI data (before therapeutic interventions) as part of an ongoing study [Juenger et al.,2007; Kuhnke et al.,2008; Walther et al.,2009; Wilke et al.,2009b], using a previously established approach (see below [Fair et al.,2007]).
The experimental design was arranged in blocks, with four epochs of rest and four epochs of unilateral hand movement of either the paretic hand and the nonparetic hand. Each epoch consisted of eight scans. The movements were performed passively or actively. The first two volumes of each functional series were removed in order to allow for stabilization of longitudinal magnetization, leaving eight blocks. Thus, this functional data set provided 64 scans for each hand and for each condition (passive or active movement). More detailed descriptions of image acquisition and experimental design can be found elsewhere [Juenger et al.,2007].
Image Data Preprocessing
Images from each participant were preprocessed as described before [Wilke et al.,2009b] (except for spatial smoothing, see below). Briefly, this crucial step in this approach capitalizes on the fact that chronic lesions are overwhelmingly classified as CSF during tissue segmentation [Seghier et al.,2008]. This tissue class is then used as the basis for an automatically generated lesion mask, which in turn is used to implement a cost‐function masking approach [Brett et al.,2001] during spatial normalization. This allows for group analyses [Wilke et al.,2002] despite the large lesions present in these subjects (see Fig. 1). In the MCA group, all lesions were flipped on the right side of the image, and in the PL all lesions were flipped on the left sides, allowing for voxel‐wise analysis [Wilke et al.,2009b].
Preprocessing steps were carried out using custom routines as well as functionality available in statistical parametrical mapping software, SPM5 (Wellcome Department of Imaging Neuroscience, University College, London, UK; http://www.fil.ion.ucl.ac.uk/spm) running in Matlab R2007a (The MathWorks, Natick, MA).
Correlation Preprocessing and Removal of Interleaved Task Blocks
We adopted a previously described approach for using blocked design data to study resting‐state functional connectivity [Fair et al.,2007]. The following additional preprocessing steps were performed. Linear trends were removed from the data through linear regression [Macey et al.,2004], and the images were spatially smoothed (6‐mm full width at half‐maximum [FWHM]) and temporally band‐pass filtered to remove frequencies >0.08 Hz [Cordes et al.,2001]. Furthermore, we applied linear regression to remove nine sources of nuisance (1) regression of six parameters obtained by rigid body head motion correction, (2) regression of the whole brain signal averaged over the whole brain, and (3) regression of the non‐neuronal signals in the ventricles and white matter. The resting‐state epochs were concatenated excluding the task blocks. One frame (3.75 s) after the start of each task block was included as resting‐state to account for hemodynamic delay. At the end of each task block, four frames (15 s) were excluded from the resting‐state data, allowing for the hemodynamic response to return to baseline. This procedure provided 96 resting‐state frames (360 s). This method maximized the number of frames included in the analysis, while minimizing the effect of the task. In this manner, the spontaneous resting state activity is not altered by previous task states [Fair et al.,2007].
Correlation Computation
Using the resting‐state fMRI data analysis toolkit V1.3 (http://resting-fmri.sourceforge.net), the organization of the functional connectivity of the somatosensory system was examined by computing correlation analyses between the time series in a seed region and the time series for all other voxels in the whole brain.
For each subject, we determined one seed region (ROI) (12‐mm diameter spheres centered on selected coordinates) in central region for both the lesioned and nonlesioned hemisphere (respectively, lesioned seed ROI represented the paretic hand, nonlesioned seed ROI represented the nonparetic hand). The coordinates (in MNI space) for each seed region were determined using the previously defined center of mass [Wilke et al.,2009b] of the second‐level fMRI activation from the passive task ([x,y,z] = −42, −27, 63; [x,y,z] = 33, −24, 69 for the MCA group; [x,y,z] = −42, −27, 63; [x,y,z] = 33, −24, 69 for the PL group, nonlesioned and lesioned hemisphere, respectively). To account for the larger spatial variability of activation foci in these subjects, a volume of interest (10 × 10 × 10 voxels) was centered at these coordinates. Within this volume, each individual subject's activation focus was identified in order to determine the most appropriate individual coordinates of these seed region for each subject and for each central region [Wilke et al.,2009a]. Using this two‐step approach restricts the search volume on the one hand but allows using the individual activation foci, thus maximizing sensitivity. It also ensures that the peak activation reflects the somatosensory network by minimizing the influence of a possible M1‐coactivation (in the healthy hand and/or the MCA group).
For each individual dataset, the resting‐state time series of each selected seed region (lesioned or nonlesioned seed ROI) was correlated with the time series of all voxels of the whole brain. This produced individual spatial maps in which the value of the voxels represented the strength of the correlation with the ROIs. The resulting individual functional connectivity maps were converted to a normal distribution using Fischer's Z‐transform [Jenkins and Watts,1968].
Defining Somatosensory Cortex
The somatosensory cortex in this study was defined as the primary somatosensory cortex (S1), which includes the Brodmann areas (BA) 3a, 3b, and 1 on the postcentral gyrus [Zilles,2003] as well as the secondary somatosensory cortex (S2) located in the subcentral section lateroventral to the postcentral gyrus on the parietal operculum 1 (OP1) [Eickhoff et al.,2010]. The cerebellar mask and postcentral region were defined using standard anatomical delineations available within WFU_Pickatlas version 2.4 software [Maldjian et al.,2003]. These masks were smoothed by 6‐mm FWHM and then binarized in order to render them slightly more inclusive. Then, we generated equivalents of S1 and S2 by dividing the postcentral mask into two parts (top part [S1] and bottom part [S2]) at a level previously defined [Eickhoff et al.,2010].
Validation of the Approach by Assessing the Cerebello‐Cortical Cross‐Over Pattern
The validity of this approach in our population with atypical brain morphology (with some major brain defect) was tested by calculating the lateralization index (LI) of functional connectivity correlations. It has been shown before [O'Reilly et al.,2010] in healthy subjects that resting‐state functional connectivity is well suited to assess the predicted inverse relation between lateralization indices obtained from cerebral cortex and cerebellum [Gao et al.,1996]. Moreover, we have previously demonstrated [Wilke et al.,2009b] that this “crossed‐over” cortico‐cerebellar circuitry is well preserved for the nonparetic and paretic hand. Consequently, if our resting‐state fcMRI analysis reflects somatosensory neural connectivity in our patients, the correlation maps should also show this pattern, with voxels in the right central region correlating more strongly with left cerebellum, and vice versa, irrespective of the location of the lesion [Gao et al.,1996; O'Reilly et al.,2010; Wilke et al.,2009b].
Correlation coefficients of functional connectivity in cerebellum and in S1 were used to calculate an overall weighted bootstrapped LI [Wilke and Schmithorst,2006] using a designated SPM‐toolbox (LI‐toolbox [Wilke and Lidzba,2007]). Lateralization indices were generated for each mask. LI varies between −1 (for purely right hemisphere dominance) to +1 (for purely left hemisphere dominance).
Definition of Functional Connectivity
Functional connectivity was defined as the number of voxels connected from the seed ROI to each of the following brain regions: S1, S2, and cerebellum. Because this value must be expected to be threshold‐dependent, the number of voxels was adjusted by the respective threshold. We calculated a weighted mean (m w) using the following equation:
where n is the number of connected voxels and thr the threshold.
Relationship of Functional Connectivity With GM Volume
To account for the amount of cortical gray‐matter (GM) within a region of interest when assessing functional connectivity, a ratio (m w/GM) was calculated. Thus, this ratio allows relating functional connectivity to the volume of GM.
The volume of GM was calculated by summing the GM voxel values from modulated GM maps in each region of interest from each subject. Although no attempt was made to express absolute volumes, these numbers reflect true tissue volumes in this tissue class [Good et al.,2001].
Statistical Analyses
Because of small sample sizes, statistical analyses were performed using the nonparametrical Mann–Whitney U test. Significance was assumed at P ≤ 0.05. Values are expressed as median ± median absolute deviation. For assessing gender composition, the χ2 test was used.
RESULTS
Cortico‐Cerebellar Connectivity of Somatosensory Networks in Resting State
The LI (see Fig. 2) describing the functional connectivity between the lesioned or nonlesioned sensory seed ROI to S1 (X‐axis) and cerebellum (Y‐axis) showed a crossed‐over pattern for each hand (nonparetic and paretic hands). Although this general pattern was found in both groups, for the paretic hand, two outliers were found in the PL group and two in the MCA group; for the nonparetic hand, one outlier was found in the PL group and one in the MCA group. These outliers are not identical to the outliers previously described [Wilke et al.,2009b]. The outliers were both found in the lateralization of cerebellar connectivity, while the LI in S1 were as expected.
Figure 2.
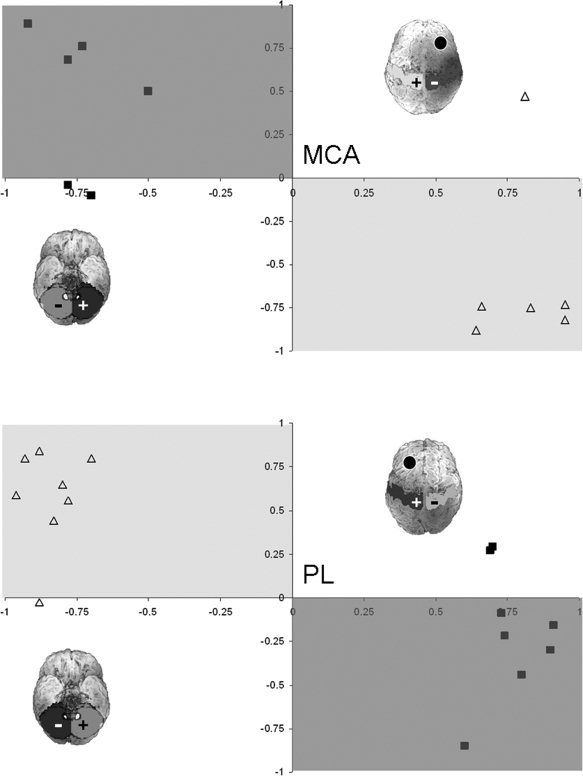
Comparison of lateralization in S1 (X‐axis) versus cerebellar (Y‐axis) regions of interest for the lesioned seed ROI (closed squares) and nonlesioned seed ROI (open triangles). The light gray‐shaded region indicates the predicted area for the nonlesioned seed ROI; the dark gray‐shaded region indicates the predicted area for the lesioned seed ROI. The rendered brains illustrate schematically the region of interest (top of the postcentral gyrus mask and cerebellum mask) and the side of the lesion (denote by a black circle).
Functional Connectivity of the Resting‐State Somatosensory Network
No significant difference was found in functional connectivity between the seed ROI in the lesioned hemisphere and lesioned S1 between the two groups (PL: m w = 1117 ± 173 voxels; MCA: m w = 711 ± 140 voxels, P = 0.11) (Fig. 3A). Neither was there any significant difference (Fig. 3B) in functional connectivity between lesioned S1 and nonlesioned S1) (PL: m w = 248 ± 84 voxels; MCA: m w = 220 ± 74 voxels, P = 0.34).
Figure 3.
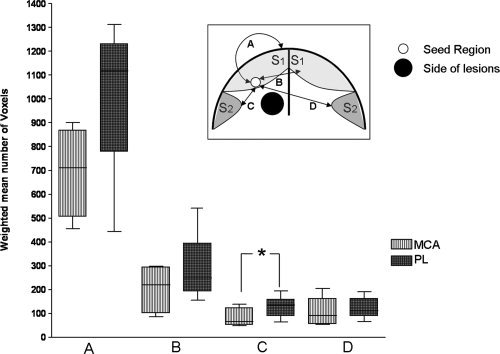
Comparison of functional connectivity between the two groups from the lesioned seed ROI to: (A) lesioned S1; (B) nonlesioned S1; (C) lesioned S2 (Mann–Whitney test, P = 0.04); (D) nonlesioned S2. Insert: schematic representation of a coronal brain slice demonstrating the connections from seed region to masks of interest.
The functional connectivity between the lesioned seed ROI to the lesioned S2 was significant lower (Fig. 3C) in the MCA group than in the PL (m w = 66 ± 14 for MCA; m w = 136 ± 30 for PL, P = 0.04). Functional connectivity between lesioned seed region and nonlesioned S2 was not different between the groups (PL: m w = 111 ± 38 voxels; MCA: m w = 91 ± 31 voxels, P = 0.34) (Fig. 3D).
There was no significant difference in functional connectivity between lesioned seed ROI to either cerebellar hemisphere (PL: m w = 781 ± 96 voxels; MCA: m w = 1176 ± 633 voxels, P = 0.34 and PL: m w = 588 ± 233 voxels; MCA: m w = 579 ± 136 voxels, P = 0.75, respectively).
Connectivity of the Resting‐State Somatosensory Network in Relation to the Volume of Cortical GM
The PL group has higher GM volume in lesioned S2 (P = 0.03). Gray‐matter (GM) volume and the comparison between the two groups are given in Table I. When accounting for the GM volume in the mask, no significant group differences were found between the two groups. For the lesioned S1, the median ratio in MCA group was 0.13; for the PL, the median ratio was 0.13 (P = 0.85). For the lesioned S2, the median ratios were 0.21 and 0.07 (P = 0.34) for MCA and for PL, respectively. For the ipsilesional cerebellum, the median ratios were 0.01 and 0.01 (MCA and PL, respectively; P = 0.85), and for the contralesional cerebellum, the median ratios were 0.02 and 0.02 (MCA and PL, respectively; P = 0.41).
DISCUSSION
In summary, this study demonstrates the validity of our resting‐state approach to assess the sensory system in CP patients with major brain defects. As expected, subjects in the MCA group had significantly less functional connectivity in the somatosensory cortex than subjects in the PL group. Interestingly, when subdividing the somatosensory cortex, the difference in connectivity was found in S2 rather than in S1 of the lesioned hemisphere. However, this difference in connectivity between our two groups disappeared when correcting for the cortical GM volume of S2. Consequently, the diminished cortical volume (occurring in the MCA group but not in the PL) appeared to be the principal negative contributor to the somatosensory connections. The results shall now be discussed in more detail.
Using functional connectivity derived from resting‐state data, we were able to replicate the “crossed‐over” pattern (Fig. 2) between cerebral and cerebellar cortex, as observed in our previous study with the same patients using conventional fMRI [Wilke et al.,2009b]. This finding indicates that the cortico‐cerebellar circuitry in the somatosensory system is preserved in both hands and for both groups. Indeed, this pattern of lateralization was already shown in healthy adults in a resting‐state fcMRI study [O'Reilly et al.,2010]. The cerebellum has both afferent and efferent connections to the somatosensory cortex [Schmahmann and Pandya,1992], and cerebellar efferent fibers traverse the thalamus before reaching the cerebral cortex. Accordingly, sensory input to one hand evokes contralateral activation in S1 and ipsilateral activation in the cerebellum [Gao et al.,1996].
In contrast to the expected lateralization found in S1, a few subjects (one or two) in each group and for each hand did not “fit the pattern” regarding the lateralization indices in the contralateral cerebellum. These outliers were not identical to the outliers for the LI in our previous work [Wilke et al.,2009b] and might be due to the relatively unspecific cerebellar mask, which included all subregions of the cerebellum. O'Reilly et al. [2010] found that the cerebellum can be divided into at least two zones: a primary somatosensory zone (lobules V, VI, and VIII), which are more connected with somatosensory cortex and a supramodal zone (lobules VIIa, Crus I, and II), which are not directly involved in sensory processing. Including the whole cerebellum, our mask may not have been specific enough. However, the question of whether these outliers are the results of a shortcoming in this analysis or represent a different mode of reorganization can currently not be answered as the small number of occurrences prohibits more detailed analyses.
Although resting‐state functional connectivity is not a direct measure of anatomical connectivity, this method may predict up to 80% of structural connections—even if mediated by multisynaptic pathways—between two regions [Hagmann et al.,2008; Honey et al.,2009]. We here used an approach that avoids using a fixed threshold when defining functional connectivity by implementing a weighted mean [Wilke and Schmithorst,2006], which avoids introducing a potential bias. Interestingly, crossed‐over functional connectivity from the seed region in the lesioned hemisphere to the contralateral cerebellum in the PL group is still detectable, despite extensive white‐matter damage (see Fig. 1 for an illustration of the individual white matter damage in these subjects). We have already shown [Wilke et al.,2009b], in accordance with previous studies [Guzzetta et al.,2007; Staudt et al.,2006a], that there was no interhemispheric reorganization in the somatosensory system and no substantial intrahemispheric reorganisation of the sensory cortical representation. The sensory projections originating from the thalamus have been demonstrated to reach the cortex only after the first weeks of life [Kostovic and Judas,2002], so that lesions acquired before might lead to the deviation of thalamo‐cortical projections as shown by MR diffusion tensor tractography [Staudt et al.,2006b]. Moreover, one study [Supekar et al.,2010] in healthy children demonstrated that high‐functional connectivity may be present despite weak structural connectivity. This is well in line with our findings of likely impaired structural connectivity but preserved functional connectivity.
Interestingly, we showed that, compared to PL, the MCA group had significantly reduced functional connectivity between the lesioned somatosensory cortex and the lesioned S2 only. This lower portion of the postcentral gyrus is located on the parietal operculum [Eickhoff et al.,2006]. S2 activations have been reported consistently for a wide range of experimental sensory conditions like light touch, but also for more complex tasks such as tactile attention and sensory motor integration [Eickhoff et al.,2007]. Therefore, S2 may represent the anatomical substrate of various sensory functions such as tactile working memory or stimulus discrimination [Burton et al.,2008a,b]. Recently, Eickhoff et al. [2010] confirmed that S2 was more likely to be activated by somatosensory perceptive tasks, and, in contrast to S1, it shows bilateral activation even with unilateral peripheral stimulation [Young et al.,2004]. It is therefore interesting to hypothesize that a more pronounced affection of S2 may underlie the stronger tactile deficit in the MCA group than in the PL group.
The primary somatosensory cortex (S1) is the main cortical region for sensory‐discriminative processing [Kaas,2003; Randolph and Semmes,1974]. Accordingly, the patients with the MCA infarction also tend to have less somatosensory functional connectivity than those with PL; however, the difference was not statistically significant. This is in line with a recent fMRI study [Wingert et al.,2010] where mildly affected spastic diplegia individuals showed smaller spatial extent of brain activation especially in S1 and S2. Guzzetta et al. [2007] also found a significant correlation between severity of sensory impairment and extent of cortical activation following sensory stimulation on fMRI. In addition, the lack of difference in functional connectivity between our two groups with the contra‐ or ipsilateral cerebellum suggests that although the cerebellum is involved in tactile exploration [Gao et al.,1996], the connectivity of such a network is not a determinant factor in sensory discriminative deficit. Along the same lines, stronger functional connectivity with the ipsilesional cerebellum does not seem to contribute to the preservation of sensory function, as shown before for the motor domain [Small et al.,2002]. As there was no significant difference in connectivity or GM volume in S1 between the groups, we believe that this further argues in favor of S2 being the decisive brain region in this case.
In the present study, the influence of the cortical GM volume on connectivity has been investigated further. When correcting the functional connectivity measures for the GM volume in the respective masks, the difference in the functional connectivity between the groups disappeared. In other words, our two groups do not differ anymore in their functional connectivity when accounting for the GM volume differences between the groups. This underlines the importance of assessing GM volume differences when performing functional connectivity analyses in patients with brain lesions. Indeed, it is widely accepted that the repertoire of functional networks that can be formed by the cerebral cortex is limited by the underlying neuronal substrate [Koch et al.,2002]. As a matter of cause, in the absence of neuronal substrate, neuronal connectivity cannot exist, develop, or reorganize. Consequently, in individuals with major brain lesions (as in our sample), measuring functional connectivity between specific brain region is obviously confounded by the volume of GM present in this region. Therefore, we suggest that the diminished cortical volume (occurring in the MCA group but not in the PL group) constitutes the major negative contributor to the clinically evident somatosensory impairment and that the impairment in the functional connectivity observable in these patients is secondary to the structural lesion.
Obviously, functional outcome of brain damage is often linked to GM alterations [Pinter et al.,2001], and, as stated earlier, the group differences in functional connectivity between our groups were wholly accounted for by the GM volume differences. However, this effect may only be observable if cortical damage is obvious. For example, a recent study [Lui et al.,2009] in schizophrenia patients did not find any abnormalities in resting‐state connectivity within regions of GM deficits as identified using voxel‐based morphometry. Currently, it can only be speculated that below a critical limit, the volume of GM becomes the decisive limiting factor for the functional connectivity.
Possible Limitations of this Study
As in our previous work [Wilke et al.,2009b], the major limitation of this study is the small group of subjects. However, the subjects are carefully selected and characterized in order to define homogeneous groups, both in respect to lesion pathology and reorganization of motor network. As no healthy control group was included in the current study, no inference can be drawn about the relation of either patient group's functional connectivity with the pattern found in the healthy brain. Future studies will have to assess whether differences can be detected, for example, between the unaffected hand in either patient group and healthy controls.
Another possible limitation of this study is the use of the interleaved resting data to assess functional connectivity. Indeed, it could be argued that spontaneous resting‐state activity may be altered by the previous movement task [Waites et al.,2005]. However, it has been shown [Fair et al.,2007] that the correlation coefficients were largely unaffected by the presence of a previous task. This is in full agreement with another study [Hampson et al.,2002], where the only consistent difference was a relative decrease in the magnitude of functional connectivity.
Finally, we focused deliberately only on S1, S2, and the cerebellum and excluded others brain regions potentially involved in sensory processing. For example, frontal cortical regions (such as the supplementary motor area, BA4) receive somatosensory information from parietal cortex and thalamus. They especially contribute to cognitive processing of an associated sensorimotor output and integration of sensorimotor processing [Rizzolatti et al.,2002]. Additionally, parietal cortex contributes to the integration of sensory information [Andersen et al.,1997]. However, previous work [Guzzetta et al.,2007; Wilke et al.,2009b] suggested that the primary somatosensory cortical regions are the major contributors to restoring somatosensory function, and we therefore do not consider this a major confound.
CONCLUSION
In conclusion, resting‐state analyses were able to demonstrate functional connectivity in individuals with cerebral palsy independently of the task, the experimental design, subject compliance, and the level of performance. Therefore, this method is very attractive for studies in neurologically impaired subjects. However, in patients with brain lesions or cortical abnormalities, the volume of cortical GM might influence functional connectivity measures. It therefore may have to be taken into account when assessing groups with underlying brain lesions.
REFERENCES
- Andersen RA, Snyder LH, Bradley DC, Xing J ( 1997): Multimodal representation of space in the posterior parietal cortex and its use in planning movement. Annu Rev Neurosci 20: 303–330. [DOI] [PubMed] [Google Scholar]
- Biswal B, Yetkin FZ, Haughton VM, Hyde JS ( 1995): Functional connectivity in the motor cortex of resting human brain using echo‐planar MRI. Magn Reson Med 34: 537–541. [DOI] [PubMed] [Google Scholar]
- Brett M, Leff A, Rorden C, Ashburner J ( 2001): Spatial normalization of brain images with focal lesions using cost function masking. Neuroimage 14: 486–500. [DOI] [PubMed] [Google Scholar]
- Burton H, Sinclair RJ, McLaren DG ( 2008a) : Cortical network for vibrotactile attention: A fMRI study. Hum Brain Mapp 29: 207–221. [DOI] [PMC free article] [PubMed] [Google Scholar]
- Burton H, Sinclair RJ, Wingert JR, Dierker D ( 2008b): Multiple parietal operculum subdivisions in humans: Tactile activation maps. Somatosens Mot Res 25: 149–162. [DOI] [PMC free article] [PubMed] [Google Scholar]
- Cordes D, Haughton VM, Arfanakis K, Carew JD, Turski PA, Moritz CH, Quigley MA, Meyerand ME ( 2001): Frequencies contributing to functional connectivity in the cerebral cortex in “resting‐state” data. AJNR Am J Neuroradiol 22: 1326–1333. [PMC free article] [PubMed] [Google Scholar]
- Damoiseaux JS, Greicius M ( 2009): Greater than the sum of its parts: A review of studies combining structural connectivity and resting‐state functional connectivity. Brain Struct Funct 213: 525–533. [DOI] [PubMed] [Google Scholar]
- Eickhoff SB, Amunts K, Mohlberg H, Zilles K ( 2006): The human parietal operculum. II. Stereotaxic maps and correlation with functional imaging results. Cereb Cortex 16: 268–279. [DOI] [PubMed] [Google Scholar]
- Eickhoff SB, Grefkes C, Zilles K, Fink GR ( 2007): The somatotopic organization of cytoarchitectonic areas on the human parietal operculum. Cereb Cortex 17: 1800–1811. [DOI] [PubMed] [Google Scholar]
- Eickhoff SB, Jbabdi S, Caspers S, Laird AR, Fox PT, Zilles K, Behrens TE ( 2010): Anatomical and functional connectivity of cytoarchitectonic areas within the human parietal operculum. J Neurosci 30: 6409–6421. [DOI] [PMC free article] [PubMed] [Google Scholar]
- Fair DA, Schlaggar BL, Cohen AL, Miezin FM, Dosenbach NU, Wenger KK, Fox MD, Snyder AZ, Raichle ME, Petersen SE ( 2007): A method for using blocked and event‐related fMRI data to study “resting state” functional connectivity. Neuroimage 35: 396–405. [DOI] [PMC free article] [PubMed] [Google Scholar]
- Friston KJ, Frith CD, Liddle PF, Frackowiak RS ( 1993): Functional connectivity: The principal‐component analysis of large (PET) data sets. J Cereb Blood Flow Metab 13: 5–14. [DOI] [PubMed] [Google Scholar]
- Gao JH, Parsons LM, Bower JM, Xiong J, Li J, Fox PT ( 1996): Cerebellum implicated in sensory acquisition and discrimination rather than motor control. Science 272: 545–547. [DOI] [PubMed] [Google Scholar]
- Good CD, Johnsrude IS, Ashburner J, Henson RN, Friston KJ, Frackowiak RS ( 2001): A voxel‐based morphometric study of ageing in 465 normal adult human brains. Neuroimage 14: 21–36. [DOI] [PubMed] [Google Scholar]
- Guzzetta A, Bonanni P, Biagi L, Tosetti M, Montanaro D, Guerrini R, Cioni G ( 2007): Reorganisation of the somatosensory system after early brain damage. Clin Neurophysiol 118: 1110–1121. [DOI] [PubMed] [Google Scholar]
- Hagmann P, Cammoun L, Gigandet X, Meuli R, Honey CJ, Wedeen VJ, Sporns O ( 2008): Mapping the strucutral core of human cerebral cortex. PLoS Comput Biol 6: e159. [DOI] [PMC free article] [PubMed] [Google Scholar]
- Hampson M, Peterson BS, Skudlarski P, Gatenby JC, Gore JC ( 2002): Detection of functional connectivity using temporal correlations in MR images. Hum Brain Mapp 15: 247–262. [DOI] [PMC free article] [PubMed] [Google Scholar]
- Holmström L, Vollmer B, Tedroff K, Islam M, Ke Persson J, Kits A, Forssberg H, Eliasson AC ( 2010): Hand function in relation to brain lesions and corticomotor‐projection pattern in children with unilateral cerebral palsy. Dev Med Child Neurol 52: 145–152. [DOI] [PubMed] [Google Scholar]
- Honey CJ, Sporns O, Cammoun L, Gigandet X, Thiran JP, Meuli R, Hagmann P ( 2009): Predicting human resting‐state functional connectivty from structural connectivity. Proc Natl Acad Sci USA 106: 2035–2040. [DOI] [PMC free article] [PubMed] [Google Scholar]
- Jenkins GM, Watts DG ( 1968): Spectral Analysis and Its Applications. Boca Raton: Emerson‐Adam. [Google Scholar]
- Jolles DD, Van Buchern MA, Crone EA, Rombouts SA ( 2010): A comprehensive study of whole‐brain functional connectivity in children and young adults. Cereb Cortex, jun 11 [Epub ahead of print]. [DOI] [PubMed] [Google Scholar]
- Juenger H, Linder‐Lucht M, Walther M, Berweck S, Mall V, Staudt M ( 2007): Cortical neuromodulation by constraint‐induced movement therapy in congenital hemiparesis: An FMRI study. Neuropediatrics 38: 130–136. [DOI] [PubMed] [Google Scholar]
- Kaas J. 2003. Somatosensory system In: Mai GPJK, editor. The Human Nervous System. London: Elsevier; pp 1061–1086. [Google Scholar]
- Koch MA, Norris DG, Hund‐Georgiadis M ( 2002): An investigation of functional and anatomical connectivity using magnetic resonance imaging. Neuroimage 16: 241–250. [DOI] [PubMed] [Google Scholar]
- Kostovic I, Judas M ( 2002): Correlation between the sequential ingrowth of afferents and transient patterns of cortical lamination in preterm infants. Anat Rec 267: 1–6. [DOI] [PubMed] [Google Scholar]
- Kuhnke N, Juenger H, Walther M, Berweck S, Mall V, Staudt M ( 2008): Do patients with congenital hemiparesis and ipsilateral corticospinal projections respond differently to consraint‐induced movement therapy? Dev Med Child Neurol 50: 898–903. [DOI] [PubMed] [Google Scholar]
- Lee L, Harrison LM, Mechelli A ( 2003): A report of the functional connectivity workshop, Dusseldorf 2002. Neuroimage 19( 2, Pt 1): 457–465. [DOI] [PubMed] [Google Scholar]
- Lui S, Deng W, Huang X, Jiang L, Ma X, Chen H, Zhang T, Li X, Li D, Zou L, Tang H, Zhou XJ, Mechelli A, Collier DA, Sweeney JA, Li T, Gong Q ( 2009): Association of cerebral deficits with clinical symptoms in antipsychotic‐naive first‐episode schizophrenia: An optimized voxel‐based morphometry and resting state functional connectivity study. Am J Psychiatry 166: 196–205. [DOI] [PubMed] [Google Scholar]
- Macey PM, Macey KE, Kumar R, Harper RM ( 2004): A method for removal of global effects from fMRI time series. Neuroimage 22: 360–366. [DOI] [PubMed] [Google Scholar]
- Maldjian J, Laurienti PJ, Kraft A, Burdette JH ( 2003): An automated method for neuroanatomic and cytoarchitectonic atlas‐based interrogation of fMRI data sets. Neuroimage 19: 1233–1239. [DOI] [PubMed] [Google Scholar]
- O'Reilly JX, Beckmann CF, Tomassini V, Ramnani N, Johansen‐Berg H ( 2010): Distinct and overlapping functional zones in the cerebellum defined by resting state functional connectivity. Cereb Cortex 20: 953–965. [DOI] [PMC free article] [PubMed] [Google Scholar]
- Pinter JD, Eliez S, Schmitt JE, Capone GT, Reiss AL ( 2001): Neuroanatomy of Down's syndrome: A high‐resolution MRI study. Am J Psychiatry 158: 1659–1665. [DOI] [PubMed] [Google Scholar]
- Randolph M, Semmes J ( 1974): Behavioral consequences of selective subtotal ablations in the postcentral gyrus of Macaca mulatta . Brain Res 70: 55–70. [DOI] [PubMed] [Google Scholar]
- Rizzolatti G, Fogassi L, Gallese V ( 2002): Motor and cognitive functions of the ventral premotor cortex. Curr Opin Neurobiol 12: 149–154. [DOI] [PubMed] [Google Scholar]
- Schmahmann JD, Pandya DN ( 1992): Course of the fiber pathways to pons from parasensory association areas in the rhesus monkey. J Comp Neurol 326: 224–248. [DOI] [PubMed] [Google Scholar]
- Seghier ML, Ramlackhansingh A, Crinion J, Leff AP, Price CJ ( 2008): Lesion identification using unified segmentation‐normalisation models and fuzzy clustering. Neuroimage 41: 1253–1266. [DOI] [PMC free article] [PubMed] [Google Scholar]
- Small SL, Hlustik P, Noll DC, Genovese C, Solodkin A ( 2002): Cerebellar hemispheric activation ipsilateral to the paretic hand correlates with functional recovery after stroke. Brain 125: 1544–1557. [DOI] [PubMed] [Google Scholar]
- Smith SM, Fox PT, Miller KL, Glahn DC, Fox PM, Mackay CE, Filippini N, Watkins KE, Toro R, Laird AR, Beckmann CF. ( 2009): Correspondence of the brain's functional architecture during activation and rest. Proc Natl Acad Sci USA 106: 13040–13045. [DOI] [PMC free article] [PubMed] [Google Scholar]
- Staudt M, Grodd W, Gerloff C, Erb M, Stitz J, Krageloh‐Mann I ( 2002): Two types of ipsilateral reorganization in congenital hemiparesis: A TMS and fMRI study. Brain 125( Pt 10): 2222–2237. [DOI] [PubMed] [Google Scholar]
- Staudt M, Gerloff C, Grodd W, Holthausen H, Niemann G, Krageloh‐Mann I ( 2004): Reorganization in congenital hemiparesis acquired at different gestational ages. Ann Neurol 56: 854–863. [DOI] [PubMed] [Google Scholar]
- Staudt M, Braun C, Gerloff C, Erb M, Grodd W, Krageloh‐Mann I ( 2006a) Developing somatosensory projections bypass periventricular brain lesions. Neurology 67: 522–525. [DOI] [PubMed] [Google Scholar]
- Staudt M, Erb M, Braun C, Gerloff C, Grodd W, Krageloh‐Mann I ( 2006b): Extensive peri‐lesional connectivity in congenital hemiparesis. Neurology 66: 771. [DOI] [PubMed] [Google Scholar]
- Supekar K, Uddin LQ, Prater K, Amin H, Greicius MD, Menon V ( 2010): Development of functional and structural connectivity within the default mode network in young children. Neuroimage 52: 290–301. [DOI] [PMC free article] [PubMed] [Google Scholar]
- Uddin LQ, Supekar K, Menon V ( 2010): Typical and atypical development of functional human brain networks: Insights from resting‐state FMRI. Front Syst Neurosci 21: 4–21. [DOI] [PMC free article] [PubMed] [Google Scholar]
- Waites AB, Stanislavsky A, Abbott DF, Jackson GD ( 2005): Effect of prior cognitive state on resting state networks measured with functional connectivity. Hum Brain Mapp 24: 59–68. [DOI] [PMC free article] [PubMed] [Google Scholar]
- Walther M, Juenger H, Kuhnke N, Wilke M, Brodbeck V, Berweck S, Staudt M, Mall V ( 2009): Motor cortex plasticity in ischemic perinatal stroke: A transcranial magnetic stimulation and functional MRI. Pediatr Neurol 41: 171–178. [DOI] [PubMed] [Google Scholar]
- Wilke M, Lidzba K ( 2007): LI‐tool: A new toolbox to assess lateralization in functional MR‐data. J Neurosci Methods 163: 128–136. [DOI] [PubMed] [Google Scholar]
- Wilke M, Schmithorst V ( 2006): A combined bootstrap/histogram analysis approach for computing a lateralization index from neuroimaging data. Neuroimage 33: 522–530. [DOI] [PubMed] [Google Scholar]
- Wilke M, Schmithorst V, Holland SK ( 2002): Assessment of spatial normalization of whole‐brain magnetic resonance images in children. Hum Brain Mapp 17: 48–60. [DOI] [PMC free article] [PubMed] [Google Scholar]
- Wilke M, Lidzba K, Krageloh‐Mann I ( 2009a): Combined functional and causal connectivity analyses of language networks in children: A feasibility study. Brain Lang 108: 22–29. [DOI] [PubMed] [Google Scholar]
- Wilke M, Staudt M, Juenger H, Grodd W, Braun C, Krageloh‐Mann I ( 2009b): Somatosensory system in two types of motor reorganization in congenital hemiparesis: Topography and function. Hum Brain Mapp 30: 776–788. [DOI] [PMC free article] [PubMed] [Google Scholar]
- Williams P, Basso D, Case‐Smith J, Nichols‐Larsen D ( 2006): Development of the hand active sensation test: Reliability and validity. Arch Phys Med Rehabil 87: 1471–1477. [DOI] [PubMed] [Google Scholar]
- Wingert JR, Sinclair RJ, Dixit S, Damiano DL, Burton H ( 2010): Somatosensory‐evoked cortical activity in spastic diplegic cerebral palsy. Hum Brain Mapp 31: 1772–1785. [DOI] [PMC free article] [PubMed] [Google Scholar]
- Young JP, Herath P, Eickhoff SB, Choi JH, Grefkes C, Zilles K, Roland PE ( 2004): Somatotopy and attentional modulation of the human parietal and opercular regions. J Neurosci 24: 5391–5399. [DOI] [PMC free article] [PubMed] [Google Scholar]
- Zilles K. 2003. Architecture of the Human Cerebral Cortex In: Mai GPJK, editor. The Human Nervous System. London: Elsevier; pp 997–1055. [Google Scholar]