

Abstract
The pulvinar nuclei of the thalamus are hypothesized to coordinate attentional selection in the visual cortex. Different models have, however, been proposed for the precise role of the pulvinar in attention. One proposal is that the pulvinar mediates shifts of spatial attention; a different proposal is that it serves the filtering of distractor information. At present, the relation between these possible operations and their relative importance in the pulvinar remains unresolved. We address this issue by contrasting these proposals in two fMRI experiments. We used a visual search paradigm that permitted us to dissociate neural activity reflecting shifts of attention from activity underlying distractor filtering. We find that distractor filtering, but not the operation of shifting attention, is associated with strong activity enhancements in dorsal and ventral regions of the pulvinar as well as in early visual cortex areas including the primary visual cortex. Our observations indicate that distractor filtering is the preponderant attentional operation subserved by the pulvinar, presumably mediated by a modulation of processing in visual areas where spatial resolution is sufficiently high to separate target from distractor input. Hum Brain Mapp, 2013. © 2012 Wiley Periodicals, Inc.
Keywords: thalamus, visual cortex, fMRI, attention, vision
INTRODUCTION
It is widely held that the pulvinar nuclei of the thalamus play key roles in coordinating attentional selection in visual cortex (Kastner and Pinsk,2004; LaBerge,1995; Olshausen et al.,1993; Robinson and Petersen,1992; Saalmann and Kastner,2009,2011; Shipp,2004). Empirical data, theoretical considerations, and a rich connectivity with parietal and frontal areas as well as subcortical visual structures have fueled this notion regarding the pulvinar nuclei (pulvinar for short). Nonetheless, our understanding of the particular function of the pulvinar remains much less developed than our knowledge about mechanisms of attentional selection in cortical structures (Corbetta and Shulman,2002; Corbetta et al.,2008; Reynolds and Chelazzi,2004). The pulvinar has been suggested to subserve shifts of visual spatial attention—a conclusion drawn from permanent or reversible pulvinar lesions in the monkey that produced a slowing of visual search, cued spatial orienting, and the selection of spatially guided actions (Petersen et al.,1987; Ungerleider and Christensen,1979; Wilke et al.,2010). Likewise, lesions of the posterior thalamus and the pulvinar in humans were associated with deficits in cued or reflexive shifting of visual attention towards the contralesional visual field (Danziger et al.,2001; Michael and Buron,2005; Rafal and Posner,1987). Functional brain imaging in humans has provided evidence that the pulvinar may be among the brain structures subserving transient volitional shifts of attention (Yantis et al.,2002), that the pulvinar displays position‐specific coding of attended locations (Hulme et al.,2010), may have retinotopic maps (Fischer and Whitney,2009) and be involved in the right hemisphere attention system that when lesioned produces spatial neglect (Karnath et al.,2002).
Besides a possible role in shifting attention, other evidence suggests that the pulvinar is important for filtering distractor information. Lesions of the ventral pulvinar in the monkey were found to impair pattern discrimination in particular when distractor stimuli were presented (Chalupa et al.,1976). PET and fMRI studies in humans observed increased activity in the pulvinar when object or feature discrimination required the filtering of distractor information (Buchsbaum et al.,2006; Corbetta et al.,1991; LaBerge and Buchsbaum,1990). Kastner et al. (2004) report BOLD signal increases in the pulvinar to target stimuli during attention during bilateral but not unilateral stimulus presentation, compatible with distractor filtering on a coarse spatial scale. Ward et al. (2002) demonstrated that a patient with a rostral lesion of the right pulvinar produced more illusory conjunctions of color and form (Treisman and Schmidt,1982) in the contra‐ versus the ipsilesional visual hemifield, suggesting inefficient filtering of color and form features from distractors. Finally, patients with ventral pulvinar lesions were shown to display an enhanced threshold for discriminating the orientation of a gabor‐grating flanked by high luminance contrast distractors in the contralesional versus the ipsilesional visual hemifields (Snow et al.,2009). Increasing the salience of the target grating restored contralesional performance (reduced thresholds) to the ipsilesional level. In contrast to the foregoing findings, not all studies support a role for the pulvinar in distractor filtering. Pulvinar lesion patients performing several versions of Eriksen's flanker task showed larger interference effects from incongruent flankers in the ipsilesional than in the contralesional field (Danziger et al.,2001,2004). Analogously, unilateral reversible inactivation of the lateral pulvinar in the macaque (Desimone et al.,1990) impaired color discrimination performance at a cued location in the contralesional visual field when a color distractor was added in the ipsilesional field, but not when added in the contralesional visual field close to the target. Both observations are apparently not directly compatible with the notion of filtering of nearby distractors.
Despite the partially conflicting observations and interpretations reviewed above, a summary of the evidence on the pulvinar's role in attentional selection points towards two possible functions: (1) shifting of spatial attention, relating to attention control processes, and (2) filtering of distractor information, relating to attention selection of target information. To date, these functions have not been explicitly contrasted within a study aimed at investigating the pulvinar's role in attention, as they have in studies of cortical attention mechanisms (Hopfinger et al.,2000). Hence, clarifying the role of the pulvinar in attention control versus selection is of central importance to understanding brain attention mechanisms. Moreover, it is possible that effects related to the pulvinar that are attributed to distractor filtering are actually reflecting effects of increasing demands on shifting attention to identify target information in the presence of distracting information. For example, in the study of (LaBerge and Buchsbaum,1990), the enhanced glucose uptake seen for multi‐item arrays may reflect the attenuation of distractor items as suggested by LaBerge and Buchsbaum (1990), but it may alternatively result from an increased number of attention shifts required to locate the target among distractors. Similarly, the observations of Desimone et al. (1990) in the monkey may indeed reflect a deficit of distractor filtering at a coarse level of spatial resolution, but it could be that the ipsilateral hemifield distractor may have been more impeding and interfered with shifting attention to the contralateral target, whereas when the distractor was nearer the target in the same hemifield did not. Hence, it would be important to clarify which of the alternatives is actually relevant and whether the alternatives could eventually be dissociated.
Here, we address the issues laid out in the foregoing in two fMRI experiments based on an experimental paradigm that combines visual search for a color‐defined target with a task that requires item discrimination against surrounding distractors. The two tasks are combined in a hierarchical manner, such that activity reflecting shifts of spatial attention can be dissociated from activity reflecting item discrimination among distractors. Specifically, in the first experiment subjects search for an odd‐colored square (color task, COL) in a checkerboard pattern (Fig. 1A, upper row) with the target either being a popout color item (e.g., red among light and dark green squares) or a non‐popout color item (e.g., medium green among light and dark green squares). Non‐popout search puts higher demands on shifting attention than popout search, and a comparison between those conditions identifies activity reflecting shifts of attention. In addition, each square contained a small randomly oriented (vertical/horizontal) bar, and in a different condition, a different task was required of the subjects, they were to search for the target square (based on its color) but then report the orientation of the bar contained in that square (orientation task, ORI). The orientation task requires the discrimination of the bar against distracting orientation elements in the surrounding checks, and therefore involves distractor filtering. Because the orientation task is hierarchically dependent on completion of the color task, a comparison of the orientation versus the color task (collapsed across popout and non‐popout conditions) identifies activity reflecting the orientation discrimination among distractors while controlling for activity reflecting attention shifts (see Fig. 1B).
Figure 1.
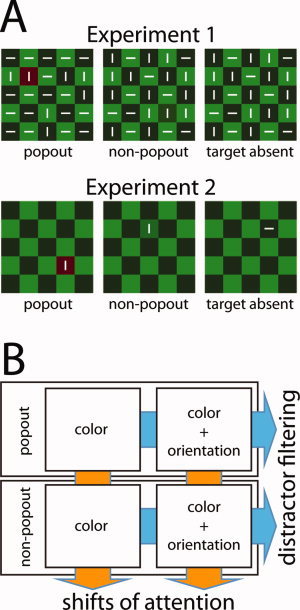
(A) Examples of the three different types of search frames used in Experiment 1 (upper row) and Experiment 2 (lower row). (B) Illustration of the 2 × 2 hierarchical experimental design used to dissociate activity reflecting distractor filtering (blue arrows) from activity reflecting shifts of attention (orange arrows). [Color figure can be viewed in the online issue, which is available at wileyonlinelibrary.com.]
The hierarchical nature of the design, however, necessitates additional controls for activity that would be attributable to orientation discrimination per se. To this end, a second experiment (Experiment 2) was conducted in which subjects performed the color and orientation task with similar search frames as in Experiment 1, but with the oriented bars removed from all but the target square (Fig. 1A, lower row). This stimulus manipulation eliminated the interfering influence of distractor bars on orientation discrimination of the target. As a result, we could characterize the activity associated with the orientation discrimination of the target separately from activity related to distractor filtering.
MATERIALS AND METHODS
Subjects
Fourteen students of the OvG University Magdeburg participated in Experiment 1, and additional 14 students took part in Experiment 2 (one subject performed both experiments). All subjects (mean age: 24.3; 8 female in experiment 1, 27.4 14; 8 female in Experiment 2) were neurologically normal with normal color vision, and normal or corrected‐to‐normal visual acuity. All gave informed consent and were paid for participation. The experiments were approved by the ethics committee of the OvG University Magdeburg.
Stimuli and Task (Experiment 1)
As shown in Figure 1A (upper row) each search frame consisted of a 5 × 5 array of dark (84 cd/m2) and bright green squares (100 cd/m2) forming a checkerboard pattern subtending a region of 9.6°× 9.6° (visual angle) on the presentation screen (gray background (32 cd/m2)) centered at fixation. Each square contained a small white bar (length: 0.8°, width: 0.25°) with the orientation varying randomly (horizontal/vertical) from square to square and across trials. On one‐third of the trials one square of the checkerboard pattern (the target) was drawn in a green with a luminance halfway between the dark and the bright green squares (93 cd/m2) (non‐popout target, NPOP). On another third of the trials, the target was a red square (popout‐target, POP) that was isoluminant to the green non‐popout target. Isoluminance was determined based on the flicker null method. On the remaining third of the trials no target square appeared (target‐absent trials, ABS). The location of the target square (when present) changed randomly from trial to trial with each of the 25 positions being equally likely to contain the target. Search arrays were presented trial‐by‐trial for 500 ms with a pseudo‐random SOA variation (2, 4, and 6 s) to optimize BOLD estimates from overlapping responses (Hinrichs et al.,2000) with SPM 2 (see below). Subjects were asked to fixate the center square while they performed the search task under two different experimental instructions. On half of the trial blocks subjects had to report the color of the target square with a 3‐alternatives button press (red, green, target absent) (color task, COL). On the remaining trial‐blocks they had to report the orientation of the bar in the target square, again with a 3‐alternatives button press (vertical, horizontal, target absent) (orientation task, ORI). Target‐absent trials were included in the experiment in order to guarantee that subjects performed the search for the green target square of the color task instead of simply checking the absence of the popout target. Response time and accuracy was equally stressed. Each experimental run contained two blocks, one in which subjects performed the color task and one in which they performed the orientation task. The order of blocks was alternated between runs, with task change being indicated by an instruction screen at the beginning and in the middle of a given run. Subjects performed a total of eight runs, with each block containing 172 stimulus presentations.
Stimuli and Task (Experiment 2)
Stimuli, task requirements, and experimental setup of Experiment 2 were identical to Experiment 1, except for two modifications. (1) Each search frame contained only one oriented bar that was always placed into the oddly colored square on target‐present trials, or into one non‐target square on target‐absent trials (Fig. 1B, lower row). (2) Subjects performed six instead of eight experimental runs. In all other respects Experiment 2 was identical to Experiment 1. That is, stimulus presentation, the alternation of color and orientation blocks within runs, the number of trials per experimental block were the same as in Experiment 1. Target‐absent trials were not considered for further analysis.
fMRI Acquisition and Data Analysis
Functional MR data (echoplanar images (EPI), TR = 2000 ms, TE = 29 ms) were recorded in a 3T whole body MRI scanner (Siemens Magnetom Trio, Erlangen, Germany) using an eight‐channel head coil. Functional images consisted of 34 interleaved axial (oriented along the ac/pc‐line) slices per volume (matrix 64 × 64; field of view: 224; voxelsize = 3.5 × 3.5 × 3.5; slice‐thickness: 3.5 mm, 268 volumes per run). In addition, a high‐resolution T1‐weightened image (96 slices, matrix 256 × 256; TR 1650 ms; voxelsize = 1 × 1 × 2 mm) was obtained from each subject.
Data analysis was performed using SPM2 (Wellcome Dept. of Imaging Neuroscience) and MATLAB 7.1 (The MathWorks, Natick, MA) in the following way: EPI images were corrected for acquisition delay, realigned to the first image of the first run (rigid‐body‐translation and rotation) to correct for head‐movement artifacts, spatially normalized to the standard T1‐weighted SPM‐template (voxelsize: 3 × 3 × 3 mm), spatially smoothed (isotropic FWHM Gaussian kernel of 6 mm), and high‐pass‐filtered (128 s). The experiment was run as an event‐related design with data estimates obtained by fitting a standard hemodynamic‐response function as implemented in SPM2. The design matrix was setup to estimate six parameters corresponding to the three target types times the two task conditions, i.e. POP/COL, NPOP/COL, ABS/COL, POP/ORI, NPOP/ORI, ABS/ORI. Parameter corrections from the realignment step were included as covariates when fitting the model. According to the testing‐protocol shown in Figure 1B, the following four contrast images were estimated in each subject: ORI>COL, COL>ORI, NPOP>POP, POP>NPOP. For target‐absent trials, the contrasts ORI>COL and COL>ORI were estimated only. As there were no target‐absent popout trials these contrasts are not directly comparable with the corresponding contrast of the target‐present conditions which are collapsed over POP and NPOP trials. However, the ORI>COL and COL>ORI contrasts permits to assess unspecific differences between global task settings that could have been arisen because the orientation and color task were run in different experimental blocks. Effects exceeding a p < 0.005 (false discovery rate (FDR‐) corrected) level were taken as significant modulations.
Group‐data analysis was performed using a random‐effects model (one‐sample t‐tests applied to the contrast images of individual subjects).
Regions of interest (ROI) analysis. ROIs were defined by significant effects of the global F‐statistic (omnibus F‐test, p < 0.005, FDR corrected) of a 2 × 2 within‐subjects ANOVA with the factors NPOP/POP and ORI/COL. The SPM2 MarsBar toolbox (Brett et al.,2002) was used to estimate the magnitude of hemodynamic modulations (betas) within ROIs. Activation maps were visualized by using the MRICRON software with the ch2‐brain serving as template (http://www.cabiatl.com/mricro/mricron/main.html).
Atlas renderings based on the stereotactic atlas of the human thalamus and basal ganglia (Morel‐atlas) (Morel,2007). The localization of activation maxima was initially determined in SPM 2.0 with reference to the MNI space. For transforming those measures into the reference frame of the Morel‐Atlas, a linear transformation of the MNI coordinate system was performed in the following way. (1) Re‐referencing of the coordinate origin of the MNI space (AC‐point) to the coordinate origin of the Morel‐Atlas (PC‐point). A comparison of corresponding most anterior and most posterior extensions of the thalamus in both reference systems revealed that the thalamus is somewhat more anterior in the Morel‐Atlas which was corrected by a 1 mm translation along the y‐axis. Both transformations resulted in a net translation of the MNI–reference system by x, y, z: 0, 24, 3 mm. (2) Definitions of the AC‐PC plain differ between the MNI space and the Morel‐Atlas. In the former, it is defined by points just above the AC to just below the PC, but in the latter by points in the centers of AC and PC. To match plains, the MNI plane was rotated by 4.3° in the sagittal plane with the PC point serving as the origin of rotation. (3) MNI‐coordinates of fiducial points of the thalamus (most anterior, posterior, left, right, top, bottom extensions) were manually determined by using the ch2‐template provided with the MRICRON analysis software. Those as well as the AC and PC points were used in a final step to match corresponding points in the Morel‐Atlas, which required a linear compression of the MNI space along the y‐axis by a factor of 0.923, and along the z‐axis by a factor of 0.6. (4) As the Morel‐Atlas only provides data for the right hemisphere thalamus, the reference system for the left hemisphere thalamus was added as a sagittal plane (0,y,z) mirror image of the right side. Figure 4B illustrates the fit between the Morel space and the MNI‐normalized average brain of the 14 subjects after projecting the Morel space back onto the MNI‐space by reversing the linear transformation described above. Note, as highlighted by Morel (2007) plain linear transformation will not be sufficient to perfectly match thalamic structures between different individual subjects and to different reference spaces. Nevertheless, as visible, we achieved a quite reasonable match. Finally, Figure 4C summarizes the individual variability of selected thalamic fiducials (anterior, posterior, and top border) after transforming the 14 subjects' individual brains to the MNI reference space. The overlaid individual fiducial measures (white crosshairs) show a reasonable fit with the normalized average (dark crosshairs) coming with a standard deviation of localization in the x, y, and z plain of 0.80, 1.73, and 2.1 mm, respectively.
Figure 4.
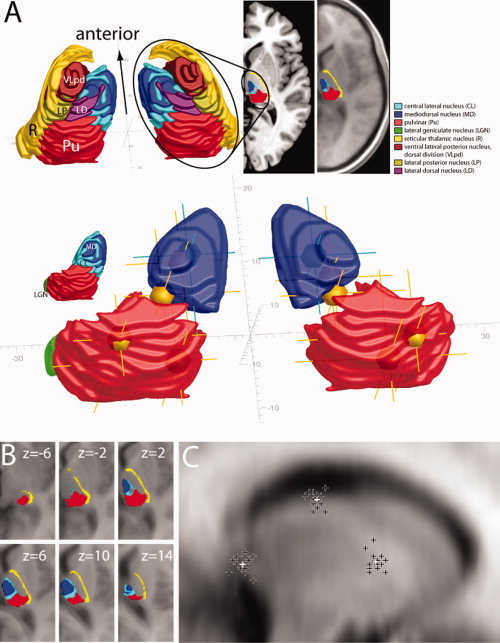
(A) Activation maxima of the ORI>COL contrast (yellow spheres and crosshairs) and the NPOP>POP contrast (turquoise spheres and crosshairs) coregistered with a 3D‐rendering of the thalamus based on the stereotactic atlas of the human thalamus and basal ganglia (Morel,2007). To assure sufficient orientation, the upper part shows the pulvinar (Pu, red) the central lateral (CL, turquoise) and the mediodorsal (MD, blue) nucleus together with several adjacent thalamic nuclei defining the shape of the thalamus. Activation maxima are shown in the lower part relative to the Pu, MD, and the LGN (green). For better visibility, CL is omitted and corresponds with the gap between Pu and MD. Note, the color of activation maxima appearing inside the nuclei is altered by the surface renderings, but still discernible by the color of the corresponding crosshairs. Grey coordinates indicate distance (mm) from the center of the PC‐point with the anterior‐posterior axis aligned to the AC‐PC line. (B) Overlay of selected thalamic structures as defined by of the Morel‐atlas onto corresponding horizontal planes of the average of the individual MNI‐normalized brains of the 14 subjects that took part in Experiment 1. The coregistration of the Morel‐atlas data with the MNI‐average was done by reversing the MNI‐to‐Morel transformation described in detail in the Methods section. (C) Between‐subjects variability of the anterior, posterior, and top extension in the sagittal plane through the thalamus after normalization of each subject's brain to the MNI‐template. The dark crosses represent the subject's individual data, the white crosses represent the mean localization. [Color figure can be viewed in the online issue, which is available at wileyonlinelibrary.com.]
Eye‐Fixation Control
Due to technical limitations at the time of recording Experiment 1, eye‐movement data could not be recorded during the actual scanning session. Eye‐movement data were, however, obtained in the scanner on a later time point from four subjects that took part in Experiment 1. For this control session, subjects performed just two runs of the original experiment without collecting MR data. For Experiment 2, eye‐movements were recorded continuously during the scanning sessions in each participating subject. Due to technical problems, data of two subjects could not be used for analysis. Fixation position data (right eye) was recorded with an infrared camera eye‐tracking system (Kanowski et al., 2007) attached to the MR coil‐system, stored and analyzed with a custom‐made analysis software running under IDL 7.1 (ITT Visual Information Solutions). At the beginning of the scanning session the eye‐tracking system was calibrated to provide maximum resolution along the vertical and horizontal axis of a 5 × 5 grid matching the checkerboard grid used in the experiments. Fixation position was then normalized to a reference grid, followed by an event‐related analysis of fixation position changes within a window after search frame onset and offset that matches the time range of possible eye movements during the actual search performance, that is between 150 ms after search frame onset and search frame offset at 500 ms. Position changes representing inacceptable eye movements were defined as changes exceeding a threshold distance to the center of the center‐square of the checkerboard grid. The distance threshold was set by the border of the center square extended by a distance corresponding with the average imprecision of fixation measured during calibration.
RESULTS
Experiment 1
Behavior
Figure 2 summarizes performance accuracy (% correct responses) and response time (RT) of correct responses for the three task conditions (ORI, COL, ABS) and target types (POP, NPOP). Accuracy was higher, and RT shorter for the conditions involving popout versus non‐popout search; these performance benefits were similar in magnitude for the color and the orientation task. Performance accuracy for target‐absent trials was high and comparable with that of popout search trials, again for both the color and the orientation task. RTs for target‐absent trials were comparable with that of non‐popout trials in both the color and the orientation task. Furthermore, responses were generally faster for the color than the orientation task. These observations were confirmed by two‐way repeated‐measures analyses of variance (ANOVA) with the factors TASK (ORI, COL) and TARGET (NPOP, POP, ABS). Note that violations of data sphericity were corrected based on the Greenhouse‐Geisser epsilon when necessary, with corrected p‐values being reported. For RTs, a significant main effect of TARGET was obtained (F(2,26) = 10.18; p < 0.001) with post hoc pairwise comparisons showing that the RT effect appeared due to a significantly faster responses to POP versus NPOP trials as well as to POP versus ABS trials in the color (both p < 0.001) and the orientation task (POP versus NPOP: p < 0.001, POP versus ABS: p < 0.05). There was no significant RT difference between NPOP and ABS trials (COL: p = 0.42, ORI: p = 0.76). Furthermore, there was a main effect of TASK on RT (F(1,13) = 11.8; p < 0.005) reflecting a generally faster responses when performing the color task. The interaction TASK x TARGET interaction did not reach significance (F(2,26) = 3.4, p = 0.06). For performance accuracy a significant main effect of TARGET was observed (F(2,26) = 8.17; p < 0.05), but no TASK x TARGET interaction (F(2,26) = 0.62). Post hoc paiwise comparisons indicated that subjects committed more errors in the NPOP than the POP and ABS condition in both the COL task (both p < 0.05) and the ORI task (both p < 0.05). The contrast between POP and ABS was not significant neither in the color (p = 0.34) nor in the orientation task (p = 0.091). Finally, there was no main effect of TASK on accuracy (F(1,13) < 0.0001).
Figure 2.
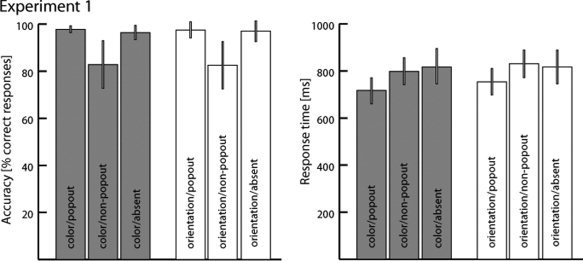
Behavioral performance data of Experiment 1. Shown are average measures (across subjects) of performance accuracy (left) and response time (right) separately for the three different target conditions (popout, non‐popout, absent) of the color (gray) and the orientation task (white). Error bars represent the standard error of mean.
fMRI
Effects of distractor filtering (orientation versus color task)
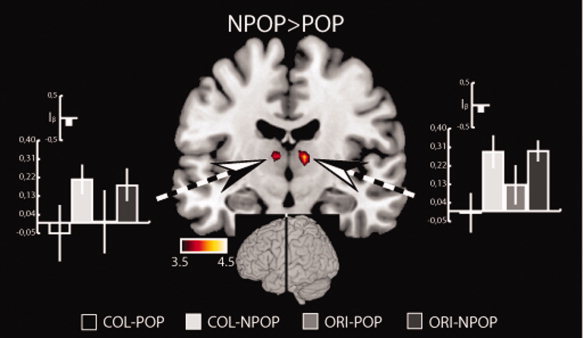
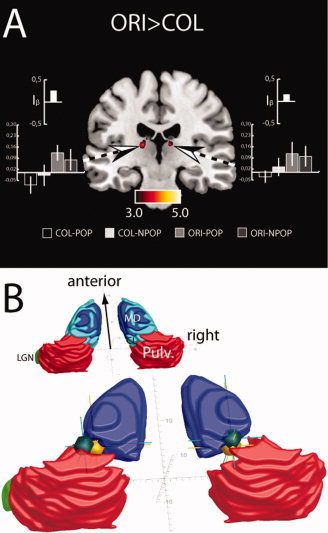
Figure 3A,B summarizes the BOLD effects in the pulvinar and thalamic regions outside the pulvinar, when contrasting the orientation task with the color task (ORI > COL). For this comparison, estimates were obtained without differentiating between popout and non‐popout trials, and as a result, the activations are those related to distractor filtering during orientation discrimination. As visible in Figure 3A significant activations (False Discovery Rate (FDR)‐corrected at the 0.005 level) appeared in the left and right pulvinar in two separate regions, one located more dorsally and one more ventrally. In addition, there were strong activations in regions anterior and dorsal to the pulvinar (Fig. 3B). Finally, there were activation maxima in a more central region of the left and right thalamus, with the maximum on the left side located in central mediodorsal nucleus (MD) and on the right side in a more ventral region of MD (not shown in Fig. 3).
Figure 3.
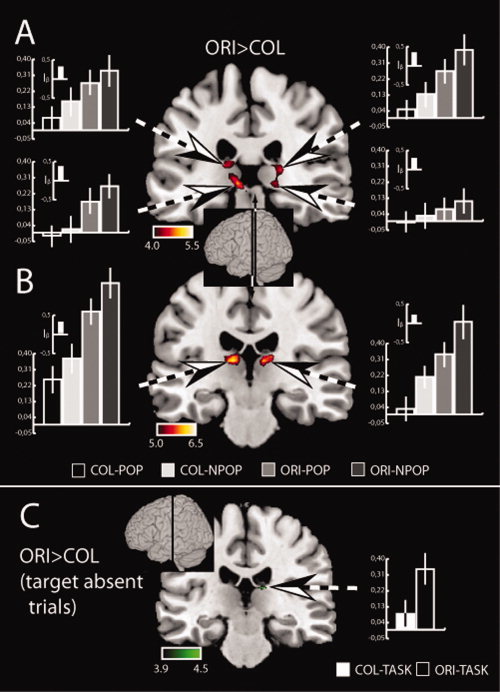
(A) Activations associated with distractor filtering (ORI>COL contrast) in the pulvinar and (B) in the thalamus outside the pulvinar of Experiment1. (C) Activations revealed by the ORI>COL contrast for target‐absent trials. Activations (t‐values) are shown as hot‐scale overlays onto coronal transsections of the MNI brain (normalized brain template ch2 provided with MRICROGL, http://mri.aip.is). The inset in the center indicates the approximate position of the transsections on the anterior‐posterior extension of the brain. The large bargraphs show beta‐estimates of the four different experimental conditions obtained from ROIs (dashed arrows) defined by significant activations (p < 0.005, FDR corrected) on a 2 × 2 within‐subjects ANOVA with the factors NPOP/POP and ORI/COL. The small bargraph insets show the corresponding activation‐indices (I β). [Color figure can be viewed in the online issue, which is available at wileyonlinelibrary.com.]
Figure 4A illustrates the location of activation maxima by reference to a stereotactic atlas of the human thalamus and basal ganglia (Morel,2007). Shown are BOLD maxima (yellow spheres and crosshairs; Note: given the 3D rendering, the spheres do not appear colored yellow unless they emerge from the surface of the rendered structures, but can be seen as spheres with crosshairs in depth) within in a 3D‐representation of the pulvinar (red), the MD nucleus (blue), and the LGN (green) constructed from rendering the 2D‐axial data of the atlas (see Experimental Procedures for details about the coregistration of fMRI and the atlas data). In the right pulvinar, BOLD maxima localize to lateral regions of the medial pulvinar and at the border to the lateral pulvinar (ventral maximum). In the left pulvinar, maxima appear in a central portion of the medial pulvinar (dorsal maximum) and at the medial border to the medial pulvinar (ventral maximum). Note, the ventral maximum in the left pulvinar is on the border of the pulvinar and in close vicinity of the left superior colliculus, with some activation appearing there (Fig. 3A). We cannot rule out that the left superior colliculus contributes to that activation at least to some degree. The strong maxima just anterior and dorsal to the pulvinar (Fig. 3B) are localized to regions between the pulvinar and the dorsal‐posterior portion of the mediodorsal thalamic nucleus (MD). The most anterior activation maxima outside the pulvinar, appear inside the left and right MD close to the maxima seen on the NPOP>POP comparison (turquoise crosshairs) that is described below. It is important to note that the illustration of the activation maxima with reference to the rendered atlas data of Morel (2007) is provided here merely to give some clues as to where the activations may be localized within the substructure of the thalamus. Given that we report group data normalized to the MNI brain, and that the data is further transformed into the coordinates of the atlas data, the precision implied in Figure 4A should not be taken literally. Figure 4B illustrates the results of projecting the Morel‐atlas data back onto the average over the MNI‐normalized data (by reversing the MNI‐to‐Morel transformation as described in the Methods section) of the 14 individual subjects that took part in Experiment 1. It shows that we reached not a perfect but a fairly reasonable match between the Morel‐atlas data and the average MNI‐data. With those uncertainties in mind, the information in Figure 4A can be interpreted as suggesting that the most likely localization of the activation maxima in the dorsal thalamus lie outside the pulvinar in the gap between MD and pulvinar, that is, in the region of the posterior intralaminar central lateral (CL) nucleus (turquoise region in the overviews). Because those maxima fall also onto the posterior border of MD we necessarily leave the precise localization open, and therefore will refer to those maxima as the CL/MD activations.
The bargraphs in Figure 3A,B show the beta estimates taken from regions of interest (ROIs; see Methods) in the four activated regions of the pulvinar (Fig. 3A) and the adjacent CL/MD (Fig. 3B), plus activation indices (inset) illustrating the relative contribution of activity due to the orientation versus the color task (I β, described below). Estimates were obtained separately for the four experimental conditions of interest (color popout (COL/POP), color non‐popout (COL/NPOP), orientation popout (ORI/POP), and orientation non‐popout (ORI/NPOP). Inspection of Figure 3A shows that in all four regions of the pulvinar, the response during the orientation task is greater than during the color task. In addition, non‐popout search shows larger activations than popout search in both the color and orientation task. However, this difference is much smaller than the difference between the orientation and the color task.
To better illustrate the response difference between the orientation versus the color task we computed an activation index I β based on beta estimates in regions of interest in each individual subject. The index characterizes the relative amount of activation due to distractor processing (ORI versus COL) versus shifting attention (NPOP versus POP), independent of the absolute size of the activation in a selected region of interest. The index is defined as I β = D–S/D+S, with D = (|(ORI/NPOP – COL/NPOP)| + |(ORI/POP – COL/POP)|)/2 representing the size of the activation due to the orientation discrimination task collapsed over popout and non‐popout search, and S = (|(COL/NPOP – COL/POP)| + |(ORI/NPOP – ORI/POP)|)/2 representing the size of the search effect collapsed over the orientation and color task. I β expresses the relative magnitude of modulation due to both sources of variation (D, S), can take values on a scale ranging from –1 to 1, with positive values indicating that the ORI>COL difference is larger than the NPOP>POP difference, negative values indicating the reverse. As can be seen in Figure 3, the index (shown as inset) is positive and ranges between 0.3 and 0.4 in all four regions of the pulvinar indicating that the orientation versus color difference is two to almost three times larger than the non‐popout versus popout difference. The index is similar for activations in the upper and the lower pulvinar, as well as in CL/MD (Fig. 3B), although the absolute magnitude of activation in CL/MD is larger than in the pulvinar.
The reverse contrast COL>ORI (color versus orientation) did not reveal any significant activation in the pulvinar or elsewhere in the thalamus, even at an uncorrected level of significance. Significant activations were, however, observed in cortex regions corresponding with the left and right temporo‐parietal junction (data not reported).
Response to target‐absent trials (color versus orientation task)
For target‐absent trials the ORI>COL and COL>ORI contrasts are not directly comparable with the above reported contrast of target‐present trials, as (1) subjects had to terminate their search for the location of a target upon subjectively deciding that there is no target – a situation qualitatively different from the termination of search upon target identification, and (2) during the orientation task, subjects never discriminated the orientation of an item on target‐absent trials. Hence, this contrast will not be informative regarding distractor processing. However it can serve to assess unspecific task‐setting effects reflecting more general differences between trial‐blocks during which subjects performed the color or the orientation task. Figure 3C shows the results of the ORI>COL contrast of target‐absent trials. While there is no activation in the pulvinar, there is a small effect in the MD/CL region of the right thalamus. No other activation is observed in the thalamus. Finally, the reversed contrast COL>ORI does not reveal any activation in the pulvinar and other thalamic structures.
Effects of shifting attention (non‐popout versus popout search)
Figure 5 shows the results of contrasting the non‐popout versus the popout trials (NPOP>POP). For this analysis data from the orientation and the color task were combined, which reveals no significant activation in the pulvinar. Note, when adopting a more moderate activation threshold (FDR corr. p < 0.05) activations appear in the left and right superior colliculus, but even then no activation is seen in the pulvinar. While there is no activation in the pulvinar there are significant activations in the left and right medial thalamus. Consistently, on both sides, the activation index is negative indicating that the activation due to the NPOP>POP contrast is larger than that due to the ORI>COL contrast. The location of respective activation maxima is shown in Figure 4A (turquoise crosshairs) which localize to the center of the parvocellular portion of MD, somewhat anterior but in close vicinity to the maxima from the ORI>COL comparison (yellow crosshairs). Again, reversing the contrast (POP>NPOP) did not reveal any significant activations in the thalamus.
Figure 5.
Activations (t‐values, hot‐scale overlay onto a coronal transsection of the normalized brain template ch2 provided with MRICROGL, http://mri.aip.is reflecting shifts of attention) in the thalamus outside the pulvinar of Experiment 1. The approximate position of the transsection is indicated by the inset. The bargraphs show beta‐estimates of the four different experimental conditions obtained from corresponding ROIs (dashed arrows). The small bargraphs show the activation‐indices (I β). [Color figure can be viewed in the online issue, which is available at wileyonlinelibrary.com.]
Activations in cortex and subcortical structures outside the thalamus
Figure 6 shows activations in cortex and subcortical structures for the ORI>COL (red) and the NPOP>POP contrast (green) as well as regions with overlapping activations (yellow). Shown are selected coronal slices progressively moving from the occipital towards the frontal brain (A through M). As visible in (A–C) the ORI>COL comparison produces a strong activation in early visual cortex including the primary (V1) visual cortex (A–B), posterior medial ventral extrastriate cortex areas (vExpm)(C) and the precuneus (D). In contrast, the NPOP>POP contrast does not show activations in V1 and early extrastriate areas. Instead activations appear in ventral extrastriate cortex more lateral and anterior (vExal)(D) to respective activations of the ORI>COL comparison. Apparently, the ORI>COL and the NPOP>POP contrast dissociate regarding the hierarchical level of activation in visual cortex, with former but not the latter showing activations at earliest hierarchical levels of the visual cortex. Furthermore, ORI>COL shows significant activations in regions of the superior frontal sulcus (SFS)(G) corresponding with the human frontal eye field (FEF) (Paus,1996). In addition, there are two regions in the medial frontal gyrus, one located dorsally (dmFG)(H) and one ventrally extending to more anterior regions (amFG)(K). Further activations are seen in the left precentral (I) and left inferior frontal sulcus (IFS)(L). Finally, bilateral activations appear in the putamen (Put)(H‐I) together with small activations in the anterior insula (aIns)(K). There is also an activation in the red nucleus on the right side (not shown).
Figure 6.
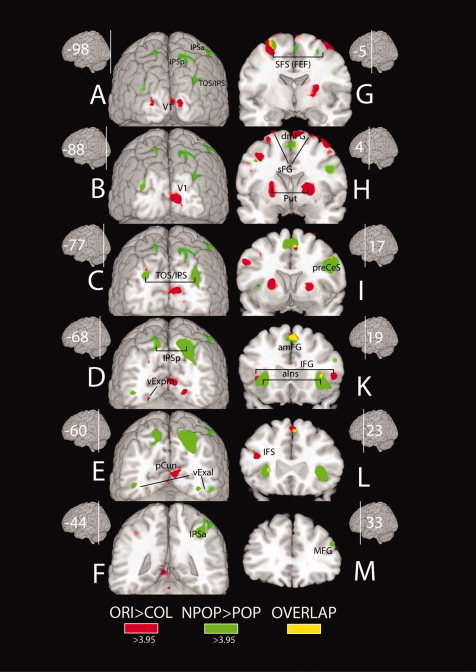
Activations (t‐values) in cortex and subcortical structures outside the thalamus of Experiment 1 overlaid onto the MNI‐brain (ch2‐template normalized to the MNI‐reference system provided with MRICROGL, http://mri.aip.is). Activations associated with distractor filtering (ORI>COL contrast) are shown as red overlays, activations reflecting shifts of attention (NPOP>POP contrast) are shown as green overlays. Regions with significant overlap are highlighted in yellow. A‐M show successive coronal transsections along the posterior–anterior axis of the MNI brain. Corresponding MNI coordinates (y) of the MNI space are indicated with the small brain insets. Abbreviations: IPSp – posterior intraparietal sulcus, IPSa – anterior intraparietal sulcus, TOS/IPS – temporo‐occipital sulcus/intraparietal sulcus, V1 – primary visual cortex, vExpm – posterior medial ventral extrastriate cortex, vExal –anterior lateral ventral extrastriate cortex, pCun – precuneus, SFS(FEF) – superior frontal sulcus (frontal eye field), dmFG – dorsal medial frontal gyrus, sFG – superior frontal gyrus, amFG – anterior medial frontal gyrus, IFG – inferior frontal gyrus, MFG – medial frontal gyrus, Put – putamen, aIns – anterior insula, preCes – precentral sulcus. [Color figure can be viewed in the online issue, which is available at wileyonlinelibrary.com.]
The NPOP>POP contrast shows strong activations in several regions of the posterior and superior parietal cortex not seen for the ORI>COL contrast. Those include the transversal‐occipital sulcus region (TOS/IPS)(A) and posterior intraparietal sulcus region (IPSp)(D‐E) in both hemispheres, as well as the right anterior intra‐parietal sulcus region (IPSa)(F). In addition, activations appear in regions of the superior frontal cortex corresponding with the FEF(G), anterior and lateral medial frontal (amFG, MFG)(K,M) cortex, as well as in the right precentral sulcus region (preCeS)(I) and the anterior insula (aIns)(K). Apparently, the pattern of activation seen for the NPOP>POP contrast nicely maps onto the well described fronto‐parietal spatial attention network (Hopfinger et al.,2000; Nobre et al.,2000; Corbetta and Shulman,2002; Mesulam,1990; Szczepanski et al.,2010), which validates the intended experimental manipulation to gauge activity reflecting spatial shifts of attention with this contrast.
Eye‐fixation performance
Figure 9A summarizes the results of the fixation‐control session performed in four subjects after the actual fMRI session. Shown is the cumulative number of trials for which fixation stayed within the center‐square of the 5 × 5 check (array green bars) or went beyond the border of the center‐square (yellow bars), with the added numbers highlighting the percentage of the latter trials relative to the total number of analyzed trials per condition. Note each bar represents the number of fixations falling within one of the 3 × 3 subregions of the original check (shown in yellow). Fixation performance was very good in general, but slightly better for non‐popout versus popout trials (3.94% versus 7.86% fixations outside the center square). More importantly, fixation performance was very similar when comparing the orientation and color task (6.48 and 5.39% fixations outside the center square), indicating that activations in the pulvinar seen for the ORI>COL comparison in Experiment 1 are unlikely to arise from differences in the quality of eye fixation control.
Figure 9.
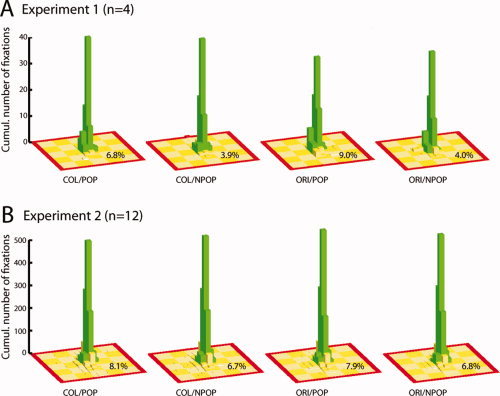
Summary of eye‐fixation performance for the different experimental conditions of Experiment 1 (A) and 2 (B). The green bars index the cumulative number of trials for which fixation stayed within the center‐square of the 5 × 5 check array. Each single bar represents the number of fixations falling within one of the 3 × 3 subregions of a given check. The cumulative number of trials where fixation went beyond the border of the center‐square are shown in yellow. The added numbers give the percentage of trials with fixations outside the center‐square relative to the total number of analyzed trials per condition. [Color figure can be viewed in the online issue, which is available at wileyonlinelibrary.com.]
Experiment 2
Experiment 1 revealed that the ORI>COL but not the NPOP>POP contrast yielded strong activations in the pulvinar (and in CL/MD), clearly consistent with the proposal that distractor filtering is the more important operation subserved by the pulvinar. However, given the study design, the possibility remains that performing the orientation discrimination of the target per se accounts for those activations independent of the presence of distractor bars. Furthermore, the hierarchical experimental design entails that adding the orientation task on top of the search task involves a shift of task from one to the other raising the possibility that activity in the pulvinar reflects this operation. To address those issues we conducted a second experiment in which the distractor bars were eliminated from the stimulus frames with only the bar in the target square remaining. If the activity in the pulvinar that was observed in Experiment 1 reflects distractor processing alone or in part, it should not be observed in the present experiment because no interference from distractor bars will require distractor filtering. Conversely, if activity in the pulvinar reflects some other operation like orientation discrimination proper or shifting tasks, we should see effects in the pulvinar in Experiment 2 that are similar to those in Experiment 1.
Note, that in Experiment 2, the comparison of non‐popout versus popout trials (and the reverse) will be less informative than in Experiment 1 because the single bar always appears in the target square (except for target absent trials). As a result, locating the non‐popout target square (on target present trials) is simplified because the subjects can use the single target bar as a guide to localize the target square.
Behavior
Figure 7 summarizes performance accuracy (% correct responses) and RT for the color and orientation task of Experiment 2. As in the first experiment, RT was shorter for the experimental conditions involving popout search, and RTs to target absent trials are comparable to those of non‐popout trials. Also, there was a general speeding of RT for the color versus the orientation task, and this effect was of similar magnitude for the popout and non‐popout trials. No effect of accuracy appeared when comparing the color with orientation task. Furthermore, there was a decrement in accuracy for non‐popout versus popout trials as in the first experiment, but this effect was visibly smaller. A decrement of similar size is seen for target absent trials relative to popout trials. A statistical validation of the behavioral effects was performed using a two‐way repeated‐measures ANOVA with the factors TASK (ORI,COL) and TARGET (NPOP, POP, ABS), in a fashion analogous to Experiment 1. A significant main effect of TARGET was observed for RT (F(2,26) = 25.4; p < 0.0001) with post hoc pairwise comparisons confirming that the effect is due to significantly faster responses to POP versus NPOP, as well as POP versus ABS trials in both the color (both p < 0.0001) and the orientation task (both p < 0.0001). Furthermore, a significant main effect of TASK (F(1,13) = 24.8; p < 0.0001) confirms that responses were generally faster in the color task. Finally, a significant TARGET × TASK interaction (F(2,26) = 3.66, p < 0.05) was observed, reflecting the fact that the RT slowing to ABS trials relative to POP trials was larger in the color than the orientation task. For accuracy, a significant main effect of TARGET (F(2,26) = 6.74, p < 0.05) was observed. Post hoc pairwise comparisons revealed that this effect is due to a significant performance decrement in non‐popout and absent trials relative to popout trials in both the color (both p < 0.05) and the orientation task (POP versus ABS: p < 0.001, POP versus NPOP: p < 0.05). As in Experiment 1, neither the main effect of TASK (F(1,13) = 0.83) nor the interaction of TASK x TARGET (F(2,26) = 1.27) was significant.
Figure 7.
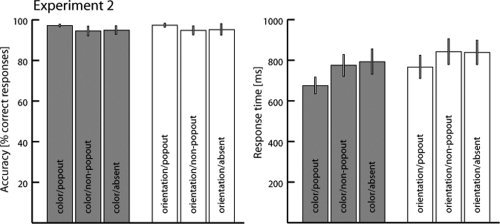
Behavioural performance data of Experiment 2. The bargraphs show mean (across subjects) performance accuracy (left) and mean response time (right) separately for the three different target conditions (popout, non‐popout, absent) of the color (gray) and the orientation task (white). Error bars represent the standard error of mean.
fMRI
Activations in the thalamus (orientation versus color task)
No activity in the pulvinar was observed when contrasting the orientation with the color task (ORI>COL). Even at a dramatically reduced threshold of significance (p = 0.025, uncorrected) no activation appeared. The ORI>COL contrast, however, revealed activations in a region of the left and right central‐lateral nucleus (CL) adjacent to and overlapping with the posterior MD (Fig. 8) as in Experiment 1. The activation in the left thalamus exceeded the critical level of significance (p < 0.005, FDR‐corrected), while the effect in the right thalamus reached significance only at an uncorrected level (p < 0.005). Furthermore, activations appeared inside the MD nucleus as in Experiment 1, again at an uncorrected level of significance (p < 0.005). Figure 8B shows that the activation maxima in CL/MD (dark green spheres) appear close to the CL/MD maxima obtained on the ORI>COL contrast in Experiment 1 (yellow spheres), suggesting that both activations represent corresponding effects in the two experiments. Reversing the contrast (COL>ORI) did not yield any significant activations in the thalamus. Hence, in contrast to the activations in the pulvinar, the strong activations in the CL/MD of Experiment 1 turn out not to be specifically associated with the operation of distractor filtering. Finally, estimating the ORI>COL and the COL>ORI contrast for target absent trials revealed no activations in the thalamus.
Figure 8.
(A) Activations (t‐values) revealed by the ORI>COL contrast of Experiment 2. The bargraphs show beta‐estimates of the four different experimental conditions obtained from corresponding ROIs (dashed arrows). The small bargraphs show the activation‐indices (I β). (B) Localization of activation maxima outside the pulvinar of the ORI>COL contrast of Experiment 1 (green spheres) and Experiment 1 (yellow spheres) with reference to the stereotactic atlas of the human thalamus and basal ganglia (Morel,2007). [Color figure can be viewed in the online issue, which is available at wileyonlinelibrary.com.]
In sum, removing the distractor bars from the search frames eliminated activations in the pulvinar, confirming the idea that activity in the pulvinar reflects distractor filtering, and ruling out the possibility that the operation of orientation discrimination or the requirement to shift tasks accounts for the pulvinar activations in Experiment 1.
It may be argued that in Experiment 2 the general level of activations and hence the power of statistical parametric mapping is lower than in Experiment 1, with the absence of significant activations in the pulvinar reflecting a reduction in that power. A comparison of activation maxima in frontal and parietal cortex on the different experimental conditions of both experiments, however, shows that this is not the case. Activation maxima in the frontal eye field (FEF) on the ORI>COL comparison were t = 5.8 and t = 5.6 in the first and second experiment, respectively. Hence, the level of cortical activation is rather similar, indicating that the absence of activations in the pulvinar is truly reflecting a reduced functional involvement of the pulvinar.
Other contrasts
Neither the NPOP>POP nor the POP>NPOP contrasts revealed significant activations in the thalamus and pulvinar.
Activations in cortical and subcortical structures outside the thalamus
Orientation versus color task
In contrast to strong activations in V1 and vExpm in Experiment 1, the ORI>COL comparison of Experiment 2 yielded no significant activations in early visual cortex areas. Activations appeared, however, in more lateral ventral extrastriate cortex, and in the left posterior and anterior intraparietal sulcus region. As in Experiment 1, frontal cortex activations appeared in the superior frontal sulcus corresponding with the frontal eye field (SFS/FEF), as well as in more anterior medial frontal gyrus (amFG). Further activations were seen in the right dorsolateral frontal cortex and the inferior frontal sulcus (the latter only at a more moderate threshold of p < 0.005 uncorr.). Finally, analogous to Experiment 1, an activation appeared in the right putamen (Put), whereas no activation was seen in the anterior insula.
Popout versus non‐popout
As in Experiment 1 the NPOP>POP contrast yielded strong activations in the parietal cortex in regions of the transversal‐occipital sulcus (TOS/IPS) and the posterior intraparietal sulcus (IPSp), but in contrast to Experiment 1, no activation appeared in the right anterior parietal sulcus region. Again, as in Experiment 1, there were activations in lateral ventral extrastriate cortex (vExal). In frontal cortex, an activation was seen in the right precentral sulcus region (preCS) as in Experiment 1. Activations in the frontal eye field (FEF) and the anterior medial frontal cortex (amFG), however, were only visible at a more moderate threshold (p < 0.005 uncorr.). Despite the strong bilateral activation of the anterior insula in Experiment 1, no such effect appeared in Experiment 2. There was also no activation of the medial frontal gyrus region (MFG).
Eye‐fixation performance
Figure 9B shows the eye fixation performance during Experiment 2 (12 subjects). As for the post hoc performed eye‐movement control session for Experiment 1, fixation performance was very good in Experiment 2. Importantly, there were no differences in the number of fixations falling outside the border of the center check when comparing the four experimental conditions. This observation is confirmed by a repeated‐measures ANOVA with the factors TASK (Orientation/Color) and SEARCH (Popout/Non‐popout), which revealed neither a significant effect for TASK (F(1,11) = 1.4; p = 0.25) nor for SEARCH (F(1,11) = 2.3,; p = 0.16).
DISCUSSION
Activity in the Pulvinar
The present experiments investigated the role of the pulvinar in attentional selection in visual search. As outlined in the introduction, experimental evidence from different brain imaging methodologies and brain lesion studies point to different possible (not necessarily incompatible) roles for the pulvinar. The pulvinar has been suggested to subserve shifts of spatial attention (Danziger et al.,2001; Karnath et al.,2002; Michael and Buron,2005; Petersen et al.,1987; Rafal and Posner,1987; Yantis et al.,2002; Wilke et al.,2010) and/or the filtering of distractor information (Buchsbaum et al.,2006; Kastner et al.,2004; LaBerge and Buchsbaum,1990; Rotshtein et al., 2011; Smith et al.,2009; Snow et al.,2009; Ward et al.,2002). As outlined in the Introduction, activity in the pulvinar attributed to shifting attention may in fact reflect distractor processing in the sense of disengaging attention from items representing distractors. Conversely, activity suggested to reflect distractor filtering may represent the larger amount of spatial shifts of attention required to locate the target among distractors. The present experiments aimed at resolving this ambiguity by using a two‐by‐two hierarchical experimental design that permitted the separation of the processes of shifting spatial attention (NPOP versus POP) from the discrimination of the target among distractors (ORI versus COL). We observed that the latter but not the former operation produced significant activity enhancements in ventral and dorsal regions of the pulvinar. Activation indices (I β) in the pulvinar were between 0.3 and 0.4, indicating that the ORI>COL contrast produced a response that was roughly two to almost three times the size of the NPOP>POP contrast. Experiment 2 ruled out that orientation discrimination proper was responsible for the effects in the pulvinar. Eliminating distractor bars from all but the target location eliminated BOLD effects in the pulvinar on the ORI>COL contrast. Furthermore, Experiment 2 ruled out that the higher task‐load or complexity of the orientation task accounts for the effects in the pulvinar. Due to the hierarchical design of Experiment 1, subjects were required to maintain attention at the target's location while shifting their task set from color search to orientation discrimination. Theoretically, the added task load may have been responsible for the activations in the pulvinar. However, in Experiment 2 the same hierarchical design was applied, involving the same increase in task complexity for the orientation versus the color task (see also discussion below) which renders this explanation unlikely. Finally, the ORI>COL contrast for target‐absent trials in Experiment 1 did not reveal activations in the pulvinar, which suggests that activations in the pulvinar are not reflecting unspecific effects due to differential task‐setting effects entailed by the orientation versus the color task. Together, the present data clearly suggest that the pulvinar is predominantly involved in attentional operations subserving distractor filtering.
It should noted be that the present data does not permit a description of the specific mechanism(s) that underlie distractor filtering by the pulvinar. It is possible that the pulvinar gates sensory processing via direct attenuation of distractor locations or by a relative enhancement of target locations in retinotopic visual cortex by, for example, an inhibitory versus excitatory gating scheme (Olshausen et al.,1993). Furthermore, it is possible that the pulvinar operates in a push‐pull manner and mediates both operations, distractor attenuation and target enhancement, simultaneously. Retinotopically consistent enhancements at target locations as well as suppression of distractor locations in visual cortex been have demonstrated with fMRI (Muller and Ebeling,2008; Pinsk et al.,2004; Serences et al.,2004), and the pulvinar may mediate either or both operations.Using fMRI‐based functional connectivity analysis, Rotshtein et al. (2011) addressed the role of the pulvinar during visual search when target selection conflicted with item representations held in working memory. Increased functional connectivity between the pulvinar and the visual cortex was observed, that was retinotopically consistent with the visual field of target information conflicting with the memory representation. Moreover, the increase in functional connectivity was associated with an attenuation of activation in the pulvinar, leading to the conclusion that the pulvinar's increased functional connectivity served the attenuation of responses in visual cortex coding the conflicting input – a scenario compatible with the above mentioned inhibitory gating scheme.
In the present study, activations in the pulvinar on the ORI>COL contrast were accompanied by activations in early visual cortex areas including V1 (Figure 6A–C) – activations not seen in Experiment 2, where the need to filter distractors was eliminated. The NPOP>POP comparison in Experiment 1, in contrast, revealed ventral extrastriate activations in more anterior and lateral regions (Fig. 6D). Hence, activity in the pulvinar was combined with increase an of the BOLD response in visual cortex regions with higher spatial resolution due to smaller receptive fields of the cortical visual neurons – a pattern compatible with the notion of distractor filtering at a finer spatial scale based on an excitatory gating scheme. It is worth noting that the human pulvinar displays precise position coding down to approximately ∼0.5° of visual angle (Fischer and Whitney,2009). However, it is possible that those activations in early visual cortex represent modulatory effects that ultimately mediate the attenuation of distractor locations at fine spatial scales. The present data cannot distinguish between these alternatives.
Despite speculations about the particular mechanism underlying distractor filtering subserved by the pulvinar, the present observations are generally in line with current hypotheses about the functional link between processing in the pulvinar and the visual cortex (Casanova,2004; Crick and Koch,1998; Grieve et al.,2000; Saalmann and Kastner,2009; Sherman and Guillery,2002; Shipp,2003). The pulvinar displays abundant, topographically structured connectivity with the visual cortex, and it has been proposed to impose regulatory impact on cortico‐cortical processing to coordinate cortical information flow in multiple visual areas (Kastner and Pinsk,2004; LaBerge,1990; Shipp,2003,2004; Saalman and Kastner,2011). The present observation may be taken to support that notion by suggesting that the pulvinar coordinates processing in early visual cortex areas when high spatial resolution is required in order to filter‐out the interfering effect of distractors.
A notable observation of the present study is that activations in the pulvinar appeared in dorsal and ventral parts of the nucleus (Figs. 3A and 4). At present the functional architecture and connectivity of the human pulvinar is not completely characterized, so we can only speculate about the implication of this finding. A double‐activation in dorsal and ventral parts of the pulvinar was previously seen with passive flow‐field stimulation in the left and right VF (Smith et al.,2009). Attention was found to add a ∼20% BOLD signal increase in those regions, suggesting that this pattern of activation was not specifically related to attention. Smith et al. discuss some possible explanations based on knowledge from the monkey pulvinar, which may be relevant here as well. In the macaque, two adjacent retinotopical maps were described in inferior and lateral portions of the pulvinar (Bender,1981; Ungerleider et al.,1983), and the two maxima observed here may correspond to those maps. However, in the monkey the maps are adjacent and have a common vertical meridian representation. Stimulation centered around fixation would produce a contiguous activation across both maps (Ungerleider et al.,1983), instead of separate maxima. Nevertheless, it is possible that those maps are spatially separated in humans. Another possibility is that the activation in the ventral pulvinar corresponds with activity in ventral retinotopic maps, whereas the dorsal maximum reflects activity in a different structure referred to as the Pdm nucleus in the literature. Pdm has a weak retinotopic organization, but has been strongly implicated in attentional selection (Petersen et al.,1987; Robinson and Petersen,1992). Clearly, more experiments and better knowledge about structural and functional homologies between human and monkey pulvinar are needed to clarify this issue.
Activity in Thalamus Outside the Pulvinar
The ORI>COL contrast produced strong activations bilaterally in dorsal medial regions of the thalamus outside pulvinar in Experiment 1. Referring to Morel's stereotactic atlas of the thalamus (Morel,2007), this activity appeared in the intralaminar central‐lateral nucleus (CL) dorsally adjacent to the pulvinar and close to and partially overlapping with dorsal‐posterior parts of the MD nucleus (Fig. 4). While the absolute size of activation was stronger in CL/MD than in the pulvinar, corresponding activation indices were positive and of comparable size – a pattern compatible with the possibility that CL/MD serves distractor filtering in a similar way as the pulvinar. Indeed, activations in medial dorsal thalamus combined with activations in the pulvinar have been reported for a discrimination task involving distractor filtering (Buchsbaum et al.,2006). However, our Experiment 2 revealed that activity in CL/MD was also evident when distractor bars were removed from the search frame – a manipulation that eliminated distractor interference on target discrimination. Furthermore, a small activation in the right CL/MD was seen when comparing the ORI versus COL condition of target‐absent trials in Experiment 1. On target‐absent trials of the ORI condition, subjects did not perform a bar discrimination, suggesting that part of the activation in MD/CL reflects overall differences in task‐settings of the orientation versus color task, rather than distractor processing. Taken together, activity in CL/MD is unlikely to reflect distractor processing. Instead, activity in this region may reflect orientation discrimination per se, or the generally higher task load or complexity of the orientation task. The latter may involve more general attentional processing for mediating the transition from locating the target square to the subsequent orientation discrimination. The orientation task required the subjects to keep the target location (once identified) in the focus of attention while initiating the next operation, which imposes increased attentional effort in the sense of sustained allocation of resources, as well as task‐complexity in the sense of coordinating different discrimination operations. A further and related possibility would be that the CL/MD activation reflects the switching of feature attention from color to orientation and/or the subsequent maintenance of attention on the latter. In a survey of available evidence, Purpura and Schiff (1997) concluded that the intralaminar nucleus of the thalamus is critically involved in mediating sustained attentional focusing, that is, that it provides an “event‐holding” function to facilitate sustained operations in attentional control structures of the cortex like the FEF or PPC. Moreover, it has been shown that activity in the intralaminar nucleus appears when subjects switch from a passive awake state to a demanding attention task (Kinomura et al.,1996) consistent with more unspecific attentional demands on sustained focusing.
On the other hand it is possible that part of the activations arose from posterior MD – a region that connects abundantly with regions of the frontal cortex in the monkey (Bachevalier et al.,1997; Giguere and Goldman‐Rakic,1988; Goldman‐Rakic and Porrino,1985; Tanaka,1976), and which has been implicated in cognitive and limbic functions, as well as working memory and attentional selection (Barbas,2000). The dorsal parts of MD are known to connect with the dorsolateral prefrontal cortex (areas 8 and 46) (Goldman‐Rakic and Porrino,1985; Tanibuchi and Goldman‐Rakic,2003) placing dorsal MD is in a strategic position to mediate the control of spatial attention with dorsolateral prefrontal cortex.
CONCLUSION
The experiments reported here suggest that activity in the pulvinar arises preferentially as a consequence of distractor filtering in visual search, with shifts of attention being a much less significant determinant. Furthermore, activity in the pulvinar was associated with activations in early visual cortex (including V1) consistent with the pulvinar mediating distractor filtering by modulating processing in cortex areas with sufficiently high spatial resolution to separate target from distractor input. Finally, activity was also seen outside the pulvinar in intralaminar CL and adjacent MD. But here, activity reflected nonspecific attentional processing, presumably associated with sustained attentional focusing required by the hierarchical structure of the experimental design.
Acknowledgements
We thank M. Scholz for performing the atlas renderings, as well as the eye‐motion analysis.
REFERENCES
- Bachevalier J, Meunier M, Lu MX, Ungerleider LG ( 1997): Thalamic and temporal cortex input to medial prefrontal cortex in rhesus monkeys. Exp Brain Res 115: 430–444. [DOI] [PubMed] [Google Scholar]
- Barbas H ( 2000): Connections underlying the synthesis of cognition, memory, and emotion in primate prefrontal cortices. Brain Res Bull 52: 319–330. [DOI] [PubMed] [Google Scholar]
- Bender DB ( 1981): Retinotopic organization of macaque pulvinar. J Neurophysiol 46: 672–693. [DOI] [PubMed] [Google Scholar]
- Brett M, Johnsrude IS, Owen AM ( 2002): The problem of functional localization in the human brain. Nat Rev Neurosci 3: 243–249. [DOI] [PubMed] [Google Scholar]
- Buchsbaum MS, Buchsbaum BR, Chokron S, Tang C, Wei TC, Byne W ( 2006): Thalamocortical circuits: fMRI assessment of the pulvinar and medial dorsal nucleus in normal volunteers. Neurosci Lett 404: 282–287. [DOI] [PubMed] [Google Scholar]
- Casanova C ( 2004): The visual function of the pulvinar In: Chalupa LM, Werner JS, editors. The Visual Neurosciences. Cambridge, MA: MIT Press; p 592–608. [Google Scholar]
- Chalupa LM, Coyle RS, Lindsley DT ( 1976): Effect of pulvinar lesions on visual pattern discrimination in monkeys. J. Neurophysiol. 39: 354–369. [DOI] [PubMed] [Google Scholar]
- Corbetta M, Shulman GL ( 2002): Control of goal‐directed and stimulus‐driven attention in the brain. Nat Rev Neurosci 3: 201–215. [DOI] [PubMed] [Google Scholar]
- Corbetta M, Miezin FM, Dobmeyer S, Shulman GL, Petersen SE ( 1991): Selective and divided attention during visual discriminations of shape, color, and speed: Functional anatomy by positron emission tomography. J Neurosci 11: 2383–2402. [DOI] [PMC free article] [PubMed] [Google Scholar]
- Corbetta M, Patel G, Shulman GL ( 2008): The reorienting system of the human brain: From environment to theory of mind. Neuron 58: 306–324. [DOI] [PMC free article] [PubMed] [Google Scholar]
- Crick F, Koch C ( 1998): Constraints on cortical and thalamic projections: The no‐strong‐loops hypothesis. Nature 391: 245–250. [DOI] [PubMed] [Google Scholar]
- Danziger S, Ward R, Owen V, Rafal R ( 2001): The effects of unilateral pulvinar damage in humans on reflexive orienting and filtering of irrelevant information. Behav Neurol 13: 95–104. [DOI] [PMC free article] [PubMed] [Google Scholar]
- Danziger S, Ward R, Owen V, Rafal R ( 2004): Contributions of the human pulvinar to linking vision and action. Cogn Affect Behav Neurosci 4: 89–99. [DOI] [PubMed] [Google Scholar]
- Desimone R, Wessinger M, Thomas L, Schneider W ( 1990): Attentional control of visual perception: Cortical and subcortical mechanisms. Cold Spring Harbor Symp Quant Biol 55: 963–971. [DOI] [PubMed] [Google Scholar]
- Fischer J, Whitney D ( 2009): Precise discrimination of object position in the human pulvinar. Hum Brain Mapp 30: 101–111. [DOI] [PMC free article] [PubMed] [Google Scholar]
- Giguere M, Goldman‐Rakic PS ( 1988): Mediodorsal nucleus: Areal, laminar, and tangential distribution of afferents and efferents in the frontal lobe of rhesus monkeys. J Comp Neurol 277: 195–213. [DOI] [PubMed] [Google Scholar]
- Goldman‐Rakic PS, Porrino LJ ( 1985): The primate mediodorsal (MD) nucleus and its projection to the frontal lobe. J Comp Neurol 242: 535–560. [DOI] [PubMed] [Google Scholar]
- Grieve KL, Acuna C, Cudeiro J ( 2000): The primate pulvinar nuclei: Vision and action. Trends Neurosci 23: 35–39. [DOI] [PubMed] [Google Scholar]
- Hinrichs H, Scholz M, Tempelmann C, Woldorff MG, Dale AM, Heinze HJ ( 2000): Deconvolution of event‐related fMRI responses in fast‐rate experimental designs: Tracking amplitude variations. J Cogn Neurosci 12 Suppl 2: 76–89. [DOI] [PubMed] [Google Scholar]
- Hopfinger JB, Buonocore MH, Mangun GR ( 2000): The neural mechanisms of top‐down attentional control. Nat Neurosci 3 ( 3): 284–291. [DOI] [PubMed] [Google Scholar]
- Hulme OJ, Whiteley L, Shipp S ( 2010): Spatially distributed encoding of covert attentional shifts in human thalamus. J Neurophysiol 104: 3644–3656. [DOI] [PMC free article] [PubMed] [Google Scholar]
- Kanowski M, Rieger JW, Noesselt T, Tempelmann C, Hinrichs H ( 2007): Endoscopic eye tracking system for fMRI. J Neurosci Methods 160: 10–15. [DOI] [PubMed] [Google Scholar]
- Karnath HO, Himmelbach M, Rorden C ( 2002): The subcortical anatomy of human spatial neglect: Putamen, caudate nucleus and pulvinar. Brain 125: 350–360. [DOI] [PubMed] [Google Scholar]
- Kastner S, Pinsk MA ( 2004): Visual attention as a multilevel selection process. Cogn Affect Behav Neurosci 4: 483–500. [DOI] [PubMed] [Google Scholar]
- Kastner S, O'Connor DH, Fukui MM, Fehd HM, Herwig U, Pinsk MA ( 2004): Functional imaging of the human lateral geniculate nucleus and pulvinar. J Neurophysiol 91: 438–448. [DOI] [PubMed] [Google Scholar]
- Kinomura S, Larsson J, Gulyas B, Roland PE ( 1996): Activation by attention of the human reticular formation and thalamic intralaminar nuclei. Science 271: 512–515. [DOI] [PubMed] [Google Scholar]
- LaBerge D ( 1990): Thalamic and cortical mechanisms of attention suggested by recent positron emission tomographic experiments. J Cogn Neurosci 2: 358–372. [DOI] [PubMed] [Google Scholar]
- LaBerge D ( 1995): Computational and anatomical models of selective attention in object identification In: Gazzaniga MS, editor. The Cognitive Neurosciences. Cambridge, MA, London: Bradford Book/MIT Press; p 649–663. [Google Scholar]
- LaBerge D, Buchsbaum MS ( 1990): Positron emission tomographic measurements of pulvinar activity during an attention task. J Neurosci 10: 613–619. [DOI] [PMC free article] [PubMed] [Google Scholar]
- Mesulam MM ( 1990): Large‐scale neurocognitive networks and distributed processing for attention, language, and memory. Ann Neurol 28: 597–613. [DOI] [PubMed] [Google Scholar]
- Michael GA, Buron V ( 2005): The human pulvinar and stimulus‐driven attentional control. Behav Neurosci 119: 1353–1367. [DOI] [PubMed] [Google Scholar]
- Morel A ( 2007): Stereotactic atlas of the human thalamus and basal ganglia. New York: Informa Healthcare USA. [Google Scholar]
- Muller NG, Ebeling D ( 2008): Attention‐modulated activity in visual cortex‐‐more than a simple ‘spotlight’. Neuroimage 40: 818–827. [DOI] [PubMed] [Google Scholar]
- Nobre AC, Gitelman DR, Dias EC, Mesulam MM ( 2000): Covert visual spatial orienting and saccades: Overlapping neural systems. Neuroimage 11: 210–216. [DOI] [PubMed] [Google Scholar]
- Olshausen BA, Anderson CA, Van Essen DC ( 1993): A neurobiological model of visual attention and invariant pattern recognition based on dynamic routing of information. J Neurosci 13: 4700–4719. [DOI] [PMC free article] [PubMed] [Google Scholar]
- Paus T ( 1996): Location and function of the human frontal eye‐field: A selective review. Neuropsychologia 34: 475–483. [DOI] [PubMed] [Google Scholar]
- Petersen SE, Robinson DL, Morris JD ( 1987): Contributions of the pulvinar to visual spatial attention. Neuropsychologia 25: 97–105. [DOI] [PubMed] [Google Scholar]
- Pinsk MA, Doniger GM, Kastner S ( 2004): Push‐pull mechanism of selective attention in human extrastriate cortex. J Neurophysiol 92: 622–629. [DOI] [PubMed] [Google Scholar]
- Purpura KP, Schiff ND ( 1997): The thalamic intralaminar nuclei: A role in visual awareness. The Neuroscientist 3: 8–15. [Google Scholar]
- Rafal RD, Posner MI ( 1987): Deficits in human visual spatial attention following thalamic lesions. Proc Natl Acad Sci USA 84: 7349–7353. [DOI] [PMC free article] [PubMed] [Google Scholar]
- Reynolds JH, Chelazzi L ( 2004): Attentional modulation of visual processing. Annu Rev Neurosci 27: 611–647. [DOI] [PubMed] [Google Scholar]
- Robinson DL, Petersen S ( 1992): The pulvinar and the visual salience. Trends Neurosci 15: 127–132. [DOI] [PubMed] [Google Scholar]
- Rotshtein P, Soto D, Grecucci A, Geng JJ, Humphreys GW ( 2011): The role of the pulvinar in resolving competition between memory and visual selection: A functional connectivity study. Neuropsychologia 49: 1544–1552. [DOI] [PubMed] [Google Scholar]
- Saalmann YB, Kastner S ( 2009): Gain control in the visual thalamus during perception and cognition. Curr Opin Neurobiol 19: 1–7. [DOI] [PMC free article] [PubMed] [Google Scholar]
- Saalmann YB, Kastner S ( 2011): Cognitive and perceptual functions of the visual thalamus. Neuron 71: 209–223. [DOI] [PMC free article] [PubMed] [Google Scholar]
- Serences JT, Yantis S, Culberson A, Awh E ( 2004): Preparatory activity in visual cortex indexes distractor suppression during covert spatial orienting. J Neurophysiol 92: 3538–3545. [DOI] [PubMed] [Google Scholar]
- Sherman SM, Guillery RW ( 2002): The role of the thalamus in the flow of information to the cortex. Philos Trans R Soc Lond B Biol Sci 357: 1695–1708. [DOI] [PMC free article] [PubMed] [Google Scholar]
- Shipp S ( 2003): The functional logic of cortico‐pulvinar connections. Philos Trans R Soc Lond B Biol Sci 358: 1605–1624. [DOI] [PMC free article] [PubMed] [Google Scholar]
- Shipp S ( 2004): The brain circuitry of attention. Trends Cogn Sci 8: 223–230. [DOI] [PubMed] [Google Scholar]
- Smith AT, Cotton PL, Bruno A, Moutsiana C ( 2009): Dissociating vision and visual attention in the human pulvinar. J Neurophysiol 101: 917–925. [DOI] [PMC free article] [PubMed] [Google Scholar]
- Snow JC, Allen HA, Rafal RD, Humphreys GW ( 2009): Impaired attentional selection following lesions to human pulvinar: Evidence for homology between human and monkey. Proc Natl Acad Sci U S A 106: 4054–4059. [DOI] [PMC free article] [PubMed] [Google Scholar]
- Szczepanski SM, Konen CS, Kastner S ( 2010): Mechanisms of spatial attention control in frontal and parietal cortex. J Neurosci 30: 148–160. [DOI] [PMC free article] [PubMed] [Google Scholar]
- Tanaka D, Jr ( 1976): Thalamic projections of the dorsomedial prefrontal cortex in the rhesus monkey (Macaca mulatta). Brain Res 110: 21–38. [DOI] [PubMed] [Google Scholar]
- Tanibuchi I, Goldman‐Rakic PS ( 2003): Dissociation of spatial‐, object‐, and sound‐coding neurons in the mediodorsal nucleus of the primate thalamus. J Neurophysiol 89: 1067–1077. [DOI] [PubMed] [Google Scholar]
- Treisman A, Schmidt H ( 1982): Illusory conjunctions in the perception of objects. Cognit Psychol 14: 107–141. [DOI] [PubMed] [Google Scholar]
- Ungerleider LG, Christensen CA ( 1979): Pulvinar lesions in monkeys produce abnormal scanning of a complex visual array. Neuropsychologia 17: 493–501. [DOI] [PubMed] [Google Scholar]
- Ungerleider LG, Galkin TW, Mishkin M ( 1983): Visuotopic organization of projections from striate cortex to inferior and lateral pulvinar in rhesus monkey. J Comp Neurol 217: 137–157. [DOI] [PubMed] [Google Scholar]
- Ward R, Danziger S, Owen V, Rafal R ( 2002): Deficits in spatial coding and feature binding following damage to spatiotopic maps in the human pulvinar. Nat Neurosci 5: 99–100. [DOI] [PubMed] [Google Scholar]
- Wilke M, Turchi J, Smith K, Mishkin M, Leopold DA ( 2010): Pulvinar inactivation disrupts selection of movement plans. J Neurosci 30: 8650–8659. [DOI] [PMC free article] [PubMed] [Google Scholar]
- Yantis S, Schwarzbach J, Serences JT, Carlson RL, Steinmetz MA, Pekar JJ, Courtney SM ( 2002): Transient neural activity in human parietal cortex during spatial attention shifts. Nat Neurosci 9: 9. [DOI] [PubMed] [Google Scholar]