

Abstract
Neuropsychiatric systemic lupus erythematosus (NP‐SLE) is a common complication of systemic lupus erythematosus (SLE), and clinical interventions are of only limited efficacy despite relatively high prevalence. Such complications have been studied extensively, but the pathoetiology of NP‐SLE has not yet been elucidated. Diagnosis of NP‐SLE focuses primarily on psychological manifestations, and the underlying mechanisms leading to neuropsychiatric complications remain unknown. To address potential changes in brain function before NP‐SLE development, we used resting‐state functional magnetic resonance imaging (MRI) to compare regional brain activity in SLE patients versus matched controls. We report that regional activity in cerebellum and in areas of the default mode network are attenuated in patients with SLE, and moreover individual alterations in cerebellar activity correlated positively with the disease activity index. These findings provide direct evidence that significant alteration of brain function, resembling that observed in patients with NP‐SLE, is already present in SLE patients without neuropsychiatric complications, highlighting the need for early evaluation and intervention in SLE patients. Furthermore, the disease activity rating correlated with regional functional alterations in the cerebellum, suggesting that the cerebellum could play a role in the pathogenesis of NP‐SLE. Hum Brain Mapp, 2011. © 2010 Wiley‐Liss, Inc.
Keywords: systemic lupus erythematosus, cerebral functional deficits, non‐neuropsychiatric systemic lupus erythematosus, resting state functional magnetic resonance, regional homogeneity
INTRODUCTION
Systemic lupus erythematosus (SLE) is a chronic autoimmune disease characterized by multisystem involvement and diverse clinical manifestations [Rahman and Isenberg,2008]. Neuropsychiatric systemic lupus erythematosus (NP‐SLE) is a common complication of SLE and has been studied extensively, but the pathoetiology of NP‐SLE has not been elucidated. Possible damage mechanisms include vasculopathy, autoantibodies, and inflammatory mediators, but these have not yet been confirmed [Boumpas et al.,1995]. Currently, the diagnosis of NP‐SLE is based on case categorization into one of 19 neurological and psychological syndromes as proposed by the American College of Rheumatology (ACR) in 1999. Because the underlying mechanisms leading to the development of neuropsychiatric complications have not yet been elucidated, the ACR system focuses primarily on psychological manifestations [ACR,1999]. The prevalence of NP‐SLE among patients with SLE was estimated to be as high as 76% [Sibbitt et al.,2002], and the condition is associated with a significantly reduced quality of life [Hanly et al.,2004]. Given the severe long‐term impact of these prevalent psychiatric disorders, it is important to address whether changes in cerebral function in SLE precede the evolution of NP‐SLE. This would lead to a better understanding of how SLE progresses to NP‐SLE and, by casting light on potential mechanisms of pathogenesis, could facilitate the development of early interventions.
Brain activity can be imaged using blood oxygen‐level‐dependent functional MRI (BOLD‐fMRI). This method uses deoxyhemoglobin as an endogenous contrast agent to identify areas of altered perfusion. Earlier fMRI studies reported that brain functions including working memory [Fitzgibbon et al.,2008], motor control [Rocca et al.,2006] and cognitive function [DiFrancesco et al.,2007] are altered in SLE patients with central nervous system (CNS) involvement. However, because these studies were generally performed with NP‐SLE patients, it is unclear whether the observed changes represent alterations that progressively give rise to neuropsychiatric complications or are a consequence of disease progression following the emergence of neuropsychiatric symptoms. To the best of our knowledge, fMRI studies have not yet been performed on non‐NP‐SLE patients and no investigations to date have addressed possible brain functional deficits in SLE.
We used a recently developed fMRI method known as “resting‐state” fMRI to assess brain function in a cohort of non‐NP‐SLE patients. Resting‐state fMRI not only avoids possible performance confounds, but in the context of clinical studies to assess resting‐state brain physiology, the method is easier to implement than positron emission tomography (PET)/single photon emission computed tomography (SPECT) because of its lower cost, greater availability, and noninvasiveness [Lui et al.,2009]. Low‐frequency (0.01–0.08 Hz) fluctuations of the BOLD signal in resting‐state fMRI are thought to reflect spontaneous neural activity in nonhumans [Leopold et al.,2003; Shmuel and Leopold,2008] and humans [Goncalves et al.,2006; Laufs et al.,2003]. Regional homogeneity (ReHo), a method developed to analyze resting‐state data, assumes that the hemodynamic characteristics of each voxel within a functional cluster are similar and/or synchronous, and the hemodynamic characteristics of each are modulated in parallel under different conditions [Zang et al.,2004]. This method has been successfully used to investigate functional resting‐state changes in Parkinson disease [Wu et al.,2009], schizophrenia [Liu et al.,2006], and Alzheimer disease [He et al.,2007]. Before experimentation, we hypothesized that (1) changes in brain functional activity in non‐NP‐SLE patients could be located in multiple cerebral regions and (2) individual ReHo values in specific regions could correlate with disease activity or glucocorticoid (GC) dosage of patients.
SUBJECTS AND METHODS
Participants
We initially recruited 33 right‐handed female non‐NP‐SLE patients. Of these, two were excluded from the study, because overt cerebral deficits were visible on T1 and T2 scans. The study therefore included 31 female patients (ages 34.4 ± 7.6 years, education 11.9 ± 3.2 years). The study was approved by the Southwest Hospital Ethical Committee, and all participants gave written informed consent to their participation. Diagnosis of SLE and non‐NP‐SLE was performed by a consensus of the attending physicians based on ACR SLE criteria [Hochberg,1997] and ACR case definition [ACR,1999]. As a control group, 23 right‐handed healthy female volunteers were recruited from the local community by poster advertisement; age, height, handedness, weight, and years of education were matched between groups (Table I). The following exclusion criteria applied to all subjects: organic brain disorder, alcohol or drug abuse, pregnancy, or any physical illness such as hepatitis, brain tumor, or epilepsy. Brain MR images (T1 and T2‐weighted images) were inspected by two experienced neuroradiologists to exclude any gross structural abnormalities of the brain.
Table I.
Demographic data and clinical characteristics of subjects
| Characteristics | SLE (n = 31) | Controls (n = 23) | P value |
|---|---|---|---|
| Mean age (years) | 34.4 | 31.5 | 0.79 |
| Education (years) | 11.9 | 12.9 | 0.22 |
| Height (cm) | 157.5 | 159.6 | 0.06 |
| Weight (kg) | 54.5 | 54.2 | 0.44 |
| Illness duration (months) | 60 | — | — |
| SLEDAI | 6.3 | — | — |
| GC dosage (mg) | 18.9 | — | — |
Data Acquisition
MR images sensitized to changes in BOLD signal levels were obtained using a 3‐T MR imaging system (TRIO TIM; Siemens) with a gradient‐echo echo‐planar imaging (EPI) sequence: repetition time/echo time (TR/TE), 2,000/30 ms, flip angle 90°, slice thickness 4 mm (no slice gap), matrix 64 × 64, FOV 256 × 256 mm, isotropic voxel 4 × 4 × 4 mm. Each brain volume comprised 36 axial slices, and each functional run contained 210 image volumes preceded by five dummy volumes, resulting in a total scan time of 430 s. All participants were instructed not to focus their thoughts on any particular topic and to keep their eyes closed during resting‐state fMRI acquisition. A further high‐resolution structural T1‐weighted image was scanned using a volumetric 3D magnetized prepared rapid gradient echo (MP‐RAGE) sequence: TR/TE 1900/2.52 ms, flip angle 15°, slice thickness 1 mm; 144 partitions, matrix 256 × 256, isotropic voxel 1 × 1 × 1 mm.
Data Processing
Functional image preprocessing and statistical analyses were carried out using SPM8 software (Statistical Parametric Mapping; http://www.fil.ion.ucl.ac.uk/spm/). For each subject, the first five volumes of functional images were discarded to allow for steady‐state magnetization and stabilization of participant status. EPI images were slice‐time corrected to the middle slice acquired in time and realigned and resliced to correct for head motion with a mean volume created. Structural images were co‐registered with the mean volume of functional images and subsequently segmented by an inbuilt unified segmentation routine in SPM8 [Ashburner and Friston,2005]. The parameter created by segmentation was then applied to functional images, nonlinear normalization to the Montreal Neurological Institute template brain, and each voxel was resampled to isotropic 3 × 3 × 3 mm. To avoid manipulation error confounds and standardize the process, a batch processing tool DPARSF (data processing assistant for resting‐state fMRI; http://www.restfmri.net) [Chao‐Gan and Yu‐Feng,2010] was used. The head motion of all participants during resting‐state fMRI acquisition was observed, and data were excluded from this study if the translation exceeded 1 mm or if rotation exceeded 1°.
Calculation of ReHo
ReHo analysis was performed by using REST software (http://www.resting-fmri.sourceforge.net/). Functional images were bandpass filtered (0.01 Hz < f < 0.08 Hz) to reduce low‐frequency drift and physiological high‐frequency respiratory and cardiac noise, and linear trends were removed to reduce the influence of the rising temperature of the MRI equipment [Biswal et al.,1995]. For each voxel, KCC (Kendall's coefficient of concordance) values [Kendall,1990] were calculated to measure ReHo or similarity of the ranked time series with the nearest 26 neighboring voxels. By calculating the KCC value for every voxel throughout the whole brain, individual ReHo maps were generated. For standardization purpose, each individual ReHo map was divided by that subject's global mean brain KCC value. This procedure is similar to that employed in PET studies [Raichle et al.,2001]. Finally, processed images were smoothed with an isotropic Gaussian kernel (full‐width at half‐maximum, 8 mm).
Statistical Analysis
ReHo maps in the SLE and control groups were compared on a voxel‐wise basis by using the two‐sample t‐test in SPM8. Results were displayed by REST software with a threshold of P < 0.05 with multiple comparison corrected by the Alphasim inbuilt routine for whole‐brain analysis, which applies a Monte–Carlo simulation and calculates the probability of false‐positive detection by taking into consideration both the individual voxel probability threshold and cluster size [Cox,1996].
Finally, to explore whether individual ReHo correlated with SLE disease activity index (SLEDAI) or GC dosage, the mean ReHo values in multiple ROIs were extracted from each individual ReHo map, with ROIs selected using the WFU_PickAtlas (Wake Forest University, Wake Forest, NC) [Maldjian et al.,2003,2004]. A total of 22 ROIs were extracted based on (1) the results of current study, (2) previously reported to be related to SLE including bilateral amygdala [Emmer et al.,2006] and limbic areas comprising the anterior cingulate cortex (ACC), the hippocampus, and thalamus. Regional ReHo values were extracted and explored for correlation with SLEDAI score or GC dosage using the Spearman correlation test and SPSS 16.0 software (SPSS, Chicago, IL).
RESULTS
Resting‐state fMRI was used to compare regional brain activity in non‐NP‐SLE patients and matched normal volunteers. The ReHo maps of both subject groups are shown in Figure 1. Both subject groups displayed significant activation of the default mode network in the generated ReHo maps.
Figure 1.
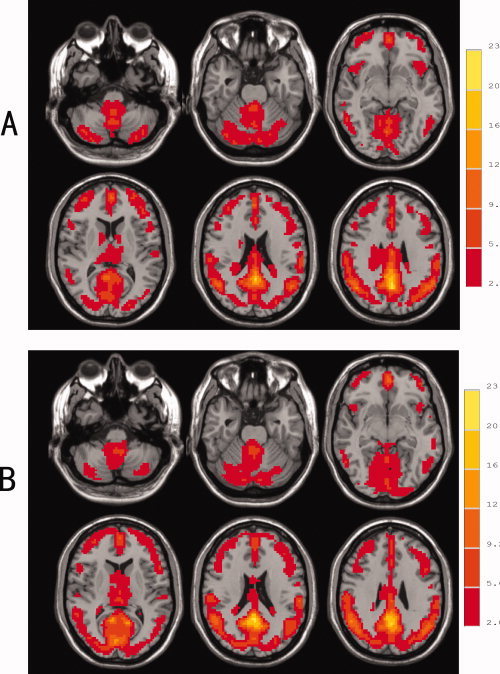
Resting state regional homogeneity (ReHo) maps of healthy controls (A) and SLE patients (B) (P < 0.05, following correction for multiple comparisons). The left side of image corresponds to the right side of the brain (Radiological Convention).
Two sample t‐test (whole brain analysis) indicated that, compared to the controls, SLE subjects displayed significantly decreased ReHo values in multiple areas including the bilateral posterior lobes of the cerebellum (predominantly in crus I and II of the neocerebellum), the vermis, left inferior frontal gyrus, left precuneus, right limbic lobe, and cingulate gyrus; ReHo was increased in bilateral cuneus and in the calcarine gyrus (in all cases P < 0.05 following correction; Fig. 2 and Table II).
Figure 2.

T‐statistic maps of SLE patients versus healthy subjects. In SLE patients, significantly decreased ReHo values were found in multiple areas (P < 0.05, corrected), including bilateral posterior lobes of the cerebellum (A), vermis (B), left inferior frontal gyrus (C), right cingulate gyrus (D), left precuneus (E), and right limbic lobe (F). Relative ReHo values appeared to be increased in bilateral cuneus (G) and calcarine gyrus (H) (P < 0.05, corrected). T‐score bars are shown on the right. Hot and cold colors indicate SLE‐related ReHo increases and decreases, respectively. The left side of image corresponds to the right side of the brain (Radiological Convention).
Table II.
Brain regions with significantly altered ReHo value in SLE patients
| Location | AAL area (mm3) | Peak t‐value MNI coordinates | Peak t‐value | Volume (mm3) | ||
|---|---|---|---|---|---|---|
| x | y | z | ||||
| Decreased ReHo in SLE | ||||||
| L cerebellum posterior lobe | Cerebelum Crus2 L (1269) | −30 | −81 | −45 | −3.52 | 1,890 |
| L precuneus | Occipital Mid L (837) | −33 | −63 | 27 | −3.33 | 2,106 |
| L inferior frontal gyrus | Frontal_Inf Tri L (1161) | −36 | 39 | 3 | −4.04 | 1,458 |
| R cerebellum posterior lobe | Cerebelum Crus2 R (1458) | 39 | −78 | −21 | −3.66 | 3,456 |
| Cerebelum Crus1 R (1323) | ||||||
| R limbic lobe | Cingulum Mid R (2727) | 6 | −39 | 30 | −4.26 | 18,009 |
| Cingulum Mid L (1458) | ||||||
| Cingulum Post R (1269) | ||||||
| SupraMarginal R (945) | ||||||
| Cingulum Post L (810) | ||||||
| Precuneus R (702) | ||||||
| Angular R (621) | ||||||
| Precuneus L (432) | ||||||
| R cingulate gyrus | Cingulum Ant R (648) | 3 | 18 | 45 | −3.39 | 2,538 |
| Cingulum Mid R (594) | ||||||
| Vermis | Cerebelum 6 L (864) | −3 | −69 | −12 | −3.24 | 1,485 |
| Vermis 6 (594) | ||||||
| Increased ReHo In SLE | ||||||
| Calcarine and R cuneus | Calcarine L (4293) | 0 | −90 | 15 | 3.76 | 10,098 |
| Calcarine R (2781) | ||||||
| Cuneus R (1350) | ||||||
| Lingual L (891) | ||||||
| R calcarine | Calcarine R (1161) | 18 | −57 | 15 | 2.92 | 1,458 |
AAL, automated anatomical lableling, which is a digital atlas of the human brain. Localization of the cerebral region the AAL area was done by using database from xjview (http://www.alivelearn.net/xjview).
We then explored the possibility that disease activity or GC dosage might be associated with regional ReHo. For this analysis, we extracted ReHo values from ROIs selected either, because they presented significantly altered ReHo in this study and/or were previously reported to associate with SLE [Appenzeller et al.,2007a; Emmer et al.,2006]. These values were compared with SLEDAI score and daily GC dosage in individual non‐NP‐SLE patients; groupwise correlations were analyzed using the Spearman correlation test. This revealed that the SLEDAI score was positively correlated with mean ReHo value from left cerebellum posterior lobe and left ACC (P < 0.01), whereas there were no correlations between GC dosage and regional ReHo values (Table III). It is therefore possible that alterations in the left posterior lobe of the cerebellum and/or left ACC could contribute to or reflect ongoing cerebral involvement in SLE.
Table III.
Association between regional ReHo value, disease severity and GC dosage
| Location | Correlation with SLEDAI | Correlation with GC dosage |
|---|---|---|
| R | R | |
| Decreased ReHo in SLE | ||
| L cerebellum posterior lobe | 0.477** | 0.257 |
| L precuneus | 0.198 | 0.193 |
| L inferior frontal gyrus | 0.138 | −0.031 |
| R cerebellum posterior lobe | 0.223 | 0.237 |
| R limbic lobe | −0.092 | −0.019 |
| R cingulate gyrus | −0.145 | −0.233 |
| Vermis | 0.11 | 0.204 |
| Increased ReHo In SLE | ||
| Calcarine and R cuneus | −0.197 | −0.236 |
| R calcarine | −0.056 | 0.025 |
| Previous proposed areas | ||
| L ACC | 0.482** | 0.278 |
P < 0.01; ACC, anterior cingulated cortex; other previously proposed area without significant correlation was not presented in the table.
DISCUSSION
Structural MRI is considered to be the neuroimaging tool of choice for morphological brain evaluation in disorders such as NP‐SLE, because it is capable of detecting different types of brain lesions including punctuate focal white matter lesions [Stimmler et al.,1993]. However, the structural MRI has been found to be of limited value in patients with diffuse neuropsychiatric disturbances such as headache, cognitive dysfunction, affective disorders, and confusional states [Rozell et al.,1998; Sabet et al.,1998]. Multiple functional neuroimaging modalities have therefore been used in SLE, including 1H‐magnetic resonance spectroscopy (MRS) [Castellino et al.,2005], SPECT [Appenzeller et al.,2007a], and fMRI [DiFrancesco et al.,2007; Fitzgibbon et al.,2008; Rocca et al.,2006]. These studies have suggested that functional alterations could precede structural changes in NP‐SLE [Castellino et al.,2005], and, moreover, they allowed differentiation between patients with or without active CNS involvement [Appenzeller et al.,2007a]. Moreover, NP‐SLE patients exhibited greater activation of specific cerebral regions than healthy controls in tasks of working memory [Fitzgibbon et al.,2008], motor control [Rocca et al.,2006], and attention and language processing [DiFrancesco et al.,2007], possibly indicative of functional compensation in NP‐SLE patients that could reflect impairment of cerebral functions relating to these tasks. One can therefore speculate that the functional deficits seen in NP‐SLE might arise from systems‐level disturbances in distributed brain networks.
Concerning non‐NP‐SLE subjects, cerebral functional changes were previously investigated using MRS [Filley et al.,2009; Kozora et al.,2005]. An increased choline/creatine (Ch/Cr) ratio was found in frontal lobe white matter, and the increase in the ratio correlated significantly both with cognitive score derived from a battery of tests and with time since diagnosis. It was concluded that myelin injury reflected by elevated Ch/Cr could be involved in disease progression and that Ch/Cr changes might represent an initial step in a sequence of neuropathologic events that produce cognitive impairment. Results from this study demonstrate that, in addition to white matter injury, resting state functional alterations are evident in distributed areas of the gray matter intrinsic network. By comparing the results reported here and in other studies, it is notable that the progressive and chronic impact of SLE is predominantly reflected in white matter injury, whereas temporal effects from disease activity was demonstrated by regional functional alterations in gray matter.
The most important finding reported here is direct evidence for changes in resting state cerebral function in gray matter in SLE patients before onset of neuropsychiatric complications. ReHo values were significantly reduced in multiple brain areas compared to healthy controls, and activity was increased in only two regions. Because the low‐frequency fluctuation (LFF) BOLD signal has been suggested to reflect spontaneous neuronal activity [Logothetis et al.,2001], ReHo measures the similarity or coherence of LFF within a given area on the basis of hemodynamic properties. Changes in ReHo values could therefore reflect alterations in the coherence of spontaneous neuronal activity, and abnormal ReHo is possibly relevant to changes of temporal aspects of spontaneous neural activity in specific brain regions [Wu et al.,2009]. Decreased or increased ReHo in SLE suggests that neural function in certain regions is less or more synchronized compared to normal controls. However, it is not known whether ReHo might simply indicate SLE‐induced changes in blood flow, and this will require further investigation.
The predominant cerebral areas with altered ReHo values lay within the posterior cingulate cortex and adjacent precuneus, brain regions that are regarded as areas of the default mode network [Raichle et al.,2001]. Activity in the default mode network has been shown to correlate inversely with overt task performance [Fox et al.,2005] and has been suggested to be relevant to mental disorders including Alzheimer disease, autism, and schizophrenia [Buckner et al.,2008]. Altered ReHo values in these areas could suggest that activity in the intrinsic default mode network is also attenuated in SLE. Other regions showing altered ReHo values, such as the calcarine and cuneus, are primarily regarded as specialized regions for primary visual processing. Nevertheless, a recent study on cognitive working load has argued that the calcarine gyrus is part of the cognitive reserve network [Stern et al.,2005], and it could be argued that impairment of this network is an underlying mechanism of cognitive dysfunction in NP‐SLE patients. Further investigations will be required to address this possibility.
We also report that SLE is accompanied by significantly changed ReHo values in the bilateral crus I and II of the neocerebellum. To best of our knowledge, the cerebellum has not previously been implicated in NP‐SLE. In recent research on the role of the cerebellum in nonmotor systems, referred as intrinsic connectivity networks, the neocerebellum (in particular, crus I and II) was found to participate in the right and left executive control networks [Habas et al.,2009]. This is consistent with our findings and with several neuropsychiatric complications of NP‐SLE.
Notably, correlation analysis between regional ReHo values and SLEDAI scores or GC dosages revealed that mean ReHo values in both neocerebellum and left ACC correlated positively with disease activity, whereas no area correlated with GC dosage. This indicates that (1) functional activity in the areas highlighted in this study is not significantly influenced by GC dosage and (2) neural activity in neocerebellum and ACC is increased in proportion to SLE disease activity. This latter finding could suggest that the neocerebellum, as part of an executive control network, could play an important role in the pathogenesis of NP‐SLE. Overall, the cerebral functional alterations identified in this study appear to be influenced by the temporal effect of SLE activity rather than by GC administration. However, it is worth noting that GC dosage was previously found to correlate with brain structural changes [Appenzeller et al.,2007b], and the potential influence of GC on cerebral function of patients with SLE should still be investigated further.
Our study has several limitations. First, disease duration was not consistent in the cohort of SLE patients (4.98 ± 4.18 years). Functional deficits are likely to precede the presentation of either structural or neuropsychological abnormalities; it is possible that the extent of brain functional alterations is highly variable within the group. Second, it was not possible to identify a sufficient number of SLE patients with active CNS involvement to serve as a positive reference controls. This was, in part, due to the diversity of neuropsychiatric symptoms displayed by SLE with overt CNS involvement, making it difficult to accumulate a group of NP‐SLE patients with comparable neuropsychological presentations. Third, although all the SLE subjects studied failed to meet criteria for CNS involvement, some of the non‐NP‐SLE patients could have displayed subclinical deficits that would have been revealed by a comprehensive battery of cognitive tests. Because systematic cognitive testing was not performed this study is unable to draw conclusions regarding a potential association between specific impairments of cognitive performance and attenuated cerebral function as revealed by fMRI of regional brain activity.
CONCLUSION
Previous neuroimaging studies focusing on NP‐SLE demonstrated cerebral abnormalities associated with CNS complications of SLE [Emmer et al.,2008; Rocca et al.,2006]. MRS studies demonstrated injury to white‐matter microstructure in non‐NP‐SLE patients [Filley et al.,2009; Kozora et al.,2005]. However, changes in resting state gray matter activity in non‐NP‐SLE patients have not previously been studied using fMRI. This study expands our understanding of SLE‐associated changes in brain function in two important ways. First, our findings demonstrate that CNS functional alterations can be observed in SLE in the absence of changes in cerebral structure or overt neuropsychiatric complications. Second, this study provides evidence that alterations may not be limited to focal changes within the domains of specific tasks, but are instead likely to be expressed at the level of intrinsic networks involving multiple brain areas. Furthermore, altered ReHo in neocerebellum correlated with disease activity, suggesting that cerebellum could play a role in the pathogenesis of NP‐SLE.
Acknowledgements
We thank all the participants for their contribution to this study, and we also thank Dr. Bing Zhong, Yan Luo, Ying Shi and Xian Cheng for subject recruitment. We are indebted to technicians Bing Xie, Chuan Lii, Xin Wang and Bing Ji for MRI scanning.
Contributor Information
Hai‐Tao Lii, Email: liihaitao@yahoo.com.cn.
Yong‐Fei Fang, Email: fyfalan@163.com.
REFERENCES
- ACR ( 1999): The American College of Rheumatology nomenclture and case definitions for neuropsychiatric lupus syndromes. Arthritis Rheum 42: 599–608. [DOI] [PubMed] [Google Scholar]
- Appenzeller S, Amorim BJ, Ramos CD, Rio PA, de CEEC, Camargo EE, Cendes F, Costallat LT ( 2007a): Voxel‐based morphometry of brain SPECT can detect the presence of active central nervous system involvement in systemic lupus erythematosus. Rheumatology (Oxf) 46: 467–472. [DOI] [PubMed] [Google Scholar]
- Appenzeller S, Bonilha L, Rio PA, Min Li L, Costallat LT, Cendes F ( 2007b): Longitudinal analysis of gray and white matter loss in patients with systemic lupus erythematosus. NeuroImage 34: 694–701. [DOI] [PubMed] [Google Scholar]
- Ashburner J, Friston KJ ( 2005): Unified segmentation. NeuroImage 26: 839–851. [DOI] [PubMed] [Google Scholar]
- Biswal B, Yetkin FZ, Haughton VM, Hyde JS ( 1995): Functional connectivity in the motor cortex of resting human brain using echo‐planar MRI. Magn Reson Med 34: 537–541. [DOI] [PubMed] [Google Scholar]
- Boumpas DT, Austin HA III, Fessler BJ, Balow JE, Klippel JH, Lockshin MD ( 1995): Systemic lupus erythematosus: Emerging concepts, Part 1: Renal, neuropsychiatric, cardiovascular, pulmonary, and hematologic disease. Ann Intern Med 122: 940–950. [DOI] [PubMed] [Google Scholar]
- Buckner RL, Andrews‐Hanna JR, Schacter DL ( 2008): The brain's default network: Anatomy, function, and relevance to disease. Ann NY Acad Sci 1124: 1–38. [DOI] [PubMed] [Google Scholar]
- Castellino G, Govoni M, Padovan M, Colamussi P, Borrelli M, Trotta F ( 2005): Proton magnetic resonance spectroscopy may predict future brain lesions in SLE patients: A functional multi‐imaging approach and follow up. Ann Rheum Dis 64: 1022–1027. [DOI] [PMC free article] [PubMed] [Google Scholar]
- Chao‐Gan Y, Yu‐Feng Z ( 2010): DPARSF: A MATLAB Toolbox for “Pipeline” data analysis of resting‐state fMRI. Front Syst Neurosci 4: 13. [DOI] [PMC free article] [PubMed] [Google Scholar]
- Cox RW ( 1996): AFNI: Software for analysis and visualization of functional magnetic resonance neuroimages. Comput Biomed Res 29: 162–173. [DOI] [PubMed] [Google Scholar]
- DiFrancesco MW, Holland SK, Ris MD, Adler CM, Nelson S, DelBello MP, Altaye M, Brunner HI ( 2007): Functional magnetic resonance imaging assessment of cognitive function in childhood‐onset systemic lupus erythematosus: A pilot study. Arthritis Rheum 56: 4151–4163. [DOI] [PubMed] [Google Scholar]
- Emmer BJ, van der Grond J, Steup‐Beekman GM, Huizinga TW, van Buchem MA ( 2006): Selective involvement of the amygdala in systemic lupus erythematosus. PLoS Med 3: e499. [DOI] [PMC free article] [PubMed] [Google Scholar]
- Emmer BJ, Steup‐Beekman GM, Steens SC, Huizinga TW, van Buchem MA, van der Grond J ( 2008): Correlation of magnetization transfer ratio histogram parameters with neuropsychiatric systemic lupus erythematosus criteria and proton magnetic resonance spectroscopy: Association of magnetization transfer ratio peak height with neuronal and cognitive dysfunction. Arthritis Rheum 58: 1451–1457. [DOI] [PubMed] [Google Scholar]
- Filley CM, Kozora E, Brown MS, Miller DE, West SG, Arciniegas DB, Grimm A, Zhang L ( 2009): White matter microstructure and cognition in non‐neuropsychiatric systemic lupus erythematosus. Cogn Behav Neurol 22: 38–44. [DOI] [PubMed] [Google Scholar]
- Fitzgibbon BM, Fairhall SL, Kirk IJ, Kalev‐Zylinska M, Pui K, Dalbeth N, Keelan S, Robinson E, During M, McQueen FM ( 2008): Functional MRI in NPSLE patients reveals increased parietal and frontal brain activation during a working memory task compared with controls. Rheumatology (Oxf) 47: 50–53. [DOI] [PubMed] [Google Scholar]
- Fox MD, Snyder AZ, Vincent JL, Corbetta M, Van Essen DC, Raichle ME ( 2005): The human brain is intrinsically organized into dynamic, anticorrelated functional networks. Proc Natl Acad Sci USA 102: 9673–9678. [DOI] [PMC free article] [PubMed] [Google Scholar]
- Goncalves SI, de Munck JC, Pouwels PJ, Schoonhoven R, Kuijer JP, Maurits NM, Hoogduin JM, Van Someren EJ, Heethaar RM, Lopes da Silva FH ( 2006): Correlating the alpha rhythm to BOLD using simultaneous EEG/fMRI: Inter‐subject variability. NeuroImage 30: 203–213. [DOI] [PubMed] [Google Scholar]
- Habas C, Kamdar N, Nguyen D, Prater K, Beckmann CF, Menon V, Greicius MD ( 2009): Distinct cerebellar contributions to intrinsic connectivity networks. J Neurosci 29: 8586–8594. [DOI] [PMC free article] [PubMed] [Google Scholar]
- Hanly JG, McCurdy G, Fougere L, Douglas JA, Thompson K ( 2004): Neuropsychiatric events in systemic lupus erythematosus: Attribution and clinical significance. J Rheumatol 31: 2156–2162. [PubMed] [Google Scholar]
- He Y, Wang L, Zang Y, Tian L, Zhang X, Li K, Jiang T ( 2007): Regional coherence changes in the early stages of Alzheimer's disease: A combined structural and resting‐state functional MRI study. NeuroImage 35: 488–500. [DOI] [PubMed] [Google Scholar]
- Hochberg MC ( 1997): Updating the American College of Rheumatology revised criteria for the classification of systemic lupus erythematosus. Arthritis Rheum 40: 1725. [DOI] [PubMed] [Google Scholar]
- Kendall MG ( 1990): Rank Correlation Methods. New York: Oxford University Press. [Google Scholar]
- Kozora E, Arciniegas DB, Filley CM, Ellison MC, West SG, Brown MS, Simon JH ( 2005): Cognition, MRS neurometabolites, and MRI volumetrics in non‐neuropsychiatric systemic lupus erythematosus: Preliminary data. Cogn Behav Neurol 18: 159–162. [DOI] [PubMed] [Google Scholar]
- Laufs H, Krakow K, Sterzer P, Eger E, Beyerle A, Salek‐Haddadi A, Kleinschmidt A ( 2003): Electroencephalographic signatures of attentional and cognitive default modes in spontaneous brain activity fluctuations at rest. Proc Natl Acad Sci USA 100: 11053–11058. [DOI] [PMC free article] [PubMed] [Google Scholar]
- Leopold DA, Murayama Y, Logothetis NK ( 2003): Very slow activity fluctuations in monkey visual cortex: Implications for functional brain imaging. Cereb Cortex 13: 422–433. [DOI] [PubMed] [Google Scholar]
- Liu H, Liu Z, Liang M, Hao Y, Tan L, Kuang F, Yi Y, Xu L, Jiang T ( 2006): Decreased regional homogeneity in schizophrenia: A resting state functional magnetic resonance imaging study. Neuroreport 17: 19–22. [DOI] [PubMed] [Google Scholar]
- Logothetis NK, Pauls J, Augath M, Trinath T, Oeltermann A ( 2001): Neurophysiological investigation of the basis of the fMRI signal. Nature 412: 150–157. [DOI] [PubMed] [Google Scholar]
- Lui S, Huang X, Chen L, Tang H, Zhang T, Li X, Li D, Kuang W, Chan RC, Mechelli A, Sweeney JA, Gong Q ( 2009): High‐field MRI reveals an acute impact on brain function in survivors of the magnitude 8.0 earthquake in China. Proc Natl Acad Sci USA 106: 15412–15417. [DOI] [PMC free article] [PubMed] [Google Scholar]
- Maldjian JA, Laurienti PJ, Kraft RA, Burdette JH ( 2003): An automated method for neuroanatomic and cytoarchitectonic atlas‐based interrogation of fMRI data sets. NeuroImage 19: 1233–1239. [DOI] [PubMed] [Google Scholar]
- Maldjian JA, Laurienti PJ, Burdette JH ( 2004): Precentral gyrus discrepancy in electronic versions of the Talairach atlas. NeuroImage 21: 450–455. [DOI] [PubMed] [Google Scholar]
- Rahman A, Isenberg DA ( 2008): Systemic lupus erythematosus. N Engl J Med 358: 929–939. [DOI] [PubMed] [Google Scholar]
- Raichle ME, MacLeod AM, Snyder AZ, Powers WJ, Gusnard DA, Shulman GL ( 2001): A default mode of brain function. Proc Natl Acad Sci USA 98: 676–682. [DOI] [PMC free article] [PubMed] [Google Scholar]
- Rocca MA, Agosta F, Mezzapesa DM, Ciboddo G, Falini A, Comi G, Filippi M ( 2006): An fMRI study of the motor system in patients with neuropsychiatric systemic lupus erythematosus. NeuroImage 30: 478–484. [DOI] [PubMed] [Google Scholar]
- Rozell CL, Sibbitt WL Jr, Brooks WM ( 1998): Structural and neurochemical markers of brain injury in the migraine diathesis of systemic lupus erythematosus. Cephalalgia 18: 209–215. [DOI] [PubMed] [Google Scholar]
- Sabet A, Sibbitt WL, Jr. , Stidley CA, Danska J, Brooks WM ( 1998): Neurometabolite markers of cerebral injury in the antiphospholipid antibody syndrome of systemic lupus erythematosus. Stroke 29: 2254–2260. [DOI] [PubMed] [Google Scholar]
- Shmuel A, Leopold DA ( 2008): Neuronal correlates of spontaneous fluctuations in fMRI signals in monkey visual cortex: Implications for functional connectivity at rest. Hum Brain Mapp 29: 751–761. [DOI] [PMC free article] [PubMed] [Google Scholar]
- Sibbitt WL, Jr. , Brandt JR, Johnson CR, Maldonado ME, Patel SR, Ford CC, Bankhurst AD, Brooks WM ( 2002): The incidence and prevalence of neuropsychiatric syndromes in pediatric onset systemic lupus erythematosus. J Rheumatol 29: 1536–1542. [PubMed] [Google Scholar]
- Stern Y, Habeck C, Moeller J, Scarmeas N, Anderson KE, Hilton HJ, Flynn J, Sackeim H, van Heertum R ( 2005): Brain networks associated with cognitive reserve in healthy young and old adults. Cereb Cortex 15: 394–402. [DOI] [PMC free article] [PubMed] [Google Scholar]
- Stimmler MM, Coletti PM, Quismorio FP Jr ( 1993): Magnetic resonance imaging of the brain in neuropsychiatric systemic lupus erythematosus. Semin Arthritis Rheum 22: 335–349. [DOI] [PubMed] [Google Scholar]
- Wu T, Long X, Zang Y, Wang L, Hallett M, Li K, Chan P ( 2009): Regional homogeneity changes in patients with Parkinson's disease. Hum Brain Mapp 30: 1502–1510. [DOI] [PMC free article] [PubMed] [Google Scholar]
- Zang Y, Jiang T, Lu Y, He Y, Tian L ( 2004): Regional homogeneity approach to fMRI data analysis. NeuroImage 22: 394–400. [DOI] [PubMed] [Google Scholar]