

Abstract
Numerous diffusion tensor imaging (DTI) studies have implicated white matter brain tissue abnormalities in schizophrenia. However, the vast majority of these studies included patient populations that use antipsychotic medication. Previous research showed that medication intake can affect brain morphology and the question therefore arises to what extent the reported white matter aberrations can be attributed to the disease rather than to the use of medication. In this study we included 16 medication‐naïve patients with schizophrenia and compared them to 23 healthy controls to exclude antipsychotic medication use as a confounding factor. For each subject DTI scans and magnetization transfer imaging (MTI) scans were acquired. A new tract‐based analysis was used that combines fractional anisoptropy (FA), mean diffusivity (MD) and magnetization transfer ratio (MTR) to examine group differences in 12 major white matter fiber bundles. Significant group differences in combined FA, MD, MTR values were found for the right uncinate fasciculus and the left arcuate fasciculus. Additional analysis revealed that the largest part of both tracts showed an increase in MTR in combination with an increase in MD for patients with schizophrenia. We interpret these group‐related differences as disease‐related axonal or glial aberrations that cannot be attributed to antipsychotic medication use. Hum Brain Mapp 34:2353–2365, 2013. © 2012 Wiley Periodicals, Inc.
Keywords: schizophrenia, white matter, never‐medicated, tract‐based analysis, diffusion tensor imaging, magnetization transfer, MRI
INTRODUCTION
Schizophrenia is a devastating illness, which not only affects gray matter tissue in the human brain but also its white matter tissue [see Olabi et al., 2011; Shenton et al., 2010]. White matter consists of large bundles of myelinated axons running in parallel enabling fast and efficient communication between distinct gray matter regions. Modern magnetic resonance imaging (MRI) techniques such as diffusion tensor imaging (DTI), [Le Bihan and Breton, 1985] and magnetization transfer imaging (MTI), [Wolff and Balaban, 1994] allow one to noninvasively study various aspects of the microstructure of these connecting white matter fiber bundles. Based on the DTI scans fractional anisotropy (FA), [Basser and Pierpaoli, 1996] and mean diffusivity (MD) can be computed, which provide information on the directionality and density of the axons [Beaulieu, 2002]. The magnetization transfer ratio (MTR) can be derived from the MTI scans to measure macromolecule (e.g., myelin) concentrations. Although FA, MD, and MTR are not completely independent, they do measure different aspects of the fiber bundle's microstructure.
White matter tracts that have frequently been implicated in schizophrenia include the uncinate fasciculi, arcuate fasciculi, genu and splenium of the corpus callosum, inferior longitudinal fasciculi, superior longitudinal fascicule, and cingulum bundles [see Kyriakopoulos et al., 2008 for a review]. However, most DTI studies so far have only examined patients on medication, which also holds true for MTR studies [Foong et al., 2000, 2001; Price et al., 2010] or studies combining DTI with MTR [de Weijer et al., in press‐a; Kubicki et al., 2005; Mandl et al., 2010]. This may be problematic since antipsychotic medication has been suggested to affect brain anatomy [Navari and Dazzan, 2009]. One way to exclude this confounding factor is to compare medication‐naive patients with schizophrenia to healthy volunteers. To date, only two DTI studies investigated the white matter's microstructure in medication‐naive schizophrenia patients [Cheung et al., 2008; Gasparotti et al., 2009], suggesting the involvement of the splenium of the corpus callosum. These studies used an region of interest (ROI) analysis and/or voxel‐based analysis. Both methods, however, are not optimal to detect small but consistent disease‐related differences in the signal that occur along complete fiber bundles [Jones, 2008]. To detect this type of disease‐related differences, so‐called fiber‐based analysis is a more sensitive method that averages FA over complete fiber bundles. However, by simply averaging the measured signal one ignores the fact that the signal may vary considerably along the fiber bundle and that effect sizes may differ for various signal levels. Especially in studies with small group sizes this may be problematic as this “within variance” reduces the sensitivity of the statistical analysis. Here we introduce a new type of fiber‐based analysis that is based on a method to detect task‐related changes in FA described in a paper by Mandl et al. 2008, in combination with the concept of the average fiber [Gerig et al., 2004; Mandl et al., 2010]. This new method differs from conventional fiber‐based analysis in two ways. First, because FA, MD, and MTR (all serving as an index of white matter integrity) are combined using a multivariate analysis of variance (MANOVA). Second, to take signal variations along the fiber bundle into account, statistical tests (in our case the MANOVA) for group are performed separately at each fiber point instead of testing FA, MD, or MTR values averaged over complete fiber tracts. If there are no group differences then the test statistics of these MANOVAs (i.e., F values) should follow an F distribution. Significant deviations from the F distribution can then be detected using the Kolmogorov–Smirnov test. However, to perform such a per point statistic approach, one needs a point‐by‐point correspondence between all subjects for the fiber tract under study. This point‐by‐point correspondence is obtained by the use of the group average fiber. This new method is more sensitive than conventional fiber‐based analysis because a part of the within‐variation (i.e., the variation of values along the fiber) is removed and the degrees of freedom are increased because FA, MD, and MTR (which are only partially dependent variables) are analyzed in one single analysis.
Consequently, this new fiber‐based analysis allows us to elicit subtle disease‐related changes found in (large parts of) the fiber bundles.
In this study, we compared a group of 16 medication‐naive patients with 23 healthy volunteers using a combination of DTI and MTI to assess the integrity of twelve major white matter fiber tracts being the uncinate fasciculi, arcuate fasciculi, inferior longitudinal fasciculi, inferior fronto‐occipital fasciculi, cingulum bundles, and the splenium and genu of the corpus callosum. Based on previous work, where we used the combination of DTI and MTI to study white matter abnormalities schizophrenia, we hypothesized that disease‐related differences are found in fiber tracts including the right uncinate fasciculus and both arcuate fasciculi as well as the splenium of the corpus callosum. Moreover, we expected that for the right uncinate fasciculus and the arcuate fasciculi the MTR would be the major contributor to these differences. Contribution of FA was expected to be limited because the patient group in this study is relatively young and various studies reported an age‐related decrease in FA for patients with schizophrenia [see Peters et al., 2010]. In an earlier study [Mandl et al., 2010] we pointed out that the interpretation of the reported disease‐related differences in MTR is not unequivocal because a higher MTR may reflect a higher concentration of macromolecules (including myelin) but may also reflect a higher concentration of free bulk water [Henkelman et al., 2001]. However, the combined analysis of FA, MD, and MTR provides additional information on the physiological processes that underpin possible changes in MTR. For instance, a higher MTR in combination with a higher FA and lower MD is concordant with more myelin while a higher MTR in combination with a higher MD would point the direction of an increase in free bulk water. The aim of this study was to determine if the previously reported disease‐related differences in white matter are independent of the use of antipsychotic medication and, if this is the case, to determine whether these differences can be ascribed to increases in myelin content or to increases in free bulk water.
MATERIALS AND METHODS
Patients with first‐episode nonaffective psychosis (n = 16), recruited from the Genetic Risk and Outcome of Psychoses (GROUP) study at the University Medical Center Utrecht, Utrecht, the Netherlands, and 23 healthy comparison subjects were included in the study. The study received approval of the local ethical committee. After complete description of the study to the subjects, written informed consent was obtained. Subjects were physically healthy and did not have a history of head injury. All subjects were assessed with the Comprehensive Assessment of Symptoms and History (CASH) [Andreasen et al., 1992] by two trained raters who independently determined the diagnosis and achieved consensus afterward. Drug use was assessed using the Composite International Diagnostic Interview (CIDI), [Robins et al., 1988]. Information was obtained on the average number of alcohol consumptions per week during the month prior MRI scan and lifetime. Two patients and two healthy comparison subjects met the DSM‐IV criteria for alcohol abuse during the month preceding the MRI scan, whereas five patients and four healthy comparison subjects met these criteria lifetime. The two groups did not differ significantly on average number of alcohol consumptions per week, neither in the last months as well as lifetime. In the patient group, severity of illness was measured with the positive and negative syndrome scale (PANSS), [Kay et al., 1987], and the duration of untreated psychosis (DUP) was calculated. Moreover, the Intelligence Quotient (IQ) of each subject was estimated based on four subtests of the Dutch version of the Wechsler adult intelligence scale (WAIS) (Information, Arithmetics, Block design and digit symbol coding). All patients fulfilled DSM IV criteria for schizophrenia and were antipsychotic‐naive at inclusion. The healthy comparison subjects fulfilled criteria for “never mentally ill” [Pfohl et al., 1995]. As shown in Table 1 the groups were matched for sex, age, handedness, and socioeconomic status of their parents (expressed as the highest level of education completed by one of the parents).
Table 1.
Demographic and clinical data of the medication naïve first‐episode (FE‐MN) patients with schizophrenia and healthy comparison subjects
| FE‐MN patients N = 16 | Healthy comparison subjects N = 23 | |||
|---|---|---|---|---|
| Mean/N | SD | Mean/N | SD | |
| Sex, no. of subjects m/f | 13/3 | 14/9 | ||
| Handedness, no. of subjects r/l/a | 14/2/0 | 20/2/1 | ||
| Age, yrs | 23.37 | 3.49 | 22.81 | 3.10 |
| Parental education level, yrs | 14.38 | 2.36 | 14.00 | 2.49 |
| Education, yrsa | 11.53 | 1.89 | 14.17 | 1.75 |
| IQa, b | 87.53 | 15.39 | 113.26 | 10.74 |
| Alcohol units at inclusion | 8.75 | 18.39 | 8.13 | 9.50 |
| Alcohol units lifetime | 21.56 | 28.87 | 14.91 | 31.23 |
| DSM alcohol at inclusion (yes/no) | 2/14 | 2/21 | ||
| DSM alcohol LT (yes/no) | 5/11 | 4/19 | ||
| Hard drugs at inclusion (yes/no) | 1/15 | 0/23 | ||
| Hard drugs LT (yes/no) | 2/14 | 1/22 | ||
| Cannabis at inclusion (yes/no)a | 5/11 | 0/23 | ||
| Cannabis LT (yes/no)a | 8/8 | 3/20 | ||
| Nicotine (yes/no)a | 12/4 | 7/16 | ||
| Lorazepam at inclusion (yes/no) | 1/15 | |||
| Citalopram at inclusion (yes/no) | 1/15 | |||
| Clonazepam at inclusion (yes/no) | 1/15 | |||
| Panss positive | 16.69 | 7.07 | ||
| Panss negative | 17.13 | 4.91 | ||
| Panss general | 35.38 | 9.60 | ||
| Illness duration (m)c | 22.24 | 35.63 | ||
| Duration of untreated illness (m)d | 86.49 | 49.20 | ||
P < 0.05.
IQ not available for one patient.
Time between onset of first psychotic symptoms and MRI scan.
Time between prodromal symptoms and MRI scan.
Acquisition and postprocessing have been described in detail [Mandl et al., 2010].
All scans were acquired on a 1.5 Tesla Intera Achieva Philips System at the University Medical Center Utrecht. In short, for each subject a three‐dimensional T1‐weighted coronal (spoiled‐gradient) echo scan (256 × 256 matrix; TE = 4.6 ms; TR = 30 ms; flip angle = 30°; 160–180 contiguous slices; total scan duration 405–456 s; 1 × 1 × 1.2 mm3 voxels; FOV = 256 mm/70%; parallel imaging applied in both phase‐encoding directions with SENSE‐factor = 1.5), two DTI scans (32 diffusion‐weighted volumes with different noncollinear diffusion directions with b‐factor = 1,000 s mm−2 and 8 diffusion unweighted volumes with b‐factor = 0 s mm−2; parallel imaging SENSE factor 2.5; flip angle 90°; 60 slices of 2.5 mm; no slice gap; 96 × 96 acquisition matrix; reconstruction matrix 128 × 128; FOV 240 mm; TE = 88 ms; TR = 9,822 ms; no cardiac gating; total scan duration 296 s per scan) and a three‐dimensional MTR scan (transverse; 2 vol., 60 slices of 2.5 mm; 128 × 128 acquisition matrix; FOV 240 mm; flip angle 8°; TE = 3.7 ms; TR = 37.5 ms; SENSE factor 2.5; MT prepulse at second volume with off‐resonance prepulse frequency offset 1,100 Hz, 620°, three‐lobe sync‐shaped; total scan duration 394 s) were collected.
After simultaneous correction for motion and gradient‐induced distortions [Andersson and Skare, 2002] the diffusion tensors were computed per voxel [Chang, et al. 2005] followed by the computation of the FA and the MD. The magnetization transfer ratio (MTR) was computed per voxel from the MTI scan using the following formula: MTR = (S 0 − S p)/S 0, where S 0 is the first volume (without magnetization prepulse) and S p is the second volume (with magnetization prepulse). All image registrations were performed using the ANIMAL software package [Collins et al., 1995]. For within‐subject registration purposes the rigid transformations were computed between the diffusion‐unweighted (b = 0 s mm−2) volume of the postprocessed DTI scan and the T1‐weighted image, and between the diffusion‐unweighted volume and the first volume of the MTI scan both using mutual information as similarity metric. The rigid transformation that aligns the MTR volume with the T1‐weighted image is obtained by concatenating the rigid transformation that registers the MTI scan to the DTI scan, and the rigid transformation that registers the DTI scan to the T1‐weighted scan. In addition, for each subject a nonlinear transformation was computed between the T1‐weighted scan and a model brain [Boos et al., 2011] using cross‐correlation as similarity metric. The latter is computed because concatenation of this nonlinear transformation with the rigid transformation that co‐registers the DTI scan with the T1‐weighted scan allows us to place the reconstructed fiber tracts from each subject's native space into one common (model) space.
Fiber Tracking and Fiber Bundle Selection
We note that the reconstruction of the tracts was performed in native space while the selection of the fiber tracts, the computation of the average fibers and the analysis on the average fibers was performed in model space. Using the diffusion tensor images, all possible tracts in brain were reconstructed separately for each subject with an in‐house implementation of the fiber assignment by continuous tracking (FACT) algorithm [Mori et al., 1999] and the following parameter settings: eight seed‐points per voxel, minimum FA = 0.1, maximum angle = 45°, maximum average angle with neighboring voxels = 45°. Next, the points of the reconstructed tracts were labeled with the corresponding FA, MD, and MTR values. Then, for each subject, the sets of labeled tracts were warped from native space into model space using the previously computed nonlinear transformation (i.e., DTI native space to model space). The reconstructed tracts are continuous lines consisting of multiple segments (so‐called polylines) and are completely described by the begin‐ and endpoints of the segments. Therefore, to warp a set of tracts, it is sufficient to apply the nonlinear transformation to the set of begin and endpoints of the segments.
A multiple ROI fiber bundle selection approach [Wakana et al., 2004] was used to select the fiber tracts of interest (Fig. 1). Because the fiber tracts for each subject are in one common space, the ROIs needed to select the 12 fiber bundles had to be manually delineated only once, on the model brain. The definition of the ROIs is detailed in Appendix A.
Figure 1.
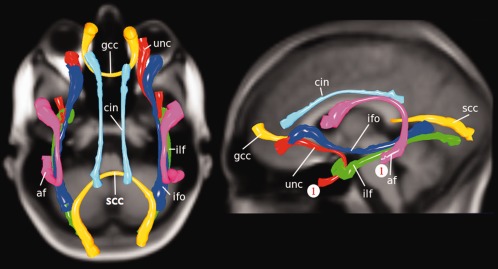
Group average fiber bundles. The group average fiber bundles used in the tract‐based analysis are the af: arcuate fasciculus; unc: uncinate fasciculus; gcc: genu of corpus callosum; scc: splenium of corpus callosum; ilf: inferior longitudinal fasciculus; ifo: inferior fronto‐accipital fasciculus; cin: cingulum tract. The starting points of the tracts for which the results are shown in Figure 2 are denoted by “1” (in red). [Color figure can be viewed in the online issue, which is available at http://wileyonlinelibrary.com.]
Computation of Group Average Fibers
To obtain a point‐by‐point correspondence over all subjects we computed the group average fiber for each of the 12 fiber bundles. Such a group average fiber, which serves as a reference frame, is computed in two separate stages. At the first stage, an average fiber [Gerig et al., 2004; Mandl et al., 2010] is computed for each of the reconstructed fiber bundles for each individual subject. An average fiber is a representation of the shape of a fiber bundle and the computation of an average fiber is detailed in Appendix B. At the second stage one average fiber is computed over all the individual average fibers created at the first stage. Because the length of these average fibers may vary between subjects (due to variations at the outer ends) we excluded the parts at the outer ends where <50% of the subjects contributed. This group average fiber is then used to resample the original individual reconstructed fiber bundles yielding a point‐by‐point correspondence along the fiber bundle between all subjects.
Average Fiber Statistics
With conventional fiber‐based analysis the FA (or MD or MTR) values are averaged over the bundle assuming that possible group effects are consistently found along the complete (or at least large parts of) fiber bundle. This approach ignores the fact that these values may vary considerably along the bundle and that group effects may vary accordingly. Moreover, the relation between the FA, MD, and MTR may vary as well for different parts of the bundles. The major advantage of using the concept of the group average fiber is that there is a per point (i.e., points of the group average fiber) correspondence between subjects and therefore allows for a point‐by‐point comparison between groups along the complete bundle. By applying a statistical test per point and then combining these results for all group average fiber points one eliminates the within fiber variance. In addition, one can apply statistical tests (e.g., MANOVA) per point that search for an optimal contrast of FA, MD, and MTR values revealing group‐differences. In this study we apply a MANOVA for each point of a group average fiber with FA, MD, and MTR as dependent variables yielding an F value. If no group effect is present then all the F values for all points along the group average fiber should follow an F distribution. Using the Kolmogorov–Smirnov test we then test if the measured distribution deviates significantly from an F distribution. If this is the case, then a post‐hoc analysis is warranted to assess the nature of the group differences. To deal with possible dependencies between the measurements along the group average fiber we computed a correction factor for the degrees of freedom using the singular value decomposition of the covariance matrix of the raw measurements [Nyholt, 2004]. This correction factor was computed separately for the FA, MD, and MTR measurements and the average of these correction factors was used to compute the corrected degrees of freedom. In the MANOVA, group was added as independent variable while age, sex, handedness, lifetime alcohol abuse, alcohol abuse at inclusion, lifetime hard drugs abuse, hard drug abuse at inclusion, lifetime cannabis abuse and cannabis abuse at inclusion were used as covariates. Finally, the Bonferroni correction for multiple comparisons was used to correct for the number of fiber bundles that were tested.
Clustering
In the post‐hoc analysis the MANOVA results of the group average fiber points were clustered. The assignment to a specific cluster was based on the signs of the mean patient/control differences in FA, MD, and MTR found at a point. Eight combinations are possible (for example, FA patients smaller than (<) FA controls, MD patients greater or equal than (≥) MD controls, MTR patients < MTR controls). Some of these combinations are consistent with biophysical differences. For instance, in case of strong myelination (c.p.), regions on the fiber bundle where the axons run highly in parallel (i.e., have a high FA value) are expected to have a higher FA, a higher MTR, and a lower MD. This because the alignment of the myelin sheaths is directly related to the alignment of axons and myelin leads to a greater hindrance to intra‐axonal diffusion and a greater tortuosity for extra‐axonal diffusion [Beaulieu, 2002]. However, for regions where axons cross with axons of another fiber bundle (yielding a low FA value), a higher myelin concentration would also lead to a higher MTR as well as a lower MD but does not necessarily alter the FA. More myelin would result in an increase in MTR (reflecting a higher macromolecular concentration) but influence the diffusion profile equally in all directions as the axons—and therefore the myelin sheaths—have no clear preferred direction. An increase in myelin would therefore have an effect on the size of the diffusion profile (represented by MD) but not its shape (represented by FA). It was previously pointed out [Mandl et al., 2010] that the interpretation of the MTR is complicated by the fact that the MTI acquisition as used in this study has a considerable T1‐weighting. As a consequence, a higher MTR may not only reflect a higher macromolecule content but could also be caused by a prolonged T1, for instance due to more in free bulk water. In combination with MD, however, it is possible to determine which of the two possible mechanisms is most likely. If a higher MTR is accompanied by a lower MD then this would point in the direction of a higher macromolecule content while a higher MTR in combination with a higher MD would suggest more free bulk water. The effect of more free bulk water on FA, however, is not straight forward as this depends on the actual shape of this difference in free bulk water. Thus, in contrast to MTR and MD, the FA value is assumed to provide information on possible differences in myelin but not on possible differences in free bulk water.
We defined four separate clusters that could be linked with more/less myelination or with more/less in bulk water in patients with schizophrenia as compared to healthy controls. Cluster no. 1 is formed by those fiber points for which FA patients < FA controls, MD patients ≥ MD controls, MTR patients < MTR controls and is consistent with a disease‐related decrease in myelin.
Cluster no. 2 is formed by MD patients ≥ MD controls, MTR patients ≥ MTR controls which is consistent with a disease‐related increase of free bulk water. For this cluster we do not consider effects in FA as the effects of a change in free bulk water on FA are not univocal.
Cluster no. 3 is formed by those fiber points for which FA patients ≥ FA controls, MD patients < MD controls, MTR patients ≥ MTR controls (the opposite of Cluster no. 1) and is consistent with a disease‐related increase of myelin.
Cluster no. 4 is formed by MD patients < MD controls, MTR patients < MTR controls and is consistent with a disease‐related decrease of free bulk water (the opposite of Cluster no. 2). As with Cluster no. 2 we do not consider effects in FA as the effects of a change in free bulk water on FA are not univocal.
Association With Clinical Variables
The associations between the combined FA, MD, and MTR measurements with clinical variables were computed using the same tract‐based analysis. In the analyses carried out for the patient group only, duration of untreated psychosis (DUP), Positive PANSS scores and negative PANSS scores were used as independent variable. Because a significant group difference was found for IQ (Table 1) the analysis was performed separately for the patient group and the control group, using IQ as independent variable.
RESULTS
From the 12 fiber tracts that were tested using the Kolmogorov–Smirnov test (see Table 2) only significant group‐related differences were found for the right uncinate fasciculus (D+ = 0.3592, degrees of freedom = 34, P < 0.00005) and the left arcuate fasciculus (D+ = 0.3145, degrees of freedom = 36, P < 0.0006). Additional cluster analysis (Fig. 2) revealed that for both tracts the largest cluster is Cluster no. 2 (Table 3) reflecting higher MTR and MD values in patients with schizophrenia.
Table 2.
Tract results Kolmogorov–Smirnov test
| Tract | KS‐test D+ | Corrected degrees of freedom | P |
|---|---|---|---|
| Genu | 0.0213 | 36 | 0.96 |
| Splenium | 0.0339 | 61 | 0.85 |
| Arcuate left | 0.3145 | 36 | 0.0006a |
| Arcuate right | 0.0717 | 35 | 0.67 |
| Cingulum left | 0.0675 | 40 | 0.66 |
| Cingulum right | 0.2432 | 35 | 0.013 |
| Uncinate left | 0.2128 | 32 | 0.047 |
| Uncinate right | 0.3592 | 34 | 0.00005a |
| ILF left | 0.0578 | 41 | 0.73 |
| ILF right | 0.1264 | 42 | 0.24 |
| IFO left | 0.0601 | 44 | 0.70 |
| IFO right | 0.0695 | 48 | 0.60 |
Second column shows the result of the Kolmogorov‐Smirnov test statistic (D+). The third column shows the degrees of freedom corrected for possible dependency of measurements along the tracts (e.g. dependency between neighboring points).
denotes significant after Bonferroni correction for multiple comparisons (the 12 fiber bundles).
Figure 2.
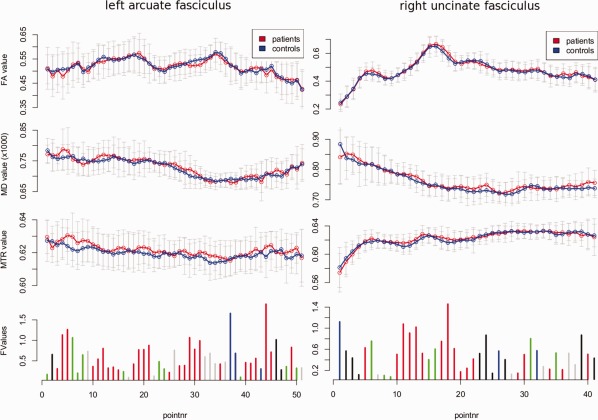
Post‐hoc clustering for the fiber bundles that showed a significant group difference. The graphs show the mean FA, MD, and MTR (top three graphs) separately for patients and controls measured along the group average fiber bundles. The graphs at the bottom show the results of MANOVA that was conducted at each fiber point to test for group differences in the combined FA, MD, and MTR measurements. The size of the vertical bars denotes the resulting F value. The distribution of these F values for each of these tracts deviates significantly from the expected F distribution (Table 2). The F values are clustered based on the signs of the group differences in the corresponding mean FA, MD and MTR values. Cluster no. 1 is denoted by black, Cluster no. 2 is denoted by red, Cluster no. 3 is denoted by green, and Cluster no. 4 is denoted by blue. Gray bars for FA, MD, and MTR denote the standard deviation. The gray bars in the F value graphs (bottom) represent a combination that could not be attributed to one of the four clusters. For both fibers the largest cluster (in number of points) is Cluster no. 2. This cluster is formed by points for which mean MD patients ≥ mean MD controls, mean MTR patients ≥ mean MTR controls, which is consistent with more free bulk water in patients. [Color figure can be viewed in the online issue, which is available at http://wileyonlinelibrary.com.]
Table 3.
Fiber bundle cluster characteristics
| Tract | Cluster no. | Cluster size | Avg. ANOVA F value for clusters (FA, MD, MTR) |
|---|---|---|---|
| Arcuate left | 1 | 3 | (0.31, 0.75, 0.87) |
| 2 | 26 | (0.59, 0.73, 0.73) | |
| 3 | 10 | (0.21, 0.68, 0.89) | |
| 4 | 3 | (0.20, 1.93, 0.07) | |
| Uncinate right | 1 | 9 | (0.57, 0.84, 0.51) |
| 2 | 17 | (0.38, 0.52, 1.65) | |
| 3 | 7 | (0.32, 0.68, 1.69) | |
| 4 | 3 | (0.27, 0.75, 0.55) |
The fourth column shows for each cluster the average F value if an ANOVA is applied separately for FA, MD, and MTR, instead of a MANOVA on FA, MD, and MTR combined. This fourth column provides additional information on which of the contrasts (FA, MD, or MTR) contributes most to the group differences in a particular cluster. Cluster 1 contains points on the fiber for which the patient/control differences in FA, MD, and MTR are consistent with lower myelin concentrations in patients. Points in Cluster 2 are consistent with higher concentrations of free bulk water in patients. Cluster 3 is consistent with higher myelin concentrations in patients while Cluster 4 is consistent with lower free bulk water concentrations in patients.
Assessment of the association between the combined FA, MD, and MTR measurements, and the clinical variables revealed a significant association (D+ = 0.286, degrees of freedom = 36, P < 0.0021) with duration of untreated psychoses in the genu of the corpus callosum that remained significant after correction for multiple comparisons (Fig. 3).
Figure 3.
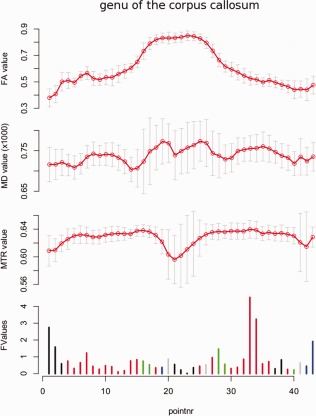
Post‐hoc analysis of the association between duration of untreated psychoses (DUP) and combined FA, MD, and MTR found for schizophrenia patients. Most fiber points are assigned to Cluster no. 2 (denoted red) that represents a positive association between DUP and MD and a positive association between DUP and MTR, which is consistent with a positive association between DUP and free bulk water. [Color figure can be viewed in the online issue, which is available at http://wileyonlinelibrary.com.]
Figure 4.
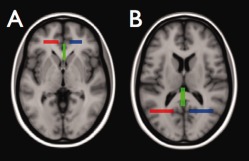
Selection of genu and splenium of the corpus callosum. The genu of the corpus callosum was defined by all fibers that pass the three ROIs shown in A while the splenium of the corpus callosum was defined by all fibers that pass the three ROIs shown in B. [Color figure can be viewed in the online issue, which is available at http://wileyonlinelibrary.com.]
Figure 5.
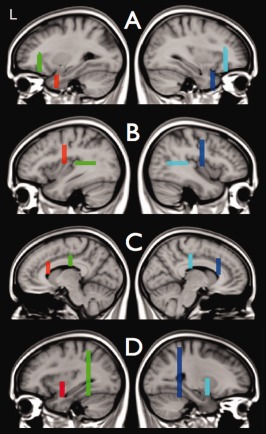
Selection of uncinate fasciculi, arcuate faciculi, inferior fronto‐occipital fascicule, and cingulum bundles. Figure 5 shows the ROIs that were used to select the left and right uncinate fasiculus (A), the left and right arcuate fasciculus (B), the left and right cingulum bundles (C), and the left and right inferior fronto‐occipital fasciculus (D). For each of these bundles only those reconstructed fiber tracts were selected that passed both ROIs. The two ROIs used to select the left bundles are shown in the left column and the two ROIs for the right bundles are shown in the right column. [Color figure can be viewed in the online issue, which is available at http://wileyonlinelibrary.com.]
Figure 6.
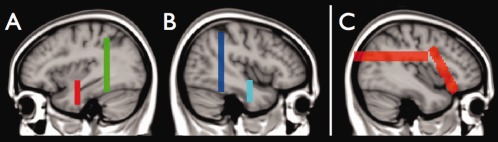
Selection of inferior longitudinal fasciculi. In first stage, those reconstructed fiber tracts are selected that pass both ROIs (shown in A for the left inferior longitudinal fasciculus and B for the right inferior longitudinal fasciculus). Visual inspection of the results showed that for some of the subjects the application of the two ROIs did not result in complete removal of tracts not part of the inferior longitudinal fasciculus. To ensure that these spurious tracts were eliminated, a third ROI was used consisting of the two planes shown in C. In the second stage all reconstructed fiber tracts were removed that passed through the third ROI. Note that these planes defining the third ROI extent from the left tot the right side of the brain. [Color figure can be viewed in the online issue, which is available at http://wileyonlinelibrary.com.]
DISCUSSION
We compared a group of 16 medication‐naive schizophrenia patients with 23 healthy comparison subjects (matched for age, sex, and handedness) on measures of white matter fiber integrity using a new fiber‐based analysis method. This analysis combines three different indices of fiber integrity (FA, MD, MTR) allowing the elucidation of subtle disease‐related differences.
Significant group differences were found for the right uncinate fasciculus and the left arcuate fasciculus, representing increased MD and MTR in patients relative to controls. These findings are consistent with the previously reported increases in MTR for the right uncinate fasciculus [Mandl et al., 2010]. Earlier DTI studies reported on abnormalities in the right uncinate fasiculus in schizophrenia. The uncinate fasciculus connects the temporal lobe with the frontal lobe in each hemisphere. This right uncinate fasciculus has been associated with verbal abstraction and categorization [Kubicki et al., 2002], extraversion [Gurrera et al., 2007], autonoetic awareness [Levine et al., 1998] and ideas of reference, suspiciousness, restricted affect and social anxiety [Nakamura et al., 2005] and may therefore play an important role in schizophrenia. Although the left uncinate fasciculus is also frequently implicated in schizophrenia, it is associated with different clinical features such as proficiency in auditory‐verbal memory, declarative memory, general intelligence and executive performance [Gurrera et al., 2007; Mabbott et al., 2009; Nakamura et al., 2005], suggesting that left and right uncinate fasciculi are part of different networks. Group‐related FA reductions in the right uncinate fasciculus in schizophrenia have been reported [de Weijer et al., in press‐a; Kawashima et al., 2009; Seal et al., 2008; Szeszko et al., 2008], but other studies failed to detect these differences [Kubicki et al., 2002; Mandl et al., 2010; Nestor et al., 2008; Peters et al., 2008; Phillips et al., 2009; Voineskos et al., 2010]. A possible explanation for these inconsistent findings is that these studies not only differ in types of analysis used, but that there is also a considerable variation in schizophrenic patient populations. And although difference in analysis and scan‐protocols may explain a part of the variation in results, the pattern that emerges from these findings is that DTI‐based group differences are more pronounced in chronic schizophrenia patients than in recent onset patients [Peters et al., 2010]. The fact that most pronounced FA effects are found in older schizophrenic patients supports the notion that measures based on diffusion‐weighted imaging alone are not optimal early markers for schizophrenia.
The question of which regions are connected by the arcuate fasciculus is a topic of active debate [Catani and Mesulam, 2008; Glasser and Rilling, 2008]. Traditionally, it was thought that the left arcuate fasciculus connects Broca's and Wernicke's areas (two gray matter brain regions involved in language processing) rendering it a crucial connection in the language network but recently this direct connection was questioned [Bernal and Ardila, 2009]. Nevertheless, it is recognized that in particular the left arcuate fasciculus plays an important role in speech production [Marchina et al., 2011] and that damage to this bundle may result in conduction aphasia [Bernal and Ardila, 2009]. Recently, the role of the arcuate fasciculus in auditory verbal hallucinations (AVH)—one of the core symptoms in schizophrenia—was investigated [Catani et al., 2011; de Weijer et al., In press‐a,b]. Using tract‐based analysis, de Weijer et al. [In press‐a] reported bilateral reductions in FA in combination with bilateral increases in MTR for the arcuate fasciculus in schizophrenia patients with frequent auditory verbal hallucinations. In a second study de Weijer et al. (In press‐b) investigated the arcuate fasciculus in schizophrenia patients with frequent AVH and nonpsychotic individuals with AVH. In that study increased MTR in the left arcuate fasciculus for both patients and nonpsychotic individuals with AVH was found but only for patients increased MTR in the right arcuate fasciculus was reported. Moreover, only in patients a reduced FA was found in the left arcuate fasciculus. In a recent study by Catani et al. 2011 tract‐based analysis was used to study the arcuate fasciculus in schizophrenia patients with and without AVH. Catani et al. 2011 reported a bilateral reduction in FA in patients with AVH but for patients without AVH only reductions in FA in the left arcuate fasciculus were found. Taken together, these findings suggest that AVH may somehow be linked to the right arcuate fasciculus and that aberrations of the left arcuate fasciculus are related to other aspects of schizophrenia.
The increases in MTR reported in Mandl et al. 2010 and [de Weijer et al., In press‐a,b] were not accompanied by increases in FA and we hypothesized that (1) the increase in MTR represented an increase in macromolecular content in the right uncinate fasciculus or (2) the increase in MTR reflected an increase in free bulk water because the MTI acquisition as used here is to a certain extent sensitive to changes in T1. Such an increase in free bulk water can be linked to axonal or glial abnormalities [Flynn et al., 2003]. Indeed, the results of the post‐hoc analysis in the current study (Table 3) show that for both the left arcuate fasciculus and the right uncinate fasciculus the group‐related differences are predominantly found in fiber points for which there is a disease‐related increase in both MTR and in MD. This is consistent with an increase in free bulk water. Therefore the results from this study confirm abnormalities in the right uncinate fasciculus and left arcuate bundle and suggest that these abnormalities cannot be explained by medication intake. Additional quantitative T1 measurements in future studies may help to further elucidate the underlying mechanisms of the observed MTR changes.
The main limitation of this study is the small sample size. We should therefore be cautious in the interpretation of these results and further studies with larger groups are needed before definite conclusions can be drawn. However, the need to investigate special groups of patients, often with a low incidence, is necessary to learn more about the disease and underscores the need for new highly sensitive analysis methods as introduced in this study. This new fiber‐based analysis has a number of advantages over existing methods such as voxel‐based morphometry (VBM), [Ashburner and Friston, 2000], conventional fiber‐based analysis or tract‐based spatial statistics (TBSS), [Smith et al., 2006]. With VBM all subjects are transformed into a common stereotaxic space typically followed by the application of a blurring kernel to reduce the effects of intersubject variability. A disadvantage of VBM analysis for DTI data is that the outcome greatly depends on the choice of the size of the blurring kernel [Jones et al., 2005]. Another disadvantage is that due to the large number of statistical tests performed (one test per voxel) a large correction for multiple comparisons is needed reducing the method's sensitivity. TBSS addresses both problems by considering only those voxels that are part of a so‐called white matter skeleton computed for each individual subject. The skeleton not only allows for a one‐to‐one voxel correspondence between subjects, therefore eliminating the need for the use of a blurring kernel, but also reduces the number of voxels to be tested hence reducing the multiple comparison correction factor. However, both VBM and TBSS perform statistical tests per voxel—a suboptimal approach in terms of sensitivity—to search for subtle disease‐related effects that occur along complete fiber tracts. Conventional fiber‐based analysis performs group comparisons over measurements averaged along complete fiber tracts and is, in that respect, optimal to detect such subtle effects. But simply averaging the measurements along the tract does not take into account the fact that group effects may be different for different parts of the tract. This is particularly important when contrasting types of measurements (e.g., FA, MD, and MTR) are combined in a MANOVA‐like approach. The new method introduced here does recognize that the relationship between the different types of measurements may vary along the tract allowing for the detection of more complex group differences. The advantage of the basic clustering method used in the post‐hoc analysis is that we could link a number of these clusters to possible physiological alterations. Future work will include the incorporation of more sophisticated clustering algorithms to obtain a better one‐to‐one mapping between clusters and physiology.
Crossings with other fibers tracts that are not included in the current analysis could influence the measurements. However, such an overlap with other fiber bundles will be typically small affecting only a limited number of points. The fact that the measured group differences pointing to an increase in free bulk water are found over large parts of the tracts suggests that the influence of such crossings on these findings is small.
Our findings implicate that the previously reported increase in MTR in medicated patients with schizophrenia in the right uncinate fasciculus [Mandl et al., 2010] and the left arcuate fasciculus [de Weijer et al., In press‐a] is also present in medication naive patients. The results of the cluster analysis suggest that the MTR increase, which is accompanied by an increase in MD, reflects axonal or glial abnormalities rather than an increase in myelin. Both the arcuate and the uncinate fasciculi are association fibers that continue to develop into early adulthood [Lebel et al., 2008]. The myelin producing oligondendrocytes in such late‐myelinating fiber bundles ensheath more axons and with smaller axon diameters than oligodendrocytes in early‐myelinating fiber bundles [Bartzokis et al., 2004; Thomason and Thompson, 2011]. This low oligodendrocyte‐to‐axon ratio may lead to an increased vulnerability to for instance elevated glutamate levels as was reported by Chang and colleagues [Chang et al., 2007]. Future studies using MR spectroscopy at ultra‐high field [Mandl et al., 2011] may help to study metabolite concentrations in these fiber bundles in schizophrenia in more detail.
One should keep in mind that the absence of group effects in the other tracts should not be interpreted as that group effects reported in these tracts in previous research is due to medication intake. The small sample size is most likely the reason that the only significant association with clinical variables was found in the genu for “duration of untreated psychosis” (DUP) while other studies did find several significant associations between clinical measures and white matter abnormalities [Hoptman, 2010]. A recent study utilizing structural MRI reported on an association between DUP and medial‐frontal gray matter volume reductions in first episode psychosis [Malla et al., 2011], but no associations with white matter volume reductions were found. In combination with our finding, this suggests that possible neurotoxic effects of prolonged untreated psychosis affect the white matters microstructure, but which does not necessarily lead to concurrent changes at a structural (volumetric) level.
In conclusion, our findings show that white matter microstructure in the brain, specifically in the left arcuate fasciculus and the right uncinate fasciculus is altered early in the disease process in schizophrenia and cannot be explained by the use of antipsychotic medication.
Appendix A.
Fiber bundle selection. The 12 fiber bundles were selected using a multiple region of interest (ROI) approach. The ROIs for the selection of the genu and splenium of the corpus callosum are shown in Figure 4. In Figure 5 the ROIs are shown that were used to select the uncinate fasciculi, arcuate fasciculi, inferior frot occipital fasciculi and cingulum bundles. The ROIs that were used to select the inferior longitudinal fasciculi are shown in Figure 6.
Appendix B.
Computation of the Average Fiber
The average fiber of a reconstructed fiber bundle (Figure 7) is computed in a series of steps:
Estimation of the position of a plane M 0 that is perpendicular to the reconstructed fiber bundle and which splits the fiber bundle in the middle. Such a plane can be defined by one point P 0 that lies in the plane and a vector V 0 that is perpendicular to the plane. Point P 0 is obtained by computing the geometric mean of the middle points of all tracts in the fiber bundle. To define vector V 0 we determine the local direction vectors of the tracts at their middle points. We define V 0 as the local direction vector that is the “most average” direction (i.e., has the largest absolute inproduct with all other local direction vectors).
Each tract from the bundle is split up in both directions in segments with a fixed step size (in this case 2 mm) starting from the middle plane M 0. Points P −n…m are defined for each of these segments in a similar way as for plane M 0. Thus, point P i is defined by the geometric mean of all end points of segment S i (with –n ≤ i ≤ m).
Now a spline representation is defined based on points P −n…m. The vectors V −n…m needed to define planes M −n…m are here defined by the local direction of the spline at points P −n…m.
The points Q and their scalar values (e.g., FA, MD, MTR) of the final average fiber are computed by cross‐sectioning the planes M −n…m with the tracts of the reconstructed fiber bundle. Thus the position of point Q i of the final average fiber is the geometric average of the positions of the cross‐sections of plane M i with the tracts of the fiber bundle. However, strongly curved fiber bundles, like the uncinate fasciculus, may erroneously be cross‐sectioned twice by the same plane. This can simply be avoided by defining a maximum radius around the initial positions estimated under 2) and only average over cross‐sections with tracts that lie within the radius.
Figure 7.
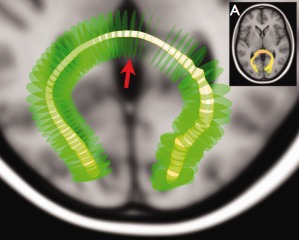
Example of an average fiber computed for the splenium. The reconstructed splenium of the corpus callosum of one of the subjects is shown in (A). The green disks represent the planes M‐n…m that were cross‐sectioned with the fiber bundle. The red arrow points to plane M 0. The varying radius of the yellow tube representing the average fiber relates here to the spread of the tracts of the splenium. [Color figure can be viewed in the online issue, which is available at http://wileyonlinelibrary.com.]
REFERENCES
- Andersson JL, Skare S (2002): A model‐based method for retrospective correction of geometric distortions in diffusion‐weighted EPI. Neuroimage 16:177–199. [DOI] [PubMed] [Google Scholar]
- Andreasen NC, Flaum M, Arndt S (1992): The comprehensive assessment of symptoms and history (CASH). An instrument for assessing diagnosis and psychopathology. Arch Gen Psychiatry 49:615–623. [DOI] [PubMed] [Google Scholar]
- Ashburner J, Friston KJ (2000): Voxel‐based morphometry—The methods. Neuroimage 11( 6, Part 1):805–821. [DOI] [PubMed] [Google Scholar]
- Bartzokis G, Sultzer D, Lu PH, Nuechterlein KH, Mintz J, Cummings JL (2004): Heterogeneous age‐related breakdown of white matter structural integrity: Implications for cortical “disconnection” in aging and Alzheimer's disease. Neurobiol Aging 25:843–851. [DOI] [PubMed] [Google Scholar]
- Basser PJ, Pierpaoli C (1996): Microstructural and physiological features of tissues elucidated by quantitative‐diffusion‐tensor MRI. J Magn Reson B 111:209–219. [DOI] [PubMed] [Google Scholar]
- Beaulieu C (2002): The basis of anisotropic water diffusion in the nervous system—A technical review. NMR Biomed 15:435–455. [DOI] [PubMed] [Google Scholar]
- Bernal B, Ardila A (2009): The role of the arcuate fasciculus in conduction aphasia. Brain 132 ( Part 9):2309–2316. [DOI] [PubMed] [Google Scholar]
- Boos HB, Cahn W, van Haren NE, Derks EM, Brouwer RM, Schnack HG, Hulshoff Pol HE, Kahn RS (2011): Focal and global brain measurements in siblings of patients with schizophrenia. Schizophr Bull. [DOI] [PMC free article] [PubMed] [Google Scholar]
- Catani M, Mesulam M. (2008): The arcuate fasciculus and the disconnection theme in language and aphasia: History and current state. Cortex 44:953–961. [DOI] [PMC free article] [PubMed] [Google Scholar]
- Catani M, Craig MC, Forkel SJ, Kanaan R, Picchioni M, Toulopoulou T, Shergill S, Williams S, Murphy DG, McGuire P (2011): Altered integrity of perisylvian language pathways in schizophrenia: Relationship to auditory hallucinations. Biol Psychiatry. [DOI] [PubMed] [Google Scholar]
- Chang LC, Jones DK, Pierpaoli C (2005): RESTORE: Robust estimation of tensors by outlier rejection. Magn Reson Med 53:1088–1095. [DOI] [PubMed] [Google Scholar]
- Chang L, Friedman J, Ernst T, Zhong K, Tsopelas ND, Davis K (2007): Brain metabolite abnormalities in the white matter of elderly schizophrenic subjects: Implication for glial dysfunction. Biol Psychiatry 62:1396–1404. [DOI] [PMC free article] [PubMed] [Google Scholar]
- Cheung V, Cheung C, McAlonan GM, Deng Y, Wong JG, Yip L, Tai KS, Khong PL, Sham P, Chua SE (2008): A diffusion tensor imaging study of structural dysconnectivity in never‐medicated, first‐episode schizophrenia. Psychol Med 38:877–885. [DOI] [PubMed] [Google Scholar]
- Collins DL, Holmes CJ, Peters TM, Evans AC (1995): Automatic 3‐D model‐based neuroanatomical segmentation. Hum Brain Mapp 3:190–208. [Google Scholar]
- de Weijer AD, Mandl RCW, Diederen KMJ, Neggers SWF, Kahn RS, Hulshoff Pol HE, Sommer IEC. Microstructural alterations of the arcuate fasciculus in schizophrenia patients with frequent auditory verbal hallucinations. Schziophr Res (in press‐a). [DOI] [PubMed] [Google Scholar]
- de Weijer AD, Neggers SWF, Diederen KMJ, Mandl RCW, Kahn RS, Hulshoff Pol H, Sommer IEC. Aberrations in the arcuate fasciculus are associated with auditory verbal hallucinations in psychotic and in nonpsychotic individuals. Hum Brain Mapp (in press‐b). [DOI] [PMC free article] [PubMed] [Google Scholar]
- Flynn SW, Lang DJ, Mackay AL, Goghari V, Vavasour IM, Whittall KP, Smith GN, Arango V, Mann JJ, Dwork AJ, et al. (2003): Abnormalities of myelination in schizophrenia detected in vivo with MRI, and post‐mortem with analysis of oligodendrocyte proteins. Mol Psychiatry 8:811–820. [DOI] [PubMed] [Google Scholar]
- Foong J, Maier M, Barker GJ, Brocklehurst S, Miller DH, Ron MA (2000): In vivo investigation of white matter pathology in schizophrenia with magnetisation transfer imaging. J Neurol Neurosurg Psychiatry 68:70–74. [DOI] [PMC free article] [PubMed] [Google Scholar]
- Foong J, Symms MR, Barker GJ, Maier M, Woermann FG, Miller DH, Ron MA (2001): Neuropathological abnormalities in schizophrenia: Evidence from magnetization transfer imaging. Brain 124 ( Part 5):882–892. [DOI] [PubMed] [Google Scholar]
- Gasparotti R, Valsecchi P, Carletti F, Galluzzo A, Liserre R, Cesana B, Sacchetti E (2009): Reduced fractional anisotropy of corpus callosum in first‐contact, antipsychotic drug‐naive patients with schizophrenia. Schizophr Res 108:41–48. [DOI] [PubMed] [Google Scholar]
- Gerig G, Gouttard S, Corouge I (2004): Analysis of brain white matter via fiber tract modeling. Conf Proc IEEE Eng Med Biol Soc 6:4421–4424. [DOI] [PubMed] [Google Scholar]
- Glasser MF, Rilling JK (2008): DTI tractography of the human brain's language pathways. Cereb Cortex 18:2471–2482. [DOI] [PubMed] [Google Scholar]
- Gurrera RJ, Nakamura M, Kubicki M, Dickey CC, Niznikiewicz MA, Voglmaier MM, McCarley RW, Shenton ME, Westin CF, Maier SE, et al. (2007): The uncinate fasciculus and extraversion in schizotypal personality disorder: A diffusion tensor imaging study. Schizophr Res 90:360–362. [DOI] [PMC free article] [PubMed] [Google Scholar]
- Henkelman RM, Stanisz GJ, Graham SJ (2001): Magnetization transfer in MRI: A review. NMR Biomed 14:57–64. [DOI] [PubMed] [Google Scholar]
- Hoptman JM (2010): Clinical correlates of MRI white matter abnormalities in schizophrenia. Prilozi 31:115–133. [PubMed] [Google Scholar]
- Jones DK (2008): Studying connections in the living human brain with diffusion MRI. Cortex 44:936–952. [DOI] [PubMed] [Google Scholar]
- Jones DK, Symms MR, Cercignani M, Howard RJ (2005): The effect of filter size on VBM analyses of DT‐MRI data. Neuroimage 26:546–554. [DOI] [PubMed] [Google Scholar]
- Kawashima T, Nakamura M, Bouix S, Kubicki M, Salisbury DF, Westin CF, McCarley RW, Shenton ME (2009): Uncinate fasciculus abnormalities in recent onset schizophrenia and affective psychosis: A diffusion tensor imaging study. Schizophr Res 110:119–126. [DOI] [PMC free article] [PubMed] [Google Scholar]
- Kay SR, Fiszbein A, Opler LA (1987): The positive and negative syndrome scale (PANSS) for schizophrenia. Schizophr Bull 13:261–276. [DOI] [PubMed] [Google Scholar]
- Kubicki M, Westin CF, Maier SE, Frumin M, Nestor PG, Salisbury DF, Kikinis R, Jolesz FA, McCarley RW, Shenton ME (2002): Uncinate fasciculus findings in schizophrenia: A magnetic resonance diffusion tensor imaging study. Am J Psychiatry 159:813–820. [DOI] [PMC free article] [PubMed] [Google Scholar]
- Kubicki M, Park H, Westin CF, Nestor PG, Mulkern RV, Maier SE, Niznikiewicz M, Connor EE, Levitt JJ, Frumin M, et al. (2005): DTI and MTR abnormalities in schizophrenia: Analysis of white matter integrity. Neuroimage 26:1109–1118. [DOI] [PMC free article] [PubMed] [Google Scholar]
- Kyriakopoulos M, Vyas NS, Barker GJ, Chitnis XA, Frangou S (2008): A diffusion tensor imaging study of white matter in early‐onset schizophrenia. Biol Psychiatry 63:519–523. [DOI] [PubMed] [Google Scholar]
- Le Bihan D, Breton E (1985): Imagerie de diffusion in vivo par résonance magnétique nucléaire. Compte Rendus de l'Académie de Sciences Paris 301:1109–1112. [Google Scholar]
- Lebel C, Walker L, Leemans A, Phillips L, Beaulieu C (2008): Microstructural maturation of the human brain from childhood to adulthood. Neuroimage 40:1044–1055. [DOI] [PubMed] [Google Scholar]
- Levine B, Black SE, Cabeza R, Sinden M, McIntosh AR, Toth JP, Tulving E, Stuss DT (1998): Episodic memory and the self in a case of isolated retrograde amnesia. Brain 121 ( Part 10):1951–1973. [DOI] [PubMed] [Google Scholar]
- Mabbott DJ, Rovet J, Noseworthy MD, Smith ML, Rockel C (2009): The relations between white matter and declarative memory in older children and adolescents. Brain Res 1294:80–90. [DOI] [PubMed] [Google Scholar]
- Malla AK, Bodnar M, Joober R, Lepage M (2011): Duration of untreated psychosis is associated with orbital‐frontal grey matter volume reductions in first episode psychosis. Schizophr Res 125:13–20. [DOI] [PubMed] [Google Scholar]
- Mandl RCW, Schnack HGS, Zwiers MP, van der Schaaf A, Kahn RS, Hulshoff Pol HE (2008): Functional diffusion tensor imaging: Measuring task‐related fractional anisotropy changes in the human brain along white matter tracts. PLos ONE 3:e3631. [DOI] [PMC free article] [PubMed] [Google Scholar]
- Mandl RCW, Schnack HG, Luigjes J, van den Heuvel MP, Cahn W, Kahn RS, Hulshoff Pol HE. (2010): Tract‐based analysis of magnetization transfer ratio and diffusion tensor imaging of the frontal and frontotemporal connections in schizophrenia. Schizophr Bull 36:778–787. [DOI] [PMC free article] [PubMed] [Google Scholar]
- Mandl RCW, van den Heuvel MP, Klomp DW, Boer VO, Siero JC, Luijten PR, Hulshoff Pol HE. (2011): Tract‐based magnetic resonance spectroscopy of the cingulum bundles at 7 T. Hum Brain Mapp. [DOI] [PMC free article] [PubMed] [Google Scholar]
- Marchina S, Zhu LL, Norton A, Zipse L, Wan CY, Schlaug G (2011): Impairment of speech production predicted by lesion load of the left arcuate fasciculus. Stroke 42:2251–2256. [DOI] [PMC free article] [PubMed] [Google Scholar]
- Mori S, Crain BJ, Chacko VP, van Zijl PC (1999): Three‐dimensional tracking of axonal projections in the brain by magnetic resonance imaging. Ann Neurol 45:265–269. [DOI] [PubMed] [Google Scholar]
- Nakamura M, McCarley RW, Kubicki M, Dickey CC, Niznikiewicz MA, Voglmaier MM, Seidman LJ, Maier SE, Westin CF, Kikinis R, et al. (2005): Fronto‐temporal disconnectivity in schizotypal personality disorder: A diffusion tensor imaging study. Biol Psychiatry 58:468–478. [DOI] [PMC free article] [PubMed] [Google Scholar]
- Navari S, Dazzan P (2009): Do antipsychotic drugs affect brain structure? A systematic and critical review of MRI findings. Psychol Med 39:1763–1777. [DOI] [PubMed] [Google Scholar]
- Nestor PG, Kubicki M, Niznikiewicz M, Gurrera RJ, McCarley RW, Shenton ME (2008): Neuropsychological disturbance in schizophrenia: A diffusion tensor imaging study. Neuropsychology 22:246–254. [DOI] [PMC free article] [PubMed] [Google Scholar]
- Nyholt DR (2004): A simple correction for multiple testing for single‐nucleotide polymorphisms in linkage disequilibrium with each other. Am J Hum Genet 74:765–769. [DOI] [PMC free article] [PubMed] [Google Scholar]
- Olabi B, Ellison‐Wright I, McIntosh AM, Wood SJ, Bullmore E, Lawrie SM (2011): Are there progressive brain changes in schizophrenia? A meta‐analysis of structural magnetic resonance imaging studies. Biol Psychiatry 70:88–96. [DOI] [PubMed] [Google Scholar]
- Peters BD, de Haan L, Dekker N, Blaas J, Becker HE, Dingemans PM, Akkerman EM, Majoie CB, van Amelsvoort T, den Heeten GJ, et al. (2008): White matter fibertracking in first‐episode schizophrenia, schizoaffective patients and subjects at ultra‐high risk of psychosis. Neuropsychobiology 58:19–28. [DOI] [PubMed] [Google Scholar]
- Peters BD, Blaas J, de Haan L (2010): Diffusion tensor imaging in the early phase of schizophrenia: What have we learned? J Psychiatr Res 44:993–1004. [DOI] [PubMed] [Google Scholar]
- Pfohl B, Blum N, Zimmerman M (1995): Structured Interview for DSMIV Personallity: SIDP‐IV. Iowa City: University of Iowa. [Google Scholar]
- Phillips OR, Nuechterlein KH, Clark KA, Hamilton LS, Asarnow RF, Hageman NS, Toga AW, Narr KL (2009): Fiber tractography reveals disruption of temporal lobe white matter tracts in schizophrenia. Schizophr Res 107:30–38. [DOI] [PMC free article] [PubMed] [Google Scholar]
- Price G, Cercignani M, Chu EM, Barnes TR, Barker GJ, Joyce EM, Ron MA (2010): Brain pathology in first‐episode psychosis: Magnetization transfer imaging provides additional information to MRI measurements of volume loss. Neuroimage 49:185–192. [DOI] [PMC free article] [PubMed] [Google Scholar]
- Robins LN, Wing J, Wittchen HU, Helzer JE, Babor TF, Burke J, Farmer A, Jablenski A, Pickens R, Regier DA, et al. (1988): The composite international diagnostic interview: An epidemiologic instrument suitable for use in conjunction with different diagnostic systems and in different cultures. Arch Gen Psychiatry 45:1069–1077. [DOI] [PubMed] [Google Scholar]
- Seal ML, Yucel M, Fornito A, Wood SJ, Harrison BJ, Walterfang M, Pell GS, Pantelis C (2008): Abnormal white matter microstructure in schizophrenia: A voxelwise analysis of axial and radial diffusivity. Schizophr Res 101:106–110. [DOI] [PubMed] [Google Scholar]
- Shenton ME, Whitford TJ, Kubicki M (2010): Structural neuroimaging in schizophrenia: From methods to insights to treatments. Dialogues Clin Neurosci 12:317–332. [DOI] [PMC free article] [PubMed] [Google Scholar]
- Smith SM, Jenkinson M, Johansen‐Berg H, Rueckert D, Nichols TE, Mackay CE, Watkins KE, Ciccarelli O, Cader MZ, Matthews PM, et al. (2006): Tract‐based spatial statistics: Voxelwise analysis of multi‐subject diffusion data. Neuroimage 31:1487–1505. [DOI] [PubMed] [Google Scholar]
- Szeszko PR, Robinson DG, Ashtari M, Vogel J, Betensky J, Sevy S, Ardekani BA, Lencz T, Malhotra AK, McCormack J, et al. (2008): Clinical and neuropsychological correlates of white matter abnormalities in recent onset schizophrenia. Neuropsychopharmacology 33:976–984. [DOI] [PubMed] [Google Scholar]
- Thomason ME, Thompson PM (2011): Diffusion imaging, white matter, and psychopathology. Annu Rev Clin Psychol 7:63–85. [DOI] [PubMed] [Google Scholar]
- Voineskos AN, Lobaugh NJ, Bouix S, Rajji TK, Miranda D, Kennedy JL, Mulsant BH, Pollock BG, Shenton ME (2010): Diffusion tensor tractography findings in schizophrenia across the adult lifespan. Brain 133 ( Part 5):1494–1504. [DOI] [PMC free article] [PubMed] [Google Scholar]
- Wakana S, Jiang HY, Nagae‐Poetscher LM, van Zijl PCM, Mori S (2004): Fiber tract‐based atlas of human white matter anatomy. Radiology 230:77–87. [DOI] [PubMed] [Google Scholar]
- Wolff SD, Balaban RS (1994): Magnetization transfer imaging: Practical aspects and clinical applications. Radiology 192:593–599. [DOI] [PubMed] [Google Scholar]