

Abstract
The aim of this large‐sample cross‐sectional voxel‐based morphometry (VBM) study of anatomical brain data was to investigate linear and nonlinear age‐related trajectories of grey matter volume in the human brain during the adult lifespan. To date, there are only a few structural brain studies investigating local nonlinear aspects at the voxel level, i.e., without using anatomical ROIs as a priori hypothesis. Therefore, we analyzed 547 T1‐weighted MR images of healthy adult brains with an age range of 19 to 86 years, including 161 scans of subjects with ages 60 and older. We found that the gray matter volume in some regions did not linearly decrease over time, but rather exhibited a delayed decline. Nonlinear age trajectories were observed in the medial temporal lobe regions, the basal ganglia, and parts of the cerebellum. Their trajectories indicated a preservation of grey matter volume during the early adult lifespan. Interestingly, we found nonlinear grey matter structural dynamics specifically in parts of the brain that have been extensively discussed in the context of learning and memory. We propose a hypothesis in relation to the functional role of these brain regions that may explain these results. Hum Brain Mapp 33:2377–2389, 2012. © 2011 Wiley Periodicals, Inc.
Keywords: aging, hippocampus, voxel‐based morphometry, plasticity, brain development
INTRODUCTION
A major question in lifespan developmental neuroscience is how the brain changes as a function of aging. Previous neuroimaging studies have given some insight into the complexity of age‐related grey matter changes [Raz and Rodrigue,2006; Sowell et al.,2004]. Methods employed included voxel‐based morphometry (VBM) [Ashburner and Friston,2000], estimates of cortical thickness across the brain surface [Dale et al.,1999; Fischl et al.,1999] or manual volume tracing. Longitudinal studies are able to measure true intrasubject age‐related changes [Dotson et al.,2009; Driscoll et al.,2009; Fjell et al.,2009a; Marcus et al.,2010; Raz et al.,2004b,2005; Resnick et al.,2003; Scahill et al.,2003; Thambisetty et al.,2010] and allow assessments of contributing factors and intersubject differences in aging [Raz et al.,2005,2010]. Unfortunately, these studies, although valuable, are rare and not yet capable of addressing age‐related brain differences spanning several decades. To address the latter point, cross‐sectional studies have been conducted to estimate the (population) mean trajectories of local grey matter changes over the entire adult lifespan. Age‐associated volume differences during adulthood were found for manually [Allen et al.,2005; Lupien et al.,2007; Raz et al.,2004b; Sullivan et al.,1995,2004,2005] and automatically [Cherubini et al.,2009; Walhovd et al.,2005a,2011] segmented brain regions of interest (ROI). Recent studies explored more spatially fine‐grained age‐related differences of adult brain structure by using surface‐based [Fjell et al.,2009b,c; Salat et al.,2004; Sowell et al.,2007; Westlye et al.,2010] or voxel‐based [Giorgio et al.,2010; Good et al.,2001; Grieve et al.,2005; Kennedy et al.,2009] analysis of cortical thickness, T1‐intensity, or grey matter volume.
In order to focus on the question of how brain grey matter changes over an individual's lifetime, the lifespan perspective enables the discrimination of qualitatively different age trajectories, e.g., linear, quadratic, or more complex functions of age (see also Fjell et al.,2010; Jernigan and Gamst,2005; Walhovd et al.,2011]. From this point of view, aging of the brain is considered as a developmental process with certain inherent dynamics that can be studied via trajectories showing growth/decline, extreme values, and acceleration of the rates of change. Initial approaches investigating structural development during adulthood on the global level revealed linear trajectories of the total grey matter volume [Allen et al.,2005; Giorgio et al.,2010; Good et al.,2001; Grieve et al.,2005; Hasan et al.,2007]; also, cortical grey matter volume [Sullivan et al.,2004; Walhovd et al.,2005a] was reported to be a linear function over adulthood. By introducing quadratic terms, two recent studies on large healthy adult samples demonstrated small significant improvements of the cerebral cortex volume model fit [Walhovd et al.,2011], at least for women [Fjell et al.,2009c]. On the local level, ROI‐based (i.e., region‐wise) analysis revealed significant nonlinearities of volume trajectories during adulthood for medial temporal lobe, especially for the hippocampal region [Allen et al.,2005; Fjell et al.,2009c; Jernigan and Gamst,2005; Kennedy et al.,2009; Lupien et al.,2007; Raz et al.,2004a; Walhovd et al.,2005a,2011] and subcortical nuclei [Walhovd et al.,2011]. However, these studies are limited by their a priori selection of anatomical ROIs, leaving the nonlinearity of other grey matter regions unexplored. Moreover, neuroanatomical subregions of larger ROIs can show nonlinear (i.e., qualitatively different) trajectories than the whole region in total, which would be completely overlooked by ROI‐based analysis. Irrespective of their vital importance for research on lifespan development, plasticity, and aging, there are only a few structural brain studies investigating nonlinear aspects on the spatially fine‐grained vertex‐ or voxel‐wise level. Using VBM overcomes the [limitations of] existing ROI‐based approaches, because it allows identification of unpredicted cortical or subcortical grey matter (sub)regions that exhibit a nonlinear volume function. In the large VBM study by Good et al. [2001], no local quadratic age effects on grey matter volume were observed. However, a nonlinear trend could be missed due to lack of subjects in the higher ages, since visual inspection of the published results revealed only 20 subjects with ages of 60 and older.
The purpose of the study proposed here is to illuminate previously unexplored areas of the brain with local nonlinear grey matter volume age trajectories for a large sample that includes a high proportion of subjects of advanced age. To accomplish this, we measured voxel‐wise nonlinear age‐related grey matter volume differences over the adult lifespan in a sample of 547 healthy adults ranging from 19 to 86 years. The large sample size included 161 datasets from subjects with ages 60 and older, providing increased estimation accuracy of estimated late‐life grey matter differences. We used a two‐step approach for (1) voxel‐wise detection of quadratic age effects in grey matter volume and (2) estimation of local nonlinear age‐related trajectories in the regions found to have significant quadratic age effects. In addition, we further elucidated at which age that age‐related grey matter volume decreases start.
MATERIALS AND METHODS
Subjects
The publicly accessible IXI database includes T1, T2, and diffusion‐weighted protocols of MR brain data from normal, healthy subjects with a wide age distribution (available at: http://www.brain-development.org for details). In order to investigate voxel‐based morphometric differences in grey matter, the analysis was restricted to T1‐weighted MR images. After selecting for completeness of imaging and demographic data, the full sample consisted of 547 T1‐weighted standard anatomical brain images with corresponding ages from 19 to 86 years (mean age: 48.1 ± 16.6 years; 242 male/305 female). The data has been acquired at three separate institutions in London: Guys Hospital using a Philips 1.5T system, the Institute of Psychiatry using a General Electric 1.5T, and the Hammersmith Hospital with a Philips 3T scanner. These subsamples consisted of 306, 174, and 67 subjects, respectively. The T1‐weighted imaging protocols with MP‐RAGE sequence provided 150, 150, and 146 sagittal slices for the 3 scanners, respectively, with the same acquisition matrix 256 × 256 and in‐plane resolution of 0.93 × 0.93 × 1.2 mm3. The age distribution and demographic details of the IXI sample are presented in Table I. 80.6% of the sample encompassed Caucasian subjects and 79.9% achieved advanced or even higher educational levels and certificates. The mean ages in subsamples of respective scanning sites were different (mean ages: 50.26/46.69/42.06 years, ANOVA site effect: P < 0.0003) but there was no interaction of gender and site with respect to age.
Table I.
Sample characteristics in different age groups
| Age group (yr) | No. subjects | No. subjects in scanning sitea 1/2/3 | Females (%) | Ethnicityb (%) | Educationc mean (SD) |
|---|---|---|---|---|---|
| 19–29 | 88 | 30/40/18 | 40 (45) | 69/1/18/12 | 4.56 (0.97) |
| 30–39 | 103 | 58/24/21 | 59 (57) | 76/3/15/6 | 4.76 (0.61) |
| 40–49 | 88 | 49/28/11 | 44 (50) | 85/1/9/5 | 4.14 (1.15) |
| 50–59 | 83 | 55/25/3 | 31 (37) | 83/4/7/6 | 3.81 (1.27) |
| 60–69 | 123 | 77/39/7 | 45 (37) | 83/3/10/4 | 3.51 (1.54) |
| 70–79 | 54 | 31/17/6 | 18 (33) | 89/2/6/3 | 3.46 (1.55) |
| 80–86 | 8 | 6/1/1 | 5 (63) | 100/0/0/0 | 3.50 (2.07) |
| Total | 547 | 306/174/67 | 242 (44) | 81/2/11/6 | 4.05 (1.03) |
Three separate subsamples from different scanning sites in London: Guys Hospital Philips 1.5T/Institute of Psychiatry General Electric 1.5T/Hammersmith Hospital with a Philips 3T scanner.
Percentage ratio of different ethnic groups in the whole IXI sample: Caucasian/Black/Asian/Other.
Education levels: 1 = no qualifications; 2 = O‐levels, GCSEs, or CSE; 3 = A‐levels; 4 = further education; 5 = university or polytechnic degrees.
SD, standard deviation.
MR Image Processing
The major preprocessing and analysis steps were done in SPM8 (Wellcome Trust Centre for Neuroimaging, London, UK; available at: http://www.fil.ion.ucl.ac.uk/spm) using the VBM8 toolbox (available at: http://dbm.neuro.uni-jena.de/vbm). The images were (1) corrected for bias‐field inhomogeneities, (2) registered using a linear (i.e., 12‐parameter affine) and a nonlinear transformation, and (3) stripped of non‐brain tissue in the T1‐weighted images. Afterwards, some results from the SPM8 unified segmentation package [Ashburner and Friston,2005] were used to initialize a VBM8 algorithm that classifies brain tissue in grey matter (GM), white matter (WM), and cerebrospinal fluid (CSF). This VBM8 segmentation procedure contains partial volume estimation (PVE) to account for mixed voxels with two tissue types [Tohka et al.,2004]. The algorithm is based on an adaptive maximum a posteriori (AMAP) approach [Rajapakse et al.,1997] and subsequent application of a hidden Markov random field model [Cuadra et al.,2005]. The AMAP estimation is adaptive in the sense that local variations of the parameters (means and variance) are modeled as slowly varying spatial functions. This accounts for intensity inhomogeneities and other local variations of intensity. Usually, the problem of normalization over a large age range is solved by generation of age‐specific templates and priors [Wilke et al.,2008]. However, our applied AMAP estimation does not rely on tissue priors, i.e., it overcomes segmentation bias that occurs due to the application of inappropriate tissue priors in elderly subjects with high atrophy. Therefore, the usual age‐specific adaption of segmentation was not necessary. It is still possible that normalization errors occurred in brains showing stronger atrophy. In order to detect these deviations, we additionally included a further quality check based on inhomogeneity measures of the sample as implemented in the VBM8 toolbox. The covariance of voxel‐based data was used to exclude subjects with extremal values and/or artifacts.
Afterwards, resulting individual grey matter volume images were multiplied voxel‐wise by the determinants of Jacobian matrices from SPMs nonlinear transformations before subsequent statistical analysis on local grey matter volumes. This modulation is done to adjust for local volume changes introduced by the nonlinear normalization. A final smoothing step was performed using Gaussian smoothing with a kernel of 4 mm full width at half maximum (FWHM). All analyses were performed on grey matter volume (GMV) images obtained using the above steps.
Analysis of Linear Age‐Related Effects
To compare the total amount of age‐related GMV differences in selected functional systems in the major lobes, we used a collection of bilateral regions of interest (ROI) as provided by the SPM Anatomy Toolbox v1.6 [Amunts et al.,2000; Eickhoff et al.,2005,2006b,2007; Geyer et al.,1999; Malikovic et al.,2007; Morosan et al.,2001; Rottschy et al.,2007; Scheperjans et al.,2008], based on cytoarchitectonic probabilistic maps. ROI names and accordant functional systems from higher motor function, speech production, and sensory systems are listed in Supporting Information, Table S2. Prefrontal cortical areas 10, 46, and 24, and the ventral visual stream areas inferior temporal gyrus (ITG) and fusiform gyrus were added from SPM toolbox WFU PickAtlas 2.3 [Maldjian et al.,2003]. In order to detect linear age‐related differences in GMV, a single GLM with site factor and site‐by‐age interactions was used (also see Section Analysis of Nonlinear Age‐Related Effects). To achieve a region‐specific age‐related trajectory, the voxel‐wise estimated GLM parameters (for each site separately) were averaged and a mean trajectory was calculated by a subsample‐size weighted mean. The resulting slopes were used to estimate the annualized and total GMV loss from age 20 to 80 years. Due to the assumed linearity of GMV trajectories in this analysis, the choice of an interval spanning six decades is arbitrary and can be replaced by linear scaling of the estimated total GMV atrophy.
Analysis of Nonlinear Age‐Related Effects
The key issue of this study is the voxel‐wise identification of nonlinear age‐related effects over adult lifespan. An appropriate model for nonlinear age‐related GMV differences in a cross‐sectional study (i.e., with large intersubject differences) must balance complexity such that it sufficiently maps inherent aging dynamics but also reduces degrees of freedom [Fjell et al.,2010]. Recent studies on structural brain aging that included nonlinearities support the usage of polynomial models up to degree 3 [Walhovd et al.,2011]. Polynomials with higher degrees or exponential functions can be more accurate but at the same time introduce the danger of overfitting. Consequently, for the scope of this study, the detection of nonlinearities was performed by rejection of the linearity assumption via identification of significant second order (i.e., quadratic) age‐related dynamics. A general linear model (GLM) was used to identify voxels in which quadratic functions of age significantly better explained the variance in GMV than linear models. To account for effects of different scanning sites, our full model included a site factor (with three levels and unequal variances) and age (as linear and quadratic covariates for each level). Model estimation was done via restricted maximum likelihood (ReML). Analysis of linear age‐related effects was performed using all brain voxels in the grey matter region. In order to avoid detection of GMV nonlinearities due to processes in the adjacent white matter, the analysis of quadratic age‐related effects included whole brain GMV values above an absolute threshold of 0.2.
The site‐by‐age interactions were weighted and averaged per subsample to achieve mean effects. Weighted means of GLM parameters were corrected for multiple comparisons by a family‐wise‐error (FWE) method, resulting in voxel‐wise thresholds of t = 5.18 (P < 0.05) for linear and t = 4.83 (P < 0.05) for quadratic effects.
Furthermore, our method contained a second step, which addressed the estimation of the adult lifespan trajectories in identified clusters with linear and nonlinear age‐related effects. As recently suggested for model‐free analysis of cross‐sectional volumetric data, we used a nonparametric smoothing spline technique [Fjell et al.,2010]. According to Fjell et al., using a quadratic model to detect nonlinearities by rejection of the linearity assumption is a valid approach. However, significance of the quadratic terms does not imply that the investigated development takes a quadratic course. That is, a parametric model is not necessary correctly specified without a priori knowledge about the true developmental model. Nonparametric smoothing splines are a local regression method that overcomes this limitation by only making assumptions about the smoothness of the model, which can be chosen by use of certain optimality criteria. Importantly, Fjell et al. demonstrated that due to the locality of estimation, the nonparametric smoothing spline was less vulnerable to variations in the range of the sample than a quadratic model. In our study, the estimation of smoothing splines was performed in the free software environment for statistical computing R (version 2.12) by using the function sreg of the fields package (available at: http://www.r-project.org/). After intracluster averaging of GMV, the data were approximated by cubic smoothing spline functions with a smoothness parameter minimizing the generalized cross‐validation (GCV) criterion (for details see also Wahba [1990)]. Furthermore, the ages with strongest acceleration of decline and estimated total GMV loss over the adult lifespan were calculated for all clusters and ROIs showing significant nonlinear age‐related trajectories. An analysis of maximum GMV was performed on both approaches, i.e., the second‐order models and the smoothing spline estimations of adult trajectories. Notably, the nonparametric estimation of trajectories in clusters with significant quadratic age‐related effects is provided in an explorative manner, i.e., not focussed on aspects of formal inference. For sake of readability we prefer using the notion “nonlinear” to refer to the quadratic model used for detection and also for the smoothing spline model used for estimation of the developmental trajectories.
As outlined in Eickhoff et al. [2006a], cytoarchitectonic maps obtained from postmortem brains provide objective a priori ROIs to test anatomical hypotheses in functional and structural neuroimaging. The cytoarchitectonically verified maps were proposed to precisely analyze anatomical MR scans, also in the comparably small subdivisions of the MTL network [Amunts et al.,2005]. In order to differentiate age‐related trajectories in MTL subregions, we estimated developmental trajectories in bilateral a priori ROIs of the amygdala and hippocampal subregions, as provided by SPM Anatomy Toolbox [Amunts et al.,2005]. The used ROIs (with labels) included the cornu ammonis 1‐3 (CA), the dentate gyrus including fascia dentata and CA4 (FD), the subicular complex (SUB), the entorhinal cortex (EC), and the amygdala (AMG).
RESULTS
Linear Trajectories and Estimates of Total GMV Loss During Adulthood
Cortical surface projections of linear age‐dependent t‐values and slope parameters are depicted in Figure 1. The large sample reveals significant negative linear age‐related GMV differences in almost all areas of the cerebral cortex. By inspection of the regression slopes (corresponding to annualized rates of atrophy) of voxels with linear age effects (threshold: t = 5.18, P < 0.05, FWE‐corrected), age‐related decreases are most pronounced in the frontal and parietal lobes and less pronounced in the temporal and occipital lobes. The frontomedial and insular regions, the inferior frontal gyrus, and the inferior parietal lobe show stronger age effects on GMV during adulthood while the middle and inferior temporal gyrus and the occipital brain regions are either less affected or unaffected.
Figure 1.
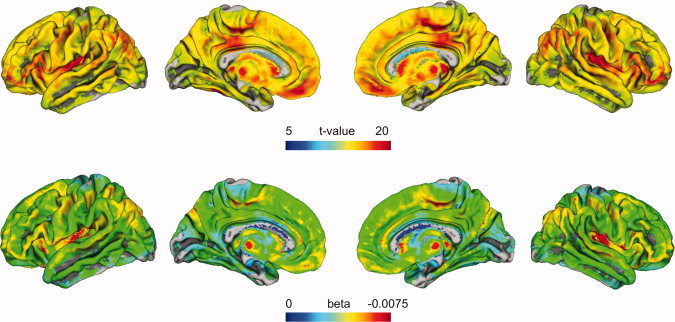
Shown are cortical projections of linear age regression parameters on a central surface template from FreeSurfer. The projection method searches for the maximum t‐value from the linear age model within ±5 mm of the surface normal. The t‐values (upper row) indicate brain regions of significant linear age‐related decreases in the GLM. Non‐colored (gray) areas were not significant. The results were corrected for multiple comparisons by FWE (voxel threshold t = 5.18, P < 0.05). The color‐coded beta values (or regression slopes) (lower row) of the same (maximum t‐value) voxel indicate the rate of age‐related changes in the linear cross‐sectional model of GMV. [Color figure can be viewed in the online issue, which is available at wileyonlinelibrary.com.]
The results of the linear ROI analysis for specialized sensory, motor, and selected prefrontal cortex regions are summarized in Supporting Information, Table S1. Furthermore, Figure 2 visualizes differential estimates of lifespan GMV atrophy in selected extrastriate regions of the ventral and dorsal visual processing streams. The ventral stream areas human V3v (hOC3v) and inferior temporal gyrus revealed low estimated GMV atrophy with 0.37% and 0.32% p.a., respectively (total: 22% and 19%). The fusiform gyrus exhibited the lowest estimate of analyzed neocortical ROIs with 0.25% p.a. (total: 15%). In contrast the dorsal stream areas V5/MT+ and area 7 showed strong age‐related effects with up to 0.67% GMV reduction p.a. (total: 40%).
Figure 2.
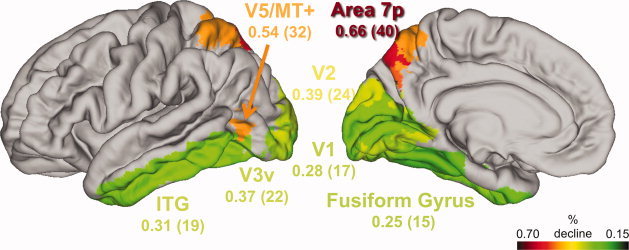
Differential pattern of annualized (total adult lifespan) GMV atrophy in analyzed ROIs of the dorsal and ventral visual streams in 547 healthy subjects. Ventral stream: hOC3v (V3v), inferior temporal gyrus (ITG), fusiform gyrus. Dorsal stream: V5/MT+, area 7. Annualized rates are given in terms of percentage reduction of GMV per anno. Total adult lifespan GMV atrophy is estimated by percentage reduction of GMV from age 20 to 80. GMV is modeled as a linear function of age. All analyzed grey matter voxels are significant with respect to threshold t = 5.18 (P < 0.05) using FWE correction for multiple comparison. [Color figure can be viewed in the online issue, which is available at wileyonlinelibrary.com.]
Nonlinear Trajectories of Local Grey Matter Volume
On global level, our sample did not exhibit lifespan nonlinearities of normalized total grey matter and white matter volume (see Supp. Info., Fig. S2). In contrast, local voxel‐based GLM analysis revealed brain clusters having nonlinear age effects in the medial temporal lobe, the basal ganglia, and the cerebellum (Table II). Figure 3A depicts the right hemisphere clusters exhibiting nonlinear age‐related GMV, projected on an anatomical T1 template surface. Strong nonlinear age effects were observed in the left and right anterior hippocampus, as well as further voxels in the adjacent parahippocampal and amygdala regions. For the polynomial model, inclusion of a quadratic age predictor increased the explained variance of mean cluster GMV by 11% and 14% for left and right hippocampus, respectively. Furthermore, we identified right cerebellar, nucleus caudate, and putamen clusters, as well as nonlinear age effects in the posterior insula (in a subregion of parietal operculum 2 (OP2)) and left ventral orbitofrontal cortex. The data plots and estimated age‐related trajectories for clusters in the right hippocampus, cerebellum, and striatum are shown in Figure 3B. To further quantify characteristics of brain regions with nonlinear trajectories, the age of maximum GMV (for both quadratic and non‐monotonic spline trajectories) and estimated total GMV loss over the adult lifespan were calculated (see Table II). All clusters exhibiting nonlinear age‐related volumetric effects revealed strongest negative acceleration of GMV in middle or late adult lifespan. Furthermore, the cluster‐specific parameters suggested the exceptionality of the hippocampus‐amygdala complex, with the latest onset of age‐related structural decline (estimated maximum GMV at about 40 years for quadratic and also nonparametric models) and small total loss during adult lifespan (17% for right hemisphere). The observed non‐monotone trajectory in the hippocampus‐amygdala complex raised the question whether there are indications for positive age associations of grey matter volume in this particular cluster. Therefore, we conducted a post hoc analysis on a subsample of 94 adult subjects with ages 20 to 40. We used a split‐half approach in order to (a) detect clusters with linearly increasing GMV in half of the subsample (GROUP1, n = 47, ages 20–40 years) and to (b) study the cluster‐specific GMV differences in the second half of the subsample (GROUP2, n = 47, ages 20–40 years). This technique avoids the risk of inferential errors about the size of local age‐related increases in GMV due to double‐dipping [see also Kriegeskorte et al.,2009]. For low thresholds (primary: t = 1.69, P < 0.05, unc., extent: k = 215, P < 0.05), we observed a coherent cluster restricted to the left hippocampus (see Fig. 4) in GROUP1. Within this cluster, the linear trajectory indicated an early adult GMV volume increase of 4% in GROUP2.
Table II.
Brain regions with significant nonlinearity of lifespan GMV trajectory
| Brain region | Hemisphere | Cluster size in voxels | Voxel t‐value (FWE‐cor.) | Peak MNI coord. (mm) | Explained variance gain due to quad. predictor (%) | Age of max. GMV in mean quadratic regression (yr) | Age of max. change of slope of smoothing spline (yr) | ||
|---|---|---|---|---|---|---|---|---|---|
| x | y | z | |||||||
| Hippocampus/amygdala | Left | 1003 | 8.99 | −28 | −15 | −18 | 14 | 41.3 | 59 |
| Cerebellum lob. V/VI (Hem.) | Right | 1935 | 8.61 | 15 | −54 | −17 | 7 | 30.8 | 54 |
| Hippocampus/amygdala | Right | 843 | 7.76 | 30 | −13 | −20 | 11 | 40.2 | 59 |
| Cerebellum lob. VII (Hem.) | Right | 1014 | 7.09 | 20 | −61 | −57 | 7 | 33.2 | 57 |
| Cerebellum lob. VI/VII (Hem.) | Left | 880 | 7.05 | −20 | −55 | −18 | 6 | 31.8 | 55 |
| Striatum | Right | 199 | 7.03 | 18 | 10 | −9 | 6 | 32.5 | 56 |
| Parietal operculum | Left | 91 | 6.86 | −36 | −19 | 16 | 5 | 26.6 | 55 |
| Parietal operculum | Right | 91 | 6.64 | 36 | −16 | 16 | 4 | 23.1 | 50 |
| Orbitofrontal cortex | Left | 64 | 6.57 | −27 | 35 | −17 | 7 | 34.5 | 59 |
| Nucleus caudate | Left | 66 | 6.40 | −12 | 20 | 0 | 4 | 30.5 | 55 |
| Cerebellum lob. VII (Hem.) | Left | 212 | 6.26 | −20 | −79 | −35 | 5 | 33.3 | 54 |
| Putamen | Left | 93 | 6.23 | −16 | 8 | −12 | 5 | 30.2 | 52 |
| Cerebellum lob. VIII (Vermis) | Right | 72 | 5.99 | 6 | −72 | −44 | 5 | 33.4 | 57 |
Listed are cluster size, peak t‐values with coordinates, percentage increase of explained variance of GMV by inclusion of a quadratic age predictor, ages of maximum GMV in quadratic model, and the ages of maximum change of slope in the smoothing spline model. All reported brain regions are significant with voxel threshold t = 4.83 (P < 0.05) and extent threshold k = 50 voxels (P < 0.0001) using FWE correction.
Figure 3.
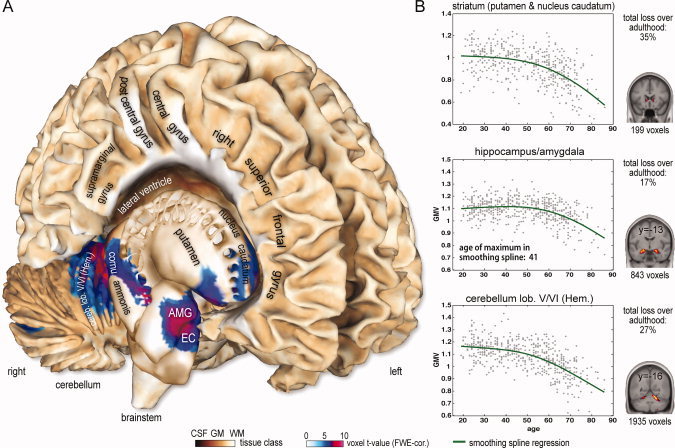
(A) Significant quadratic age effects on human GMV over adult lifespan are projected on the right hemisphere of Colin's brain. The results were corrected for multiple comparisons by FWE (voxel threshold t = 4.83 (P < 0.05); extent threshold k = 50 voxels (P < 0.0001)). Parietal operculum cluster is not depicted. (B) Estimated developmental trajectories of mean GMV for right hemisphere clusters in the striatum, hippocampus‐amygdala complex, and cerebellum. A mean trajectory is calculated using sample size weighted means of subsample trajectories for different scanning sites to remove between‐scanner variance. The given values of total loss over adulthood are percentage reductions of GMV from age 20 to 80. [Color figure can be viewed in the online issue, which is available at wileyonlinelibrary.com.]
Figure 4.
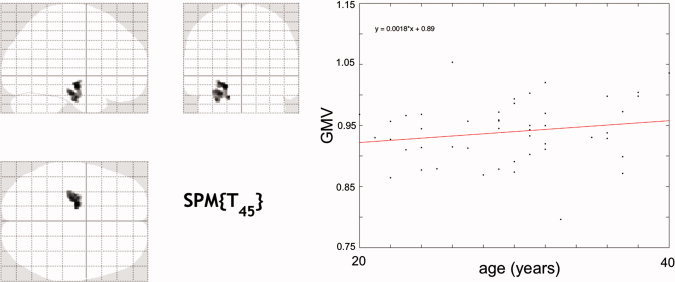
Voxel‐wise test for linearly increasing GMV in 47 young adult subjects (GROUP1, ages 20–40), with voxel threshold t = 1.69 (P < 0.05, uncorrected) and cluster threshold k = 215 voxels (P < 0.05, uncorrected). There was a 4% GMV increase of mean cluster linear regression during early adulthood (estimated in GROUP2, n = 47, ages 20–40). [Color figure can be viewed in the online issue, which is available at wileyonlinelibrary.com.]
In order to summarize the age‐related dynamics in grey matter regions with and without nonlinear age effects, Figure 5A shows estimates of the GMV trajectories of analyzed regions. GMV is normalized by volume at age 20 to make development between brain regions comparable. For the striatum and the cerebellum, we observed small negative age effects on GMV during early adulthood. After early adulthood, the estimated trajectory shows a stronger decline, reaching the mean neocortical volume trajectory at older ages.
Figure 5.
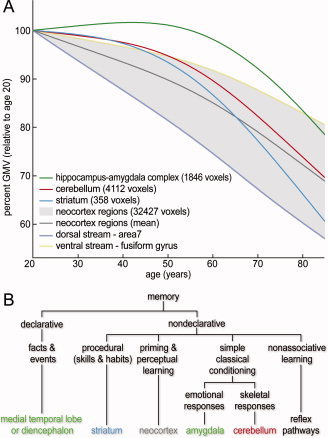
(A) Estimated GMV trajectories are plotted for identified brain regions in cerebellum, striatum, and MTL that revealed significant nonlinear age‐related differences. Blue, red, and green lines represent the mean smoothing spline trajectory over all clusters in the same (bilateral) brain region. The grey background area represents the range of trajectories from 34 a priori defined neocortical ROIs (see Supp. Info., Table S1), which exhibited no quadratic age effects. The ventral stream—fusiform gyrus and dorsal stream—area 7 were found to be the upper and lower boundary of all 34 analyzed ROIs. Mean neocortex smoothing spline regression was added for comparison (grey line). Development is delineated in units of relative GMV with respect to GMV at age of 20. (B) A taxonomy of long‐term memory systems by Squire [2004] lists the brain structures thought to be especially important for each form of declarative and nondeclarative memory. Color‐coding illustrates that significant clusters of whole‐brain voxel‐wise tests for nonlinearity (summarized in Fig. 4A) were mainly observed within brain structures that are associated with learning and memory. [Color figure can be viewed in the online issue, which is available at wileyonlinelibrary.com.]
The results of our ROI‐based test for nonlinear age effects in medial temporal lobe volume trajectories are summarized in Figure 6B. In contrast to all other analyzed MTL regions, the trajectory in the subicular complex ROI exhibited no nonlinear age effect. Figure 6A shows the estimated spline trajectories (relative to GMV at age 20) of the MTL subregions. All subregions exhibited the strongest adult acceleration of GMV decline during the ages 55 to 65 (see Fig. 6B). Notably, the estimated spline trajectory of the FD region (including the dentate gyrus) shows the lowest estimated total GMV loss over adult lifespan to be about 10%.
Figure 6.
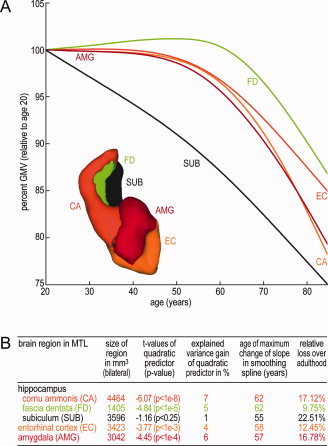
(A) Aging trajectories are plotted for a priori defined medial temporal lobe subregions. Regression plots within ROIs were achieved by subsample‐size weighting of site mean spline regressions (over all voxels in ROI). For comparison of regressions between analyzed subregions, the modeled GMV is depicted in units of GMV relative to age of 20. Also shown is a surface reconstruction of used ROI masks in three‐dimensional voxel space. Subregions: CA, cornu ammonis 1–3; EC, entorhinal cortex; FG, dentate gyrus inc. fascia dentata and CA4; SUB, subicular complex; AMG, amygdala. (B) Test of lifespan nonlinearity of MTL subregion age trajectories using quadratic age predictors in a second‐order polynomial model. Percentage gain of explained variance of GMV data included the quadratic age predictor. Estimation of ages with the strongest change in slope was obtained from the smoothing spline model for the medial temporal lobe subregions during the adult lifespan. The estimated GMV loss is the reduction of GMV at age of 80 (as modeled by smoothing splines) relative to age of 20. [Color figure can be viewed in the online issue, which is available at wileyonlinelibrary.com.]
DISCUSSION
Previous studies investigating age‐related effects have already suggested a nonlinear progression of grey matter volume dynamics in a priori hypothesized regions of the brain, especially in the MTL [Raz et al.,2004a]. However, the preference for linear approximation of a continuously changing process [DeFelipe,2006] may be one reason for some contradictory results in aging literature [for review see Walhovd et al.,2011]. To address this problem, here we used a framework for detection and estimation of voxel‐wise nonlinear developmental trajectories in order to quantify local trajectories of age‐related differences in grey matter volume during the adult lifespan. We conducted a large‐sample VBM analysis to reliably identify networks or small brain regions showing nonlinear grey matter volume dynamics, which denote changes in the annual rate of atrophy. Specific nonlinearities of structural trajectories might be related to the preservation of local brain volume during the early years of adult lifespan and a late acceleration of age‐related decline.
Linear Age‐Related Differences of Grey Matter Volume
First, we successfully replicated earlier VBM findings that showed stronger age‐related effects in the frontal and parietal lobes compared with the temporal and occipital lobes in cross‐sectional [Good et al.,2001; Smith et al.,2007] and longitudinal [Resnick et al.,2003] studies. The ROI analysis points out that primary and secondary visual regions and especially the ventral visual stream areas show much smaller age‐related differences than dorsal visual stream regions, prefrontal cortex regions, motor areas, and primary/secondary cortices of other sensory modalities. This is in line with manual [Raz et al.,2004a,2005] and automated volumetric [Good et al.,2001] findings. Interestingly, research on brain maturation has provided information about differential preservation and vulnerability patterns in visual processing streams. Particularly, fusiform regions seem to continue maturing into late adolescence and some authors also suggest high experience dependency of its development [Golarai et al.,2010; Grill‐Spector et al.,2008]. In our cross‐sectional study, we observed eminently low estimates of adult lifespan atrophy of grey matter volume in the fusiform gyrus. However, we can only speculate that the observed low annualized rates of GMV loss in the fusiform gyrus may be related to its (adaptive) role in visual processing and functional plasticity [Bukach et al.,2006; Tarr and Gauthier,2000]. Moreover, the above‐reported strong effects of age on GMV in the dorsal stream areas are in line with the recently observed vulnerability for developmental disorders of visual motion processing [Braddick et al.,2003; Gunn et al.,2002; Mendes et al.,2005]. Finally, stronger age‐related GMV differences in the dorsal part of the highly interconnected visual system network might be considered in studies about functional dedifferentiation within [Chen et al.,2002; Park et al.,2004] and between [Grady et al.,1992,1994] visual processing streams.
Nonlinear Trajectories Over the Adult Lifespan
In order to address local nonlinear age‐related differences in adult GMV, we applied a framework for detection and nonparametric estimation of the mean cross‐sectional trajectories with quadratic age‐related components. In contrast to ROI‐based methods, our voxel‐based approach is able to detect even very small grey matter regions that exhibit nonlinear age‐related differences. The 547 healthy subjects revealed nonlinear GMV development in the bilateral anterior hippocampus‐amygdala complex, the cerebellum, the striatum, and moreover small portions of the parietal operculum and the left ventral orbitofrontal gyrus. Therefore, this large cross‐sectional VBM study supports previous manual [Allen et al.,2005; Kennedy et al.,2009; Raz et al.,2004a] and automated [Walhovd et al.,2005a,b,2011] volumetric studies, suggesting nonlinear development in the human hippocampus during the adult lifespan. Moreover, the finding of a nonlinear developmental trajectory in hippocampus‐amygdala complex may be related to cross‐sectional [Good et al.,2001; Grieve et al.,2005; Sullivan et al.,2005; Walhovd et al.,2005a] and longitudinal [Fjell et al.,2009a; Raz et al.,2004b] evidence, indicating the preservation of hippocampal volume during the early and middle adult lifespans and a more pronounced late decrease of volume. As further support, recent work showed slightly increasing grey matter volume in the hippocampus‐amygdala complex in adolescents and early adults [Ostby et al.,2009]. Interestingly, our post hoc analysis suggested small positive age effects of local volume in parts of the hippocampus, which continue to the age of about 40. This question should be further addressed by carefully selected longitudinal studies about healthy brain aging that include demographic, behavioral, and cognitive data. Our whole brain voxel‐wise analysis also shows nonlinear adult volume trajectories in parts of the cerebellum and the basal ganglia. The local GMV within these clusters exhibits rather small GMV differences with respect to age during early adult lifespan, while volumes in many neocortical regions already seemed to decline (see Fig. 5A). However, this study was concerned with voxel‐based local detection and estimation of nonlinear trajectories of GMV during the adult lifespan, which did not include specific tests for between‐trajectory comparisons.
Structural Trajectories in the Medial Temporal Lobe
Recent large sample cross‐sectional MRI studies gave some insights into the complexity of adult lifespan volume trajectories in several subcortical structures, including the hippocampus and the amygdala [Fjell et al.,2009c]. There is also a growing interest to differentiate hippocampal subfields with respect to age‐related effects. In a recent study of La Joie et al. [2010], VBM with millimeter resolution appeared as a reliable automated technique to distinguish cornu ammonis and subicular complex regions of the hippocampus for cross‐sectional estimation of age‐related differences over adulthood. Therefore, we tested for nonlinearity of grey matter volume trajectories in the MTL network by ROI‐based analysis of the bilateral amygdala, subicular complex, entorhinal cortex, cornu ammonis 1–3, and dentate gyrus (including fascia dentata and CA4). The applied ROIs are based on cytoarchitectonic analysis of human brains and take into account the intersubject variability of brain structures by maximum probability maps [Amunts et al.,2005; Eickhoff et al.,2006a]. We observed significant nonlinear age effects on GMV in all MTL subregions except for the subicular complex. Therefore, this large sample VBM analysis supports recent results about differential age‐related effects within hippocampal subregions and the subicular complex [La Joie et al.,2010]. Post hoc analysis of the nonlinear developmental trajectories in the MTL subregions indicated an acceleration of volume loss around the age of 60.
Research on age‐related changes in cellular morphology gave insights in the developmental processes that may be related to the local volume trajectories of the cerebrum and MTL [Baumann and Pham‐Dinh,2001; Burke and Barnes,2006; Flood,1991; Flood et al.,1985,1987a,b; Hof and Morrison,2004; Mora et al.,2007; Peters et al.,1998]. Based on recent research on cellular plasticity, Klempin et al. [2007] hypothesized that hippocampal neurogenesis is related to demand‐ and experience‐dependent optimization of DG‐CA3 connections for adult processes of learning and memory [see also Pereira et al.,2007]. Interestingly, we observed the lowest (10%) estimates of total adult GMV atrophy in the hippocampal FD region, which includes the dentate gyrus and the CA4 region. But we have to admit that our study lacks the resolution to obtain a reliable segmentation of the separate dentate gyrus subregion. Therefore, this result needs further investigation using high resolution MRI over a wide age‐range. Notably, earlier studies suggested focal cell death in the human subicular complex due to aging, which might be related to our finding of the early adult decline of GMV trajectories in this particular region [Simić et al.,1997; West et al.,1994]. Future multimodal studies on hippocampal cellular plasticity are needed to clarify the complex relation of volumetric changes in MTL (as measured by MRI) and focal changes of neuronal and glial density or dendritic extent. One could argue that an important issue to the observation of nonlinear trajectories in parts of cerebrum and MTL is myelination. The latter is known to be a late developmental process, specifically in humans [Baumann and Pham‐Dinh,2001]. Our MRI‐based approach contained a segmentation algorithm that included partial volume estimation [Tohka et al.,2004]. In order to reduce influences due to adult formation of myelin, we applied an absolute voxel‐wise GMV threshold of 0.2. Thus our analysis of GMV nonlinearities was restricted to all grey matter voxels with explicitly high grey matter volume content. Therefore, the presented nonlinear volumetric trajectories are most likely due to processes within grey matter tissue.
In order to interpret the spatial pattern of local deviations from linearity, we speculate that it might be related to a localized delay of declining structural brain integrity during the adult lifespan. According to theories about aging, the nonlinear trajectories may indicate a localized altered interaction of progressive and regressive neurobiological changes as a process of normal aging [Sowell et al.,2004]. Recent studies emphasize the reciprocal dynamics of biological, genetic, and environmental factors contributing to brain development over the lifespan [Baltes,2006]. Even though it is still unknown to what extent these factors drive local GMV dynamics, the pattern of delayed decline in MTL, basal ganglia, and cerebellum might not be completely independent of their functional role for adaptive behavior. Interestingly, we observed nonlinear age‐related trajectories of local grey matter volumes in parts of the brain that have been extensively studied in the context of learning and memory [Squire,2009]. In our whole brain local analysis of grey matter volume, more than 96% of brain voxels that exhibited nonlinear age‐related effects over the adult lifespan were found within systems that have been associated with declarative and procedural memory or classical conditioning (Fig. 5B). Unfortunately, due to a lack of psychometric data, we were not able to relate observed structural dynamics to cognitive or behavioral factors. However, recent longitudinal studies on training‐induced neuroanatomic correlates demonstrated substantial GMV increases in the adult MTL due to acquisition of abstract knowledge [Draganski et al.,2006] and also motor skills [Boyke et al.,2008]. It is tempting to consider the hypothetical construct of a “cognitive or brain reserve” [Stern,2009] for maintenance of cognitive performance in face of neurodegenerative changes due to aging and dementia. According to Stern [2009], a reserve could be also expressed by intersubject differences of regional brain volumes, and this would also apply to temporal shifts of their decline. However, the limitation of this study is that a cross‐sectional design is incapable of separating intersubject differences (e.g., birth cohorts) and true intrasubject changes as a process of aging. On the one hand, the large intersubject differences reduce the sensitivity for the detection of age‐related changes in cross‐sectional designs [Du et al., 2006] and may therefore underestimate the real effects. Certain regions with nonlinear age‐related trajectories could have been missed. On the other hand, a large sample size is known to increase the sensitivity for detection of linear and nonlinear age‐related effects. Unfortunately, for age‐related brain changes over the adult lifespan, there is still a lack of appropriate longitudinal data. Another critical issue is related to the GLM‐based detection of nonlinearities, which could be further extended to assess higher order effects of age. However, future correlational studies and behavioral paradigms may help to elucidate the potential of active cognitive and/or behavioral training for structural preservation of MTL and learning related structures.
Supporting information
Additional Supporting Information may be found in the online version of this article.
Supporting Information
Supporting Information
Acknowledgements
The authors are grateful to Dr. Daniel Mietchen for comments on the article.
REFERENCES
- Allen JS, Bruss J, Brown CK, Damasio H ( 2005): Normal neuroanatomical variation due to age: The major lobes and a parcellation of the temporal region. Neurobiol Aging 26: 1245–1260. [DOI] [PubMed] [Google Scholar]
- Amunts K, Kedo O, Kindler M, Pieperhoff P, Mohlberg H, Shah NJ, Habel U, Schneider F, Zilles K ( 2005): Cytoarchitectonic mapping of the human amygdala, hippocampal region and entorhinal cortex: Intersubject variability and probability maps. Anat Embryol 210: 343–352. [DOI] [PubMed] [Google Scholar]
- Amunts K, Malikovic A, Mohlberg H, Schormann T, Zilles K ( 2000): Brodmann's areas 17 and 18 brought into stereotaxic space‐where and how variable? Neuroimage 11: 66–84. [DOI] [PubMed] [Google Scholar]
- Ashburner J, Friston KJ ( 2000): Voxel‐based morphometry–the methods. Neuroimage 11: 805–821. [DOI] [PubMed] [Google Scholar]
- Ashburner J, Friston KJ ( 2005): Unified segmentation. Neuroimage 26: 839–851. [DOI] [PubMed] [Google Scholar]
- Baltes PB ( 2006): Lifespan Development and the Brain: The Perspective of Biocultural Co‐Constructivism. New York, NY: Cambridge University Press. [Google Scholar]
- Baumann N, Pham‐Dinh D ( 2001): Biology of oligodendrocyte and myelin in the mammalian central nervous system. Physiol Rev 81: 871–927. [DOI] [PubMed] [Google Scholar]
- Boyke J, Driemeyer J, Gaser C, Büchel C, May A ( 2008): Training‐induced brain structure changes in the elderly. J Neurosci 28: 7031–7035. [DOI] [PMC free article] [PubMed] [Google Scholar]
- Braddick O, Atkinson J, Wattam‐Bell J ( 2003): Normal and anomalous development of visual motion processing: Motion coherence and ‘dorsal‐stream vulnerability’. Neuropsychologia 41: 1769–1784. [DOI] [PubMed] [Google Scholar]
- Bukach CM, Gauthier I, Tarr MJ ( 2006): Beyond faces and modularity: The power of an expertise framework. Trends Cogn Sci 10: 159–166. [DOI] [PubMed] [Google Scholar]
- Burke SN, Barnes CA ( 2006): Neural plasticity in the ageing brain. Nat Rev Neurosci 7: 30–40. [DOI] [PubMed] [Google Scholar]
- Chen J, Myerson J, Hale S ( 2002): Age‐related dedifferentiation of visuospatial abilities. Neuropsychologia 40: 2050–2056. [DOI] [PubMed] [Google Scholar]
- Cherubini A, Péran P, Caltagirone C, Sabatini U, Spalletta G ( 2009): Aging of subcortical nuclei: Microstructural, mineralization and atrophy modifications measured in vivo using MRI. Neuroimage 48: 29–36. [DOI] [PubMed] [Google Scholar]
- Cuadra MB, Cammoun L, Butz T, Cuisenaire O, Thiran JP ( 2005): Comparison and validation of tissue modelization and statistical classification methods in T1‐weighted MR brain images. IEEE Trans Med Imaging 24: 1548–1565. [DOI] [PubMed] [Google Scholar]
- Dale AM, Fischl B, Sereno MI ( 1999): Cortical surface‐based analysis. I. Segmentation and surface reconstruction. Neuroimage 9: 179–194. [DOI] [PubMed] [Google Scholar]
- DeFelipe J ( 2006): Brain plasticity and mental processes: Cajal again. Nat Rev Neurosci 7: 811–817. [DOI] [PubMed] [Google Scholar]
- Dotson VM, Davatzikos C, Kraut MA, Resnick SM ( 2009): Depressive symptoms and brain volumes in older adults: A longitudinal magnetic resonance imaging study. J Psychiatry Neurosci 34: 367–375. [PMC free article] [PubMed] [Google Scholar]
- Draganski B, Gaser C, Kempermann G, Kuhn HG, Winkler J, Büchel C, May A ( 2006): Temporal and spatial dynamics of brain structure changes during extensive learning. J Neurosci 26: 6314–6317. [DOI] [PMC free article] [PubMed] [Google Scholar]
- Driscoll I, Davatzikos C, An Y, Wu X, Shen D, Kraut M, Resnick SM ( 2009): Longitudinal pattern of regional brain volume change differentiates normal aging from MCI. Neurology 72: 1906–1913. [DOI] [PMC free article] [PubMed] [Google Scholar]
- Eickhoff S, Walters NB, Schleicher A, Kril J, Egan GF, Zilles K, Watson JD, Amunts K ( 2005): High‐resolution MRI reflects myeloarchitecture and cytoarchitecture of human cerebral cortex. Hum Brain Mapp 24: 206–215. [DOI] [PMC free article] [PubMed] [Google Scholar]
- Eickhoff SB, Heim S, Zilles K, Amunts K ( 2006a) Testing anatomically specified hypotheses in functional imaging using cytoarchitectonic maps. Neuroimage 32: 570–582. [DOI] [PubMed] [Google Scholar]
- Eickhoff SB, Paus T, Caspers S, Grosbras MH, Evans AC, Zilles K, Amunts K ( 2007): Assignment of functional activations to probabilistic cytoarchitectonic areas revisited. Neuroimage 36: 511–521. [DOI] [PubMed] [Google Scholar]
- Eickhoff SB, Schleicher A, Zilles K, Amunts K ( 2006b) The human parietal operculum. I. Cytoarchitectonic mapping of subdivisions. Cereb Cortex 16: 254–267. [DOI] [PubMed] [Google Scholar]
- Fischl B, Sereno MI, Dale AM ( 1999): Cortical surface‐based analysis. II: Inflation, flattening, and a surface‐based coordinate system. Neuroimage 9: 195–207. [DOI] [PubMed] [Google Scholar]
- Fjell AM, Walhovd KB, Fennema‐Notestine C, McEvoy LK, Hagler DJ, Holland D, Brewer JB, Dale AM ( 2009a) One‐year brain atrophy evident in healthy aging. J Neurosci 29: 15223–15231. [DOI] [PMC free article] [PubMed] [Google Scholar]
- Fjell AM, Walhovd KB, Westlye LT, Ostby Y, Tamnes CK, Jernigan TL, Gamst A, Dale AM ( 2010): When does brain aging accelerate? Dangers of quadratic fits in cross‐sectional studies. Neuroimage 50: 1376–1383. [DOI] [PubMed] [Google Scholar]
- Fjell AM, Westlye LT, Amlien I, Espeseth T, Reinvang I, Raz N, Agartz I, Salat DH, Greve DN, Fischl B, Dale AM. ( 2009b): High consistency of regional cortical thinning in aging across multiple samples. Cereb Cortex 19: 2001–2012. [DOI] [PMC free article] [PubMed] [Google Scholar]
- Fjell AM, Westlye LT, Amlien I, Espeseth T, Reinvang I, Raz N, Agartz I, Salat DH, Greve DN, Fischl B, Walhovd KB. ( 2009c) Minute effects of sex on the aging brain: A multisample magnetic resonance imaging study of healthy aging and Alzheimer's disease. J Neurosci 29: 8774–8783. [DOI] [PMC free article] [PubMed] [Google Scholar]
- Flood DG ( 1991): Region‐specific stability of dendritic extent in normal human aging and regression in Alzheimer's disease. II. Subiculum. Brain Res 540: 83–95. [DOI] [PubMed] [Google Scholar]
- Flood DG, Buell SJ, Defiore CH, Horwitz GJ, Coleman PD ( 1985): Age‐related dendritic growth in dentate gyrus of human brain is followed by regression in the ‘oldest old’. Brain Res 345: 366–368. [DOI] [PubMed] [Google Scholar]
- Flood DG, Buell SJ, Horwitz GJ, Coleman PD ( 1987a) Dendritic extent in human dentate gyrus granule cells in normal aging and senile dementia. Brain Res 402: 205–216. [DOI] [PubMed] [Google Scholar]
- Flood DG, Guarnaccia M, Coleman PD ( 1987b) Dendritic extent in human CA2–3 hippocampal pyramidal neurons in normal aging and senile dementia. Brain Res 409: 88–96. [DOI] [PubMed] [Google Scholar]
- Geyer S, Schleicher A, Zilles K ( 1999): Areas 3a, 3b, and 1 of human primary somatosensory cortex. Neuroimage 10: 63–83. [DOI] [PubMed] [Google Scholar]
- Giorgio A, Santelli L, Tomassini V, Bosnell R, Smith S, De Stefano N, Johansen‐Berg H ( 2010): Age‐related changes in grey and white matter structure throughout adulthood. Neuroimage 51: 943–951. [DOI] [PMC free article] [PubMed] [Google Scholar]
- Golarai G, Liberman A, Yoon JM, Grill‐Spector K ( 2010): Differential development of the ventral visual cortex extends through adolescence. Front Hum Neurosci 3: 80. [DOI] [PMC free article] [PubMed] [Google Scholar]
- Good CD, Johnsrude IS, Ashburner J, Henson RN, Friston KJ, Frackowiak RS ( 2001): A voxel‐based morphometric study of ageing in 465 normal adult human brains. Neuroimage 14: 21–36. [DOI] [PubMed] [Google Scholar]
- Grady CL, Haxby JV, Horwitz B, Schapiro MB, Rapoport SI, Ungerleider LG, Mishkin M, Carson RE, Herscovitch P ( 1992): Dissociation of object and spatial vision in human extrastriate cortex—Age‐related‐changes in activation of regional cerebral blood‐flow measured with [O‐15]water and positron emission tomography. J Cogn Neurosci 4: 23–34. [DOI] [PubMed] [Google Scholar]
- Grady CL, Maisog JM, Horwitz B, Ungerleider LG, Mentis MJ, Salerno JA, Pietrini P, Wagner E, Haxby JV ( 1994): Age‐related changes in cortical blood flow activation during visual processing of faces and location. J Neurosci 14: 1450–1462. [DOI] [PMC free article] [PubMed] [Google Scholar]
- Grieve SM, Clark CR, Williams LM, Peduto AJ, Gordon E ( 2005): Preservation of limbic and paralimbic structures in aging. Hum Brain Mapp 25: 391–401. [DOI] [PMC free article] [PubMed] [Google Scholar]
- Grill‐Spector K, Golarai G, Gabrieli J ( 2008): Developmental neuroimaging of the human ventral visual cortex. Trends Cogn Sci 12: 152–162. [DOI] [PMC free article] [PubMed] [Google Scholar]
- Gunn A, Cory E, Atkinson J, Braddick O, Wattam‐Bell J, Guzzetta A, Cioni G ( 2002): Dorsal and ventral stream sensitivity in normal development and hemiplegia. Neuroreport 13: 843–847. [DOI] [PubMed] [Google Scholar]
- Hasan KM, Sankar A, Halphen C, Kramer LA, Brandt ME, Juranek J, Cirino PT, Fletcher JM, Papanicolaou AC, Ewing‐Cobbs L ( 2007): Development and organization of the human brain tissue compartments across the lifespan using diffusion tensor imaging. Neuroreport 18: 1735–1739. [DOI] [PubMed] [Google Scholar]
- Hof PR, Morrison JH ( 2004): The aging brain: Morphomolecular senescence of cortical circuits. Trends Neurosci 27: 607–613. [DOI] [PubMed] [Google Scholar]
- Jernigan T, Gamst A ( 2005): Changes in volume with age—Consistency and interpretation of observed effects. Neurobiol Aging 26: 1271–1274. [DOI] [PubMed] [Google Scholar]
- Kennedy KM, Erickson KI, Rodrigue KM, Voss MW, Colcombe SJ, Kramer AF, Acker JD, Raz N ( 2009): Age‐related differences in regional brain volumes: A comparison of optimized voxel‐based morphometry to manual volumetry. Neurobiol Aging 30: 1657–1676. [DOI] [PMC free article] [PubMed] [Google Scholar]
- Klempin F, Kempermann G ( 2007): Adult hippocampal neurogenesis and aging. Eur Arch Psychiatry Clin Neurosci 257: 271–280. [DOI] [PubMed] [Google Scholar]
- Kriegeskorte N, Simmons WK, Bellgowan PS, Baker CI ( 2009): Circular analysis in systems neuroscience: The dangers of double dipping. Nat Neurosci 12: 535–540. [DOI] [PMC free article] [PubMed] [Google Scholar]
- La Joie R, Fouquet M, Mezenge F, Landeau B, Villain N, Mevel K, Pelerin A, Eustache F, Desgranges B, Chetelat G ( 2010): Differential effect of age on hippocampal subfields assessed using a new high‐resolution 3T MR sequence. Neuroimage 53: 506–514. [DOI] [PubMed] [Google Scholar]
- Lupien SJ, Evans A, Lord C, Miles J, Pruessner M, Pike B, Pruessner JC ( 2007): Hippocampal volume is as variable in young as in older adults: Implications for the notion of hippocampal atrophy in humans. Neuroimage 34: 479–485. [DOI] [PubMed] [Google Scholar]
- Maldjian JA, Laurienti PJ, Kraft RA, Burdette JH ( 2003): An automated method for neuroanatomic and cytoarchitectonic atlas‐based interrogation of fMRI data sets. Neuroimage 19: 1233–1239. [DOI] [PubMed] [Google Scholar]
- Malikovic A, Amunts K, Schleicher A, Mohlberg H, Eickhoff SB, Wilms M, Palomero‐Gallagher N, Armstrong E, Zilles K ( 2007): Cytoarchitectonic analysis of the human extrastriate cortex in the region of V5/MT+: A probabilistic, stereotaxic map of area hOc5. Cereb Cortex 17: 562–574. [DOI] [PubMed] [Google Scholar]
- Marcus DS, Fotenos AF, Csernansky JG, Morris JC, Buckner RL ( 2010): Open access series of imaging studies: Longitudinal MRI data in nondemented and demented older adults. J Cogn Neurosci 22: 2677–2684. [DOI] [PMC free article] [PubMed] [Google Scholar]
- Mendes M, Silva F, Simoes L, Jorge M, Saraiva J, Castelo‐Branco M ( 2005): Visual magnocellular and structure from motion perceptual deficits in a neurodevelopmental model of dorsal stream function. Brain Res Cogn Brain Res 25: 788–798. [DOI] [PubMed] [Google Scholar]
- Mora F, Segovia G, del Arco A ( 2007): Aging, plasticity and environmental enrichment: Structural changes and neurotransmitter dynamics in several areas of the brain. Brain Res Rev 55: 78–88. [DOI] [PubMed] [Google Scholar]
- Morosan P, Rademacher J, Schleicher A, Amunts K, Schormann T, Zilles K ( 2001): Human primary auditory cortex: Cytoarchitectonic subdivisions and mapping into a spatial reference system. Neuroimage 13: 684–701. [DOI] [PubMed] [Google Scholar]
- Ostby Y, Tamnes CK, Fjell AM, Westlye LT, Due‐Tonnessen P, Walhovd KB ( 2009): Heterogeneity in subcortical brain development: A structural magnetic resonance imaging study of brain maturation from 8 to 30 years. J Neurosci 29: 11772–11782. [DOI] [PMC free article] [PubMed] [Google Scholar]
- Park DC, Polk TA, Park R, Minear M, Savage A, Smith MR ( 2004): Aging reduces neural specialization in ventral visual cortex. Proc Natl Acad Sci USA 101: 13091–13095. [DOI] [PMC free article] [PubMed] [Google Scholar]
- Pereira AC, Huddleston DE, Brickman AM, Sosunov AA, Hen R, McKhann GM, Sloan R, Gage FH, Brown TR, Small SA ( 2007): An in vivo correlate of exercise‐induced neurogenesis in the adult dentate gyrus. Proc Natl Acad Sci USA 104: 5638–5643. [DOI] [PMC free article] [PubMed] [Google Scholar]
- Peters A, Morrison JH, Rosene DL, Hyman BT ( 1998): Feature article: Are neurons lost from the primate cerebral cortex during normal aging? Cereb Cortex 8: 295–300. [DOI] [PubMed] [Google Scholar]
- Rajapakse JC, Giedd JN, Rapoport JL ( 1997): Statistical approach to segmentation of single‐channel cerebral MR images. IEEE Trans Med Imaging 16: 176–186. [DOI] [PubMed] [Google Scholar]
- Raz N, Ghisletta P, Rodrigue KM, Kennedy KM, Lindenberger U ( 2010): Trajectories of brain aging in middle‐aged and older adults: Regional and individual differences. Neuroimage 51: 501–511. [DOI] [PMC free article] [PubMed] [Google Scholar]
- Raz N, Gunning‐Dixon F, Head D, Rodrigue KM, Williamson A, Acker JD ( 2004a) Aging, sexual dimorphism, and hemispheric asymmetry of the cerebral cortex: Replicability of regional differences in volume. Neurobiol Aging 25: 377–396. [DOI] [PubMed] [Google Scholar]
- Raz N, Lindenberger U, Rodrigue KM, Kennedy KM, Head D, Williamson A, Dahle C, Gerstorf D, Acker JD ( 2005): Regional brain changes in aging healthy adults: General trends, individual differences and modifiers. Cereb Cortex 15: 1676–1689. [DOI] [PubMed] [Google Scholar]
- Raz N, Rodrigue KM ( 2006): Differential aging of the brain: Patterns, cognitive correlates and modifiers. Neurosci Biobehav Rev 30: 730–748. [DOI] [PMC free article] [PubMed] [Google Scholar]
- Raz N, Rodrigue KM, Head D, Kennedy KM, Acker JD ( 2004b) Differential aging of the medial temporal lobe: A study of a five‐year change. Neurology 62: 433–438. [DOI] [PubMed] [Google Scholar]
- Resnick SM, Pham DL, Kraut MA, Zonderman AB, Davatzikos C ( 2003): Longitudinal magnetic resonance imaging studies of older adults: A shrinking brain. J Neurosci 23: 3295–3301. [DOI] [PMC free article] [PubMed] [Google Scholar]
- Rottschy C, Eickhoff SB, Schleicher A, Mohlberg H, Kujovic M, Zilles K, Amunts K ( 2007): Ventral visual cortex in humans: Cytoarchitectonic mapping of two extrastriate areas. Hum Brain Mapp 28: 1045–1059. [DOI] [PMC free article] [PubMed] [Google Scholar]
- Salat DH, Buckner RL, Snyder AZ, Greve DN, Desikan RSR, Busa E, Morris JC, Dale AM, Fischl B ( 2004): Thinning of the cerebral cortex in aging. Cereb Cortex 14: 721–730. [DOI] [PubMed] [Google Scholar]
- Scahill RI, Frost C, Jenkins R, Whitwell JL, Rossor MN, Fox NC ( 2003): A longitudinal study of brain volume changes in normal aging using serial registered magnetic resonance imaging. Arch Neurol 60: 989–994. [DOI] [PubMed] [Google Scholar]
- Scheperjans F, Eickhoff SB, Hömke L, Mohlberg H, Hermann K, Amunts K, Zilles K ( 2008): Probabilistic maps, morphometry, and variability of cytoarchitectonic areas in the human superior parietal cortex. Cereb Cortex 18: 2141–2157. [DOI] [PMC free article] [PubMed] [Google Scholar]
- Simić G, Kostović I, Winblad B, Bogdanović N ( 1997): Volume and number of neurons of the human hippocampal formation in normal aging and Alzheimer's disease. J Comp Neurol 379: 482–494. [DOI] [PubMed] [Google Scholar]
- Smith CD, Chebrolu H, Wekstein DR, Schmitt FA, Markesbery WR ( 2007): Age and gender effects on human brain anatomy: A voxel‐based morphometric study in healthy elderly. Neurobiol Aging 28: 1075–1087. [DOI] [PubMed] [Google Scholar]
- Sowell ER, Peterson BS, Kan E, Woods RP, Yoshii J, Bansal R, Xu D, Zhu H, Thompson PM, Toga AW ( 2007): Sex differences in cortical thickness mapped in 176 healthy individuals between 7 and 87 years of age. Cereb Cortex 17: 1550–1560. [DOI] [PMC free article] [PubMed] [Google Scholar]
- Sowell ER, Thompson PM, Toga AW ( 2004): Mapping changes in the human cortex throughout the span of life. Neuroscientist 10: 372–392. [DOI] [PubMed] [Google Scholar]
- Squire LR ( 2004): Memory systems of the brain: A brief history and current perspective. Neurobiol Learn Mem 82: 171–177. [DOI] [PubMed] [Google Scholar]
- Squire LR ( 2009): Memory and brain systems: 1969–2009. J Neurosci 29: 12711–12716. [DOI] [PMC free article] [PubMed] [Google Scholar]
- Stern Y ( 2009): Cognitive reserve. Neuropsychologia 47: 2015–2028. [DOI] [PMC free article] [PubMed] [Google Scholar]
- Sullivan EV, Marsh L, Mathalon DH, Lim KO, Pfefferbaum A ( 1995): Age‐related decline in MRI volumes of temporal lobe gray matter but not hippocampus. Neurobiol Aging 16: 591–606. [DOI] [PubMed] [Google Scholar]
- Sullivan EV, Marsh L, Pfefferbaum A ( 2005): Preservation of hippocampal volume throughout adulthood in healthy men and women. Neurobiol Aging 26: 1093–1098. [DOI] [PubMed] [Google Scholar]
- Sullivan EV, Rosenbloom M, Serventi KL, Pfefferbaum A ( 2004): Effects of age and sex on volumes of the thalamus, pons, and cortex. Neurobiol Aging 25: 185–192. [DOI] [PubMed] [Google Scholar]
- Tarr MJ, Gauthier I ( 2000): FFA: A flexible fusiform area for subordinate‐level visual processing automatized by expertise. Nat Neurosci 3: 764–769. [DOI] [PubMed] [Google Scholar]
- Thambisetty M, Wan J, Carass A, An Y, Prince JL, Resnick SM ( 2010): Longitudinal changes in cortical thickness associated with normal aging. Neuroimage 52: 1215–1223. [DOI] [PMC free article] [PubMed] [Google Scholar]
- Tohka J, Zijdenbos A, Evans A ( 2004): Fast and robust parameter estimation for statistical partial volume models in brain MRI. Neuroimage 23: 84–97. [DOI] [PubMed] [Google Scholar]
- Wahba G ( 1990): Spline Models for Observational Data. Philadelphia, PA: Society for Industrial and Applied Mathematics; xii, pp 169. [Google Scholar]
- Walhovd KB, Fjell AM, Reinvang I, Lundervold A, Dale AM, Eilertsen DE, Quinn BT, Salat D, Makris N, Fischl B ( 2005a) Effects of age on volumes of cortex, white matter and subcortical structures. Neurobiol Aging 26: 1261–1270. [DOI] [PubMed] [Google Scholar]
- Walhovd KB, Fjell AM, Reinvang I, Lundervold A, Dale AM, Quinn BT, Salat D, Makris N, Fischl B ( 2005b) Neuroanatomical aging: Universal but not uniform. Neurobiol Aging 26: 1279–1282. [DOI] [PubMed] [Google Scholar]
- Walhovd KB, Westlye LT, Amlien I, Espeseth T, Reinvang I, Raz N, Agartz I, Salat DH, Greve DN, Fischl B, et al. ( 2011): Consistent neuroanatomical age‐related volume differences across multiple samples. Neurobiol Aging 32: 916–932. [DOI] [PMC free article] [PubMed] [Google Scholar]
- West MJ, Coleman PD, Flood DG, Troncoso JC ( 1994): Differences in the pattern of hippocampal neuronal loss in normal ageing and Alzheimer's disease. Lancet 344: 769–772. [DOI] [PubMed] [Google Scholar]
- Westlye LT, Walhovd KB, Dale AM, Bjornerud A, Due‐Tonnessen P, Engvig A, Grydeland H, Tamnes CK, Ostby Y, Fjell AM ( 2010): Differentiating maturational and aging‐related changes of the cerebral cortex by use of thickness and signal intensity. Neuroimage 52: 172–185. [DOI] [PubMed] [Google Scholar]
- Wilke M, Holland SK, Altaye M, Gaser C ( 2008): Template‐O‐Matic: A toolbox for creating customized pediatric templates. Neuroimage 41: 903–913. [DOI] [PubMed] [Google Scholar]
Associated Data
This section collects any data citations, data availability statements, or supplementary materials included in this article.
Supplementary Materials
Additional Supporting Information may be found in the online version of this article.
Supporting Information
Supporting Information