

Abstract
In this study, we examined linear and curvilinear correlations of fractional anisotropy (FA), mean diffusivity (MD), and white matter volume with age by using brain structural and diffusion‐tensor magnetic resonance imaging (MRI) in a large number of healthy children and voxel‐based morphometry (VBM) and region‐of‐interest (ROI) analyses. We collected data by brain structural MRI in 246 healthy children, aged 5–18 years. FA and MD images were normalized using the normalization parameter of the corresponding structural MRI. Next, we analyzed the correlations between FA and age and between MD and age by estimating linear and logarithmic functions. We also analyzed the correlation between white matter volume and age by linear, quadratic, and cubic functions. Correlations between FA and age and between MD and age showed exponential trajectories in most ROIs in boys and girls, except for several fibers, such as the corpus callosum connecting the bilateral rectal gyri in boys. The correlation between white matter volume and age showed significant positive linear trajectories in most ROIs in boys and girls, except for a few fibers, such as the bilateral uncinate fasciculus. Additionally, maturational rates differed among major fibers, and in girls, the left superior longitudinal fasciculus, which connects the frontal and temporal lobes, showed a slower rate of maturation than other fibers. Our results may help to clarify the mechanisms of normal brain maturation from the viewpoint of brain white matter. Hum Brain Mapp, 2013. © 2012 Wiley Periodicals, Inc.
Keywords: development, cross‐sectional study, magnetic resonance imaging, diffusion‐tensor imaging, fractional anisotropy, mean diffusivity, voxel‐based analysis
INTRODUCTION
Recent neuroimaging studies have revealed that human brain development continues throughout childhood and adolescence and is structurally and functionally a non‐linear process [Giedd et al., 1999; Gogtay et al., 2004; Johnson, 2001; Lenroot et al., 2007; Thatcher, 1992]. White matter volume also shows a curvilinear trajectory, with a stable preadolescent volume followed by a slight postadolescent increase [Giedd et al., 1999; Lebel et al., 2008; Paus et al., 2001; Sowell et al., 2002; Tamnes et al., 2010]. This phenomenon is thought to result from a corresponding increase and decrease in the number of synapses per neuron and intracortical myelination in brain maturation [Huttenlocher, 1979; Huttenlocher et al., 1982, 1997; Paus, 2005]. Thus, revealing the trajectory of white matter volume with age may help to improve our understanding of the progress of brain maturation in each gray matter region. Revealing the normal trajectory of brain white matter volume with age in whole white matter regions is also important because several disorders, such as autistic spectrum disorders, show different trajectories in the correlation between white matter volume and age compared with that in age‐matched healthy children [Ben Bashat et al., 2007; Courchesne et al., 2001].
In addition to the correlation between white matter volume and age in healthy children, recent studies have focused on the microstructure of white matter by using diffusion‐tensor imaging (DTI). DTI indirectly provides in vivo information about tissue microstructures by using the random diffusion of water molecules in the brain [Le Bihan, 2003]. Using DTI, we can acquire information regarding fractional anisotropy (FA) and mean diffusivity (MD). The FA index is a commonly used intravoxel metric that characterizes the degree of diffusion directionality [Pierpaoli et al., 1996]. FA is sensitive to several neurobiological features, such as axonal diameter, axonal density, and the degree of myelination [Beaulieu, 2002; Mori et al., 2006; Wozniak et al., 2006], and is a measure of the directionality of diffusion, with values ranging from 0 (isotropic diffusion) to 1 (totally anisotropic diffusion). On the other hand, MD is a measure of the average magnitude of water diffusion. Recent studies analyzing the trajectories of FA and MD with age in children showed that FA increases with age and MD decreases with age from childhood to young adulthood, with a linear relationship [Barnea‐Goraly et al., 2005; Bonekamp et al., 2007; Muetzel et al., 2008; Mukherjee et al., 2002; Schmithorst et al., 2002]. However, the trajectories of FA and MD with age have been shown to be curvilinear such that FA initially increases rapidly with age, and then the rate of increase slows, finally reaching a plateau. In contrast, MD initially decreases rapidly with age, and then the rate of decrease slows, finally reaching a stable value. Thus, several studies have estimated these correlations by curvilinear fittings, such as using exponential fitting in ROI analysis [Ben Bashat et al., 2005; Lebel et al., 2008; Schneider et al., 2004; Tamnes et al., 2010; Zhang et al., 2005].
Although many studies have focused on the correlations of FA and MD with age in healthy children by fitting linear and curvilinear correlations such as exponential fittings, to our knowledge, no reported study has analyzed the linear and curvilinear correlations of FA and MD with age using both ROI analyses and voxel‐based analyses in whole white matter regions. Voxel‐based analysis has the advantage of revealing brain maturation in whole brain regions without setting any a priori ROI. On the other hand, ROI analysis has the advantage that we can focus on the developmental changes of specific white matter fibers. Thus, it is thought that both VBA and ROI analyses are valuable in revealing the normal trajectory of brain maturation from the viewpoint of white matter. In fact, revealing correlations between measures of white matter microstructure and age in healthy children is important because the FA value is associated with several cognitive functions, such as reading skills [Klingberg et al., 1999] and working memory [Takeuchi et al., 2010]. Additionally, subjects with autism show lower FA in several regions such as the superior temporal sulcus and the fusiform gyrus [Barnea‐Goraly et al., 2005]. Thus, revealing the normal trajectory of the correlation between FA and MD with age in the whole white matter may help in clarifying the differences in brain maturation between healthy children and children with autism.
The purpose of the present study was to examine linear and curvilinear correlations of FA, MD, and white matter volume with age using brain structural and diffusion‐tensor magnetic resonance imaging (MRI) in a large number of healthy children using voxel‐based analysis (VBA) and region‐of‐interest (ROI) analysis. In VBA, we used voxel‐based morphometry [Ashburner et al., 2000], an established automated neuroimaging technique that enables the global analysis of brain structure without a priori identification of a ROI in MRI preprocessing. In the ROI analysis, we used 30 ROIs from a probabilistic fiber atlas that covered major projection, commissural and long association fibers. We used linear and exponential functions to examine the correlations between FA and age and between MD and age because recent studies have shown that these correlations are largely explained by exponential fittings [Lebel et al., 2008; Mukherjee et al., 2001; Schneider et al., 2004; Tamnes et al., 2010]. To examine the correlation between white matter volume and age, we applied linear, quadratic, and cubic polynomial functions.
MATERIALS AND METHODS
Subjects
All subjects were healthy Japanese children, and details of their recruitment have been reported elsewhere [Taki et al., 2010]. Briefly, we collected brain MR images from 290 subjects (145 boys, 145 girls; age range, 5.6–18.4 years) who had no history of malignant tumors, head trauma with loss of consciousness lasting over 5 min, developmental disorder, epilepsy, psychiatric disease, or claustrophobia. In the advertisement used in subject recruitment, we announced that only right‐handed children could participate, and we also confirmed that all subjects were right handed using the Edinburgh Handedness Inventory [Oldfield, 1971]. We included subjects whose full‐scale intelligence quotient (IQ) was more than 70, and the criteria were derived from a recent study on normal brain development [Evans et al., 2006]. To assess IQ, trained examiners administered the Japanese version of the Wechsler Adult Intelligence Scale (WAIS), third edition [Fujita et al., 2006] to subjects who were at least 16 years of age; for subjects younger than 16 years, we used the Japanese version of the Wechsler Intelligence Scale for Children (WISC), third edition [Azuma et al., 1998]. We calculated the full‐scale IQ from the score on the WAIS/WISC for each subject, and all subjects showed a full‐scale IQ >70 (the mean, SD, and range of the full‐scale IQ of all the subjects was 102.6, 12.3, and 71–137, respectively). We did not perform diffusion‐tensor imaging (DTI) of 44 subjects due to tiredness of the subjects. Thus, the final sample consisted of 246 participants (119 boys and 127 girls). The ages of the subjects ranged from 5.7 to 18.4 years.
Before MRI, written informed consent was obtained from each subject and his/her parent after they had received a full explanation of the purpose and procedures of the study, according to the Declaration of Helsinki [1991]. Approval for these experiments was obtained from the institutional review board of Tohoku University.
Image Acquisition
All images were collected using a 3‐T Philips Intera Achieva scanner. Three‐dimensional, high‐resolution, T1‐weighted structural images were collected using a magnetization prepared rapid gradient echo (MPRAGE) sequence. The parameters were as follows: 240 × 240 matrix, TR = 6.5 ms, TE = 3 ms, TI = 711 ms, FOV = 24 cm, 162 slices, 1.0‐mm slice thickness, scan duration 8 min 3 s. Additionally, diffusion‐weighted data were collected using a spin‐echo EPI sequence [TR = 10,293 ms, TE = 55 ms, big delta (Δ) = 26.3 ms, little delta (δ) = 12.2 ms, FOV = 22.4 cm, 2 × 2 × 2‐mm3 voxels, slice thickness = 2 mm, 60 slices, SENSE reduction factor = 2, number of acquisitions = 1]. The diffusion weighting was isotropically distributed along 32 directions (b value = 1,000 s/mm2). Additionally, a single image with no diffusion weighting (b value = 0 s/mm2; b0 image) was acquired. The total scan time was 7 min 17 s.
Image Analysis of Structural MRI
A schematic of the image analysis is shown in Supporting Information Figure S1. After image acquisition by MRI, all T1‐weighted MR images were analyzed using Statistical Parametric Mapping 2 (SPM2; Wellcome Department of Cognitive Neurology, London, UK; [Friston et al., 1995]) in MATLAB (Math Works, Natick, MA) and part of the MATLAB program “cg_vbm_optimized” (http://dbm.neuro.uni-jena.de/vbm.html). First, the T1‐weighted MR images in native space were transformed into stereotactic space [Talairach and Tournoux, 1988] by registering each of the images to a custom template image that was derived from all subjects in this study using VBM tools for SPM2 (http://dbm.neuro.uni-jena.de/vbm/). Tissue segmentation from the transformed images to the gray matter, white matter, cerebrospinal fluid (CSF) space, and non‐brain was then performed using the SPM2 default segmentation procedure. Additionally, we obtained gray matter and white matter segment images in native space by applying a reverse transformation to the linearly spatially normalized gray matter and white matter segment images. Next, the linearly normalized and segmented gray matter images were non‐linearly normalized to the custom template using 7 × 8 × 7 nonlinear basis functions in three orthogonal directions. These normalization parameters were reapplied to the T1‐weighted whole‐brain structural images of each subject to perform optimal spatial normalization. The optimally normalized T1‐weighted images were segmented into gray matter, white matter, and CSF space. We used normalized white matter segment images in the subsequent image analysis. Additionally, these normalized white matter segment images were smoothed by convolving an isotropic Gaussian kernel (8 mm FWHM) for the statistical analysis of VBA for the regional white matter volume. This smoothing step was used to remove individual variations in anatomy and to render the data more normally distributed by the central limit theorem.
Image Analysis of DTI
After image acquisition in DTI, FA map images and MD map images were calculated from DTI using the software that was pre‐installed on the Philips MR console. All FA and MD map images were also analyzed using SPM2 [Friston et al., 1995] in MATLAB. First, FA map images were coregistered to corresponding white matter segments in native space for each subject. Next, the coregistration parameter was applied to the corresponding MD map images. We coregistered the FA map images to the corresponding white matter segment images because the spatial signal distributions of the images were similar to each other; no obvious coregistration error was found in the method by checking all images of the subjects using the Checkreg function of SPM2. Then, using the corresponding normalization parameter derived from the normalization process of structural MR images, both corresponding FA and MD map images were non‐linearly normalized. Next, a white matter binary mask image consisting of a voxel value that was higher than an empirically determined value of 0.2 in the white matter image was applied to the FA and MD map images to focus the statistical analysis on the white matter. Finally, these masked FA and MD map images were smoothed by convoluting an isotropic Gaussian kernel (8 mm FWHM).
Statistical Analysis of VBA for the Regional White Matter Volume
For the VBA analysis of the white matter volume, to analyze the linear and curvilinear trajectories of white matter volume with age, relationships between white matter volume and age were estimated by fitting three polynomial functions of age (linear, quadratic, and cubic) to the smoothed white matter segments derived from the image analysis of structural MRI described above. We set three separate models: Age, Age2 + Age, and Age3 + Age2 + Age. In these models, an intercept term was added, and higher‐order polynomial regressors were orthogonalized to lower‐order ones to enable testing of each polynomial component individually if needed. We determined the best‐fit linear model at each voxel by selecting the one that showed the smallest Akaike information criterion (AIC) value [Akaike, 1974]. This widely used model‐selection method, enabled us to rank models based on their single AIC criterion value, which accounts for both the ability of a model to explain the data and the complexity of that model, such that the lowest value is associated with the better model. Additionally, to restrict the information to statistically significant areas only, we masked the results of the AIC computation by the results of an F‐test of the cubic model's three age regressors, thresholded at a significance level of P < 0.05 for the family‐wise error rate. Examples of the developmental trajectory for each function are shown in Figure 1.
Figure 1.
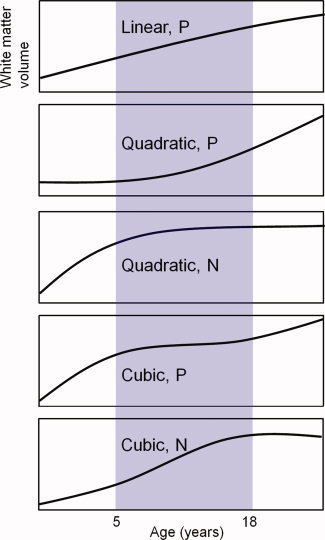
Examples of the developmental trajectory in each function. N indicates a negative correlation, and P indicates a positive correlation.
Statistical Analysis of VBA for the FA and MD
The relation between FA or MD and age was estimated by fitting the following two different models in the data at each voxel of the brain. The linear fitting equations were of the form FA (or MD) = b + a × age, where b is an estimated intercept of the linear fitting, and a is the slope of the linear fitting. The exponential fitting equations were of the form FA (or MD) = y 0 + A × e(−age/t), where y 0 indicates the estimated value of the asymptote, A indicates the difference between the y 0 value and the estimated value at age zero, and t is a time constant that indicates the rate of development [Lebel et al., 2008; Tamnes et al., 2010]. We performed the VBA in the regions where the significance level of the linear fitting between age and FA (or MD) was less than 0.1. Those two equations were fitted at each voxel assuming a normally distributed additive error. Practically, as that fit relies on minimizing the sum of squared errors, the normal equations provided the necessary closed form for the linear model, whereas an iterative optimization algorithm was used to fit the exponential model (using the implementation available in the C++ minpack software library, http://devernay.free.fr/hacks/cminpack/cminpack.html). To ensure that no single value alone strongly impacted the fitting outcome, a dozen overlapping subgroups of subjects were created by keeping only 75% of the total, randomly selected, over which the models were fitted. Among these fits, we selected final models using the median value of the slope parameter (or the scaling parameter in the case of the exponential model). The effect of gender was investigated by doing the whole fitting process (including the exclusion of 25%) separately in the boy and girl subgroups. Brain maps of the adjusted‐R 2 parameters were computed to assess the fit quality. However, because it has been reported that the R 2 statistic should strictly apply only to linear models [Spiess et al., 2010], we also computed the closely related AIC with correction maps to rank the linear and non‐linear models. This manual assessment of the fitting process and associated parameter maps was made possible through a convenient per‐voxel visualization tool to ensure that the described results held.
Statistical Analysis of ROIs
For the ROI analysis, we set 30 ROIs from a probabilistic fiber atlas that covered major projection, commissural, and long association fibers defined by the Center of Magnetic Resonance Microimaging at Johns Hopkins Medical Institute (http://cmrm.med.jhmi.edu/). For projection fibers, we used two ROIs: those of the bilateral corticospinal tract. For commissural fibers, we used 12 ROIs: the fibers connecting the bilateral cingulate gyri, cuneus, lingual gyri, middle frontal gyri, middle occipital gyri, postcentral gyri, precentral gyri, precuneus, rectal gyri, superior frontal gyri, superior occipital gyri, and superior parietal lobules. For long association fibers, we used 16 ROIs: the bilateral inferior occipito‐frontal fasciculus, inferior longitudinal fasciculus, three parts of the superior longitudinal fasciculus (the part that connects the frontal and parietal lobes, that between the frontal and temporal lobes, and that between the temporal and parietal lobes), the uncinate fasciculus, cingulum of the hippocampus, and the cingulate gyrus. We binarized the probabilistic fiber atlas such that if the voxel value of the mask was not zero, then the value of the voxel was set to one, and if zero, then it was set to zero. Next, we determined the mean value of FA, MD, and regional white matter volume in each ROI by calculating the average in each voxel. Then, we fitted the correlation between FA and age and that between MD and age in linear and exponential fittings using technical analysis software (ORIGIN Pro, ver. 8.5, http://www.originlab.com/). As in the voxel‐based analysis, the linear fitting equations were of the form FA (or MD) = b + a × age, where b is an estimated intercept of the linear fitting, and a is the slope of the linear fitting. Additionally, the exponential fitting equations were of the form FA (or MD) = y 0 + A × e (−age/t), where y 0 indicates the estimated value of the asymptote, A indicates the difference between the y 0 value and the estimated value at age zero, and t is a time constant that indicates the rate of development [Lebel et al., 2008; Tamnes et al., 2010]. If the exponential fitting did not converge, we applied a linear fitting for the correlation between FA (or MD) and age. For white matter volume, the relationship between white matter volume and age was estimated by fitting three polynomial functions of age (linear, quadratic, and cubic) to the white matter volume. Here again, we determined the best‐fit linear model by selecting the model that showed the lowest AIC value. The total number of ROIs was 30; thus, the significance level was set at P < 0.05/30 = 0.0017 in all statistical analyses of the ROI analysis.
We performed the statistical analyses on boys and girls separately because recent studies have shown that the trajectory of brain maturation, such as the correlation between gray and white matter volumes and age, differs between boys and girls [Giedd et al., 1999; Lenroot et al., 2007].
RESULTS
VBA of Correlations Between White Matter Volume and Age
The white matter regions that showed significant correlations with age, age2, or age3 using the F‐test of the cubic model in boys are shown in Supporting Information Table S1, and those in girls are shown in Supporting Information Table S2. The results for the correlation between white matter volume and age in boys fitted by linear, quadratic, or cubic polynomial functions determined by AIC are shown in Figure 2, and those for girls are shown in Figure 3. Overall, the correlation between white matter volume and age showed an increasing trajectory. In boys, significant linear correlations were found between age and regional white matter volume in the bilateral corticospinal tract of the pons, midbrain, and at the level of the centrum semiovale. Additionally, significant quadratic or cubic correlations were found between age and white matter volume in several regions, such as the precentral gyrus, pons, and cerebellum in boys. In girls, significant linear correlations were found between age and regional white matter volume in the bilateral corticospinal tract of the midbrain and the medial aspect of the cerebellum. Additionally, significant quadratic or cubic correlations were found between age and white matter volume in several regions, such as the pons and midbrain in girls.
Figure 2.
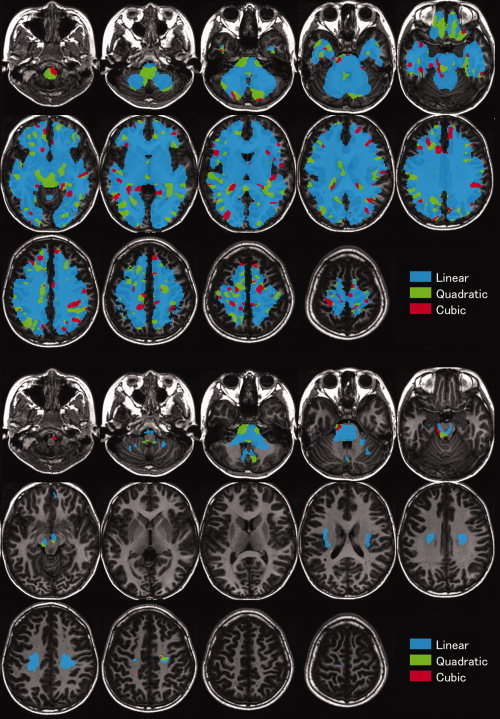
Correlations between white matter volume and age in white matter regions in boys fitted by linear, quadratic, or cubic polynomial functions, determined by the Akaike information criterion (AIC). Above, the results are superimposed on the axial view of the brain; below, the results are masked by the results of the AIC computation, by the results of an F‐test of the cubic model's three age regressors, thresholded at a significance level of P < 0.05 for the family‐wise error rate. The left part of the figure is the left part of the brain. The blue color indicates the voxels regressed by the linear function, green indicates the voxels regressed by the quadratic function, and red indicates the voxels regressed by the cubic function.
Figure 3.
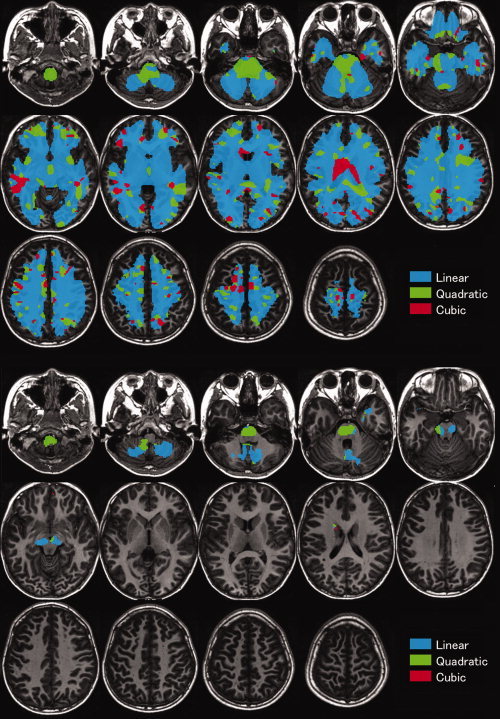
Correlations between white matter volume and age in white matter regions in girls fitted by linear, quadratic, or cubic polynomial functions, determined by AIC. Details are the same as in Figure 2.
VBA of the Correlations of FA and MD with Age
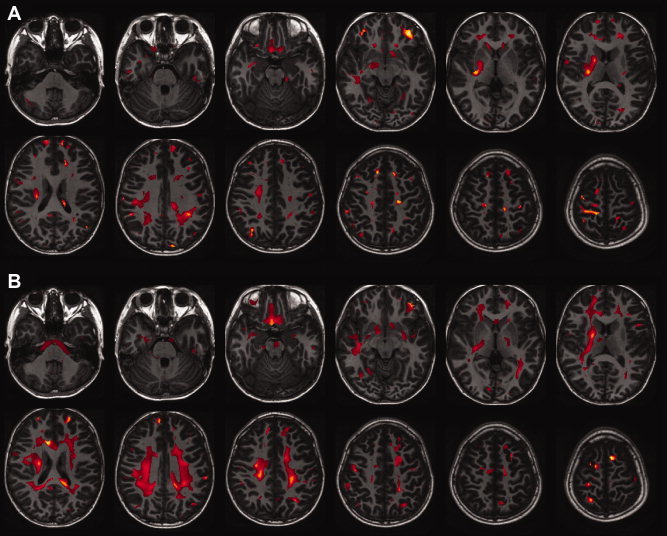
The results for the correlation of FA with age in boys and girls fitted by linear or exponential fittings are shown in Figure 4A,B, respectively, and the correlations between MD and age fitted by linear or exponential fittings are shown in Figure 5A for boys and 5B for girls. In boys, the correlation between FA and age was best fitted by an exponential function in several regions, such as the superior longitudinal fasciculus connecting the frontal and temporal lobes (arcuate fasciculus) and the corticospinal tract (Fig. 4A), and in girls, the correlation between FA and age was best fitted by an exponential function in several regions, such as the corticospinal tract and the right superior longitudinal fasciculus connecting the frontal and temporal lobes (Fig. 4B). In boys, the correlation between MD and age was best fitted by an exponential function in several regions, such as the right corticospinal tract and the right inferior occipitofrontal fasciculus (Fig. 5A), and in girls, the correlation between MD and age was best fitted by an exponential function in several regions, such as the bilateral superior longitudinal fasciculus connecting frontal, temporal, and parietal lobes (Fig. 5B).
Figure 4.
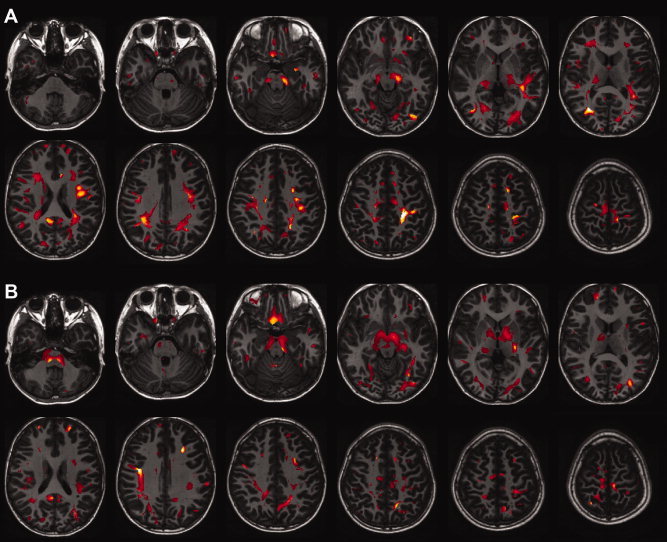
Correlations between fractional anisotropy and age for white matter regions in boys (A) and in girls (B) fitted by linear and exponential functions determined by the adjusted R 2. The results are shown as a subtraction from the adjusted R 2 of the exponential function to that of a linear function and are superimposed on the axial view of the brain. The left part of the figure is the right part of the brain.
Figure 5.
Correlations between mean diffusivity and age in white matter regions in boys (A) and in girls (B) fitted by linear and exponential functions determined by the adjusted R 2. The results are shown as a subtraction from the adjusted R 2 of the exponential function to that of a linear function and are superimposed on the axial view of the brain. The left part of the figure is the right part of the brain.
ROI Analysis of the Correlations of FA, MD, and White Matter Volume with Age
The results for the relationship between age and FA in each white matter fiber using linear fitting and exponential fitting in boys are shown in Table I, and those in girls are shown in Table II. Additionally, the results of the relationship between age and MD in each white matter fiber using linear fitting and exponential fitting in boys are shown in Table III, and those in girls are shown in Table IV. Moreover, the relationship between age and FA or MD in the two representative fibers from the commissural, association, and projection fibers that showed the highest and the second highest R 2 in each gender, respectively, are shown in Supporting Information Figures S2 (between age and FA in boys), S3 (between age and FA in boys), S4 (between age and MD in boys), and S5 (between age and MD in girls). Overall, the correlation between FA and MD and age showed an exponential trajectory in most ROIs in boys and girls. Regarding the correlation between FA and age, FA initially increased rapidly with age, and then the rate of increase slowed and finally reached a plateau, shown as y 0 in the equation, in most ROIs in both genders. However, in boys, the FA value of the corpus callosum connecting the bilateral rectal gyri showed a different trajectory with age such that the FA decreased linearly with age. The correlation between age and FA of the corpus callosum is also shown in Supporting Information Figure S2 (C) in boys, and Figure S3 (A) in girls. The corpus callosum connecting the bilateral cingulate gyri, cuneus, precentral gyrus, precuneus, and superior parietal lobules, and the bilateral corticospinal tracts showed relatively higher estimated y 0 values (y 0 > 0.5) than did other fibers in boys and girls. Additionally, the right inferior longitudinal fasciculus in both genders and the left superior longitudinal fasciculus, which connects the frontal and temporal lobes, in girls showed a relatively high estimated t‐value (t > 10), suggesting that these fibers show a slower rate of maturation than do other fibers.
Table I.
Relationship between age and FA in each white matter fiber using linear fitting and exponential fitting in boys
| Regions | Linear | Exponential | |||||
|---|---|---|---|---|---|---|---|
| b (SE) | a (SE) | Adjusted R 2 | y 0 (SE) | A (SE) | t (SE) | Adjusted R 2 | |
| CC (cingulate gyrus) | 0.460 (0.007) | 0.003 (0.001) | 0.162** | 0.513 (0.018) | −0.109 (0.074) | 6.177 (5.934) | 0.158** |
| CC (cuneus) | 0.482 (0.017) | 0.005 (0.001) | 0.078** | 0.550 (0.009) | −1.134 (1.856) | 2.218 (1.199) | 0.101** |
| CC (lingual gyrus) | 0.422 (0.014) | 0.004 (0.001) | 0.093** | 0.493 (0.022) | −0.204 (0.233) | 4.732 (4.676) | 0.096** |
| CC (middle frontal gyrus) | 0.457 (0.007) | 0.002 (0.001) | 0.045* | 0.477 (0.002) | −13.427 (34.242) | 1.008 (0.411) | 0.061** |
| CC (middle occipital gyrus) | 0.420 (0.007) | 0.004 (0.001) | 0.299** | 0.495 (0.014) | −0.176 (0.091) | 5.483 (3.152) | 0.309** |
| CC (postcentral gyrus) | 0.445 (0.008) | 0.003 (0.001) | 0.150** | 0.493 (0.004) | −0.929 (1.065) | 2.118 (0.764) | 0.203** |
| CC (precentral gyrus) | 0.475 (0.008) | 0.003 (0.001) | 0.090** | 0.510 (0.003) | −2.431 (3.189) | 1.584 (0.493) | 0.183** |
| CC (precuneus) | 0.474 (0.007) | 0.003 (0.001) | 0.165** | 0.524 (0.009) | −0.205 (0.201) | 3.813 (2.363) | 0.169** |
| CC (rectal gyrus) | 0.474 (0.008) | −0.003 (0.001) | 0.073* | No data | No data | No data | No data |
| CC (superior frontal gyrus) | 0.461 (0.007) | 0.002 (0.001) | 0.059* | 0.482 (0.002) | −8.517 (18.92) | 1.087 (0.412) | 0.078** |
| CC (superior occipital gyrus) | 0.425 (0.007) | 0.004 (0.001) | 0.290** | 0.495 (0.008) | −0.285 (0.193) | 3.810 (1.622) | 0.310** |
| CC (superior parietal lobule) | 0.459 (0.007) | 0.004 (0.001) | 0.220** | 0.519 (0.013) | −0.150 (0.100) | 5.221 (3.556) | 0.224** |
| L cingulum (cingulate gyrus) | 0.442 (0.007) | 0.003 (0.001) | 0.173** | 0.485 (0.005) | −0.294 (0.317) | 3.000 (1.498) | 0.179** |
| R cingulum (cingulate gyrus) | 0.381 (0.010) | 0.004 (0.001) | 0.160** | No data | No data | No data | No data |
| L cingulum (hippocampus) | 0.380 (0.009) | 0.003 (0.001) | 0.107** | 0.426 (0.006) | −0.343 (0.456) | 2.930 (1.754) | 0.124** |
| R cingulum (hippocampus) | 0.308 (0.015) | 0.003 (0.001) | 0.038* | 0.366 (0.049) | −0.108 (0.124) | 6.968 (14.95) | 0.033** |
| L cortico‐spinal tract | 0.492 (0.008) | 0.002 (0.001) | 0.068* | 0.521 (0.003) | −1.843 (2.858) | 1.617 (0.606) | 0.133** |
| R cortico‐spinal tract | 0.492 (0.007) | 0.002 (0.001) | 0.058* | 0.515 (0.002) | −13.873 (22.209) | 1.064 (0.285) | 0.154** |
| L IOFF | 0.387 (0.006) | 0.003 (0.001) | 0.243** | 0.442 (0.011) | −0.143 (0.092) | 5.032 (3.112) | 0.248 |
| R IOFF | 0.394 (0.006) | 0.004 (0.000) | 0.310** | No data | No data | No data | No data |
| L ILF | 0.395 (0.006) | 0.003 (0.001) | 0.211** | 0.441 (0.007) | −0.194 (0.161) | 3.769 (1.943) | 0.228** |
| R ILF | 0.382 (0.005) | 0.003 (0.000) | 0.299** | 0.477 (0.100) | −0.109 (0.071) | 17.468 (30.449) | 0.295** |
| L SLF (fronto‐parietal) | 0.395 (0.007) | 0.003 (0.001) | 0.192** | 0.442 (0.003) | −0.894 (0.919) | 2.111 (0.681) | 0.243** |
| R SLF (fronto‐parietal) | 0.363 (0.006) | 0.004 (0.001) | 0.281** | 0.440 (0.031) | −0.119 (0.030) | 8.668 (8.031) | 0.280** |
| L SLF (fronto‐temporal) | 0.399 (0.007) | 0.003 (0.001) | 0.195** | 0.443 (0.003) | −0.690 (0.693) | 2.250 (0.758) | 0.244** |
| R SLF (fronto‐temporal) | 0.399 (0.006) | 0.004 (0.001) | 0.259** | No data | No data | No data | No data |
| L SLF (temporo‐parietal) | 0.369 (0.007) | 0.003 (0.001) | 0.174** | 0.420 (0.010) | −0.176 (0.154) | 4.241 (2.730) | 0.184** |
| R SLF (temporo‐parietal) | 0.383 (0.006) | 0.003 (0.001) | 0.169** | 0.402 (0.007) | 0.001 (0.001) | −4.079 (2.379) | 0.186** |
| L uncinate fasciculus | 0.390 (0.007) | 0.002 (0.001) | 0.112** | 0.426 (0.006) | −0.213 (0.277) | 3.199 (2.082) | 0.119** |
| R uncinate fasciculus | 0.399 (0.006) | 0.001 (0.001) | 0.046* | 0.416 (0.002) | −4.608 (15.99) | 1.110 (0.668) | 0.023** |
CC (cingulate gyrus), corpus callosum connecting the bilateral cingulate gyri; IOFF, the inferior occipito‐frontal fasciculus; ILF, the inferior longitudinal fasciculus; SLF (fronto‐parietal), the superior longitudinal fasciculus, which connects between frontal and parietal lobes.
P < 0.05.
P < 0.0017. Bonferroni critical α = 0.0017. SE indicates standard error. The degrees of freedom in each model are 117 in Linear, and 116 in Exponential.
Table II.
Relationship between age and FA in each white matter fiber using linear fitting and exponential fitting in girls
| Regions | Linear | Exponential | |||||
|---|---|---|---|---|---|---|---|
| b (SE) | a (SE) | Adjusted R 2 | y 0 (SE) | A (SE) | t (SE) | Adjusted R 2 | |
| CC (cingulate gyrus) | 0.478 (0.007) | 0.002 (0.001) | 0.053* | No data | No data | No data | No data |
| CC (cuneus) | 0.496 (0.015) | 0.003 (0.001) | 0.039* | 0.537 (0.005) | −3.970 (10.15) | 1.416 (0.792) | 0.041** |
| CC (lingual gyrus) | 0.425 (0.012) | 0.004 (0.001) | 0.092** | No data | No data | No data | No data |
| CC (middle frontal gyrus) | 0.479 (0.007) | 0.000 (0.001) | −0.007 | No data | No data | No data | No data |
| CC (middle occipital gyrus) | 0.443 (0.007) | 0.002 (0.001) | 0.110** | No data | No data | No data | No data |
| CC (postcentral gyrus) | 0.474 (0.008) | 0.001 (0.001) | 0.018 | 0.493 (0.005) | −0.190 (0.453) | 2.765 (2.731) | 0.023** |
| CC (precentral gyrus) | 0.493 (0.008) | 0.001 (0.001) | 0.022 | 0.514 (0.009) | −0.075 (0.149) | 4.373 (6.323) | 0.020** |
| CC (precuneus) | 0.499 (0.008) | 0.001 (0.001) | 0.026* | 0.518 (0.003) | −0.474 (1.126) | 2.024 (1.452) | 0.033** |
| CC (rectal gyrus) | 0.480 (0.010) | −0.004 (0.001) | 0.133** | 0.418 (0.011) | 0.227 (0.200) | 4.270 (2.654) | 0.147** |
| CC (superior frontal gyrus) | 0.476 (0.006) | 0.000 (0.001) | −0.001 | No data | No data | No data | No data |
| CC (superior occipital gyrus) | 0.449 (0.008) | 0.002 (0.001) | 0.097** | 0.489 (0.009) | −0.142 (0.152) | 4.345 (3.352) | 0.099** |
| CC (superior parietal lobule) | 0.486 (0.007) | 0.001 (0.001) | 0.037* | 0.508 (0.005) | −0.179 (0.339) | 2.930 (2.442) | 0.042** |
| L cingulum (cingulate gyrus) | 0.461 (0.006) | 0.002 (0.001) | 0.064* | 0.483 (0.002) | −0.811 (1.315) | 1.840 (0.825) | 0.091** |
| R cingulum (cingulate gyrus) | 0.396 (0.009) | 0.003 (0.001) | 0.088** | No data | No data | No data | No data |
| L cingulum (hippocampus) | 0.392 (0.008) | 0.002 (0.001) | 0.045* | No data | No data | No data | No data |
| R cingulum (hippocampus) | 0.323 (0.014) | 0.000 (0.001) | −0.007 | No data | No data | No data | No data |
| L cortico‐spinal tract | 0.488 (0.007) | 0.002 (0.001) | 0.124** | 0.531 (0.015) | −0.088 (0.059) | 6.556 (6.407) | 0.124** |
| R cortico‐spinal tract | 0.499 (0.006) | 0.001 (0.000) | 0.054* | 0.528 (0.028) | −0.043 (0.020) | 9.775 (21.16) | 0.049** |
| L IOFF | 0.412 (0.005) | 0.001 (0.000) | 0.050* | 0.433 (0.009) | −0.054 (0.067) | 5.492 (7.133) | 0.047** |
| R IOFF | 0.412 (0.005) | 0.002 (0.000) | 0.148** | 0.456 (0.027) | −0.065 (0.017) | 9.914 (13.03) | 0.146** |
| L ILF | 0.414 (0.006) | 0.001 (0.000) | 0.054* | 0.434 (0.003) | −0.201 (0.340) | 2.685 (1.826) | 0.060** |
| R ILF | 0.396 (0.006) | 0.002 (0.000) | 0.129** | 0.445 (0.043) | −0.066 (0.016) | 12.092 (20.833) | 0.125** |
| L SLF (fronto‐parietal) | 0.412 (0.006) | 0.002 (0.000) | 0.062* | No data | No data | No data | No data |
| R SLF (fronto‐parietal) | 0.378 (0.006) | 0.002 (0.000) | 0.158** | No data | No data | No data | No data |
| L SLF (fronto‐temporal) | 0.415 (0.006) | 0.001 (0.001) | 0.042* | 0.450 (0.067) | −0.044 (0.034) | 14.304 (50.342) | 0.035** |
| R SLF (fronto‐temporal) | 0.419 (0.006) | 0.002 (0.000) | 0.109** | 0.452 (0.008) | −0.095 (0.086) | 5.003 (4.029) | 0.115** |
| L SLF (temporo‐parietal) | 0.392 (0.007) | 0.001 (0.001) | 0.020 | No data | No data | No data | No data |
| R SLF (temporo‐parietal) | 0.396 (0.006) | 0.002 (0.001) | 0.084** | 0.434 (0.031) | −0.056 (0.024) | 9.627 (17.45) | 0.071** |
| L uncinate fasciculus | 0.408 (0.006) | 0.001 (0.000) | 0.022 | 0.419 (0.002) | 0.000 (0.000) | 0.216 (1.374) | 0.014** |
| R uncinate fasciculus | 0.411 (0.006) | 0.000 (0.000) | −0.006 | No data | No data | No data | No data |
CC (cingulate gyrus), corpus callosum connecting the bilateral cingulate gyri; IOFF, the inferior occipito‐frontal fasciculus; ILF, the inferior longitudinal fasciculus; SLF (fronto‐parietal), the superior longitudinal fasciculus, which connects the frontal and parietal lobes.
P < 0.05;
P < 0.0017. Bonferroni critical α = 0.0017. SE indicates standard error. The degrees of freedom in each model are 125 in Linear, and 124 in Exponential.
Table III.
Relationship between age and MD in each white matter fiber using linear fitting and exponential fitting in boys
| Regions | Linear | Exponential | |||||
|---|---|---|---|---|---|---|---|
| b (SE) | a (SE) | Adjusted R 2 | y 0 (SE) | A (SE) | t (SE) | Adjusted R 2 | |
| CC (cingulate gyrus) | 845.2 (8.438) | −6.933 (0.728) | 0.432** | 711.4 (32.2) | 226.8 (55.4) | 7.667 (4.513) | 0.440** |
| CC (cuneus) | 983.0 (20.44) | −9.745 (1.765) | 0.200** | 743.7 (215.4) | 302.5 (96.6) | 12.955 (21.82) | 0.196** |
| CC (lingual gyrus) | 1034.9 (24.33) | −9.621 (2.101) | 0.145** | 856.3 (75.2) | 337.3 (208.0) | 6.823 (7.435) | 0.147** |
| CC (middle frontal gyrus) | 829.1 (10.43) | −4.536 (0.900) | 0.171** | No data | No data | No data | No data |
| CC (middle occipital gyrus) | 910.7 (11.64) | −7.122 (1.005) | 0.295** | 730.8 (135.9) | 222.7 (68.6) | 13.664 (18.87) | 0.293** |
| CC (postcentral gyrus) | 885.8 (9.12) | −7.683 (0.787) | 0.444** | 762.9 (11.8) | 416.6 (184.9) | 4.267 (1.398) | 0.481** |
| CC (precentral gyrus) | 873.9 (9.13) | −8.067 (0.788) | 0.468** | 731.3 (21.8) | 304.87 (98.7) | 5.993 (2.575) | 0.488** |
| CC (precuneus) | 870.7 (8.80) | −6.821 (0.760) | 0.403** | No data | No data | No data | No data |
| CC (rectal gyrus) | 827.3 (14.59) | −0.882 (1.259) | −0.004 | 813.7 (6.9) | 416.9 (2189.6) | 2.040 (3.249) | −0.003 |
| CC (superior frontal gyrus) | 833.6 (8.51) | −5.395 (0.734) | 0.310** | 735.7 (24.0) | 192.1 (79.7) | 6.506 (4.268) | 0.317** |
| CC (superior occipital gyrus) | 902.6 (10.71) | −7.540 (0.925) | 0.357** | No data | No data | No data | No data |
| CC (superior parietal lobule) | 879.5 (8.92) | −7.114 (0.770) | 0.417** | No data | No data | No data | No data |
| L cingulum (cingulate gyrus) | 836.5 (7.72) | −6.030 (0.666) | 0.407** | 724.1 (24.9) | 205.7 (62.2) | 7.000 (3.982) | 0.416** |
| R cingulum (cingulate gyrus) | 844.9 (7.76) | −7.125 (0.670) | 0.487** | 690.7 (49.7) | 218.4 (22.9) | 10.054 (6.865) | 0.492** |
| L cingulum (hippocampus) | 973.6 (23.12) | −4.365 (1.996) | 0.031* | 903.4 (31.0) | 241.9 (488.7) | 4.254 (6.321) | 0.028** |
| R cingulum (hippocampus) | 916.9 (23.58) | −6.659 (2.036) | 0.076** | 816.6 (19.4) | 631.3 (963.2) | 3.151 (2.361) | 0.087** |
| L cortico‐spinal tract | 825.0 (8.72) | −6.058 (0.753) | 0.351** | 732.7 (8.2) | 453.2 (274.0) | 3.485 (1.176) | 0.386** |
| R cortico‐spinal tract | 794.9 (7.20) | −5.958 (0.622) | 0.435** | 695.4 (12.6) | 262.9 (108.5) | 5.022 (1.980) | 0.455** |
| L IOFF | 854.8 (7.61) | −5.454 (0.657) | 0.365** | 753.7 (23.9) | 187.5 (63.4) | 6.892 (4.221) | 0.373 |
| R IOFF | 859.7 (8.12) | −6.795 (0.701) | 0.441** | 718.7 (43.2) | 211.4 (32.9) | 9.120 (6.212) | 0.447** |
| L ILF | 872.0 (8.11) | −4.523 (0.700) | 0.257** | 792.7 (19.0) | 173.4 (92.6) | 5.871 (3.988) | 0.264** |
| R ILF | 871.7 (8.01) | −6.489 (0.691) | 0.425** | 754.3 (21.8) | 233.9 (76.5) | 6.415 (3.213) | 0.441** |
| L SLF (fronto‐parietal) | 855.3 (8.34) | −6.485 (0.720) | 0.404** | 737.3 (23.7) | 229.8 (76.8) | 6.552 (3.157) | 0.415** |
| R SLF (fronto‐parietal) | 833.8 (8.67) | −7.542 (0.749) | 0.460** | 684.2 (37.6) | 240.7 (48.0) | 8.204 (4.864) | 0.467** |
| L SLF (fronto‐temporal) | 854.2 (7.49) | −6.032 (0.647) | 0.422** | 723.0 (49.0) | 184.8 (21.5) | 10.148 (7.984) | 0.424** |
| R SLF (fronto‐temporal) | 833.3 (8.94) | −7.349 (0.771) | 0.432** | 675.4 (55.5) | 225.7 (27.8) | 9.879 (7.415) | 0.435** |
| L SLF (temporo‐parietal) | 858.7 (7.14) | −6.050 (0.616) | 0.447** | 715.7 (65.4) | 185.4 (24.8) | 12.074 (10.69) | 0.447** |
| R SLF (temporo‐parietal) | 865.6 (7.72) | −7.124 (0.666) | 0.490** | 632.6 (213.1) | 257.8 (173.6) | 21.160 (29.79) | 0.488** |
| L uncinate fasciculus | 855.2 (7.64) | −5.258 (0.660) | 0.346** | 759.2 (22.0) | 186.2 (69.5) | 6.595 (4.104) | 0.357** |
| R uncinate fasciculus | 858.8 (8.40) | −6.503 (0.725) | 0.402** | 737.7 (26.7) | 223.2 (68.3) | 6.959 (3.949) | 0.414** |
CC (cingulate gyrus), corpus callosum connecting the bilateral cingulate gyri; IOFF, the inferior occipito‐frontal fasciculus; ILF, the inferior longitudinal fasciculus; SLF (fronto‐parietal), the superior longitudinal fasciculus, which connects the frontal and parietal lobes.
P < 0.05;
P < 0.0017. Bonferroni critical α = 0.0017. SE indicates standard error. The degrees of freedom in each model are 117 in Linear, and 116 in Exponential.
Table IV.
Relationship between age and MD in each white matter fiber using linear fitting and exponential fitting in girls
| Regions | Linear | Exponential | |||||
|---|---|---|---|---|---|---|---|
| b (SE) | a (SE) | Adjusted R 2 | y 0 (SE) | A (SE) | t (SE) | Adjusted R 2 | |
| CC (cingulate gyrus) | 809.3 (6.90) | −4.378 (0.554) | 0.327** | 732.6 (9.6) | 224.5 (101.9) | 4.942 (1.960) | 0.364** |
| CC (cuneus) | 908.7 (17.70) | −4.226 (1.421) | 0.059* | 893.1 (64.0) | −7.660 (35.4) | −8.295 (14.69) | 0.053** |
| CC (lingual gyrus) | 939.5 (21.50) | −3.157 (1.727) | 0.018 | 914.1 (17.3) | −0.265 (1.7) | −3.484 (4.332) | 0.019** |
| CC (middle frontal gyrus) | 811.7 (8.35) | −3.705 (0.670) | 0.190** | 745.6 (13.3) | 175.7 (111.1) | 5.286 (3.256) | 0.205** |
| CC (middle occipital gyrus) | 864.2 (10.70) | −4.242 (0.859) | 0.157** | No data | No data | No data | No data |
| CC (postcentral gyrus) | 834.1 (7.68) | −4.059 (0.617) | 0.251** | 767.6 (6.4) | 340.7 (207.7) | 3.624 (1.253) | 0.314** |
| CC (precentral gyrus) | 828.3 (7.26) | −4.802 (0.583) | 0.347** | 749.6 (5.9) | 402.5 (190.6) | 3.625 (0.974) | 0.434** |
| CC (precuneus) | 828.2 (8.10) | −3.964 (0.651) | 0.223** | 754.9 (15.9) | 167.77 (87.0) | 5.960 (3.717) | 0.238** |
| CC (rectal gyrus) | 813.9 (11.38) | 0.020 (0.914) | −0.008 | No data | No data | No data | No data |
| CC (superior frontal gyrus) | 806.5 (6.73) | −3.607 (0.540) | 0.257** | 743.8 (9.0) | 191.7 (105.7) | 4.799 (2.211) | 0.285** |
| CC (superior occipital gyrus) | 852.1 (9.53) | −4.171 (0.766) | 0.185** | 746.7 (82.0) | 135.9 (33.8) | 12.933 (19.38) | 0.182** |
| CC (superior parietal lobule) | 833.9 (8.27) | −4.044 (0.664) | 0.222** | 758.2 (17.4) | 165.9 (83.1) | 6.187 (4.003) | 0.236** |
| L cingulum (cingulate gyrus) | 805.3 (6.35) | −3.776 (0.510) | 0.300** | 739.1 (8.9) | 192.6 (93.5) | 4.958 (2.114) | 0.331** |
| R cingulum (cingulate gyrus) | 810.6 (5.76) | −4.660 (0.462) | 0.444** | 723.6 (11.8) | 190.4 (57.1) | 6.171 (2.378) | 0.473** |
| L cingulum (hippocampus) | 916.1 (20.01) | −0.610 (1.607) | −0.007 | 908.3 (5.2) | 0.0 (0.0) | 0.177 (4.107) | −0.012 |
| R cingulum (hippocampus) | 869.0 (17.62) | −2.843 (1.415) | 0.024* | 832.9 (4.8) | 0.0 (0.0) | 0.431 (0.512) | 0.038** |
| L cortico‐spinal tract | 797.3 (6.83) | −4.145 (0.549) | 0.308** | 722.3 (11.6) | 188.9 (11.6) | 5.518 (2.544) | 0.337** |
| R cortico‐spinal tract | 765.9 (5.26) | −4.104 (0.422) | 0.426** | 693.4 (7.7) | 201.6 (71.8) | 5.119 (1.685) | 0.471** |
| L IOFF | 823.2 (6.42) | −3.389 (0.516) | 0.251** | 765.3 (7.7) | 195.9 (113.8) | 4.498 (1.983) | 0.281** |
| R IOFF | 825.1 (6.13) | −4.626 (0.492) | 0.409** | 735.9 (15.2) | 176.1 (51.2) | 6.803 (3.111) | 0.430** |
| L ILF | 842.5 (6.71) | −2.848 (0.539) | 0.176** | 795.6 (6.2) | 212.8 (166.3) | 3.818 (1.809) | 0.204** |
| R ILF | 838.0 (5.97) | −4.385 (0.480) | 0.396** | 752.9 (15.3) | 165.2 (48.3) | 6.923 (3.310) | 0.416** |
| L SLF (fronto‐parietal) | 819.6 (7.03) | −3.949 (0.565) | 0.275** | 752.0 (8.4) | 228.5 (123.5) | 4.508 (1.855) | 0.312** |
| R SLF (fronto‐parietal) | 793.8 (5.86) | −4.942 (0.470) | 0.465** | 705.5 (9.1) | 231.8 (74.0) | 5.336 (1.685) | 0.510** |
| L SLF (fronto‐temporal) | 822.7 (6.66) | −3.805 (0.535) | 0.282** | 758.8 (6.8) | 251.0 (137.9) | 4.131 (1.528) | 0.329** |
| R SLF (fronto‐temporal) | 795.1 (5.96) | −4.963 (0.479) | 0.458** | 705.4 (9.9) | 224.8 (70.8) | 5.533 (1.834) | 0.501** |
| L SLF (temporo‐parietal) | 828.8 (6.02) | −3.990 (0.483) | 0.347** | 759.5 (7.9) | 212.5 (93.9) | 4.786 (1.760) | 0.388** |
| R SLF (temporo‐parietal) | 830.5 (5.45) | −4.850 (0.437) | 0.492** | 730.7 (18.8) | 168.3 (31.3) | 8.145 (3.738) | 0.511** |
| L uncinate fasciculus | 829.9 (7.02) | −3.470 (0.564) | 0.226** | 770.5 (8.5) | 197.2 (123.1) | 4.536 (2.174) | 0.250** |
| R uncinate fasciculus | 830.6 (6.06) | −4.496 (0.487) | 0.401** | 748.7 (10.8) | 197.2 (69.5) | 5.693 (2.218) | 0.432** |
CC (cingulate gyrus), corpus callosum connecting the bilateral cingulate gyri; IOFF, the inferior occipito‐frontal fasciculus; ILF, the inferior longitudinal fasciculus; SLF (fronto‐parietal), the superior longitudinal fasciculus, which connects the frontal and parietal lobes.
P < 0.05;
P < 0.0017. Bonferroni critical α = 0.0017. SE indicates standard error. The degrees of freedom in each model are 125 in Linear, and 124 in Exponential.
Regarding the correlation between MD and age, MD initially decreased rapidly with age, and then the rate of decrease slowed and finally reached a stable value, shown as y 0 in the equation, in most ROIs in both genders.
For white matter volume, the trajectory of regional white matter volume with age in each ROI is shown in Supporting Information Table S3. The correlation between white matter volume and age showed significant positive linear trajectories in most ROIs in boys and girls. In boys, the white matter volume of the bilateral uncinate fasciculus showed significant negative quadratic trajectories with age. These regions showed rapid increases in white matter volume with age, and then the rate of increase slowed. In girls, several white matter regions, such as the corpus callosum connecting the bilateral cingulate gyri, the middle frontal gyri, the precuneus, the superior parietal lobules, the bilateral cingulum of the cingulate gyrus, and the left superior longitudinal fasciculus, which connects frontal and parietal lobes, showed significant positive quadratic trajectories with age. These regions showed gradual increases in white matter volume with age. Additionally, the bilateral corticospinal tracts showed significant positive cubic trajectories with age in boys and girls.
DISCUSSION
To our knowledge, this is the first report revealing linear and exponential correlations of FA, MD, and white matter volume with age in whole white matter regions over a wide age range of healthy children by applying VBA and ROI analysis. We found that the correlations of FA and MD with age showed exponential trajectories in most ROIs, except for a few fibers, such as the corpus callosum connecting the bilateral rectal gyri in boys. Furthermore, the correlation between white matter volume and age showed significant positive linear trajectories in most ROIs, except a few fibers, such as the bilateral uncinate fasciculus. Additionally, the maturational rate differed among major fibers, and in girls, the left superior longitudinal fasciculus, which connects the frontal and temporal lobes, showed a slower rate of maturation than other fibers.
We demonstrated that the white matter volume in most regions showed a positive linear correlation with age in VBA (Figs. 2 and 3, Supporting Information Tables S1 and S2). In particular, the white matter in the bilateral corticospinal tract in boys showed a significant positive linear correlation with age. These results are consistent with recent studies that showed an increase in overall white matter volume [Giedd et al., 1999; Lebel et al., 2008; Paus et al., 2001; Sowell et al., 2002; Tamnes et al., 2010] and increases in white matter density in the internal capsule [Paus et al., 1999] during adolescence by using T1‐weighted anatomical images. We showed an increasing trajectory of white matter volume with age by using the VBA method. Regarding the mechanism(s) of the increase in white matter volume, a preadolescent increase followed by a postadolescent decrease in the number of synapses per neuron and intracortical myelination that occurs in brain maturation [Huttenlocher, 1979; Huttenlocher et al., 1982, 1997; Paus, 2005] may affect the white matter volume as well as the gray matter volume. Additionally, it has been shown that initial development of the white matter tract is observed in projection fibers, such as the corticospinal tract, followed by the commissural and association fibers [Feldman et al., 2010; Huang et al., 2006; Schmithorst et al., 2010]. Moreover, recent studies have shown that an increase in white matter volume continues until around the fifth decade of life in healthy adults [Bartzokis et al., 2001; Sowell et al., 2003; Taki et al., 2011b], suggesting that white matter maturation continues until around middle age. As described above, it is thought that the white matter in the bilateral corticospinal tract showed a significant positive linear correlation with age in this study because white matter maturation starts from projection fibers.
Focusing on each fiber of the white matter in ROI analysis, several fibers, especially the superior longitudinal fasciculus, which connects the frontal and parietal lobes and the frontal and temporal lobes, and the uncinate fasciculus showed significantly higher F‐values with age, suggesting that intensive maturation of these fibers occurs in the age range of this study (Supporting Information Table S3). The superior longitudinal fasciculus, which connects the frontal and parietal lobes, is involved in working memory [Vestergaard et al., 2011], and the actuate fasciculus, which connects the frontal and temporal lobes, is related to language function [Catani et al., 2008; Friederici, 2009]. Additionally, the uncinate fasciculus, which connects the prefrontal cortex and temporal lobe, is related to declarative memory function [Mabbott et al., 2009; Squire et al., 1991]. Because these higher cognitive functions mature during adolescence, the increase in white matter volume in these fibers may be associated with the maturation of these higher cognitive functions during adolescence.
We also found that the volume of the cingulum in the hippocampus showed a significant positive correlation with age. The hippocampus is a site of the generation of new neurons in several mammals including humans [Eriksson et al., 1998; Gould et al., 1999]. In fact, hippocampal volume increases in adolescence and young adulthood [Guo et al., 2007; Ostby et al., 2009]. Thus, the significant positive correlation between the volume of the cingulum in the hippocampus and age is thought to be related to neurogenesis in the hippocampus.
A significant positive correlation between regional white matter volume and age was found in the corpus callosum connecting the bilateral superior frontal, precentral, postcentral, and cingulate gyri in both genders. On the other hand, the corpus callosum connecting the bilateral occipital lobes, such as the lingual gyrus and superior occipital gyrus, showed rather small F‐values, especially in girls. Recent post‐mortem studies of human brains have shown that the time course of synaptogenesis is earlier in the visual and auditory cortex than in the prefrontal cortex [Huttenlocher, 1979; Huttenlocher et al., 1982, 1997]. Additionally, synapse elimination starts earlier in the visual cortex than in the auditory cortex, and that in the prefrontal cortex starts later than does either of the others [Huttenlocher et al., 1997]. These results suggest that brain maturation starts in the occipital lobe and then moves to the temporal lobe, followed by the frontal lobe, as shown in our previous study using perfusion MRI [Taki et al., 2011a]. From these results, it is thought that maturation of the frontal lobe occurs more intensively than that in other regions, such as the occipital lobe, in the age range of this study; thus, a significant positive correlation between regional white matter volume and age was found in the corpus callosum primarily connecting the bilateral frontal lobe in both genders.
Regarding the correlation of FA and MD with age, the FA of most fibers showed significant exponential increases with age, and the MD of most fibers showed significant exponential decreases with age (Figs. 4A,B, 5A,B, and Tables I–IV). These results are consistent with several recent studies that showed exponential increases in FA and exponential decreases in MD in healthy children [Ben Bashat et al., 2005; Lebel et al., 2008; Schneider et al., 2004; Tamnes et al., 2010; Zhang et al., 2005]. Regarding the mechanism(s) of the increase in FA and the decrease in MD, three factors are thought to be associated with this phenomenon: dense axonal packing, large axonal diameter, and a high level of myelination [Feldman et al., 2010]. Thus, our results suggest that most white matter fibers show intensive maturational changes such as myelination in an earlier period and then slower maturational changes in late adolescence and young adulthood. However, the FA of the corpus callosum connecting the bilateral rectal gyri showed significant, or at least substantial, negative correlations with age in both genders, as shown in Supporting Information Figure S2(C) in boys and S3(A) in girls. These findings are partially consistent with those of a recent study that showed a slight decrease in FA in the medial orbitofrontal lobe. Regarding the mechanism(s) of the decrease in FA in the maturational period, if the pruning process occurs in fibers oriented in the principal diffusion direction rather than in crossing fibers in some regions, it is thought that a decrease in FA could occur due to maturational changes in these regions [Schmithorst et al., 2010]. Thus, not only the increase in FA but also a decrease in FA and a decrease in MD may reflect maturational changes in white matter microstructure.
This study has some limitations. This was a cross‐sectional study; that is, we showed relationships of FA, MD, and white matter volume with age but not relationships over time. Thus, we are planning to perform a longitudinal analysis to examine the correlations of FA, MD, and white matter volume with age over time. Second, the age range of the subjects is thought to be an important factor in determining the best‐fit function of correlations such as white matter volume and age. Thus, to generalize our findings, subject characteristics, especially the age distribution, are important.
In conclusion, we demonstrated linear and curvilinear correlations of FA, MD, and white matter volume with age using brain structural and diffusion‐tensor MRI in a large number of healthy children by using VBM and ROI analyses. The correlations of FA and MD with age showed exponential trajectories in most ROIs in boys and girls, except for a few fibers, such as the corpus callosum connecting the bilateral rectal gyri, in boys. The correlations between white matter volume and age showed significant positive linear trajectories in most ROIs in boys and girls, except in a few fibers such as the bilateral uncinate fasciculus. Additionally, the maturational rate differed among major fibers; in girls, the left superior longitudinal fasciculus, which connects frontal and temporal lobes, showed a slower rate of maturation than other fibers. Our study may help to clarify the mechanism(s) of normal brain maturation from the viewpoint of brain white matter volume and make it possible to distinguish between normal trajectories of white matter volume with age and abnormal trajectories with age indicative of developmental disorders.
Supporting information
Additional Supporting Information may be found in the online version of this article.
Supporting Information
Supporting Information Figure 1.
Supporting Information Figure 2.
Supporting Information Figure 3.
Supporting Information Figure 4.
Supporting Information Figure 5.
Acknowledgements
The authors thank Y. Yamada for collecting MR data and Y. Suzuki for technical support.
REFERENCES
- Akaike H ( 1974): A new look at statistical model identification. IEEE Trans Automatic Control 19: 716–723. [Google Scholar]
- Ashburner J, Friston KJ ( 2000): Voxel‐based morphometry—The methods. Neuroimage 11: 805–821. [DOI] [PubMed] [Google Scholar]
- Azuma H, Ueno K, Fujita K, Maekawa H, Ishikuma T, Sano H ( 1998): Japanese Wechsler Intelligence Scale for Children, 3rd ed. Tokyo: Nihon Bunka Kagakusha. [Google Scholar]
- Barnea‐Goraly N, Menon V, Eckert M, Tamm L, Bammer R, Karchemskiy A, Dant CC, Reiss AL ( 2005): White matter development during childhood and adolescence: A cross‐sectional diffusion tensor imaging study. Cereb Cortex 15: 1848–1854. [DOI] [PubMed] [Google Scholar]
- Bartzokis G, Beckson M, Lu PH, Nuechterlein KH, Edwards N, Mintz J ( 2001): Age‐related changes in frontal and temporal lobe volumes in men: A magnetic resonance imaging study. Arch Gen Psychiatry 58: 461–465. [DOI] [PubMed] [Google Scholar]
- Beaulieu C ( 2002): The basis of anisotropic water diffusion in the nervous system—A technical review. NMR Biomed 15: 435–455. [DOI] [PubMed] [Google Scholar]
- Ben Bashat D, Ben Sira L, Graif M, Pianka P, Hendler T, Cohen Y, Assaf Y ( 2005): Normal white matter development from infancy to adulthood: Comparing diffusion tensor and high b value diffusion weighted MR images. J Magn Reson Imaging 21: 503–511. [DOI] [PubMed] [Google Scholar]
- Ben Bashat D, Kronfeld‐Duenias V, Zachor DA, Ekstein PM, Hendler T, Tarrasch R, Even A, Levy Y, Ben Sira L ( 2007): Accelerated maturation of white matter in young children with autism: A high b value DWI study. Neuroimage 37: 40–47. [DOI] [PubMed] [Google Scholar]
- Bonekamp D, Nagae LM, Degaonkar M, Matson M, Abdalla WM, Barker PB, Mori S, Horska A ( 2007): Diffusion tensor imaging in children and adolescents: Reproducibility, hemispheric, and age‐related differences. Neuroimage 34: 733–742. [DOI] [PMC free article] [PubMed] [Google Scholar]
- Catani M, Mesulam M ( 2008): The arcuate fasciculus and the disconnection theme in language and aphasia: History and current state. Cortex 44: 953–961. [DOI] [PMC free article] [PubMed] [Google Scholar]
- Courchesne E, Karns CM, Davis HR, Ziccardi R, Carper RA, Tigue ZD, Chisum HJ, Moses P, Pierce K, Lord C, Lincoln AJ, Pizzo S, Schreibman L, Haas RH, Akshoomoff NA, Courchesne RY ( 2001): Unusual brain growth patterns in early life in patients with autistic disorder: An MRI study. Neurology 57: 245–254. [DOI] [PubMed] [Google Scholar]
- Eriksson PS, Perfilieva E, Bjork‐Eriksson T, Alborn AM, Nordborg C, Peterson DA, Gage FH ( 1998): Neurogenesis in the adult human hippocampus. Nat Med 4: 1313–1317. [DOI] [PubMed] [Google Scholar]
- Evans AC, Brain Development Cooperative G ( 2006): The NIH MRI study of normal brain development. Neuroimage 30: 184–202. [DOI] [PubMed] [Google Scholar]
- Feldman HM, Yeatman JD, Lee ES, Barde LH, Gaman‐Bean S ( 2010): Diffusion tensor imaging: A review for pediatric researchers and clinicians. J Dev Behav Pediatr 31: 346–356. [DOI] [PMC free article] [PubMed] [Google Scholar]
- Friederici AD ( 2009): Pathways to language: Fiber tracts in the human brain. Trends Cogn Sci 13: 175–181. [DOI] [PubMed] [Google Scholar]
- Friston KJ, Holmes AP, Worsley KJ, Poline J‐P, Frith CD, Frackowiak RSJ ( 1995): Statistical parametric maps in functional imaging: A general linear approach. Hum Brain Mapp 2: 189–210. [Google Scholar]
- Fujita K, Maekawa H, Dairoku H, Yamanaka K ( 2006). Japanese Wechsler Adult Intelligence Scale, 3rd ed. Tokyo: Nihon Bunka Kagakusha. [Google Scholar]
- Giedd JN, Blumenthal J, Jeffries NO, Castellanos FX, Liu H, Zijdenbos A, Paus T, Evans AC, Rapoport JL ( 1999): Brain development during childhood and adolescence: A longitudinal MRI study. Nat Neurosci 2: 861–863. [DOI] [PubMed] [Google Scholar]
- Gogtay N, Giedd JN, Lusk L, Hayashi KM, Greenstein D, Vaituzis AC, Nugent TF III, Herman DH, Clasen LS, Toga AW, Rapoport JL, Thompson PM ( 2004): Dynamic mapping of human cortical development during childhood through early adulthood. Proc Natl Acad Sci USA 101: 8174–8179. [DOI] [PMC free article] [PubMed] [Google Scholar]
- Gould E, Reeves AJ, Fallah M, Tanapat P, Gross CG, Fuchs E ( 1999): Hippocampal neurogenesis in adult Old World primates. Proc Natl Acad Sci USA 96: 5263–5267. [DOI] [PMC free article] [PubMed] [Google Scholar]
- Guo X, Chen C, Chen K, Jin Z, Peng D, Yao L ( 2007): Brain development in Chinese children and adolescents: A structural MRI study. Neuroreport 18: 875–880. [DOI] [PubMed] [Google Scholar]
- Huang H, Zhang J, Wakana S, Zhang W, Ren T, Richards LJ, Yarowsky P, Donohue P, Graham E, van Zijl PC, Mori S ( 2006): White and gray matter development in human fetal, newborn and pediatric brains. Neuroimage 33: 27–38. [DOI] [PubMed] [Google Scholar]
- Huttenlocher PR ( 1979): Synaptic density in human frontal cortex—Developmental changes and effects of aging. Brain Res 163: 195–205. [DOI] [PubMed] [Google Scholar]
- Huttenlocher PR, Dabholkar AS ( 1997): Regional differences in synaptogenesis in human cerebral cortex. J Comp Neurol 387: 167–178. [DOI] [PubMed] [Google Scholar]
- Huttenlocher PR, de Courten C, Garey LJ, Van der Loos H ( 1982): Synaptogenesis in human visual cortex—Evidence for synapse elimination during normal development. Neurosci Lett 33: 247–252. [DOI] [PubMed] [Google Scholar]
- Johnson MH ( 2001): Functional brain development in humans. Nat Rev Neurosci 2: 475–483. [DOI] [PubMed] [Google Scholar]
- Klingberg T, Vaidya CJ, Gabrieli JD, Moseley ME, Hedehus M ( 1999): Myelination and organization of the frontal white matter in children: A diffusion tensor MRI study. Neuroreport 10: 2817–2821. [DOI] [PubMed] [Google Scholar]
- Le Bihan D ( 2003): Looking into the functional architecture of the brain with diffusion MRI. Nat Rev Neurosci 4: 469–480. [DOI] [PubMed] [Google Scholar]
- Lebel C, Walker L, Leemans A, Phillips L, Beaulieu C ( 2008): Microstructural maturation of the human brain from childhood to adulthood. Neuroimage 40: 1044–1055. [DOI] [PubMed] [Google Scholar]
- Lenroot RK, Gogtay N, Greenstein DK, Wells EM, Wallace GL, Clasen LS, Blumenthal JD, Lerch J, Zijdenbos AP, Evans AC, Thompson PM, Giedd JN ( 2007): Sexual dimorphism of brain developmental trajectories during childhood and adolescence. Neuroimage 36: 1065–1073. [DOI] [PMC free article] [PubMed] [Google Scholar]
- Mabbott DJ, Rovet J, Noseworthy MD, Smith ML, Rockel C ( 2009): The relations between white matter and declarative memory in older children and adolescents. Brain Res 1294: 80–90. [DOI] [PubMed] [Google Scholar]
- Mori S, Zhang J ( 2006): Principles of diffusion tensor imaging and its applications to basic neuroscience research. Neuron 51: 527–539. [DOI] [PubMed] [Google Scholar]
- Muetzel RL, Collins PF, Mueller BA, M Schissel A, Lim KO, Luciana M ( 2008): The development of corpus callosum microstructure and associations with bimanual task performance in healthy adolescents. Neuroimage 39: 1918–1925. [DOI] [PMC free article] [PubMed] [Google Scholar]
- Mukherjee P, Miller JH, Shimony JS, Conturo TE, Lee BC, Almli CR, McKinstry RC ( 2001): Normal brain maturation during childhood: Developmental trends characterized with diffusion‐tensor MR imaging. Radiology 221: 349–358. [DOI] [PubMed] [Google Scholar]
- Mukherjee P, Miller JH, Shimony JS, Philip JV, Nehra D, Snyder AZ, Conturo TE, Neil JJ, McKinstry RC ( 2002): Diffusion‐tensor MR imaging of gray and white matter development during normal human brain maturation. AJNR Am J Neuroradiol 23: 1445–1456. [PMC free article] [PubMed] [Google Scholar]
- Oldfield RC ( 1971): The assessment and analysis of handedness: The Edinburgh inventory. Neuropsychologia 9: 97–113. [DOI] [PubMed] [Google Scholar]
- Ostby Y, Tamnes CK, Fjell AM, Westlye LT, Due‐Tonnessen P, Walhovd KB ( 2009): Heterogeneity in subcortical brain development: A structural magnetic resonance imaging study of brain maturation from 8 to 30 years. J Neurosci 29: 11772–11782. [DOI] [PMC free article] [PubMed] [Google Scholar]
- Paus T ( 2005): Mapping brain maturation and cognitive development during adolescence. Trends Cogn Sci 9: 60–68. [DOI] [PubMed] [Google Scholar]
- Paus T, Zijdenbos A, Worsley K, Collins DL, Blumenthal J, Giedd JN, Rapoport JL, Evans AC ( 1999): Structural maturation of neural pathways in children and adolescents: In vivo study. Science 283: 1908–1911. [DOI] [PubMed] [Google Scholar]
- Paus T, Collins DL, Evans AC, Leonard G, Pike B, Zijdenbos A ( 2001): Maturation of white matter in the human brain: A review of magnetic resonance studies. Brain Res Bull 54: 255–266. [DOI] [PubMed] [Google Scholar]
- Pierpaoli C, Basser PJ ( 1996): Toward a quantitative assessment of diffusion anisotropy. Magn Reson Med 36: 893–906. [DOI] [PubMed] [Google Scholar]
- Schmithorst VJ, Wilke M, Dardzinski BJ, Holland SK ( 2002): Correlation of white matter diffusivity and anisotropy with age during childhood and adolescence: A cross‐sectional diffusion‐tensor MR imaging study. Radiology 222: 212–218. [DOI] [PMC free article] [PubMed] [Google Scholar]
- Schmithorst VJ, Yuan W ( 2010): White matter development during adolescence as shown by diffusion MRI. Brain Cogn 72: 16–25. [DOI] [PubMed] [Google Scholar]
- Schneider JF, Il'yasov KA, Hennig J, Martin E ( 2004): Fast quantitative diffusion‐tensor imaging of cerebral white matter from the neonatal period to adolescence. Neuroradiology 46: 258–266. [DOI] [PubMed] [Google Scholar]
- Sowell ER, Trauner DA, Gamst A, Jernigan TL ( 2002): Development of cortical and subcortical brain structures in childhood and adolescence: A structural MRI study. Dev Med Child Neurol 44: 4–16. [DOI] [PubMed] [Google Scholar]
- Sowell ER, Peterson BS, Thompson PM, Welcome SE, Henkenius AL, Toga AW ( 2003): Mapping cortical change across the human life span. Nat Neurosci 6: 309–315. [DOI] [PubMed] [Google Scholar]
- Spiess AN, Neumeyer N ( 2010): An evaluation of R 2 as an inadequate measure for nonlinear models in pharmacological and biochemical research: A Monte Carlo approach. BMC Pharmacol 10: 6 [DOI] [PMC free article] [PubMed] [Google Scholar]
- Squire LR, Zola‐Morgan S ( 1991): The medial temporal lobe memory system. Science 253: 1380–1386. [DOI] [PubMed] [Google Scholar]
- Takeuchi H, Sekiguchi A, Taki Y, Yokoyama S, Yomogida Y, Komuro N, Yamanouchi, T , Suzuki S, Kawashima R ( 2010): Training of working memory impacts structural connectivity. J Neurosci 30: 3297–3303. [DOI] [PMC free article] [PubMed] [Google Scholar]
- Taki Y, Hashizume H, Sassa Y, Takeuchi H, Asano M, Asano K, Kawashima R ( 2010): Breakfast staple types affect brain gray matter volume and cognitive function in healthy children. PLoS ONE 5: e15213 [DOI] [PMC free article] [PubMed] [Google Scholar]
- Taki Y, Hashizume H, Sassa Y, Takeuchi H, Wu K, Asano M, Asano K, Fukuda H, Kawashima R ( 2011a): Correlation between gray matter density‐adjusted brain perfusion and age using brain MR images of 202 healthy children. Hum Brain Mapp 32: 1973–1985. [DOI] [PMC free article] [PubMed] [Google Scholar]
- Taki Y, Kinomura S, Sato K, Goto R, Kawashima R, Fukuda H ( 2011b): A longitudinal study of gray matter volume decline with age and modifying factors. Neurobiol Aging 32: 907–915. [DOI] [PubMed] [Google Scholar]
- Talairach J, Tournoux P ( 1988): Co‐Planar Stereotaxic Atlas of the Human Brain: 3‐Dimensional Approach System: An Approach to Cerebral Imaging. Anonymous. Stuttgart: Georg Thieme Verlag. [Google Scholar]
- Tamnes CK, Ostby Y, Fjell AM, Westlye LT, Due‐Tonnessen P, Walhovd KB ( 2010): Brain maturation in adolescence and young adulthood: Regional age‐related changes in cortical thickness and white matter volume and microstructure. Cereb Cortex 20: 534–548. [DOI] [PubMed] [Google Scholar]
- Thatcher RW ( 1992): Cyclic cortical reorganization during early childhood. Brain Cogn 20: 24–50. [DOI] [PubMed] [Google Scholar]
- Vestergaard M, Madsen KS, Baare WF, Skimminge A, Ejersbo LR, Ramsoy TZ, Gerlach C, Akeson P, Paulson OB, Jernigan TL ( 2011): White matter microstructure in superior longitudinal fasciculus associated with spatial working memory performance in children. J Cogn Neurosci 23: 2135–2146. [DOI] [PubMed] [Google Scholar]
- Wozniak JR, Lim KO ( 2006): Advances in white matter imaging: A review of in vivo magnetic resonance methodologies and their applicability to the study of development and aging. Neurosci Biobehav Rev 30: 762–774. [DOI] [PMC free article] [PubMed] [Google Scholar]
- Zhang L, Thomas KM, Davidson MC, Casey BJ, Heier LA, Ulug AM ( 2005): MR quantitation of volume and diffusion changes in the developing brain. AJNR Am J Neuroradiol 26: 45–49. [PMC free article] [PubMed] [Google Scholar]
Associated Data
This section collects any data citations, data availability statements, or supplementary materials included in this article.
Supplementary Materials
Additional Supporting Information may be found in the online version of this article.
Supporting Information
Supporting Information Figure 1.
Supporting Information Figure 2.
Supporting Information Figure 3.
Supporting Information Figure 4.
Supporting Information Figure 5.