

Abstract
Objectives: Neuroimaging studies have consistently implicated alterations of the basal ganglia and orbitofrontal cortex in the pathophysiology of OCD, however, recent work also emphasizes more diffuse patterns of brain alteration as occurring in this disorder. The goal of this study was to extend such observations by investigating large‐scale brain functional network correlates of cognitive‐control performance in OCD patients. Experimental design: We combined fMRI with a validated task of cognitive control and a multivariate statistical method to assess multiple functional networks encompassing broad task‐relevant cortical regions in OCD patients and matched controls. Functional networks of interest were targeted a priori and the groups were compared in terms of the spatiotemporal profile of network responses (functional connectivity) during the task performance in a data‐driven manner. Principal observations: Task performance was equivalent in both groups and each distinct network demonstrated strong overlap in its general response during task. However, significant differences in functional connectivity were also observed between groups that appeared driven by specific phases of task performance. Such differences were most pronounced during rest‐task transitions and mainly involved dorsal anterior cingulate and insular cortices within the paralimbic network. Relative heightened functional connectivity of insula in patients during task correlated with a measure of patients' state anxiety. Conclusions: Our findings provide a novel functional imaging characterization of brain network alterations associated with cognitive‐control in OCD. Additionally, these findings raise questions about the role of patients' arousal states on the performance of cognitive imaging tasks that are otherwise assumed to be emotionally neutral. Hum Brain Mapp, 2011. © 2011 Wiley‐Liss, Inc.
Keywords: Obsessive‐compulsive disorder, fMRI, functional connectivity, arousal, insular cortex
INTRODUCTION
Obsessive‐compulsive disorder (OCD) is a relatively common neuropsychiatric illness with an estimated lifetime prevalence of 2–3% [Murray and Lopez, 1996]. Its symptoms are time‐consuming and disabling, and are classified according to two major features: ‘obsessions’–intense, recurring and unwanted thoughts, urges or impulses, and ‘compulsions’–ritualistic behaviors performed to reduce obsessions or anxiety (APA 2000). Obsessions are typically experienced as involuntary and despite patients' efforts to suppress or control them, are rarely completely mitigated. According to pathophysiological models of OCD [Graybiel and Rauch, 2000; Modell et al., 1989] its characteristic symptoms as well as associated cognitive deficits may arise from alterations in the structure and function of segregated corticostriatal networks or ‘loops’ [Alexander et al., 1986; Haber, 2003]. Evidence best supporting their dysfunction in OCD has come from neuroimaging studies that implicate orbitofrontal, anterior cingulate, and striatal brain alterations [Menzies et al., 2008]. With respect to functional neuroimaging, heightened activity of the orbitofrontal cortex and caudate nucleus has been consistent in positron‐emission tomography (PET) studies of patients at rest [Saxena, 2003; Whiteside et al., 2004], whereas heightened activation of these regions has been reported in studies of symptom provocation using PET and functional magnetic resonance imaging (fMRI) [Adler et al., 2000; Breiter et al., 1996; Lawrence et al., 2007; Mataix‐Cols et al., 2004; McGuire et al., 1994; Phillips et al., 2000; Rauch et al., 1994; Rauch et al., 2002; Schienle et al., 2005; Shapira et al., 2003; van den Heuvel et al., 2004].
Although the above studies and other recent findings [Harrison et al., 2009] support the corticostriatal ‘loop’ model of OCD, there is also growing appreciation from neuroimaging that the pattern of brain abnormalities in this disorder may extend beyond these classically defined networks [Harrison et al., 2006; Mataix‐Cols et al., 2004; Menzies et al., 2007; Pujol et al., 2004; Soriano‐Mas et al., 2007; van den Heuvel et al., 2008]. This idea is highlighted by recent work that has characterized the structural brain correlates of impaired motor inhibitory control in OCD–the ability to override contextually irrelevant or inappropriate motor responses [Menzies et al., 2007]. In this family study of patients and their first‐degree relatives, poor inhibition of motor responses was linked to heritable changes in grey matter density in a widely distributed network of frontal, parietal, cingulate, and cerebellar regions across the proband‐relative pairs [Menzies et al., 2007]. Taken with other neuropsychological evidence, these results suggest that anatomical variations in large‐scale brain systems involved in motor inhibitory control may mediate genetic risk for OCD and represent a neurocognitive endophenotype of the disorder [Chamberlain et al., 2006; Chamberlain and Sahakian, 2007; Menzies et al., 2007; Menzies et al., 2008].
In this study, we sought to extend recent findings by investigating the large‐scale brain functional network correlates of performance on a goal‐directed cognitive control task encompassing inhibitory processes in OCD patients. To do so, we revisited a previous experiment that used the Multisource Interference Task (MSIT) to study dorsal anterior cingulate/medial wall activity in OCD patients [Yücel et al., 2007b]. By virtue of its strong demands on cognitive and inhibitory control processes, this task also consistently engages other frontal, cingulate, parietal, and cerebellar regions [Bush and Shin, 2006] that overlap with results of Menzies et al., [2007]. As previously suggested, the MSIT may be best conceptualized as a ‘cognitive control’ task that engages both general goal‐directed cognitive control processes (i.e., sustained and selective visual attention, response selection, and psychomotor control/execution) and additional ‘higher order’ response inhibitory processes involving in selecting an appropriate response from competing outcomes. Such higher‐order processes are likely to involve conflict monitoring, context representation and decision making, among other abilities, which we will refer to as task‐relevant inhibitory processes. To more comprehensively investigate brain regions associated with MSIT performances in OCD patients, we re‐examined our prior experiment with a novel analysis method that is suitable for modeling brain network dynamics at a broader systems level with fMRI [Calhoun et al., 2008]. Specifically, we set out to investigate four large‐scale functional networks whose activities are consistently and differentially modulated during the performance of demanding fMRI tasks [Smith et al., 2009; Toro et al., 2008]. These networks comprise interacting territories of sensorimotor, limbic and association cortices that are considered broadly relevant for psychomotor function (i.e., sensorimotor network), interoception and task set maintenance (i.e., paralimbic network), ‘top‐down’ attentional control processes (i.e., dorsal attention network), and self‐referential mental activity (i.e., default mode network) [Dosenbach et al., 2008; Dosenbach et al., 2006; Fox et al., 2006; Greicius et al., 2003; Harrison et al., 2008a; Seeley et al., 2007a; Sridharan et al., 2008]. Profiling such networks with fMRI has proven especially relevant in other neuropsychiatric disorders, such as schizophrenia and Alzheimer's disease [Calhoun et al., 2008; Pujol et al., 2009a; Rombouts et al., 2009; Seeley et al., 2007a], although currently this approach has not been extended to patients with OCD.
Of particular interest to this study is the prior observation by Pujol et al., [ 1999] of distinct differences between OCD patients and healthy subjects in the temporal profile of brain activity evoked during the transition between fMRI resting and cognitive task performance periods. In this study, OCD patients exhibited greater apparent response modulation during the onset of task performance periods from a resting baseline and a diminished suppression of this activation following task completion. These observations combined were related to patients' symptom severity. We sought to investigate this phenomenon more thoroughly in the current work in line with the general prediction that such ‘transition’ periods may be particularly relevant to the expression of functional network alterations in OCD patients. Recent fMRI studies in patients with schizophrenia and healthy subjects emphasize, in particular, paralimbic regions including the anterior insular and anterior cingulate cortex as highly responsive during such rest to task transitions [Dosenbach et al., 2006; Fox et al., 2005a; Fox et al., 2005b]. Although we did not previously explore this phenomenon in association with MSIT performance, our work has provided strong evidence for an involvement of these regions in meditating the general performance of this task, as well as corresponding functional alterations in patients with OCD [Yücel et al., 2007b].
MATERIALS AND METHODS
Subjects
Seventeen OCD patients (8 female), recruited from general community through advertisements in local newspapers and community services, were matched to nineteen (9 female) healthy subjects from a larger sample, and correspond to the aforementioned study by Yücel et al., [ 2007b]. All patients were required to have a current IQ >80, to be medication free or stable on their medication dose for at least 1 month and to have no other current Axis I psychiatric diagnosis. All subjects with a history of significant head injury (i.e., loss of consciousness for 5 minutes, hospitalization requiring a one‐night stay, or significant post‐concussion syndrome), neurologic disease or incidental findings on MRI (assessed by a neuroradiologist), electroconvulsive therapy, impaired thyroid function, and corticosteroid use were excluded. All the subjects gave written informed consent to participate in this study, which was approved by the Melbourne Health Research and Ethics Committee.
Patients with OCD and healthy subjects were matched in age, sex, education, and general intelligence such that there were no significant differences between them (Table I). The number of regular tobacco smokers was identical in both groups (n = 7) and there were no significant differences in the total years of tobacco consumption between these subgroups. In addition, the groups were recruited from similar suburbs within greater metropolitan Melbourne (Australia) and both their employment status (i.e., unemployed, full time, part‐time/casual, student and home duties/house work) and source of financial support (i.e., parent, other family/friends, full time work, part time work, government benefits, other) did not statistically differ between them. Two patients were excluded from the previous sample of n = 19, because of excessive head motion (>2 mm) during fMRI associated with the first block of resting scans (see below), which was excluded in prior work. At the time of scanning, patients were moderately symptomatic (as scored on the Yale‐Brown Obsessive‐Compulsive Scale; YBOCS; Goodman et al., 1989] and characterized predominantly by contamination and checking compulsions (indexed using the Padua Inventory; Sanavio, 1988]. There were no patients with prominent hoarding symptoms. Patients also had moderate levels of cognitive and affective symptoms of depression and physiological and psychological symptoms of anxiety (measured by the Beck Depression and Beck Anxiety Inventories; BDI, BAI; Beck et al., 1979; Beck and Steer, 1990]. Past history of depression was not considered an exclusion criteria if it occurred after an original diagnosis of OCD. Diagnoses were established using the Structured Clinical Interview for DSM‐IV Axis I disorders (including impulse spectrum disorders), Patient Edition [First et al., 1998]. Healthy subjects also underwent a Structured clinical interview for DSM‐IV Axis I disorders, Non‐patient Edition [First et al., 2007]. No control subject had an Axis I or II disorder, and no patient had comorbid Axis I or II disorders. General Intelligence (IQ) was estimated using the Wechsler Abbreviated Scale of Intelligence [Wechsler, 1999].
Table I.
Sample characteristics
| Characteristic | Healthy subjects (n = 19) | OCD patients (n = 17) |
|---|---|---|
| Mean (SD), range | Mean (SD), range | |
| Age, y | 30.6 (7.2), 22–48 | 32.8 (10.8), 17–52 |
| Sex, M/F, no. | 10/9 | 8/9 |
| Handedness, right/left, No. | 19/0 | 17/0 |
| Formal education, years | 15.4 (2.6) | 14.6 (2.3) |
| Intelligence‐Verbal scale | 112.7 (10.1), 92–134 | 109.4 (6.7), 98–123 |
| Intelligence‐Performance scale | 115.1 (11.6), 93–132 | 108.4 (13.7), 83–127 |
| Intelligence‐Full scale | 115.5 (10.3), 98–130 | 109.9 (9.6), 93–126 |
| Age at onset of OCD, y | N/A | 18.0 (9.0), 3–34 |
| Duration of illness, y | N/A | 14.8 (10.9), 2–36 |
| BAI | 5.5 (5.7), 0–20 | 10.2 (9.6), 0–30 |
| BDI‐II | 6.3 (5.8), 0–17 | 9.7 (6.7), 0–21 |
| Y‐BOCS‐Total | N/A | 16.5 (5.9), 7–24 |
| Y‐BOCS‐Obsessions | N/A | 7.7 (3.6), 0–14 |
| Y‐BOCS‐Compulsions | N/A | 8.8 (2.9), 4–13 |
| OCD symptom dimensions | ||
| PI‐Obsession Thoughts | N/A | 5.5 (5.2), 0–16 |
| PI‐Obsession Impulses | N/A | 1.3 (1.9), 0–7 |
| PI‐Contamination Compulsions | N/A | 12.9 (11.0), 0–36 |
| PI‐Checking Compulsions | N/A | 17.3 (14.1), 3–40 |
| PI‐Dressing/Grooming Compulsions | N/A | 3.6 (3.4), 0–10 |
| PI‐Total | N/A | 40.6 (31.1), 6–92 |
| Medication at study time | no. | |
| Medication‐naive | N/A | 9 |
| Fluoxetine | N/A | 1 |
| Fluvoxamine | N/A | 1 |
| Citalopram | N/A | 1 |
| Clomipramine | N/A | 3 |
| Venlafaxine | N/A | 1 |
| Paroxetine | N/A | 1 |
BAI, Beck Anxiety Inventory; BDI‐II, Beck Depression; OCD, obsessive‐compulsive disorder; WAIS, Wechsler Adult Intelligence Scale; Y‐BOCS, Yale‐Brown Obsessive‐Compulsive Scale; Inventory; SSRI, selective serotonin reuptake inhibitor.
* P < .05
Multisource Inference Task
A detailed overview of the Multisource Interference Task (MSIT) and its specific implementation as an fMRI protocol appeared in Bush and Shin [ 2006]. Briefly, the MSIT combines multiple dimensions of other cognitive interference tasks (i.e., Stroop, Simon and Flanker effects) to evoke goal‐directed cognitive and response inhibitory control processes and activation of distributed cingulate, frontal, parietal, and subcortical regions. To date, the MSIT has been most extensively used to study anterior cingulate/medial wall function in healthy and psychiatric populations [Bush et al., 2008; Harrison et al., 2007a; Heckers et al., 2004; Stern et al., 2009; Yücel et al., 2007b; Yücel et al., 2007c].
To perform the task, subjects view sets of three numbers from 0 to 3, presented in strings of 3, with one number always being different from the other two. Subjects are instructed to indicate the identity (not the position) of the number that is different by pressing the appropriate button on a response box. Responses are made with one of three fingers: the index finger to indicate 1, the middle finger to indicate 2, and the ring (fourth) finger to indicate 3. During congruent (C) task trials, the number always matches the position on the response box and is flanked by the number 0. During incongruent (I) task trials, the number never matches the response position and is flanked by incongruent numbers.
Figure 1A illustrates the MSIT design employed in the current study, an example stimulus configuration of its main trial types, as well as a typical group functional activation map resulting from MSIT performance. As in other studies, the activation map presented in Figure 1B was estimated from a conventional subtraction analysis of regional brain activation differences when comparing the higher‐demand ‘incongruent trials’ versus lower‐demand ‘congruent trials’.
Figure 1.
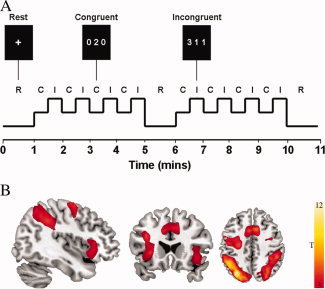
A: Multisource Interference Task (MSIT): example stimulus configuration of its main trial types. B: Group functional activation map resulting from MSIT performance in the healthy subject group (n = 19). As in other studies, results were estimated from a conventional subtraction analysis of regional brain activation differences when comparing the high‐demand ‘incongruent trials’ versus low‐demand ‘congruent trials’ (P < 0.05, false discovery rate (FDR) corrected with a minimum cluster extent [K E] of 10 voxels). [Color figure can be viewed in the online issue, which is available at wileyonlinelibrary.com.]
Before scanning, all subjects completed a practice run of the task consisting of 1 block of 12 congruent trials and 1 block of 12 incongruent trials. Subjects were informed that the scan would begin and end with resting fixation (R) for 60 s, with an additional resting block occurring at the halfway point of task performance. In between these resting periods, subjects completed 8 alternating block pairs of congruent and incongruent trials (i.e., 16 blocks) lasting 30 s per block. Each task segment of four C and I block pairs lasted 4 min. Stimulus and interstimulus intervals were 2000 and 500 milliseconds (ms), respectively. For all trials, subjects were instructed to answer as quickly and accurately as possible. Behavioral reaction times (RTs) and percentage error scores were recorded via a notebook computer. Analyses of performance data were conducted using repeated‐measures ANOVA with task condition (C and I blocks) as the within‐subjects effect and group (healthy subjects, OCD patients) as the between‐subjects effect. Response errors were calculated by summing all commission (e.g., responding 1′ when the correct answer was 2′) and omission errors (missed responses) across the congruent and incongruent trials. The response error variable was log 10‐transformed to ensure normality of distribution [Tabachnick, 2001]. Interference effects were calculated by subtracting the mean RT for the congruent trials across all blocks from the mean RT of the incongruent trials across all blocks.
Image Acquisition and Preprocessing
Before scanning, subjects were introduced to a mock scanner to familiarize them with the MRI environment. Following the mock session, subjects were taken to the actual scanner and had their head fixed on the table using a Velcro® strap over the forehead. A 3 Tesla GE Signa Horizon LX whole body scanner (General Electric, Milwaukee, WI, USA) equipped with single‐shot echo planar imaging software was used. Functional sequences consisted of gradient recalled acquisition in the steady state (time of repetition [TR], 3000 ms; time of echo [TE], 40 ms; pulse angle, 60°) within a field of view of 24 cm, with a 128 × 128‐pixel matrix, producing voxel sizes of 1.875 × 1.875 × 4.0 millimeters (mm). Twenty‐five interleaved slices (no gap), parallel to the anterior‐posterior commissure (AC‐PC) line, were acquired to cover the whole‐brain for all functional sequences. The first four (additional) images in each run were discarded to allow the magnetization to reach equilibrium. The functional time‐series consisted of 220 consecutive image volumes obtained over 11 minutes.
Imaging data were transferred and processed on a Linux platform running MATLAB version 7 (The MathWorks, Natick, Mass.). Image preprocessing was performed in SPM5 (http://www.fil.ion.ucl.ac.uk/spm/), and involved motion correction, spatial normalization and smoothing using a Gaussian filter (full‐width, half‐maximum, 8 mm). Motion correction was performed by aligning (within‐subject) each time‐series to the first image volume using a least‐squares minimization and a 6‐parameter (rigid body) spatial transformation. Data were normalized to the standard SPM‐EPI template and resliced to 3 mm isotropic resolution in Montreal Neurological Institute (MNI) space.
Functional Network Analysis
Several validated methods have been provided over the past decade that permit characterization of large‐scale functional brain networks from blood oxygenation‐level‐dependent (BOLD) fMRI experiments, including spatial independent component analysis (ICA); for historical and technical reviews see [Calhoun et al., 2008; Calhoun et al., 2009; McKeown et al., 2003]. Briefly, ICA is a data‐driven (unconstrained) statistical method that, when applied to fMRI experiments, is able to decompose fMRI time‐series into temporally coherent functional networks that are maximally spatially independent. The consistency of the identified functional networks across a range of imaging contexts and subject populations, together with the strong anatomical plausibility of findings, has made it a compelling means to assess large‐scale brain systems with fMRI [Smith et al., 2009]. Further, as a data‐driven approach, ICA is able to estimate the representative (i.e., average) temporal signature of activity fluctuations of a network, without the need to predict such fluctuations using hypothetical models (see examples in Calhoun et al., 2009]. ICA is therefore in principle an exploratory data analysis approach. ICA‐derived functional networks are also estimates of “functional connectivity”, or “the temporal correlation between remote neurophysiological measurements” [Friston et al., 1993]. In the case of spatial ICA, functionally connected brain regions or voxels within a spatial network are defined by their same dependency of temporal variation, which is estimated in the higher‐order or complete statistical sense [Calhoun et al., 2009; Rajapakse et al., 2006]. In this work, we operationalize the term “functional connectivity” to refer to task‐related changes in the strength of temporally correlated activity of brain regions that also demonstrate significant functional connectivity in the absence of specific tasks; i.e., rest [see Harrison et al., 2008a].
In this study, ICA was performed using the Group spatial ICA for fMRI Toolbox (GIFT v2.3f: http://icatb.sourceforge.net/) run on Matlab 7, using methods and algorithms described at length elsewhere [Calhoun et al., 2001; Calhoun et al., 2004]. Our approach to compare task‐relevant functional network activities in OCD patients and healthy subjects was two‐fold (summarized in Supporting Information Figure 1). First, we performed separate ICA estimations for each group with the intention of maximally discriminating the spatiotemporal properties (spatial maps and time‐courses) of our four networks of interest between the groups. In other words, by performing ICA separately we sought to obtain ‘best fit’ estimations of the networks in each group to be further compared. This analysis was then supplemented by a combined ICA of both groups that was blind to group membership and thus provided an averaged estimation of each network. By contrasting results from both approaches, we were able to test for differences in network activity corresponding to task‐related time‐course variations that were potentially distinct and shared in both groups.
For the separate and combined assessments, the dimensionality of the fMRI data and the optimal number of independent components to be estimated was determined using the minimum description length (MDL) criterion in GIFT [Li et al., 2007], after subject‐wise data concatenations. Principal component analysis (2 reduction steps) was then used to reduce individual subject data in dimensionality (for computational feasibility) to the number of components estimated by the MDL criterion. Group estimation of spatially independent sources was then performed using the Infomax algorithm. During a final stage of back‐reconstruction to the original dimensionality, individual subject spatial activity maps and time courses were estimated using the group solution to accurately represent the subject‐to‐subject variability existing in the data. The resulting single‐subject time course amplitudes were then calibrated (scaled) using the raw data to reflect percent signal strength. In this process, the estimated time course was treated as the model and was fitted to the raw data using an intercept term. This fit was then used to scale (or normalize) the component images into z‐score units also reflecting the data's deviation from the mean, thus, enabling the grouping components across subjects to produce group component maps and group‐average time courses as well as second‐level (subtractive or conjunctive) random effects analyses.
Identification and Comparison of Functional Networks
From the separate and combined ICA assessments, task‐related modulation of our four functional networks of interests was identified, with each network being represented as a distinct spatial map (independent component) and associated time‐course. These networks were discriminated from other common ‘lower order’ sensory networks encompassing primary and secondary visual and auditory cortices, which also showed some modulation by the task demands. All components were sorted on the basis of the multiple regression of each component's time course with the timing of the stimulus paradigm (i.e., rest, congruent, and incongruent conditions) and assessed by examining the R 2 value. Three of the networks of interest represented the most positively correlated independent components to the MSIT task design and one was most negatively correlated (for details see Supporting Information Table I). The remaining ‘lower order’ networks showed reduced loadings to the task design (see Supporting Information Table I) and were not subject to any further analysis. Representation of the four networks in the current experiment reproduced their characteristic anatomy as described across many recent studies using ICA and other connectivity‐sensitive analysis approaches [e.g., see Beckmann et al., 2005; Biswal et al., 1995; Damoiseaux et al., 2006; De Luca et al., 2006; Dosenbach et al., 2006; Fox et al., 2006; Greicius et al., 2003; Harrison et al., 2008a; Harrison et al., 2008b; Pujol et al., 2009b; Seeley et al., 2007b; Sridharan et al., 2008]. The anatomy of each network is described in detail below.
For the separate and combined ICA assessments, within‐ and between‐group statistical analyses were carried out for each respective network by entering each subject's independent component map (GIFT‐estimated z‐score image) into a two‐sample T‐test in SPM5. Within‐group analyses were thresholded at P < 0.01 false discovery rate (FDR, minimum cluster extent [K E] of 10 voxels) corrected. An uncorrected threshold of P < 0.001 was used to investigate between group differences. Between‐group comparisons were restricted to a large mask volume that included all significantly consistent within‐group effects at P FDR < 0.01–as determined by global conjunction analysis. For all analyses a minimum K E of 10 contiguous voxels was employed.
RESULTS
Task Performance
With respect to reaction time (RT), a robust main effect of condition was apparent (F 1, 33 = 456.17, P < 0.0001), in the absence of main group (F 1, 33 = 2.56, P = 0.19) or group‐by‐condition interaction effects (F 1, 33 = 0.23, P = 0.63). These effects were driven by a significantly faster mean RT to congruent trials than to incongruent trials in both groups, indicating strong and comparable interference effects (healthy subjects: RTcongruent = 865 ms [s.d. = 135 ms], RTincongruent = 1202 ms [s.d. = 188 ms]; OCD patients: RTcongruent = 935 ms [s.d. = 108 ms], RTincongruent = 1288 ms [s.d. = 154 ms]). Similarly, significantly fewer errors were made during congruent when compared with incongruent trials (F 1, 33 = 20.59, P < 0.0001), with no group effect (F 1, 33 = 0.25, P = 0.62) or group‐by‐condition interaction (F 1, 33 = 0.15, P = 0.70). This indicate comparable accuracy between the groups (healthy subjects, errors: Congruent = 0.10% [s.d. = 0.32%], incongruent = 2.47% [s.d. = 2.95%]; patients: Congruent = 0.19% [s.d. = 0.42%], incongruent = 2.99% [s.d. = 4.00%]).
Identification of Functional Networks and Group Comparisons
Functional connectivity maps and associated time‐courses of the four networks of interest identified in OCD patients and healthy subjects are shown in Figure 2 (corresponding to separate ICA assessment), and Supporting Information Figure 2 (corresponding to combined ICA assessment). As evident from both ICA approaches, there was strong overlap in the functional anatomy of all networks between the two groups. Below, we focus on results obtained from the separate ICA approach given that no significant group differences were observed when we compared network activities estimated from the combined ‘common‐model’ approach.
Figure 2.
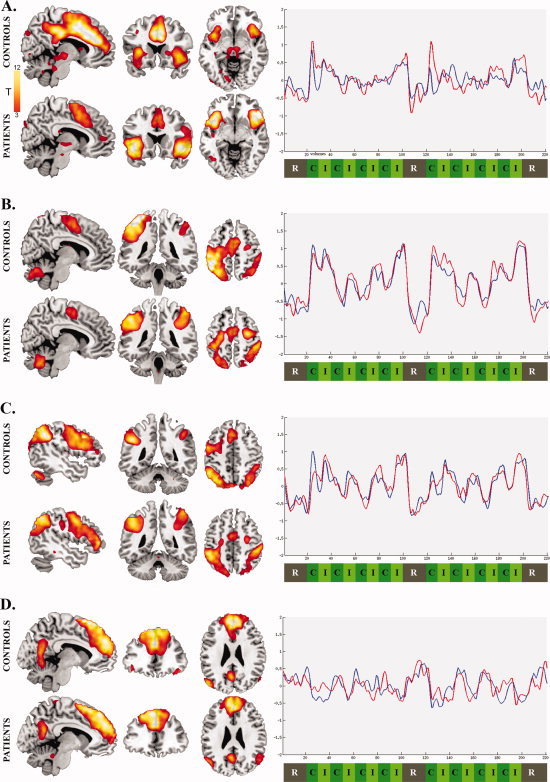
Functional connectivity maps and their corresponding time‐courses for the networks of interest identified in OCD patients (red lines) and healthy subjects (blue lines). Positive deflections in each network's time course represent periods of strongest functional connectivity among regions within each network, whereas negative deflections represents periods of reduced connectivity: A. Paralimbic Network (x = 7, y = 19, z = −7); B. Sensorimotor Network (x = 7; y = −40; z = 55); C. Dorsal Attention Network (x = −48, y = −46, z = 48); D. Default Mode Network (x = −9, y = 39, z = 26). Analyses were thresholded at P FDR < 0.01, K E = 10 voxels. Y‐axis indicates scaled signal change and x‐axis indicates the scan volume numbers. [Color figure can be viewed in the online issue, which is available at wileyonlinelibrary.com.]
For each network, we describe its characteristic functional anatomy in both groups and significant differences in observed functional connectivity of each network between the groups. All significant voxel‐wise results are reported in Table II (separate ICA) and Supporting Information Table II (combined ICA).
Table II.
Functional networks associated with MSIT performance (separate ICA)
| Healthy subjects | Anatomy a | Stats b | OCD patients | Anatomy a | Stats b | Difference c | Anatomy a | Stats c | |||||||||||
|---|---|---|---|---|---|---|---|---|---|---|---|---|---|---|---|---|---|---|---|
| x | y | z | KE | Z | x | y | z | KE | Z | x | y | z | KE | Z | |||||
| Paralimbic Network | Paralimbic Network | Paralimbic Network | |||||||||||||||||
| Dorsal anterior cingulate | 3 | 36 | 30 | 3858 | >8 | Dorsal anterior cingulate | 0 | 3 | 51 | 871 | 6.25 | Healthy subjects > OCD | |||||||
| 6 | 9 | 42 | >8 | /Supplementary motor | Dorsal anterior cingulate | 3 | 36 | 30 | 601 | 6.57 | |||||||||
| Anterior insular/Opercular cortices | −33 | 15 | 3 | 713 | 7.16 | Anterior insular/Opercular cortices | −42 | 15 | −9 | 987 | >8 | Mid‐cingulate cortex | 3 | −24 | 39 | 67 | 5.80 | ||
| Anterior insular/Opercular cortices | 42 | 27 | −3 | 1189 | >8 | ||||||||||||||
| Anterior insular/Opercular cortices | 39 | 27 | −3 | 689 | 6.69 | Motor/Premotor cortex | −45 | −3 | 39 | 278 | 5.19 | OCD > Healthy subjects | |||||||
| Medial frontal cortex | −27 | 42 | 33 | 60 | 4.97 | Anterior insular/Opercular cortices | 48 | 27 | −6 | 130 | 5.85 | ||||||||
| Medial frontal cortex | −33 | 33 | 33 | 336 | 6.30 | Red nucleus/Sub‐and Thalamic nuclei | 15 | −12 | 3 | 42 | 4.15 | ||||||||
| Medial frontal cortex | 33 | 57 | 30 | 317 | 5.76 | Anterior insular/Opercular cortices | −45 | 15 | −9 | 161 | 5.79 | ||||||||
| Pulvinar/Thalamic, Red and | −12 | −21 | −3 | 176 | 5.03 | Globus Pallidus | −12 | −3 | 3 | 39 | 5.42 | ||||||||
| Subthalamic nuclei | 12 | −18 | −3 | 4.46 | Caudate nucleus/Putamen | 18 | 12 | 3 | 43 | 4.78 | |||||||||
| Intraparietal cortex | −36 | −57 | 39 | 75 | 4.34 | Ventral medial frontal cortex | 3 | 48 | 6 | 31 | 4.36 | ||||||||
| Intraparietal cortex | 33 | −60 | 42 | 61 | 4.18 | ||||||||||||||
| Premotor/Frontal eye field | −27 | −12 | 51 | 59 | 4.02 | ||||||||||||||
| Cerebellum | 6 | −36 | −30 | 43 | 4.40 | ||||||||||||||
| Sensorimotor Network | Sensorimotor Network | Sensorimotor Network | |||||||||||||||||
| Sensorimotor cortex | −39 | −45 | 66 | 3778 | >8 | Somatosensory cortex | 42 | −57 | 63 | 1186 | 7.65 | Healthy subjects > OCD | |||||||
| Motor/Supplementary motor cortices | −39 | −30 | 66 | >8 | Sensorimotor cortex | 45 | −42 | 66 | 7.29 | Motor/Sensorimotor cortices | −18 | −30 | 69 | 11 | 4.55 | ||||
| Primary motor cortex | 45 | −33 | 39 | 7.06 | |||||||||||||||
| Motor/Supplementary motor cortices | 36 | −15 | 69 | 235 | 6.13 | Somatosensory cortex | −63 | −36 | 36 | 2250 | 7.54 | ||||||||
| Sensorimotor cortex | −45 | −48 | 48 | 6.76 | OCD > Healthy subjects | ||||||||||||||
| Somatosensory cortex | 33 | −24 | 72 | 4.71 | Motor cortex | −24 | −15 | 60 | 6.24 | Sensorimotor cortex | 51 | −27 | 33 | 78 | 4.36 | ||||
| Somatosensory/Superior parietal cortices | 21 | −75 | 60 | 558 | 6.01 | Superior parietal cortex | −27 | −63 | 51 | 5.07 | Primary motor cortex | 30 | −12 | 60 | 28 | 4.08 | |||
| Cerebellum | 3 | −78 | −30 | 316 | 5.65 | Supplementary motor cortex | 30 | −12 | 54 | 380 | 6.94 | ||||||||
| Cerebellum | 0 | −60 | −33 | 417 | 5.70 | ||||||||||||||
| Pulvinar/Thalamic nuclei | −15 | −24 | 3 | 28 | 4.62 | Pulvinar/Thalamic nuclei | −12 | −24 | 3 | 96 | 6.60 | ||||||||
| Fronto‐Parietal Network | Fronto‐Parietal Network | Fronto‐Parietal Network | |||||||||||||||||
| Superior parietal cortex | −48 | −48 | 36 | 1880 | >8 | Superior parietal cortex | −42 | −78 | 39 | 1774 | >8 | Healthy subjects > OCD | |||||||
| Superior parietal cortex | 30 | −75 | 30 | 864 | 6.26 | Superior parietal cortex | 36 | −84 | 42 | 153 | 4.65 | No differences | |||||||
| Dorsolateral prefrontal cortex | −48 | 18 | 36 | 2172 | >8 | Dorsolateral prefrontal cortex | −51 | 24 | 18 | 1923 | 7.55 | ||||||||
| Supplementary motor cortex | −3 | 12 | 54 | 5.37 | OCD > Healthy subjects | ||||||||||||||
| Supplementary motor cortex | −6 | 9 | 54 | 6.19 | Dorsolateral prefrontal cortex | 45 | 51 | 15 | 50 | 5.34 | No differences | ||||||||
| Dorsolateral prefrontal cortex | 51 | 33 | 27 | 13 | 4.11 | Insula | −42 | 15 | −6 | 14 | 3.81 | ||||||||
| Cerebellum | −45 | −69 | −30 | 136 | 6.80 | ||||||||||||||
| Caudate | 9 | 12 | 6 | 34 | 4.26 | ||||||||||||||
| Caudate | −12 | 15 | 3 | 124 | 3.70 | ||||||||||||||
| Insula | −33 | 21 | −3 | 79 | 4.89 | ||||||||||||||
| Default Mode Network | Default Mode Network | Default Mode Network | |||||||||||||||||
| Medial frontal cortex | 0 | 42 | 33 | 3589 | >8 | Medial frontal cortex | 0 | 42 | 33 | 3163 | >8 | Healthy subjects > OCD | |||||||
| Angular gyrus | −51 | −75 | 18 | 311 | >8 | Angular gyrus | −48 | −72 | 18 | 303 | 6.81 | Medial frontal cortex | 3 | 51 | 15 | 35 | 4.50 | ||
| Angular gyrus | 60 | −66 | 12 | 97 | 5.82 | Angular gyrus | 57 | −72 | 21 | 268 | 6.31 | Dorsal prefrontal cortex | 24 | 33 | 54 | 10 | 4.42 | ||
| Posterior cingulate | −3 | −63 | 21 | 528 | 6.63 | Posterior cingulate | −6 | −57 | 24 | 288 | 6.28 | ||||||||
| Operculum/Inferior frontal cortices | −45 | 30 | −15 | 197 | 4.83 | Operculum/Inferior frontal cortices | −51 | 18 | −3 | 75 | 5.60 | OCD > Healthy subjects | |||||||
| Medio‐temporal gyrus | 63 | −12 | −18 | 78 | 5.53 | Pre‐Supplementary motor cortex | 3 | 24 | 54 | 18 | 4.23 | ||||||||
| Operculom/Inferior frontal cortices | 48 | 33 | −18 | 69 | 5.89 | Medio‐temporal gyrus | −51 | −18 | −18 | 13 | 3.90 | ||||||||
| Supplementary motor cortex | −12 | 15 | 57 | 19 | 4.05 | ||||||||||||||
| Caudate nucleus | 15 | 6 | 12 | 84 | 5.28 | ||||||||||||||
| Thalamic nuclei | 6 | −9 | 3 | 19 | 3.96 | ||||||||||||||
Activity coordinates (x, y, z) are given in Montreal Neurological Institute (MNI) Atlas space.
Magnitude and extent statistics correspond to a minimum threshold of P FDR < 0.01 (whole‐brain corrected), K E (minimal cluster extent)= 10 voxels.
Results correspond to statistical differences of P < 0.001 (uncorrected), K E = 10 voxels.
Paralimbic Network
In both groups, this network comprised large regional clusters located in the frontal medial cortex (dorsal anterior cingulate‐to‐supplementary motor area), anterior insula‐to‐frontal operculum, and dorsal medial frontal cortex (Figure 2A). As indicated in Figure 2A, qualitative inspection of the network's time‐course suggests that there was a strong positive response of this network that coincided with the onset and offset of the two task block segments (i.e., the transition from rest to task). There was a tendency for OCD patients to show greater signal increase at the beginning of these two segments as well as greater relative signal suppression upon their completion. These apparent differences in time‐course modulation occurred in the context of quantitative differences in functional connectivity. Specifically, patients' network was characterized by greater task‐related functional connectivity of the anterior insular and frontal opercular region and reduced connectivity of the dorsal anterior cingulate cortex when compared with healthy subjects (Figure 3A and Table II).
Figure 3.
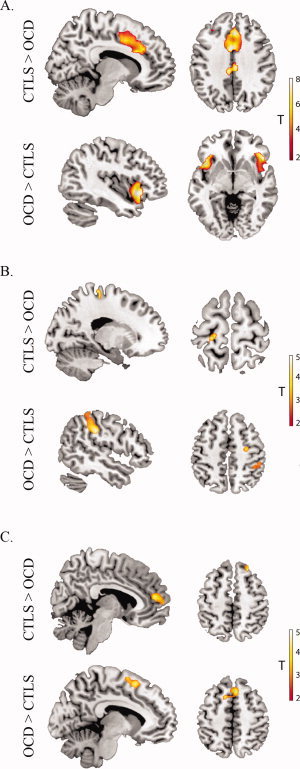
Significant functional connectivity differences between OCD patients and healthy subjects (CTLS). Analyses were thresholded at P < 0.001 uncorrected, K E= 10 voxels. A. Paralimbic Network (healthy subjects more than OCD x = 10, z = 37. OCD more than healthy subjects x = −42, z = 5); B. Sensorimotor Network (healthy subjects > OCD x = −19, z = 68. OCD more than healthy subjects x = 50, z = 50); C. Default Mode Network (healthy subjects more than OCD x= 6, z= 14. OCD more than healthy subjects x = 6, z = 54). [Color figure can be viewed in the online issue, which is available at wileyonlinelibrary.com.]
Sensorimotor Network
In both groups, this network comprised large regional clusters located in the sensorimotor and somatosensory cortices, and the supplementary motor area (Figure 2B). As indicated in Figure 2B, qualitative inspection of the network's time‐course suggests that there was a strong positive response of the network coinciding with the first congruent and incongruent block pair of each task segment, after which the response was greatest for incongruent blocks only. There was a tendency for OCD patients to show larger signal modulation during the task blocks and larger signal suppression after the completion of the two task segments. These apparent differences in time‐course modulation occurred in the context of quantitative differences in functional connectivity. Specifically, patients exhibited greater relative functional connectivity of the right sensorimotor and somatosensory cortices (Figure 3B and Table II).
Dorsal Attention Network
In both groups, this network comprised large regional clusters located in the medial and inferior prefrontal, superior parietal, and supplementary motor cortices (Figure 2C). As indicated in Figure 2C, qualitative inspection of network time‐courses suggests a stronger positive response of the network in healthy subjects during the initial block of the first task, after which both groups demonstrated a similar time‐course profile. There were no group differences observed in the regional functional connectivity of this network between patients and healthy subjects.
Default Mode Network
In both groups, this network comprised large regional clusters located in the ventral posterior cingulate cortex, medial frontal cortex and inferior parietal cortex near the angular gyrus (Figure 2D). As indicated in Figure 2D, qualitative inspection of the network's time‐course suggests that there was a moderate negative response coinciding with the onset and offset of the two task block segments. Within each task segment, a consistent negative response of the network was evident during incongruent trial blocks. This negative response was more pronounced in control subjects, particularly in association with the onset of the first task block segment. This apparent group difference in time‐course modulation occurred in the context of quantitative differences in the strength of functional connectivity of this network in OCD patients and healthy subjects. Specifically, patients exhibited reduced functional connectivity of the medial and dorsal frontal cortex but increased functional connectivity of the presupplementary motor area when compared with healthy subjects (Figure 3D and Table II).
Brain‐Behavioral Correlations
As a supplementary analysis, we investigated the extent to which the strength of functional connectivity of specific regions of interest from each network demonstrated linear associations with behavioral measures of task performance (i.e., errors and RT interference) and patients' clinical characteristics (i.e., total YBOCS, BAI and BDI scores). Two representative regional clusters were selected for each network: dorsal anterior cingulate and right anterior insular cortex (paralimbic network); primary motor and left sensorimotor cortex (sensorimotor network); left superior parietal and dorsolateral prefrontal cortex (dorsal attention network); ventral posterior cingulate; and the medial frontal cortex (default mode network). These regions typically demonstrated the strongest statistical magnitude and/or cluster extent within each connectivity pattern and were chosen as major representative anatomical nodes of each network. Functional data were extracted using the volume‐of‐interest function in SPM5, which estimated the first eigenvariate of all voxel values for each subject calculated from a 5 mm sphere centered on each regional cluster maxima. For healthy subjects, a positive linear correlation was suggested between the strength of functional connectivity of the right anterior insular cortex (paralimbic network) and the extent of RT interference during MSIT performance (Pearson's r = 0.54, P = 0.01 uncorrected). By contrast, the strength of functional connectivity of this same region in patients correlated with scores on the Beck Anxiety Inventory (BAI, r = 0.49, P = 0.05 uncorrected) but not parameters of MSIT performance. Patient's global symptom severity (total YBOCS score) did not correlate with activity in any of the selected regions. Although these correlations are consistent with previous findings suggesting a critical role of right anterior insula cortex in autonomic arousal and subjective feelings [e.g., Critchley, 2009; Craig, 2009], they do not survive to an appropriate correction for multiple‐comparisons, and thus, should be interpreted cautiously.
Confirmatory fMRI Analysis
As reported above, the most prominent functional difference observed between patients and healthy subjects occurred for the paralimbic network, with OCD patients showing relatively heightened anterior insula and reduced dorsal anterior cingulate functional connectivity. This pattern of alteration appears to map onto specific differences in the response of this network in patients to the onset and offset periods of the task block segments, although our ICA approach was not designed to confirm this observation quantitatively. To do so, we performed further confirmatory analysis of the rest‐task transition periods and corresponding functional activations between the two groups using the general linear model framework in SPM5. A single‐subject (first‐level) design matrix was constructed that modeled the time‐series with a boxcar function whose length corresponded to a duration of 12 s (1TR before and 3TR after each task block onset or offset), convolved with canonical hemodynamic response function and its temporal derivative (using a 128 s high‐pass filter). The resulting first‐level contrast images for each subject were then carried forward to random‐effects group analysis (second‐level, two sample T‐test). To compare the groups, we employed a statistical threshold of P < 0.001 (uncorrected, K E = 10 voxels). As presented in Figure 4, we observed significantly greater activation of posterior and anterior insular cortices and frontal operculum in patients. No corresponding differences between the groups with respect to the dorsal anterior cingulate cortex were shown by this analysis.
Figure 4.
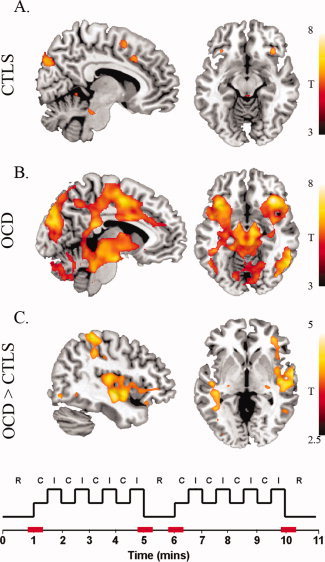
Confirmatory rest‐to‐task and task‐to‐rest transition periods analysis. Periods of interests are represented in red in the stimulus configuration example. A and B: With group results (P < 0.01FDR, K E 10 voxels) revealed significant transition period activation of the dorsal anterior cingulate cortex and anterior insular‐frontal operculum in both groups. Additional activations were observed in areas of the substantia nigra, dorsal pons, left globus pallidus, occipital and parietal cortices. OCD patients showed additional activation in areas of the thalamus, subthalamic nuclei, putamen, posterior insula, intraparietal, premotor/motor cortex and cerebellum. C: A between groups comparison (displayed at a minimum t‐value of 2.5) indicated heightened activation of the right posterior insula, superior temporal gyrus and anterior insula‐frontal operculum in OCD patients. [Color figure can be viewed in the online issue, which is available at wileyonlinelibrary.com.]
To specifically test if the above functional differences corresponded to overt differences in task performance between patients and healthy subjects, we reanalyzed task RT and accuracy data that corresponded to the first (congruent) and the last (incongruent) trials of the blocks. Thus, although in previous RT analyses patients did not show a main‐effect of RT (i.e., general RT slowing) when compared with control subjects, this additional analysis tested for a discrete general RT difference between the groups that corresponded to the rest‐task transition periods of interest (see Figure 4). Results indicated slowed RTs in OCD patients compared with healthy subjects when considering both correct and incorrect trial responses (healthy subjects: RT = 1112 ms [s.d. = 189 ms]; OCD patients: RT = 1277 ms [s.d. = 129 ms]; t(34) = 3.017; P < 0.01) and correct responses alone (healthy subjects: RT = 1168 ms [s.d. = 206 ms]; OCD patients: RT = 1302 ms [s.d. = 168 ms]; t(34) = 2.115; P = 0.04). There were no differences in the accuracy of these single‐trial responses (>85%) between the groups.
DISCUSSION
There is growing interest in the use of neuroimaging to investigate the pathophysiology of OCD that considers, but is not restricted to, corticostriatal networks. In particular, recent studies that have assessed structural brain networks in OCD patients have identified abnormalities of frontal, parietal, cingulate, and cerebellar regions not traditionally emphasized in relation to the disorder [Menzies et al., 2007; Pujol et al., 2004; Soriano‐Mas et al., 2007]. In this study, we used fMRI combined with a validated task of cognitive control (MSIT) and a multivariate statistical method to assess multiple functional networks encompassing these broad cortical regions in OCD. Overall, the nature of observed functional differences between patients and control subjects was both rich and complex, with OCD patients demonstrating relative increases and decreases in regional network connectivity. Moreover, while certain differences occurred during specific task‐relevant inhibitory processes, others appeared during general aspects of task performance associated with the shift of cognitive control between resting and task blocks. In this context, the observed alterations in OCD patients cannot be summarized as a uniform pattern of hyper‐ or hypo‐connectivity, but rather a dynamic set of functional changes that reflected all discrete aspects of task performance.
Consistent with recent fMRI studies of brain connectivity, we identified four predominantly cortical networks that were consistently and differentially modulated by MSIT performance. Their observed segregation into sensorimotor, paralimbic, dorsal attention and default mode networks, respectively, has now been generalized across diverse imaging contexts, indicating that they represent coherent large‐scale brain systems that are well suited to measurement with fMRI [Smith et al., 2009]. In this study, independent component analysis (ICA) was used to characterize and compare the common and distinct functional response of these networks between OCD patients and healthy subjects. In comparing the results of both approaches, we observed that patients differed from healthy subjects not in the overall response of the networks during task performance, but primarily in association with discrete task stages reflecting both general goal‐directed allocation of cognitive resources (e.g., rest to task transitions) and task‐specific (e.g., congruent to incongruent) inhibitory processes. To reiterate, the absence of group differences with respect to the combined ICA model indicated that the overall response of each network during task performance was mostly equivalent between the groups. By contrast, when modeling the networks distinctly in each group with separate ICA models, we did identify significant functional connectivity differences. Because it was established that these differences were not attributable to common variations of each network's time‐course, there is reason to infer that these differences are most likely driven by the discrete variations in each network's time‐course between the groups, as represented by the separate models (i.e., Figure 2). As the majority of studies to date have not been concerned with depicting such discrete versus common temporal variations in brain responses to fMRI tasks, the current results provide a novel view of brain functional systems in OCD that complements prior work.
Consistent with other functional connectivity studies [Dosenbach et al., 2007; Seeley et al., 2007b; Sridharan et al., 2008], activity of the dorsal anterior cingulate and anterior insula‐frontal operculum were closely functionally interrelated during MSIT performance. Interestingly, during periods of sequential cognitive task performance, these regions demonstrate a unique temporal profile of activity that is characterized by onset, sustained, and offset responses that mark the beginning, duration and end of task performance periods, respectively [Dosenbach et al., 2008; for a review see Dosenbach et al., 2008]. This observation was replicated in the current study and appeared to distinguish OCD patients and healthy subjects with respect to their engagement in MSIT performance. According to recent data, such activity may represent a specific cognitive control mechanism that supports adaptive and stable task performance, particularly with regards to maintaining active task goals [for a review see Dosenbach et al., 2008]. An alternative, but not necessarily exclusive model of paralimbic network function suggests that these regions represent major cortical nodes of a ‘central autonomic network’ supporting autonomic arousal and interoceptive awareness [Craig, 2009; Critchley et al., 2004]. According to this model the anterior insula‐frontal operculum represents the conscious awareness of autonomic and visceral responses, with a right hemisphere dominance, and the dorsal anterior cingulate cortex mediates and integrates changes in sympathetic arousal states with volitional and cognitive‐evaluative processes [Craig, 2009; Critchley et al., 2004].
OCD patients showed altered functional connectivity of the paralimbic network, characterized by heightened connectivity in the anterior insular‐opercular region bilaterally, and reduced connectivity of the dorsal anterior cingulate cortex. Qualitatively, activity of the paralimbic network in patients showed a greater increase during the onset of task segments, and more prominent signal suppression upon task segment completion. According to the “cognitive control” model this observation may indicate a specific deficit in the implementation of a task set in OCD patient. Dosenbach et al., [ 2006] recently linked increased paralimbic activity to task onset and offset periods with increased response errors in task performance in a group of healthy subjects, whereas we observed significantly slowed RT responses in OCD patients. According to the “interoception model” the pattern of insula activity could instead be interpreted as representing a greater experience of autonomic arousal in patients with respect to the demanding rest to task transition periods. Without psychophysiological indices it is difficult to validate these notions, although we were able to constrain this observation further by performing a complementary analysis that was restricted to these brief task transition periods. From this analysis, we observed heightened activation in the posterior and anterior regions of the right insular cortex in OCD patients when compared with healthy subjects. The addition of posterior ‘primary viscerosensory’ insular cortex to this pattern adds weight to the suggestion that these task periods may have provoked a heightened experience of autonomic arousal. As a related finding, we also observed that patients' general level of self‐reported anxiety at the time of scanning predicted their level of engagement of the right anterior insular cortex, whereas for healthy subjects it correlated with task performance. These data highlight a novel role for the insular cortex in relation to cognitive task performance in OCD patients that may be very relevant to consider in other experimental contexts, such as emotional and symptom provocation studies [Mataix‐Cols et al., 2004].
As distinct from the paralimbic network, the sensorimotor and dorsal attention networks appeared more clearly modulated by the specific demands of the incongruent task blocks on inhibitory control processes. Accordingly, the topography of these networks generally recapitulates the results of conventional activation studies of this same task [Bush et al., 2000; Bush and Shin, 2006; Yücel et al., 2007a]. For the sensorimotor network, both groups exhibited a positive response during the first congruent and incongruent block in each task segment, but only for incongruent blocks thereafter, suggesting adaptation to task demands. The distinction between groups in this apparent pattern of response was most obvious for the second task segment and, overall, occurred in the context of enhanced functional connectivity of the right primary and sensorimotor regions in OCD patients and a small cluster of reduced connectivity of the left primary motor cortex compared with healthy subjects.
One straightforward interpretation of the above is that the recruitment of extended and bilateral sensorimotor regions in OCD patients during task performance reflects compensatory processes enacted to cope with task demands, which partially overlaps with prior observations [Yücel et al., 2007b]. Alternatively, this finding may relate to other evidence for heightened motor system excitability in OCD, which has been suggested in some instances to have more primary as opposed to compensatory relevance to OCD pathophysiology. In agreement with this hypothesis, electrocortical [Leocani et al., 2001] and transcranial magnetic stimulation (TMS) studies [Greenberg et al., 2000; Greenberg et al., 1998] have indicated a reduced neuronal inhibition in motor regions in OCD, presumed to result from core abnormalities in subcortical input modulation [Rossi et al., 2005]. Interestingly, it has been shown that normalization of sensorimotor activity is related to sustained clinical improvement, supposedly linked to the restoration of cortical and subcortical functional connectivity [Mantovani et al., 2006]. An assessment of the resting functional connectivity of this sensorimotor network in OCD patient would conceivably help to clarify the nature of observed alterations during task in fMRI studies, such as that reported here.
We observed minimal differences in the strength of functional connectivity of dorsal frontoparietal ‘attention’ regions between patients and healthy subjects during MSIT performance, despite some qualitative discrete differences in network responses to the incongruent task blocks. Numerous functional imaging studies have highlighted a role for this network, particularly dorsolateral prefrontal, superior parietal, and intraparietal cortices, in selective and sustained attention processes, in keeping with ‘top‐down’ control theories (reviewed in Corbetta et al., 2008]. From fMRI studies of cognitive task performance in OCD patients, evidence for functional alterations of these regions has been mixed, both with respect to the direction and interpretation of the findings. Gu et al. [2008] recently suggested that OCD patients display a lack of activation in dorsolateral, anterior cingulate, superior‐ and intra‐parietal cortices in the context of attentional set shifting. These results are partially consistent with those obtained using an affective switching task where patients showed decreased activation of the dorsolateral, anterior prefrontal, and left orbitofrontal cortex [Remijnse et al., 2006]. By comparison, heightened activation of anterior cingulate, prefrontal, and intraparietal regions has been reported in association with other attentionally demanding contexts, such as spatial working memory [van der Wee et al., 2003] and inhibitory response control task performance [Maltby et al., 2005; Ursu et al., 2003]. Together, these findings indicate a presumably major influence of task context on the nature of dorsal frontoparietal cortical alterations observed in functional magnetic resonance imaging (fMRI) studies of OCD patients. The current results might suggest that patients were able to manage the specific attentional demands of this task (e.g., sustained spatial attention) on such frontoparietal regions. It is possible that the simple block‐design nature of this task may have contributed to this result, as reflected behaviorally by the absence of task performance differences between patients and controls subjects. That is, by varying task conditions predictably in a sequential manner, the impact of specific task‐relevant inhibitory processes (i.e., task interference effects) may have been minimized.
In contrast to the aforementioned networks, which showed increased activity during incongruent blocks of the MSIT, the so‐called ‘default mode network’ showed decreased activity during more demanding task conditions. This modulation was particularly marked during the higher‐demand incongruent trials, and more consistently in healthy subjects. Such observations are in keeping with the characteristic ‘deactivation’ of this network during cognitive task performance, where it shows reliable modulation in high demand contexts and coherent activity during resting or lower‐demand task states [Harrison et al., 2008a; Raichle et al., 2001]. In broad terms, this deactivation phenomenon is thought to accompany the shift in one's attentional focus between such states, where there is a propensity for greater self‐directed mental activity at rest to an external focus of attention when performing tasks. It has been shown that the magnitude of deactivation increases with task difficulty [Lawrence et al., 2003; McKiernan et al., 2003] and when the occurrence of task‐independent thought is minimal [McKiernan et al., 2006]. On the other hand, when task‐independent thoughts occur during task performance (i.e., lapses), the magnitude of default mode network deactivation is weakened and task performance errors are precipitated [Christoff et al., 2009; Weissman et al., 2006]. Inspection of the temporal profile of default mode network functional connectivity to MSIT performance provides some insight as to how task‐related and unrelated processes may have been balanced throughout MSIT performance in healthy subjects and OCD patients.
In healthy subjects, the default mode network demonstrated reduced functional connectivity during the first pair of congruent and incongruent blocks in each task segment, and then for incongruent blocks thereafter. In effect, this response pattern opposes that observed for the sensorimotor network described above and suggests that the initial ‘lower‐demand’ congruent blocks, representing the first ‘task‐on’ periods after extended rest, had an equivalent functional impact on the default mode network as the incongruent task blocks. Though following a similar profile, the response of this network in OCD patients also demonstrated a clear distinction with patients showing a relative lack of network modulation during the initial pair of congruent‐incongruent task blocks in the first task. From such findings it could be suggested that patients' initial engagement in the task was accompanied by more persistent task‐unrelated mental activity that progressively resolved as task familiarity increased. Interestingly, in patients, this profile of default mode network activity corresponded to reduced functional connectivity of the medial frontal cortex. It has been previously shown that the magnitude of task related ‘deactivation’ of this region is modulated by subjects' initial anxious arousal to imaging task performance [Simpson et al., 2001]. Thus, at least partially, these results complement the heightened engagement of paralimbic regions in OCD patients, which we have also interpreted as a functional correlate of task‐related arousal. Compared to controls, OCD patients also demonstrated abnormal involvement of the presupplementary motor area as part of their broader pattern of default mode network functional connectivity. This region is more typically observed as a component of the dorsal attention network and, as such, may suggest some degree of altered default mode functional organization or functional interaction between these networks. Overall, as demonstrated in other neuropsychiatric disorders including schizophrenia [Harrison et al., 2007b; Pomarol‐Clotet et al., 2010] and Alzheimer's disease [Fleisher et al., 2009], investigating cognitive task‐related deactivation of default mode network regions in addition to regions/networks positively modulated by task demands appears relevant for interpreting potential brain‐behavioral differences identified between groups.
This study has some limitations. Recent imaging findings highlight the relevance of addressing the multidimensional nature of OCD symptoms [Mataix‐Cols et al., 2004]. Because of sample size we were unable to perform the appropriate statistical tests to determine whether our results could be related preferentially to one or another major symptom dimension or generalized to all patients with this disorder. Patients in this study had long average illness durations (∼13 years) and most were being actively treated with antidepressants. Therefore, the effects of chronic illness and medication, including the influence of other interventions (e.g., cognitive behavioural therapies, CBT) on our findings cannot be excluded. Although chronic SSRI treatment and CBT may be expected to normalize heightened activity of brain regions in OCD patients that were implicated in this study, such as the anterior cingulate [Nakao et al., 2005] and insular cortices [Lazaro et al., 2008], their influence on specific functional connectivity measurements requires further investigation in medicated and medication‐naïve cohorts. Other related influences that should also be controlled more rigorously in future studies of this kind include the regular caffeine and nicotine consumption, as well as neurohormonal levels [Weis et al., in press]. In addition, the MSIT engages a composite set of cognitive‐control processes. Further studies will be needed to investigate functional connectivity alterations in OCD patients in task contexts probing specific domains of cognitive‐control (i.e., cognitive and motor flexibility, working memory, top‐down attention control, etc.) to determine whether the current findings can be generalized more broadly. Finally, brain networks do not operate in isolation but dynamically interact across multiple spatial and temporal scales. While there is a growing appreciation of the potential for fMRI analysis approaches such as that used in the current study to measure directional (i.e., predictive) relationships between the activities of distributed large‐scale brain systems [Lahaye et al., 2003; Roebroeck et al., 2005], these measurements will require some further empirical validation, as recently discussed [Friston, 2009]. However, in the short term, studies may extend the current work by mapping our identified regions in a prospective manner using alternate approaches based on Psycho‐Physiological Interaction (PPI) analysis and Dynamic Causal Modelling [Friston, et al., 1997, 2003]. Such analyses were generally beyond the scope of the current work.
CONCLUSIONS
Taken together, the current findings provide a novel representation of large‐scale brain functional network dynamics in OCD patients. Interestingly, the overall nature of our functional observations has highlighted the potentially relevant influence of differential arousal states in OCD patients compared to healthy subjects during cognitive control, which may prove to have implications that are generalisable to other relevant imaging contexts, including those focusing on emotional and symptomatic features of OCD. Following earlier work by Pujol et al., [ 1999], we have observed that general features of task performance, such as switching between baseline (”task‐off“) and performance (”task‐on“) periods evoked an elevated response in arousal‐related brain regions in OCD patients. Interestingly, there is some evidence for a blunted response of such regions to task transition periods in patients with schizophrenia [Fox et al., 2005b]. It would therefore seem relevant that future studies of OCD patients consider these typically ignored general aspects of task performance and their potentially broader implications for fMRI studies of this disorder. One outstanding question may be to what extent do such changes provide a relevant index or marker of arousal‐related brain reactivity in OCD patients? Studies contrasting such phenomena in OCD patients and patients with other common anxiety disorders (e.g., generalized anxiety disorder) may be relevant to this end. With respect to arousal‐related brain regions, such as the insular and cingulate cortices, future studies would also benefit significantly from psychophysiological monitoring in conjunction with fMRI assessments. Work of this kind is likely to be relevant in informing ongoing debate regarding the current classification of OCD and other anxiety disorders with respect to unique versus shared pathophysiological mechanisms.
Supporting information
Additional Supporting Information may be found in the online version of this article.
Supporting Information Figure 1
Supporting Information Figure 2
Supporting Information
REFERENCES
- Adler CM, McDonough‐Ryan P, Sax KW, Holland SK, Arndt S, Strakowski SM ( 2000): fMRI of neuronal activation with symptom provocation in unmedicated patients with obsessive compulsive disorder. J Psychiatr Res 34: 317–324. [DOI] [PubMed] [Google Scholar]
- Alexander GE, DeLong MR, Strick PL ( 1986): Parallel organization of functionally segregated circuits linking basal ganglia and cortex. Annu Rev Neurosci 9: 357–381. [DOI] [PubMed] [Google Scholar]
- American Psychiatric Association (APA) ( 2000): Diagnostic and Statistical Manual of Mental Disorders. IV‐TR ed. Washington D.C: American Psychiatric Association. [Google Scholar]
- Beck AT, Steer RA, editors ( 1990): Beck Anxiety Inventory Manual. San Antonio: Psych Corp. [Google Scholar]
- Beck AT, Rush AJ, Shaw BF, Emery G ( 1979): Cognitive Therapy of Depression. New York: Guilford. [Google Scholar]
- Beckmann CF, DeLuca M, Devlin JT, Smith SM ( 2005): Investigations into resting‐state connectivity using independent component analysis. Philos Trans R Soc Lond B Biol Sci 360: 1001–1013. [DOI] [PMC free article] [PubMed] [Google Scholar]
- Biswal B, Yetkin FZ, Haughton VM, Hyde JS ( 1995): Functional connectivity in the motor cortex of resting human brain using echo‐planar MRI. Magn Reson Med 34: 537–541. [DOI] [PubMed] [Google Scholar]
- Breiter HC, Rauch SL, Kwong KK, Baker JR, Weisskoff RM, Kennedy DN, Kendrick AD, Davis TL, Jiang A, Cohen MS, Stern CE, Belliveau JW, Baer L, O'Sullivan RL, Savage CR, Jenike MA, Rosen BR ( 1996): Functional magnetic resonance imaging of symptom provocation in obsessive‐compulsive disorder. Arch Gen Psychiatry 53: 595–606. [DOI] [PubMed] [Google Scholar]
- Bush G, Luu P, Posner MI ( 2000): Cognitive and emotional influences in anterior cingulate cortex. Trends Cogn Sci 4: 215–222. [DOI] [PubMed] [Google Scholar]
- Bush G, Shin LM ( 2006): The Multi‐Source Interference Task: An fMRI task that reliably activates the cingulo‐frontal‐parietal cognitive/attention network. Nat Protoc 1: 308–313. [DOI] [PubMed] [Google Scholar]
- Bush G, Spencer TJ, Holmes J, Shin LM, Valera EM, Seidman LJ, Makris N, Surman C, Aleardi M, Mick E, Biederman J ( 2008): Functional magnetic resonance imaging of methylphenidate and placebo in attention‐deficit/hyperactivity disorder during the multi‐source interference task. Arch Gen Psychiatry 65: 102–114. [DOI] [PubMed] [Google Scholar]
- Calhoun VD, Adali T, Pearlson GD, Pekar JJ ( 2001): A method for making group inferences from functional MRI data using independent component analysis. Hum Brain Mapp 14: 140–151. [DOI] [PMC free article] [PubMed] [Google Scholar]
- Calhoun VD, Adali T, Pekar JJ ( 2004): A method for comparing group fMRI data using independent component analysis: application to visual, motor and visuomotor tasks. Magn Reson Imaging 22: 1181–1191. [DOI] [PubMed] [Google Scholar]
- Calhoun VD, Kiehl KA, Pearlson GD ( 2008): Modulation of temporally coherent brain networks estimated using ICA at rest and during cognitive tasks. Hum Brain Mapp 29: 828–838. [DOI] [PMC free article] [PubMed] [Google Scholar]
- Calhoun VD, Liu J, Adali T ( 2009): A review of group ICA for fMRI data and ICA for joint inference of imaging, genetic, and ERP data. Neuroimage 45( 1 Suppl): S163–S172. [DOI] [PMC free article] [PubMed] [Google Scholar]
- Chamberlain SR, Fineberg NA, Blackwell AD, Robbins TW, Sahakian BJ ( 2006): Motor inhibition and cognitive flexibility in obsessive‐compulsive disorder and trichotillomania. Am J Psychiatry 163: 1282–1284. [DOI] [PubMed] [Google Scholar]
- Chamberlain SR, Sahakian BJ ( 2007): The neuropsychiatry of impulsivity. Curr Opin Psychiatry 20: 255–261. [DOI] [PubMed] [Google Scholar]
- Christoff K, Gordon AM, Smallwood J, Smith R, Schooler JW ( 2009): Experience sampling during fMRI reveals default network and executive system contributions to mind wandering. Proc Natl Acad Sci USA 106: 8719–8724. [DOI] [PMC free article] [PubMed] [Google Scholar]
- Corbetta M, Patel G, Shulman GL ( 2008): The reorienting system of the human brain: From environment to theory of mind. Neuron 58: 306–324. [DOI] [PMC free article] [PubMed] [Google Scholar]
- Craig AD ( 2009): How do you feel–now? The anterior insula and human awareness. Nat Rev Neurosci 10: 59–70. [DOI] [PubMed] [Google Scholar]
- Critchley HD ( 2009): Psychophysiology of neural, cognitive and affective integration: fMRI and autonomic indicants. Int J Psychophysiol 73: 88–94. [DOI] [PMC free article] [PubMed] [Google Scholar]
- Critchley HD, Wiens S, Rotshtein P, Ohman A, Dolan RJ ( 2004): Neural systems supporting interoceptive awareness. Nat Neurosci 7: 189–195. [DOI] [PubMed] [Google Scholar]
- Damoiseaux JS, Rombouts SA, Barkhof F, Scheltens P, Stam CJ, Smith SM, Beckmann CF ( 2006): Consistent resting‐state networks across healthy subjects. Proc Natl Acad Sci USA 103: 13848–13853. [DOI] [PMC free article] [PubMed] [Google Scholar]
- De Luca M, Beckmann CF, De Stefano N, Matthews PM, Smith SM ( 2006): fMRI resting state networks define distinct modes of long‐distance interactions in the human brain. Neuroimage 29: 1359–1367. [DOI] [PubMed] [Google Scholar]
- Dosenbach NU, Fair DA, Cohen AL, Schlaggar BL, Petersen SE ( 2008): A dual‐networks architecture of top‐down control. Trends Cogn Sci 12: 99–105. [DOI] [PMC free article] [PubMed] [Google Scholar]
- Dosenbach NU, Fair DA, Miezin FM, Cohen AL, Wenger KK, Dosenbach RA, Fox MD, Snyder AZ, Vincent JL, Raichle ME, Schlaggar BL, Petersen SE ( 2007): Distinct brain networks for adaptive and stable task control in humans. Proc Natl Acad Sci USA 104: 11073–11078. [DOI] [PMC free article] [PubMed] [Google Scholar]
- Dosenbach NU, Visscher KM, Palmer ED, Miezin FM, Wenger KK, Kang HC, Burgund ED, Grimes AL, Schlaggar BL, Petersen SE ( 2006): A core system for the implementation of task sets. Neuron 50: 799–812. [DOI] [PMC free article] [PubMed] [Google Scholar]
- First MB, Spitzer RL, Gibbon M, Williams JB ( 1998): Structured Clinical Interview for DSM‐IV Axis 1 Disorders. Washington, D.C.: American Psychiatric Press. [Google Scholar]
- First MB, Spitzer RL, Gibbon M, Williams JB ( 2007): Structured Clinical Interview for DSM‐IV‐RS Axis 1 Disorders ‐ Non‐patient edition (SCID‐I/NP) New York: Biometrics Research, New York State Psychiatric Institute. [Google Scholar]
- Fleisher AS, Sherzai A, Taylor C, Langbaum JB, Chen K, Buxton RB ( 2009): Resting‐state BOLD networks versus task‐associated functional MRI for distinguishing Alzheimer's disease risk groups. Neuroimage 47: 1678–1690. [DOI] [PMC free article] [PubMed] [Google Scholar]
- Fox MD, Corbetta M, Snyder AZ, Vincent JL, Raichle ME ( 2006): Spontaneous neuronal activity distinguishes human dorsal and ventral attention systems. Proc Natl Acad Sci USA 103: 10046–10051. [DOI] [PMC free article] [PubMed] [Google Scholar]
- Fox MD, Snyder AZ, Barch DM, Gusnard DA, Raichle ME ( 2005a): Transient BOLD responses at block transitions. Neuroimage 28: 956–966. [DOI] [PubMed] [Google Scholar]
- Fox MD, Snyder AZ, McAvoy MP, Barch DM, Raichle ME ( 2005b): The BOLD onset transient: Identification of novel functional differences in schizophrenia. Neuroimage 25: 771–782. [DOI] [PubMed] [Google Scholar]
- Friston KJ, Buechel C, Fink GR, Morris J, Rolls E, Dolan RJ ( 1997): Psychophysiological and modulatory interactions in neuroimaging. Neuroimage 6: 218–229. [DOI] [PubMed] [Google Scholar]
- Friston KJ, Frith CD, Liddle PF, Frackowiak RS ( 1993): Functional connectivity: the principal‐component analysis of large (PET) data sets. J Cereb Blood Flow Metab 13: 5–14. [DOI] [PubMed] [Google Scholar]
- Friston KJ, Harrison L, Penny W ( 2003): Dynamic causal modelling. Neuroimage 19: 1273–302. [DOI] [PubMed] [Google Scholar]
- Goodman WK, Price LH, Rasmussen SA, Mazure C, Fleischmann RL, Hill CL, Heninger GR, Charney DS ( 1989): The Yale‐Brown obsessive compulsive scale. I. Development, use, and reliability. Arch Gen Psychiatry 46: 1006–1011. [DOI] [PubMed] [Google Scholar]
- Graybiel AM, Rauch SL ( 2000): Toward a neurobiology of obsessive‐compulsive disorder. Neuron 28: 343–347. [DOI] [PubMed] [Google Scholar]
- Greenberg BD, Ziemann U, Cora‐Locatelli G, Harmon A, Murphy DL, Keel JC, Wassermann EM ( 2000): Altered cortical excitability in obsessive‐compulsive disorder. Neurology 54: 142–147. [DOI] [PubMed] [Google Scholar]
- Greenberg BD, Ziemann U, Harmon A, Murphy DL, Wassermann EM ( 1998): Decreased neuronal inhibition in cerebral cortex in obsessive‐compulsive disorder on transcranial magnetic stimulation. Lancet 352: 881–882. [DOI] [PubMed] [Google Scholar]
- Greicius MD, Krasnow B, Reiss AL, Menon V ( 2003): Functional connectivity in the resting brain: A network analysis of the default mode hypothesis. Proc Natl Acad Sci USA 100: 253–258. [DOI] [PMC free article] [PubMed] [Google Scholar]
- Gu BM, Park JY, Kang DH, Lee SJ, Yoo SY, Jo HJ, Choi CH, Lee JM, Kwon JS ( 2008): Neural correlates of cognitive inflexibility during task‐switching in obsessive‐compulsive disorder. Brain 131( Part 1): 155–164. [DOI] [PubMed] [Google Scholar]
- Haber SN ( 2003): The primate basal ganglia: Parallel and integrative networks. J Chem Neuroanat 26: 317–330. [DOI] [PubMed] [Google Scholar]
- Harrison BJ, Pujol J, Lopez‐Sola M, Hernandez‐Ribas R, Deus J, Ortiz H, Soriano‐Mas C, Yücel M, Pantelis C, Cardoner N ( 2008a): Consistency and functional specialization in the default mode brain network. Proc Natl Acad Sci USA 105; 9781–9786. [DOI] [PMC free article] [PubMed] [Google Scholar]
- Harrison BJ, Pujol J, Ortiz H, Fornito A, Pantelis C, Yücel M. ( 2008b): Modulation of brain resting‐state networks by sad mood induction. PLoS ONE 3: e1794. [DOI] [PMC free article] [PubMed] [Google Scholar]
- Harrison BJ, Soriano‐Mas C, Pujol J, Ortiz H, Lopez‐Sola M, Hernandez‐Ribas R, Deus J, Alonso P, Yücel M, Pantelis C, Menchon JM, Cardoner N ( 2009): Altered corticostriatal functional connectivity in obsessive‐compulsive disorder. Arch Gen Psychiatry 66: 1189–1200. [DOI] [PubMed] [Google Scholar]
- Harrison BJ, Yücel M, Fornito A, Wood SJ, Seal ML, Clarke K, Pantelis C ( 2007a): Characterizing anterior cingulate activation in chronic schizophrenia: A group and single‐subject fMRI study. Acta Psychiatr Scand 116: 271–279. [DOI] [PubMed] [Google Scholar]
- Harrison BJ, Yücel M, Pujol J, Pantelis C ( 2007b): Task‐induced deactivation of midline cortical regions in schizophrenia assessed with fMRI. Schizophr Res 91: 82–86. [DOI] [PubMed] [Google Scholar]
- Harrison BJ, Yücel M, Shaw M, Kyrios M, Maruff P, Brewer WJ, Purcell R, Velakoulis D, Strother SC, Scott AM, Nathan PJ, Pantelis C, ( 2006): Evaluating brain activity in obsessive‐compulsive disorder: Preliminary insights from a multivariate analysis. Psychiatry Res 147: 227–231. [DOI] [PubMed] [Google Scholar]
- Heckers S, Weiss AP, Deckersbach T, Goff DC, Morecraft RJ, Bush G ( 2004): Anterior cingulate cortex activation during cognitive interference in schizophrenia. Am J Psychiatry 161: 707–715. [DOI] [PubMed] [Google Scholar]
- Lahaye PJ, Poline JB, Flandin G, Dodel S, Garnero L ( 2003): Functional connectivity: studying nonlinear, delayed interactions between BOLD signals. Neuroimage 20: 962–974. [DOI] [PubMed] [Google Scholar]
- Lawrence NS, An SK, Mataix‐Cols D, Ruths F, Speckens A, Phillips ML ( 2007): Neural responses to facial expressions of disgust but not fear are modulated by washing symptoms in OCD. Biol Psychiatry 61: 1072–1080. [DOI] [PubMed] [Google Scholar]
- Lawrence NS, Ross TJ, Hoffmann R, Garavan H, Stein EA ( 2003): Multiple neuronal networks mediate sustained attention. J Cogn Neurosci 15: 1028–1038. [DOI] [PubMed] [Google Scholar]
- Lazaro L, Caldu X, Junque C, Bargallo N, Andres S, Morer A, Castro‐Fornieles J ( 2008): Cerebral activation in children and adolescents with obsessive‐compulsive disorder before and after treatment: A functional MRI study. J Psychiatr Res 42: 1051–1059. [DOI] [PubMed] [Google Scholar]
- Leocani L, Locatelli M, Bellodi L, Fornara C, Henin M, Magnani G, Mennea S, Comi G ( 2001): Abnormal pattern of cortical activation associated with voluntary movement in obsessive‐compulsive disorder: An EEG study. Am J Psychiatry 158: 140–142. [DOI] [PubMed] [Google Scholar]
- Li YO, Adali T, Calhoun VD ( 2007): Estimating the number of independent components for functional magnetic resonance imaging data. Hum Brain Mapp 28: 1251–1266. [DOI] [PMC free article] [PubMed] [Google Scholar]
- Maltby N, Tolin DF, Worhunsky P, O'Keefe TM, Kiehl KA ( 2005): Dysfunctional action monitoring hyperactivates frontal‐striatal circuits in obsessive‐compulsive disorder: An event‐related fMRI study. Neuroimage 24: 495–503. [DOI] [PubMed] [Google Scholar]
- Mantovani A, Lisanby SH, Pieraccini F, Ulivelli M, Castrogiovanni P, Rossi S ( 2006): Repetitive transcranial magnetic stimulation (rTMS) in the treatment of obsessive‐compulsive disorder (OCD) and Tourette's syndrome (TS). Int J Neuropsychopharmacol 9: 95–100. [DOI] [PubMed] [Google Scholar]
- Mataix‐Cols D, Wooderson S, Lawrence N, Brammer MJ, Speckens A, Phillips ML ( 2004): Distinct neural correlates of washing, checking, and hoarding symptom dimensions in obsessive‐compulsive disorder. Arch Gen Psychiatry 61: 564–576. [DOI] [PubMed] [Google Scholar]
- McGuire PK, Bench CJ, Frith CD, Marks IM, Frackowiak RS, Dolan RJ ( 1994): Functional anatomy of obsessive‐compulsive phenomena. Br J Psychiatry 164: 459–468. [DOI] [PubMed] [Google Scholar]
- McKeown MJ, Hansen LK, Sejnowsk TJ ( 2003): Independent component analysis of functional MRI: What is signal and what is noise? Curr Opin Neurobiol 13: 620–629. [DOI] [PMC free article] [PubMed] [Google Scholar]
- McKiernan KA, D'Angelo BR, Kaufman JN, Binder JR ( 2006): Interrupting the “stream of consciousness”: An fMRI investigation. Neuroimage 29: 1185–1191. [DOI] [PMC free article] [PubMed] [Google Scholar]
- McKiernan KA, Kaufman JN, Kucera‐Thompson J, Binder JR ( 2003): A parametric manipulation of factors affecting task‐induced deactivation in functional neuroimaging. J Cogn Neurosci 15: 394–408. [DOI] [PubMed] [Google Scholar]
- Menzies L, Achard S, Chamberlain SR, Fineberg N, Chen CH, del Campo N, Sahakian BJ, Robbins TW, Bullmore E ( 2007): Neurocognitive endophenotypes of obsessive‐compulsive disorder. Brain 130( Part 12): 3223–3236. [DOI] [PubMed] [Google Scholar]
- Menzies L, Chamberlain SR, Laird AR, Thelen SM, Sahakian BJ, Bullmore ET ( 2008): Integrating evidence from neuroimaging and neuropsychological studies of obsessive‐compulsive disorder: The orbitofronto‐striatal model revisited. Neurosci Biobehav Rev 32: 525–549. [DOI] [PMC free article] [PubMed] [Google Scholar]
- Modell JG, Mountz JM, Curtis GC, Greden JF ( 1989): Neurophysiologic dysfunction in basal ganglia/limbic striatal and thalamocortical circuits as a pathogenetic mechanism of obsessive‐compulsive disorder. J Neuropsychiatry Clin Neurosci 1: 27–36. [DOI] [PubMed] [Google Scholar]
- Murray CJ, Lopez AD ( 1996): Evidence‐based health policy–lessons from the Global Burden of Disease Study. Science 274: 740–743. [DOI] [PubMed] [Google Scholar]
- Nakao T, Nakagawa A, Yoshiura T, Nakatani E, Nabeyama M, Yoshizato C, Kudoh A, Tada K, Yoshioka K, Kawamoto M, et al. ( 2005): Brain activation of patients with obsessive‐compulsive disorder during neuropsychological and symptom provocation tasks before and after symptom improvement: A functional magnetic resonance imaging study. Biol Psychiatry 57: 901–910. [DOI] [PubMed] [Google Scholar]
- Phillips ML, Marks IM, Senior C, Lythgoe D, O'Dwyer AM, Meehan O, Williams SC, Brammer MJ, Bullmore ET, McGuire PK ( 2000): A differential neural response in obsessive‐compulsive disorder patients with washing compared with checking symptoms to disgust. Psychol Med 30: 1037–1050. [DOI] [PubMed] [Google Scholar]
- Pomarol‐Clotet E, Canales‐Rodriguez EJ, Salvador R, Sarro S, Gomar JJ, Vila F, Ortiz‐Gil J, Iturria‐Medina Y, Capdevila A, McKenna PJ ( 2010): Medial prefrontal cortex pathology in schizophrenia as revealed by convergent findings from multimodal imaging. Mol Psychiatry 15: 823–830. [DOI] [PMC free article] [PubMed] [Google Scholar]
- Pujol J, Harrison BJ, Ortiz H, Deus J, Soriano‐Mas C, Lopez‐Sola M, Yücel M, Perich X, Cardoner N ( 2009a): Influence of the fusiform gyrus on amygdala response to emotional faces in the non‐clinical range of social anxiety. Psychol Med 39: 1177–1187. [DOI] [PubMed] [Google Scholar]
- Pujol J, Lopez‐Sola M, Ortiz H, Vilanova JC, Harrison BJ, Yücel M, Soriano‐Mas C, Cardoner N, Deus J ( 2009b): Mapping brain response to pain in fibromyalgia patients using temporal analysis of FMRI. PLoS One 4: e5224. [DOI] [PMC free article] [PubMed] [Google Scholar]
- Pujol J, Soriano‐Mas C, Alonso P, Cardoner N, Menchon JM, Deus J, Vallejo J ( 2004): Mapping structural brain alterations in obsessive‐compulsive disorder. Arch Gen Psychiatry 61: 720–730. [DOI] [PubMed] [Google Scholar]
- Pujol J, Torres L, Deus J, Cardoner N, Pifarre J, Capdevila A, Vallejo J ( 1999): Functional magnetic resonance imaging study of frontal lobe activation during word generation in obsessive‐compulsive disorder. Biol Psychiatry 45: 891–897. [DOI] [PubMed] [Google Scholar]
- Raichle ME, MacLeod AM, Snyder AZ, Powers WJ, Gusnard DA, Shulman GL ( 2001): A default mode of brain function. Proc Natl Acad Sci USA 98: 676–682. [DOI] [PMC free article] [PubMed] [Google Scholar]
- Rajapakse JC, Tan CL, Zheng X, Mukhopadhyay S, Yang K ( 2006): Exploratory analysis of brain connectivity with ICA. IEEE Eng Med Biol Mag 25: 102–111. [DOI] [PubMed] [Google Scholar]
- Rauch SL, Jenike MA, Alpert NM, Baer L, Breiter HC, Savage CR, Fischman AJ ( 1994): Regional cerebral blood flow measured during symptom provocation in obsessive‐compulsive disorder using oxygen 15‐labeled carbon dioxide and positron emission tomography. Arch Gen Psychiatry 51: 62–70. [DOI] [PubMed] [Google Scholar]
- Rauch SL, Shin LM, Dougherty DD, Alpert NM, Fischman AJ, Jenike MA ( 2002): Predictors of fluvoxamine response in contamination‐related obsessive compulsive disorder: A PET symptom provocation study. Neuropsychopharmacology 27: 782–791. [DOI] [PubMed] [Google Scholar]
- Remijnse PL, Nielen MM, van Balkom AJ, Cath DC, van Oppen P, Uylings HB, Veltman DJ ( 2006): Reduced orbitofrontal‐striatal activity on a reversal learning task in obsessive‐compulsive disorder. Arch Gen Psychiatry 63: 1225–1236. [DOI] [PubMed] [Google Scholar]
- Roebroeck A, Formisano E, Goebel R ( 2005): Mapping directed influence over the brain using Granger causality and fMRI. Neuroimage 25: 230–242. [DOI] [PubMed] [Google Scholar]
- Rombouts SA, Damoiseaux JS, Goekoop R, Barkhof F, Scheltens P, Smith SM, Beckmann CF ( 2009): Model‐free group analysis shows altered BOLD FMRI networks in dementia. Hum Brain Mapp 30: 256–266. [DOI] [PMC free article] [PubMed] [Google Scholar]
- Rossi S, Bartalini S, Ulivelli M, Mantovani A, Di Muro A, Goracci A, Castrogiovanni P, Battistini N, Passero S ( 2005): Hypofunctioning of sensory gating mechanisms in patients with obsessive‐compulsive disorder. Biol Psychiatry 57: 16–20. [DOI] [PubMed] [Google Scholar]
- Sanavio E ( 1988): Obsessions and compulsions: the Padua Inventory. Behav Res Ther 26: 169–177. [DOI] [PubMed] [Google Scholar]
- Saxena S ( 2003): Neuroimaging and the pathophysiology of obsessive compulsive disorder Fu C, Senior C, Russell TA, Weinberger DR, Murray R, editors. London: Martin Dunitz; pp 191–224. [Google Scholar]
- Schienle A, Schafer A, Stark R, Walter B, Vaitl D ( 2005): Neural responses of OCD patients towards disorder‐relevant, generally disgust‐inducing and fear‐inducing pictures. Int J Psychophysiol 57: 69–77. [DOI] [PubMed] [Google Scholar]
- Seeley WW, Allman JM, Carlin DA, Crawford RK, Macedo MN, Greicius MD, Dearmond SJ, Miller BL. ( 2007a): Divergent social functioning in behavioral variant frontotemporal dementia and Alzheimer disease: reciprocal networks and neuronal evolution. Alzheimer Dis Assoc Disord 21: S50–S57. [DOI] [PubMed] [Google Scholar]
- Seeley WW, Menon V, Schatzberg AF, Keller J, Glover GH, Kenna H, Reiss AL, Greicius MD ( 2007b): Dissociable intrinsic connectivity networks for salience processing and executive control. J Neurosci 27: 2349–2356. [DOI] [PMC free article] [PubMed] [Google Scholar]
- Shapira NA, Liu Y, He AG, Bradley MM, Lessig MC, James GA, Stein DJ, Lang PJ, Goodman WK ( 2003): Brain activation by disgust‐inducing pictures in obsessive‐compulsive disorder. Biol Psychiatry 54: 751–756. [DOI] [PubMed] [Google Scholar]
- Simpson JR Jr., Snyder AZ, Gusnard DA, Raichle ME ( 2001): Emotion‐induced changes in human medial prefrontal cortex: I. During cognitive task performance. Proc Natl Acad Sci USA 98: 683–687. [DOI] [PMC free article] [PubMed] [Google Scholar]
- Smith SM, Fox PT, Miller KL, Glahn DC, Fox PM, Mackay CE, Filippini N, Watkins KE, Toro R, Laird AR, Beckmann CF ( 2009): Correspondence of the brain's functional architecture during activation and rest. Proc Natl Acad Sci USA 116: 13040–13045. [DOI] [PMC free article] [PubMed] [Google Scholar]
- Soriano‐Mas C, Pujol J, Alonso P, Cardoner N, Menchon JM, Harrison BJ, Deus J, Vallejo J, Gaser C ( 2007): Identifying patients with obsessive‐compulsive disorder using whole‐brain anatomy. Neuroimage 35: 1028–1037. [DOI] [PubMed] [Google Scholar]
- Sridharan D, Levitin DJ, Menon V ( 2008): A critical role for the right fronto‐insular cortex in switching between central‐executive and default‐mode networks. Proc Natl Acad Sci USA 105: 12569–12574. [DOI] [PMC free article] [PubMed] [Google Scholar]
- Stern ER, Welsh RC, Fitzgerald KD, Taylor SF ( 2009): Topographic analysis of individual activation patterns in medial frontal cortex in schizophrenia. Hum Brain Mapp 30: 2146–2156. [DOI] [PMC free article] [PubMed] [Google Scholar]
- Tabachnick BG, Fidell LS ( 2001): Using Multivariate Statistics, 4th ed Needham Heights, MA: Allyn & Bacon. [Google Scholar]
- Toro R, Fox PT, Paus T ( 2008): Functional coactivation map of the human brain. Cereb Cortex 18: 2553–2559. [DOI] [PMC free article] [PubMed] [Google Scholar]
- Ursu S, Stenger VA, Shear MK, Jones MR, Carter CS ( 2003): Overactive action monitoring in obsessive‐compulsive disorder: Evidence from functional magnetic resonance imaging. Psychol Sci 14: 347–353. [DOI] [PubMed] [Google Scholar]
- van den Heuvel OA, Remijnse PL, Mataix‐Cols D, Vrenken H, Groenewegen HJ, Uylings HB, van Balkom AJ, Veltman DJ ( 2008): The major symptom dimensions of obsessive‐compulsive disorder are mediated by partially distinct neural systems. Brain 132: 853–868. [DOI] [PubMed] [Google Scholar]
- van den Heuvel OA, Veltman DJ, Groenewegen HJ, Dolan RJ, Cath DC, Boellaard R, Mesina CT, van Balkom AJ, van Oppen P, Witter MP, Lammertsma AA, van Dyck R. ( 2004): Amygdala activity in obsessive‐compulsive disorder with contamination fear: A study with oxygen‐15 water positron emission tomography. Psychiatry Res 132: 225–237. [DOI] [PubMed] [Google Scholar]
- van der Wee NJ, Ramsey NF, Jansma JM, Denys DA, van Megen HJ, Westenberg HM, Kahn RS ( 2003): Spatial working memory deficits in obsessive compulsive disorder are associated with excessive engagement of the medial frontal cortex. Neuroimage 20: 2271–2280. [DOI] [PubMed] [Google Scholar]
- Wechsler D ( 1999): Wechsler Abbreviated Scale of Intelligence Manual. San Antonio: The Psychological Corporation. [Google Scholar]
- Weis S, Hausmann M, Stoffers B, Sturm W: Dynamic changes in functional cerebral connectivity of spatial cognition during the menstrual cycle (in press). [DOI] [PMC free article] [PubMed] [Google Scholar]
- Weissman DH, Roberts KC, Visscher KM, Woldorff MG ( 2006): The neural bases of momentary lapses in attention. Nat Neurosci 9: 971–978. [DOI] [PubMed] [Google Scholar]
- Whiteside SP, Port JD, Abramowitz JS ( 2004): A meta‐analysis of functional neuroimaging in obsessive‐compulsive disorder. Psychiatry Res 132: 69–79. [DOI] [PubMed] [Google Scholar]
- Yücel M, Brewer WJ, Harrison BJ, Fornito A, O'Keefe GJ, Olver J, Scott AM, Egan GF, Velakoulis D, McGorry PD, et al. ( 2007a): Anterior cingulate activation in antipsychotic‐naive first‐episode schizophrenia. Acta Psychiatr Scand 115: 155–158. [DOI] [PubMed] [Google Scholar]
- Yücel M, Harrison BJ, Wood SJ, Fornito A, Wellard RM, Pujol J, Clarke K, Phillips ML, Kyrios M, Velakoulis D, et al. ( 2007b): Functional and biochemical alterations of the medial frontal cortex in obsessive‐compulsive disorder. Arch Gen Psychiatry 64: 946–955. [DOI] [PubMed] [Google Scholar]
- Yücel M, Lubman DI, Harrison BJ, Fornito A, Allen NB, Wellard RM, Roffel K, Clarke K, Wood SJ, Forman SD, et al. ( 2007c): A combined spectroscopic and functional MRI investigation of the dorsal anterior cingulate region in opiate addiction. Mol Psychiatry 12: 691–702. [DOI] [PubMed] [Google Scholar]
Associated Data
This section collects any data citations, data availability statements, or supplementary materials included in this article.
Supplementary Materials
Additional Supporting Information may be found in the online version of this article.
Supporting Information Figure 1
Supporting Information Figure 2
Supporting Information