

Abstract
An emerging issue in neuroscience is how to identify baseline state(s) and accompanying networks termed “resting state networks” (RSNs). Although independent component analysis (ICA) in fMRI studies has elucidated synchronous spatiotemporal patterns during cognitive tasks, less is known about the changes in EEG functional connectivity between eyes closed (EC) and eyes open (EO) states, two traditionally used baseline indices. Here we investigated healthy subjects (n = 27) in EC and EO employing a four‐step analytic approach to the EEG: (1) group ICA to extract independent components (ICs), (2) standardized low‐resolution tomography analysis (sLORETA) for cortical source localization of IC network nodes, followed by (3) graph theory for functional connectivity estimation of epochwise IC band‐power, and (4) circumscribing IC similarity measures via hierarchical cluster analysis and multidimensional scaling (MDS). Our proof‐of‐concept results on alpha‐band power demonstrate five statistically clustered groups with frontal, central, parietal, occipitotemporal, and occipital sources. Importantly, during EO compared with EC, graph analyses revealed two salient functional networks with frontoparietal connectivity: a more medial network with nodes in the mPFC/precuneus which overlaps with the “default‐mode network” (DMN), and a more lateralized network comprising the middle frontal gyrus and inferior parietal lobule, coinciding with the “dorsal attention network” (DAN). Furthermore, a separate MDS analysis of ICs supported the emergence of a pattern of increased proximity (shared information) between frontal and parietal clusters specifically for the EO state. We propose that the disclosed component groups and their source‐derived EEG functional connectivity maps may be a valuable method for elucidating direct neuronal (electrophysiological) RSNs in healthy people and those suffering from brain disorders. Hum Brain Mapp, 2013. © 2012 Wiley Periodicals, Inc.
Keywords: EEG, alpha rhythm, independent component analysis (ICA), resting‐state network (RSN), functional connectivity, default mode network (DMN), dorsal attention network, multi‐dimensional scaling (MDS), standardized low‐resolution tomography analysis (sLORETA)
INTRODUCTION
The identification of a resting baseline state is an essential issue in neuroscience in order to interpret brain activation and to disentangle the mechanisms behind neuronal cooperative activity, which form the core of all cognitive, perceptive and motor‐driven activities. Since its discovery by Hans Berger in the 1930s, electroencephalography (EEG) has been a reliable method for monitoring brain dynamics, witnessing an early focus on the electrophysiological changes from the eyes‐closed (EC) to the eyes‐open (EO) resting states. This transition has traditionally been characterized by a suppression of occipital alpha activity via visual stimulation in the EO state, classically termed “alpha blocking” [Pollen and Trachtenberg, 1972], or more recently “alpha desynchronization” [Klimesch et al., 2000; Neuper and Pfurtscheller, 1992]. Both EC and EO resting conditions, either alone or in combination, have commonly served as a standard baseline estimate in cognitive tasks as well as resting (or “spontaneous”) conditions.
Modern advances in neuroimaging technology have provided new insights about the spontaneous activity of the resting awake brain. With the use of blood oxygen level‐dependent (BOLD) functional MRI (fMRI), several resting state networks (RSNs) and a default‐mode network (DMN) have been discovered [Gusnard and Raichle, 2001; Gusnard et al., 2001; Raichle and Snyder, 2007; Raichle et al., 2001]. RSNs comprise clusters of brain regions involving mainly cortical interconnection across widely distributed brain areas [Honey et al., 2009], reflecting intrinsic functional cross‐talk. The DMN is one of the RSNs described as a task‐negative network given that it is most active during “task‐free” conditions [Biswal et al., 1995; Broyd et al., 2009; De Luca et al., 2006; Fransson, 2006; Lowe et al., 1998; Mantini et al., 2007]. These fMRI investigations are supported by studies with Positron Emission Tomography (PET) comparing tasks against resting conditions with eyes closed [Fox et al., 2005; Fransson, 2006].
Recently however, the study of RSNs has shifted its focus from the localization of specialized brain activations to the interpretation of interrelationships in brain dynamics. In parallel, a host of EEG rhythms have been documented in the network operations of corticothalamic systems [Steriade, 2006], where several rhythms have been found to coexist in the same area or interact among different structures [Steriade, 2001]. These discoveries have led to the suggestion that the EEG could be combined with fMRI to study baseline functions and oscillations within a more dynamic architecture of the human brain [Gusnard et al., 2001; Laufs, 2008; Mantini et al., 2007], by spatiotemporally decomposing the complex dynamics associated with multiple EEG frequencies simultaneously [Laufs et al., 2003a; Mantini et al., 2007].
The main advantage of EC and EO conditions is that they may be carried out without requiring subjects to perform a specific task, and therefore be easily deployed in EEG clinical settings. Barry et al. examined the possible arousal and topography differences during the transition from EC to EO conditions in adults [Barry et al., 2007] and children [Barry et al., 2009]. These were associated with significant reductions in mean activity in the delta, theta, and alpha bands whilst accompanied by increased beta activity in frontal hemispheric regions. Others such as Chen et al. [2008] have used scalp EEG spectral regional field power to study the distribution of RSN activity at rest. The possibility still exists that the frequent disparities between EEG and fMRI studies may be due to the well‐known inadequacy of conventional scalp recordings to resolve EEG source locations, for scalp voltage is a mixture of underlying source activity and volume conduction [Congedo et al., 2008; Nunez, 1987; Nunez et al., 1997; Winter et al., 2007].
As a potential solution, an approach termed Blind Source Separation (BSS) has been developed, originating from the engineering field of signal processing [Bell and Sejnowski, 1995; Comon, 1994; Hyvarinen, 2000]. Independent component analysis (ICA) is a special case of BSS methods that has been applied to EEG and fMRI data [Calhoun et al., 2001, 2004; Makeig, 1996; Makeig et al., 2002] as a tool to remove artifacts [e.g. Jung et al., 2000] and to separate physiological sources [e.g. Makeig et al., 2004]. One of the advantages of ICA is that individual‐subject EEG epochs (or fMRI voxels) can be concatenated across subjects along the time axis to apply the ICA algorithm to group data [e.g. Calhoun et al., 2001, 2004].
Therefore, we propose here to utilize group‐ICA as a valid approach to decompose resting EEG signals into a number of independent components (ICs). Then, using an inverse localization tool such as sLORETA, the cortical location of these ICs may be resolved into spatially well‐defined nodes or “sources” [Pascual‐Marqui et al. 2002]. Finally, through estimation of the cross‐correlation of spectral power between different ICs within subjects, a functional relationship between such EEG source “nodes” can be established, analogous to approaches that have been adopted to calculate functional connectivity from BOLD signal strength in fMRI data [e.g. Buckner et al. 2009].
In summary, our results on dynamic changes in alpha‐band connectivity between EC and EO demonstrate the feasibility of studying neuronal resting‐state networks according to the existence of functional relationships between ICA components in EEG data. We also replicate the previously reported spectral power changes in alpha band power from the EC to the EO state.
MATERIALS AND METHODS
Participants
Participants were 27 healthy volunteers from Goldsmiths, University of London (20 females and 7 males) with ages ranging from 18 to 30 years, mean = 22.5. All subjects had normal hearing and normal or corrected‐to‐normal vision and were not receiving psychoactive medication. Subjects were excluded if they had any history of epilepsy, drug abuse, or head injury. They were recruited by advertisement and signed an informed consent form before the start of the experiment in accordance with the Helsinki Declaration. The current investigation received ethical approval from the College Research Ethics Committee.
Experimental Design
Each subject was asked to sit in an armchair in a quiet room with stable temperature and shaded daylight. The experiment began with a 3‐min EC condition, followed by 3 min with EO. Each subject was given instructions to stay fully relaxed without eye movements to avoid motion artifacts in the eyes‐closed condition. During the EO condition, participants were instructed to visually fixate on a small cross presented on a table below eye level in front of them, in order to reduce blinking and lateral eye movement artifacts.
Independent Component (ICA) and Spectral Power Analysis
The general scheme of this approach is illustrated in Figure 1. Artifact‐free EEG epochs from all subjects in the EC and EO conditions were concatenated into one file, which was then decomposed into independent sources by the group ICA procedure [Jung, 2001; Makeig, 1996] using WinEEG 2.83 software (Mitsar, Ltd.; available at: http://www.mitsar-medical.com), which uses the Infomax ICA algorithm [Bell and Sejnowski, 1995]. Here, a temporal concatenation approach allows for unique time‐courses for each subject, but assumes common group maps across conditions [Calhoun et al., 2001]. Theoretically, ICA is able to separate N source components from N channels of EEG signals in each subject. This is represented by the rows of an inverse unmixing matrix, W in u = Wx, where u is the source matrix and x is the scalp‐recorded EEG. The time‐courses of the sources are assumed to be statistically independent. Then, for each subject, epochwise spectral power of the back‐reconstructed ICs was computed by short‐time Fourier Transform (STFT) across the EO and EC conditions (4‐s epochs with a 50% overlapping Hanning time window). As may be seen in Figure 1C, the predominant frequency of ICs is alpha (8–12 Hz) in almost 70% or 9 ICs/13 ICs. Subsequently, for each resting condition and within each subject, we specifically cross‐correlated the alpha‐band (8–12 Hz) epochwise powers between all 13 ICs, yielding a square 13 × 13 connectivity matrix. Individual connectivity matrix r 2 values were then averaged across subjects to give a group‐wise matrix for each resting condition. Through this time‐frequency analysis we were able to show that several grouped components exhibit strong coupling with alpha‐frequency dynamics in the resting state.
Figure 1.
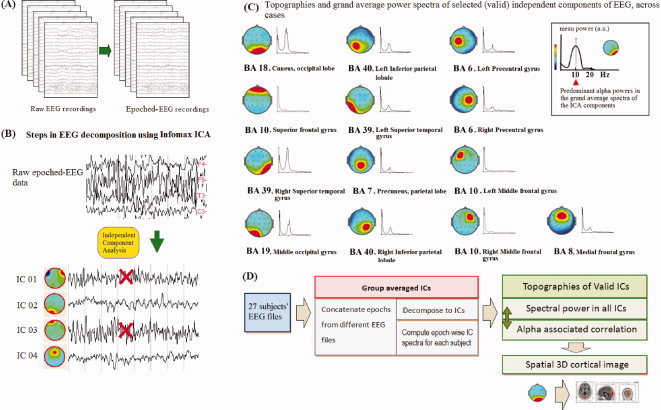
Schematic representation of the different pipeline steps from (A) raw EEG to epoched‐EEG recordings, from a single subject's EEG, (B) EEG concatenation and decomposition using Infomax ICA and artefact rejection, which excludes large amplitudes from muscular activity and eye‐blinking, (C) the construction of mean power spectra of each valid independent component (IC) and its topography. (D) General schema of deriving the alpha power correlation matrices from back‐reconstructed Fourier spectra of all ICs to estimate functional connectivity in both EC and EO states. Then, three‐dimensional cortical images are presented for visualizing related ICs within the cortical source‐level map.
EEG Recording and Preprocessing of EEG
Scalp voltages were recorded using a 19 Ag/AgCl electrode cap according to the 10 to 20 international system: Fp1, Fp2, F7, F3, Fz, F4, F8, T3, C3, Cz, C4, T4, T5, P3, Pz, P4, T6, O1, O2 (Electro‐cap International, Inc.; available at: http://www.electro-cap.com). The ground electrode was placed on the scalp, at a site equidistant between Fpz and Fz. Electrodes were referenced to linked earlobes, and then the common average reference was calculated offline before further analysis. Electro‐oculogram (EOG) data were recorded from electrodes (Fp1/2) placed to monitor eye movements and eye blinking. Electrical signals were amplified with the Mitsar 21‐channel EEG system (Mitsar‐201, CE0537, Mitsar, Ltd.; available at: http://www.mitsar-medical.com) and electrode impedance was kept under 5 KΩ. The EEG was recorded continuously, digitized at a sampling rate of 250 Hz, and stored on hard disk for offline analyses. EEG data were filtered with a 0.5 to 60 Hz bandpass filter offline [e.g. Mantini et al., 2007]. Artifact rejection methods consisted of the exclusion of epochs with large amplitudes (over ±80 μV), eye‐blinking, DC bias, physiologically unresolveable noise [Onton et al., 2006], muscular activity of frontal muscles defined by fast activity over 20 Hz [Shackman et al., 2009], and slow eye movements coincident with the EOG [c.f. Viola et al., 2009]. Moreover, it has been shown that ICA itself is capable of reliably separating blinking, such as blinking and lateral eye movement [e.g. Jung et al., 2000]. In general, each 3 minute resting‐state period of EEG was analyzed in 4‐s epochs (50% overlapping with Hanning time window), resulting in 89 epochs. On average around 60 to 70 valid epochs without artifacts from each of the 27 subjects were analyzed. ICA decomposition yielded a total of 19 ICs, from which epochwise spectral power analysis was applied to 13 physiologically‐relevant ICs (recognised as non‐artifactual and with high single‐dipole fit) to examine the dynamics of EEG‐alpha power from the EC to EO state. This evaluation allowed a more direct comparison of the present results with previous literature [for a review see Klimesch, 1999].
Source Localization Analysis
sLORETA (standardized low‐resolution brain electromagnetic tomography) analysis was performed on scalp maps of selected ICA components to find the maximal densities of their cortical sources [Pascual‐Marqui et al., 2002]. sLORETA imaging provided source computations for the ICs using software provided from the Key Institute for Brain‐Mind Research in Zurich, Switzerland (available at: http://www.uzh.ch/keyinst/loreta.htm). sLORETA is an inverse solution technique that estimates the distribution of the electrical neuronal activity in three‐dimensional space. Specifically, sLORETA computes three‐dimensional linear solutions for the EEG inverse problem within a head model co‐registered to the Talairach probability brain atlas [Talairach, 1988] and viewed within MNI (Montreal Neurological Institute) 152 coordinates at 5 mm resolution. Valid ICA components were defined by their single dipole fitting having satisfactory relative residual energy below 10% [e.g. Grin‐Yatsenko et al., 2010], meaning that over 90% of the component's power may be represented by a single dipole and indicating each was clearly generated by a strong locally circumscribed cortical source (Fig. 2).
Figure 2.

The topographies, power spectra, and source localization of 13 independent components (ICs) in the EO and EC states. For cortical localization of generators the sLORETA equivalent source current density (5 mm resolution) for each extracted IC was estimated using component topographies as input data [Pascual‐Marqui, 2002]. For each IC, its spectral power (left panel, EC vs. EO state, same scale for all ICs), scalp topography (middle panel), and three‐dimensional spatial maps (right panel) are illustrated.
Computation of Mean Regional Correlation Matrix and Graph Analysis
According to graph theory, and within any chosen frequency information exchange may be measured by the (nonrandom) cross‐correlation coefficients in the band‐power spectrum, reflecting functional connectivity. Graph theory defines a graph as a set of nodes (in this study, ICs) and edges (connections between nodes) [Bullmore and Sporns, 2009; Rubinov and Sporns, 2010]. Within each subject, ICs were cross‐correlated region by region according to their alpha‐power across epochs during the full length of two resting time series (more than 60 epochs in each), thus creating two square correlation matrices in the EC and EO states, respectively. The individual within‐subject connectivity matrix r 2 values were then averaged across subjects to give a group‐wise matrix for each resting state. We then performed one‐sample t‐tests (two‐tailed) on the Fisher's r to Z‐transformed (normally distributed) correlation coefficients to test whether they were significantly different from zero [Salvador et al., 2005]. To account for multiple comparisons, Bonferroni's correction was applied to eliminate false‐positive errors (P = 0.01/78 connections = 0.000128), and statistically significant results with P values <0.000128 were accepted as significant. All graph analysis calculations were performed in Matlab 7.04 (Mathworks, MA). This allowed the computation of weighted undirected graphs (Fig. 3).
Figure 3.
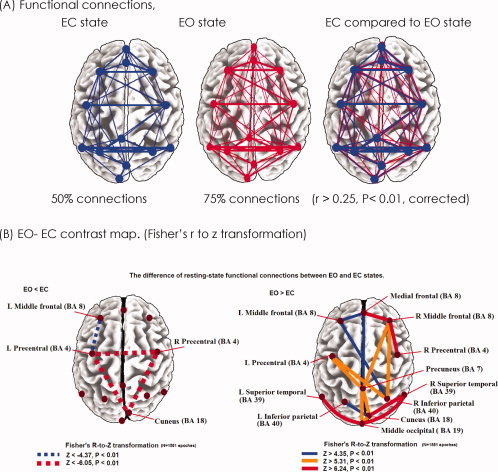
Resting‐state functional connections revealed by EEG‐alpha power spectra, compared between EC and EO states. (A) Significantly enhanced connections of DAN between frontal and parietal regions (anterior to posterior) are demonstrated during the EO state, compared to the EC state. The significantly enhanced connections in the EO state (75%) are depicted, more than those connections in the EC state (50%). (B) Statistically significant connections of DMN, DAN, and visual networks are depicted by top 15%, 10%, 8% pairs of z scores, compared EO with EC state (two‐tailed t‐tests, Bonferroni corrected). Visual networks are enhanced in the parietal, occipital, and occipitotemporal regions in the EO state. Increased connection strength between medial prefrontal cortex and precuneus regions, strong DMN in the EO state, is still noted in line with Yan et al. [2009]. The significantly decreased functional connectivity among left precentral, right precentral, and cuneus from EC to EO state ensures that the improvement of intrinsic networks' activity does not come from the general improved signal‐to‐noise ratio between states.
Clustering of ICA Components
The goal of IC clustering is in order to group together highly similar activity from multiple subjects in order to express their characteristic activities. Alpha desynchronisation upon visual input from EC to EO is generally considered to reflect activation of the entire cortex [Schurmann and Basar, 1999]. Therefore, in order to extend the ICA analysis from single to multicomponent dynamics, the estimated components were clustered according to mutual similarities in their EEG alpha‐power correlation coefficients. A variety of frameworks has been used to summarize relevant components at the group level in fMRI studies [Esposito et al., 2005; Jann et al., 2009; Mantini et al., 2007]. In this study, in order to circumscribe the alpha power‐associated components, agglomerative hierarchical cluster analysis was performed on the components' alpha power correlation coefficients with the statistical software package, SPSS (SPSS Inc, Chicago). Each component measure was normalized by Z‐transformation prior to cluster analysis. Then, to assess mutual similarity, all pairs of components were compared by calculating the Pearson correlation of their alpha power, and classified into a hierarchical cluster tree according to their proximity (dendrogram). A dendrogram consists of mirrored C‐shape lines, where the length of the mirrored C indicates the distance between objects (components). To calculate the distance between clusters, the Average Linkage method (Pearson correlation) was used. Here a “distance” matrix was calculated, namely theEuclidean distances in the original space of the components using multidimensional scaling (MDS) in order to fit an optimal configuration of groups of components in a two‐dimensional space by minimizing the mismatch of the distances between the components in the MDS plot [Esposito et al., 2005; Torgerson, 1952]. From these components five groups were qualitatively selected by the similarity matrix, the dendrogram, the MDS plot, and visual inspection, as anatomically relevant areas across subjects, potentially depicting functionally related groups in the EC and EO resting states.
RESULTS
Alpha‐Band Power Cortical Sources (ICA)
As illustrated in Figure 1, Infomax ICA was applied to extract ICs from the concatenated EEG data of the 27 participants in both EC and EO states. The EEG data was decomposed into 13 spatially fixed and maximally‐ICs. Only six artifact ICs were excluded (horizontal and vertical eye movements × 2, temporal muscle artifacts × 2, and ICs with unspecific muscle artifacts × 2). Our results in each resting state were calculated using more than 60 epochs in each condition for each subject. All components in EC/EO states (Fig. 2) exhibited a high repeatability across subjects with strong cortical source locations. Moreover, we suggest that the consistency in the cortical localization of components in healthy individuals in both EC and EO states is due to the absence of experimental stimuli [for review see Onton et al., 2006], although some unsuccessfully represented artifact components may always be caused by participant confounds such as drowsiness, muscle activity, or eye movements. The cortical location and Brodmann area number of source locations of each IC are illustrated in Figure 2. The Talairach coordinates are further listed in Table I.
Table I.
Coordinates of the main ICs of the circumscribed groups in the resting state, as shown in Fig. 2, the stereotactic space of Talairach and Tournoux [1988]
| Group | x | y | z | Brodmann area | Anatomical region |
|---|---|---|---|---|---|
| Group F | 5 | 63 | −7 | BA10 | Superior frontal gyrus |
| −40 | 45 | 25 | BA10 | Middle frontal gyrus | |
| 40 | 45 | 25 | BA10 | Middle frontal gyrus | |
| −5 | 51 | 39 | BA8 | Medial frontal gyrus | |
| Group C | −59 | −3 | 32 | BA6 | Precentral gyrus |
| 50 | −8 | 37 | BA6 | Precentral gyrus | |
| Group P | −40 | −47 | 39 | BA40 | Inferior parietal lobule |
| −5 | −60 | 63 | BA7 | Precuneus, parietal lobe | |
| 40 | −51 | 49 | BA40 | Inferior parietal lobule | |
| Group OT | 54 | −62 | 22 | BA39 | Superior temporal gyrus |
| −54 | −62 | 22 | BA39 | Superior temporal gyrus | |
| Group O | 5 | −87 | 14 | BA18 | Cuneus, occipital lobe |
| −20 | −96 | 14 | BA19 | Middle occipital gyrus |
Brain regions are identified by putative Brodmann area (BA). Group F, C, P, OT, O, and mean the circumscribed frontal, central, parietal, occipitotemporal, and occipital components.
Functional Connectivity (Graph Analysis)
In accordance with the traditional graph theoretical approach, the square correlation matrix was used, to create weighted undirected binary graph such that nodes (ICs) were either connected or not connected. The distribution of r‐values suggested significantly enhanced connections in the EO state (75%) compared with those in the EC state (50%, in Fig. 3A). For the EO to EC state contrast (two‐tailed t‐tests, Bonferroni corrected) the top 8% of all possible connections, were defined by Fisher's z > 6.24, P < 0.01 [e.g. Dosenbach et al., 2007].
By lowering the graph definition threshold more potential connection patterns to other parts of the brain were revealed, indicating that the findings were robust to small changes in the graph‐definition threshold. Hence for visualization purposes, we made the z‐score threshold vary from the top 8% to 15% of all interregional correlations (top 15% of all possible compared connections, z > 4.35, P < 0.01). Figure 3A,B illustrate the top 15% z‐score pairs for the functional connections between cortical nodes. Significant correlations occurred (1) intrahemispherically in the EO state superior to the EC state (right BA40‐BA8, z > 5.31, P < 0.01; right BA4‐BA8, z > 6.24, P < 0.01); (2) interhemispherically between homologous region pairs (precentral BA4, z < −6.05, P < 0.01, in the EO state inferior to the EC state); and (3) interhemispherically between nonhomologous regions (left frontal BA8‐right parietal BA40, z > 4.35, P < 0.01; left precentral BA4‐right parietal BA40, z > 5.31, P < 0.01) in the EO state superior to the EC state. In other words, within‐DAN correlations were generally greater than other cross‐network correlations in the EO condition. Thus, DAN is always at least partially engaged and intrahemispheric connectivities become as strong as interhemispheric ones when the eyes are open. Furthermore, comparing functional connectivity value pairs revealed a significant between‐condition difference within the midline connectivity of the DMN, specifically between medial prefrontal cortex (mPFC) and precuneus (medial frontal BA 8‐precuneus BA7, z > 4.35, P < 0.01, Fig. 3B).
Figure 4 depicts these nodes within RSNs related in recent fMRI studies, including the primary sensorimotor network, the primary visual and extra‐striate visual network, left and right lateralized networks consisting of superior parietal and superior frontal regions (DAN, reported as one single inset) as well as the so‐called default mode network (DMN) consisting of precuneus, medial frontal, and inferior parietal cortical regions.
Figure 4.
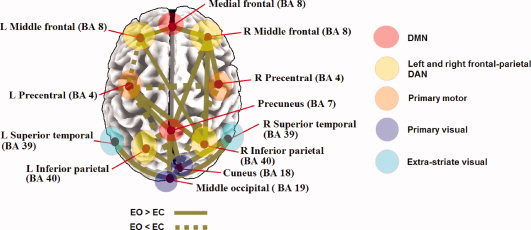
Resting‐state functional connections revealed by EEG‐alpha power spectra, compared with other fMRI‐RSN reports. The illustrated cortical node locations and their membership(s) within previously identified resting‐state networks with fMRI are presented together with the results of the current study [Beckmann et al., 2005; Biswal et al., 1995; Damoiseaux et al., 2006; De Luca et al., 2006; Salvador et al., 2005; Van den Heuvel et al., 2008].
Resting‐State Clusters With Well‐Defined Functional‐Anatomical Regions (Dendrogram Analysis)
Hierarchical cluster analysis of cross‐correlations between alpha power ICs identified a consistent set of five spatiotemporally distinct groups from 27 subjects in each resting condition, in line with resting state networks disclosed by fMRI studies [van den Heuvel and Hulshoff Pol, 2010; Toro et al., 2008]. Importantly, the five grouped‐ICs were explained by the correlation coefficient in each clustered group (P < 0.0005, corrected), and may be considered as a good signature of the resting EEG in both EC and EO states. This is represented by the dendrogram plots in Figure 5, revealing distinct grouping patterns for components in both EC and EO states. Five groups were thus classified on the basis of coordinates in Talairach space and by regional anatomy (see also Table I):
-
1
Frontal group (F): a network involving predominantly lateral and middle prefrontal cortices, as well as the anterior pole of the prefrontal lobe.
-
2
Central group (C): a lateral network involving the precentral gyri.
-
3
Parietal group (P): a posterior‐lateral and midline network involving primarily the parietal regions.
-
4
Occipitotemporal group (OT): a lateral network dominated by the bilateral middle temporal cortices in the occipitotemporal regions.
-
5
Occipital group (O): a posterior network involving predominantly the occipital cortex.
Figure 5.
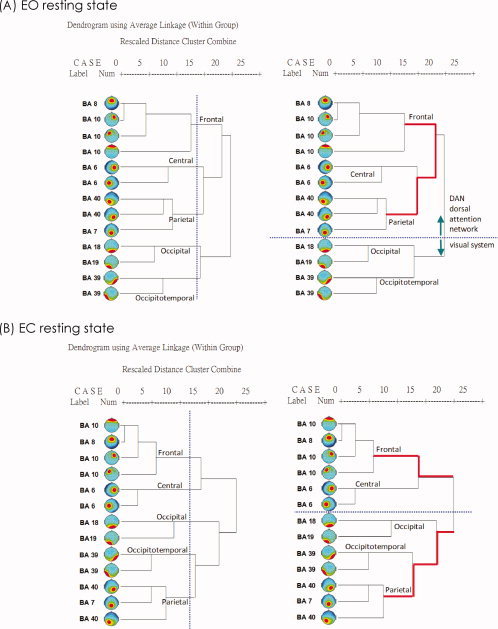
The Dendrogram was performed to illustrate the grouping of the 13 ICs, suggested by Pearson correlations (r values) of alpha power spectra (from 1581 epoches) among all ICs; (A) in the EO condition and (B) in the EC condition (EC, eyes‐closed; EO, eyes‐open; BA, brain regions are identified by putative Brodmann area; vertical blue‐dot lines, instruction lines to help illustrate five groups according to the dendrogram and similarity; horizontal blue‐dot lines, lines to help differentiate the dorsal attention network from the visual system in both states; red lines, indicating the distance (relationship) between the frontal and parietal groups).
All of the group spatial maps were found in both EC and EO states. As illustrated in Figure 4, our results are consistent with fMRI resting‐state network (RSN) reports of regions showing functional connectivity patterns across resting states [Fox et al., 2005; Fransson, 2005; Yan et al., 2009] as well as strong anatomical connectivities [Honey et al., 2007, 2009].
In addition, the dorsal attention network (DAN) most evident in the frontal and parietal groups in the EO state, rather than the EC state, depicted by the dendrogram (Fig. 5). This effect is reinforced by the observation of enhanced correlation between nodes belonging to Groups F, C and P in the functional connectivity correlation matrix for the EO compared to EC condition (Fig. 6).
Figure 6.

Illustrative functional connectivity correlation matrices from the EC to EO state. Functional connectivity correlation matrix (unweighted undirected network) represents the cross‐correlation of the independent component (IC) pairs for alpha‐band spectral power, significant threshold, and arranged by the similarity among components. Green boxes depict circumscribed IC groups according to their significant functional connectivity (r > 0.50, P < 0.01 corrected), please refer to the dendrogram and MDS plots (Figs. 5 and 7). The yellow box indicates enhanced correlation of the Group F, C, and P in the dorsal attention network (DAN) during the EO condition (F: frontal, C: central, P: parietal, OT: occipitotemporal, O: occipital; r: Pearson's correlation coefficient).
Functional Clustering Changes Between EC and EO States (Multidimensional Scaling Analysis)
Here, the functional distances between IC groups within the two conditions were represented by graphical distances in two‐dimensional space, as depicted in Figure 7. Multidimensional‐scaling (MDS) provides an interpretable map of the relations between all ICs whose similarity has been determined by Pearson correlations (r values) and whose IC group membership was revealed by dendrogram cluster analysis (Fig. 5). Hence, corepresentation of the clustered ICs' group membership may aid in highlighting differences in functional associations from EC to EO states on a network level. Here, functionally similar IC components, represented by topographical icons, are plotted in closer proximity within the MDS plot (Fig. 7). This analysis confirms many of the organizational features already highlighted in Figure 5 with symmetrically paired regions in cortical space, reflecting anatomical relations and functional similarity among the five principal IC groups (Table I). In accordance with some prior studies reporting stronger alpha‐band similarities posteriorly rather than anteriorly in the EC condition [Barry et al., 2007; Chorlian et al., 2009], the components within Group F were more segregated than those in Group P and Group OT (Fig. 7). Moreover, comparing the relationship between Groups F and P in the EC versus EO conditions, the closer distance between the two groups in the MDS plot in the EO state suggests tighter coupling within the DAN [e.g. Mantini et al., 2007].
Figure 7.
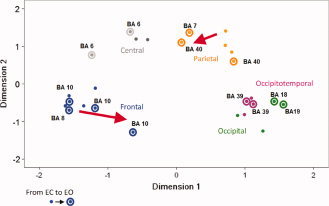
The Euclidean distances matrix of the 13 ICs in the resting state was visualized in a two‐dimensional space using multidimensional scaling (MDS). Five groups (frontal, central, parietal, occipital, and occipitotemporal groups) were presented by five different color according to the dendrogram and Pearson correlations of 13 ICs (please see Fig. 5). The distance between groups shows their relationship, and the connectivity of frontal and parietal groups is increased from EC to EO state, and the same as the visual system (occipital and occipitotemporal groups).
DISCUSSION
To our knowledge, this is the first study to combine EEG‐ICA and graph theory to investigate spectral power functional connectivity of cortically localized sources from the eyes‐closed to the eyes‐open state. Although blind source separation (BSS) methods have been exploited to analyze resting‐state EEG activity in healthy subjects [Chen et al., 2008; Congedo et al., 2010; Gomez‐Herrero et al., 2008; Scheeringa et al., 2008], and in those with clinical disorders [Chen et al., 2009; De Vico Fallani et al., 2007; Grin‐Yatsenko et al., 2010], the present study demonstrates the feasibility and potential of using spectral analysis of ICA components to estimate EEG resting‐state connectivity by representing the spatially‐segregated, unmixed EEG sources as functional nodes within electrocortical networks, in accordance with graph theory [Bullmore and Sporns, 2009]. Compared with previous source‐space attempts to provide a global pattern of electrocortical connectivity, our multistep approach effectively integrates information about functional interactions and provides a parsimonious procedure to describe dynamic state‐changes in EEG resting‐state networks (RSNs). Our principal findings indicate there is an increase in functional connectivity from EC to EO states, particularly between posterior and anterior regions, and that the electrophysiological network of the resting brain (without stimulation or task) is composed of five well‐defined clusters of EEG activity: frontal, central, parietal, occipitotemporal, and occipital. Moreover, the alpha‐band topographical maps and connectivity patterns are consistent with the estimated resting patterns from previous fMRI‐RSN studies, such as the default‐mode network (DMN) and dorsal attention network (DAN) [for a review see Toro et al., 2008; van den Heuvel and Hulshoff Pol, 2010]. In addition, the occipital group (O) and the occipitotemporal group (OT) appear similar to the reported primary visual and extra‐striate visual networks. Given that cortical localization of ICA components and connectivity maps exhibit a high degree of consistency in spatial and frequency parameters within and between subjects during rest [e.g. van de Ven et al., 2004], it may be beneficial to implement this EEG‐ICA functional connectivity approach to clinical populations during resting‐state baseline recordings.
Functional Connectivity Changes From EC to EO
Interhemispheric connectivity varied both as a function of the resting state (from EC to EO) and cortical areas. During the EC state, we observed that alpha power‐associated correlations of spatially localized sources conveyed a preferred interhemispheric direction (Fig. 3A, the EC state). Moreover, these alpha power‐related associations showed a more distinct posterior than anterior focus [e.g. Chorlian et al., 2009]. Given that prior published fMRI–RSN studies revealed significant patterns of correlated spontaneous activity between homologous regions in opposite hemispheres [e.g. Fair et al., 2008; Salvador et al., 2005], the corpus callosum could act as the major conduit for information transfer between the cerebral hemispheres [Innocenti, 1994; Rosas et al., 2010]. In addition, connectivity strength emerged more significantly between posterior regions within the left hemisphere (left temporoparietal junction (TPJ), BAs 39/40) than between regions in the right hemisphere (Fig. 3A). In line with traditional findings, increased communication within the left TPJ may be reflective of a lateralized language processing network [Hutsler and Galuske, 2003]. This feature has also been reported in spontaneous MEG activity of brain networks, indicating that coupling of spontaneous oscillations occurs predominantly within the left intrahemispheric parietal pathway [de Pasquale et al., 2010]. While most cortical sources manifested interhemispheric connections in the EC state between bilateral homologous regions, in the EO state significant correlations emerged most frequently intrahemispherically, demonstrated by the increased dynamic linkage between ipsilateral frontal and parietal regions (Fig. 3A, the EO state). Here, the frontal sources (F) were localized to Brodmann areas (BA) 8 and 10 (medial, right, and left middle frontal gyri), while the parietal sources (P) consisted of BA 7 and BA 40 (precuneus, right, and left inferior parietal lobules).
Importantly, the dorsal attention network (DAN) and default‐mode network (DMN) appeared to become more prominent in the EO state (Fig. 3B, EO > EC). This observation is directly in line with reports of increased fMRI coupling between medial prefrontal cortex and precuneus (BA7) in the EO versus EC condition [Yan et al., 2009], and multimodal associations between alpha‐power fluctuations and DMN activity [Ben‐Simon et al., 2008, Jann et al., 2010; Mantini et al., 2007]. Amongst others, these RSNs have been reported in the work by Biswal et al. [1995], Beckmann et al. [2005], De Luca et al. [2006], Damoiseaux et al. [2006], and Salvador et al. [2005] (Fig. 4). Although the aforementioned studies made use of different groups of subjects, methods (e.g. seed, ICA, or clustering) and MRI acquisition protocols, they coincide with the EEG‐based results of the present study, suggesting the robust formation of functionally and consistently linked networks in the brain during resting conditions.
Neurophysiological Implications of the Five Functionally Clustered Groups
Although the RSN and DMN concepts have come from important fMRI‐BOLD evidence demonstrating consistent activation patterns across distinct brain regions [Greicius et al., 2003; Raichle et al., 2001], it is as yet unclear how these relate to the concurrent coupling and degree of neuronal activity [Debener et al., 2006]. In contrast, EEG has excellent temporal resolution and is a direct electrophysiological correlate of spontaneous and task‐related neuronal activity. ICA has been extensively used for the analysis of electromagnetic brain signals [James and Hesse, 2005; Vigario and Oja, 2000], and provides a statistical estimation of maximally independent EEG sources. Several earlier studies have demonstrated the application of ICA to multichannel EEG data for distinguishing artifacts and functional brain sources [e.g. Jung et al., 2000; Makeig et al., 2004; Marco‐Pallares et al., 2005]. Interestingly, about 20% of all grey matter neurons, nonpyramidal type, express metabolic activity well reflected in the BOLD signal, but not in the EEG [Broyd et al., 2009]. To solve the problem originating from a degree of incongruence between hemodynamic and electrophysiological signals, more recent research has tried combining different modalities, such as EEG‐fMRI, to better understand which portions of BOLD activity are reflected in the EEG [Jann et al., 2009; Mantini et al., 2007]. Here we examined directly the spatial characteristics of the five hierarchically clustered groups based on the EEG alpha‐band spectral power of each IC, with the aim of validating this approach in relation to previous reports of EEG and fMRI default patterns.
An important question is whether these groups directly reflect anatomical connectivity. We selected the alpha rhythm, the most prominent EEG rhythm during the conscious resting state, as the basis of the ICA‐based EEG cluster groups. In previous reports [Barry et al., 2005, 2007; Chen et al., 2008] the distribution of scalp EEG power in relation to anatomical sources within the RSN was unresolved due to the masking of underlying source activity through volume conduction [Nunez and Srinivasan, 2006]. Compared with blood‐oxygenation level fMRI recordings, our combined ICA and sLORETA based results suggest an electrophysiological, and therefore neuronal, functional connectivity amongst well‐specified anatomical regions.
Visual versus parietal system
A good example is the separation of the dorsal parietal cluster (Group P, parietal clustered group in both EC and EO) from the rest of the visual system (Group O and Group OT, in Table I and Fig. 5) [De Luca et al., 2006; Gusnard et al., 2001; Mantini et al., 2007]. The visual system is organized into two parallel anatomical pathways—the dorsal (occipitoparietal) pathway related to spatial vision and visually guided actions, and the ventral (occipitotemporal) pathway associated with identification of visual objects [Corbetta and Shulman, 2002; Sereno et al., 2001]. Interestingly these three groups are shown to be separated by alpha power‐associated IC clustering, compared to similar results of correlations between EEG rhythms and fMRI RSNs reported by Mantini et al. in 2007, and a weak interaction between two EEG‐alpha generators (precuneus and cuneus) found by Gomez‐Herrero et al. [2008].
Frontal and parietal subdivisions
Previous work has shown that the DMN can be divided into at least two subnetworks, with anterior and posterior (frontal and parietal) subdivisions [Damoiseaux et al., 2006; Kiviniemi et al., 2009]. Similarly, based on cluster analyses of alpha power‐associated ICs, we were also able to demonstrate a parietal sub‐network (Group P in Table I and Fig. 5) and a frontal sub‐network (Group F in Table I and Fig. 5). Crucially, during EEG‐fMRI coregistration, Mantini et al. [2007] observed that both the DMN and the dorsal attention network (DAN) were coupled to changes in EEG power. The DMN and DAN are two of the most robust and well‐studied RSNs, and are associated with task‐negative and task‐positive functions, respectively [Shulman et al., 1997]. Earlier reports have suggested that default and attention networks show considerable correlation with EEG‐alpha band power [Laufs et al., 2003a, b). In particular, a study of the temporal dynamics of spontaneous MEG activity has also demonstrated strong correlations in the alpha‐band in both the DAN and the DMN [de Pasquale et al., 2010]. The results of the present study underline the prominence of the DMN and DAN particularly in the EO state, and our findings of relevant circumscribed regions are consistent with the idea that the DAN as well as the DMN appear to exhibit more functional coupling during the EO versus EC condition; the DMN being characterized by increased connection strength between medial prefrontal cortex (MPFC) and precuneus (PCu) regions (Figs. 3B and 4), in line with Yan et al. [2009].
Group Interactions Visualized With Multidimensional Scaling (MDS)
By way of a two‐dimensional plot, the MDS method facilitates visualizing the similarity matrices of the alpha power‐associated correlation coefficients and the proximity of the EEG components. During the shift from EC to EO, the frontal and parietal clusters appear to become closer in the EO state, suggesting more tightly coupled activities among the regions of both the DAN and DMN, potentially to increase contextual integration and evaluation of visual information [Hamzei et al., 2002; Mason et al., 2007; Yan et al., 2009]. Interestingly, we also discovered a number of symmetrical interhemispheric connections that were stronger than would be predicted by the anatomical distance between bilaterally homologous regions in both EC and EO states [Salvador et al., 2005]; for example the coupling between left and right occipitotemporal areas (BA 39; Figs. 3A and 5). Another example is the visual system in the MDS plot (Fig. 7). The distance from the occipital group (Group O) to the parietal group (Group P) was approximately similar to the distance from the occipital group to the occipitotemporal group (Group OT) in the EC state, suggesting a similar strength of coupling of the two parallel visual pathways in keeping with the relatively more inactivated visual cortex. In contrast, in EO with fixation (Fig. 7), the components of occipital and occipitotemporal groups move more closely, respectively, showing increased functional connectivity (Fig. 3B), but not with the parietal group, suggesting a more pronounced coupling of the prevalent ventral pathway, putatively activated during visual object detection (a cross presented in the EO fixation condition), rather than the dorsal pathway which is used during visually guided actions [e.g. e.g. Virji‐Babul et al., 2007]. Together, this is consistent with reports that the oculomotor and attentional systems appear to be activated upon eyes opening, showing an “exteroceptive mental state,” as indicated by Marx et al. [2003] in an fMRI study. On the other hand, it is evident that the sensorimotor group (Group C) remained closer to the occipital group in the EC state (Figs. 5B and 7), possibly reflecting stronger coactivation of the visual and somatosensory systems in the “interoceptive mental state” with eyes closed, and characterized by imagination and sensory activity [Marx et al., 2003].
Methodological Limitations
The principal drawback of the present study was the use of a limited number of electrodes. Although the results found with the ICA‐sLORETA method seem encouraging, they could be refined with the use of a greater number of electrodes (given that the number of resolved ICs is numerically equal to the number of recording electrodes used). There is a limit to this nevertheless, since owing to volume conduction, high‐density EEG channels close to each other tend to be increasingly influenced by activity from similar brain regions. Nevertheless, volume conduction is a widely recognized problem that pervades almost all functional connectivity analyses of the EEG. In this case, EEG signal changes occurring at one location may “spread” and be detected at another, and thus be (erroneously) interpreted as evidence of altered synchrony between locations (sensors). One proposed workaround has been to utilize strictly phase‐lagged signals in connectivity analyses (given that volume conduction is instantaneous) [Stam et al., 2007]. However, this may also run the risk of “throwing the baby out with the bathwater,” as there is evidence that considerable cortico‐cortical coupling occurs with zero phase‐lag in the brain, independent of volume conduction [Gollo et al., 2011; Roelfsema et al., 1997]. In this study we have proposed an alternative approach in the frequency‐domain which, although phase‐insensitive, explicitly defines independent “sources” (ICs) of EEG activity. Here, the time‐course of each IC is defined individually from the source‐space matrix, thereby minimizing the source “spread” which manifests itself in sensor‐space. Moreover, since ICA was performed before frequency‐domain transformation, it would be comparatively easy to translate this processing pipeline to phase‐sensitive measures (such as phase synchrony) by likewise taking advantage of maximal signal independence in ICA source‐space. Importantly, ICA source‐space is qualitatively different from the source‐space of inverse‐source localization methods (minimum‐norm or dipole‐fitting methods). The latter may be envisaged as computing “virtually implanted electrodes,” which can detect distinct but potentially spatiotemporally overlapping activities within the same anatomical location. ICA, in contrast, employs higher‐order statistical methods to linearly unmix the sources in the signal a priori, which may be followed by a subsequent step of cortical source localization (e.g. sLORETA). This may be additionally useful in view of the fact that volume conduction is expressed through linear summation of the signal. On the other hand the principal limitation of ICA is that it is designed to separate mixtures of principally non‐Gaussian activities. In this respect, we tested an alternative approach of performing ICA on prefiltered alpha‐band data; however, this approach yielded a lower number of valid extracted cerebral components (about 50% less), many of which had high residual variance, indicating poor localization of electrocortical activity. We speculate that this may be due to the fact that the standalone alpha rhythm has been reported to have near‐Gaussian properties [Dick and Vaughn, 1970]. Nevertheless, patches of cortex that generate the EEG naturally oscillate at multiple frequencies simultaneously (frequency nesting) and ICA is apparently able to best estimate the maximal independence of EEG generators according to a wider distribution of frequencies; thus our original pipeline retains the property of being physiologically realistic. Almost all previous EEG studies have traditionally applied ICA on broadband data before filtration to individual frequencies of interest [Chen et al., 2009; Grin‐Yatsenko et al., 2010].
Notwithstanding, the most obvious limitation may be the cortical nature of the EEG signal itself, which reflects widespread synchrony of pyramidal neurons in cortical grey matter, and is more problematic for resolving activity from deeper brain structures, as can be done with fMRI. Therefore more EEG‐fMRI studies should be encouraged, with efforts also directed toward standardizing methods for ICA‐based EEG networks and their differentiation between different behavioral states. For example, future studies could be carried out to determine the functional connectivity of theta or beta‐power clustered ICs, compared with networks demonstrated by previous fMRI studies. Likewise, studies could be designed to reveal how connectivities within/between RSNs vary with pharmacological intake or relate to brain‐related pathologies, and to clarify whether observed clustered IC patterns are equivalent during altered brain states [e.g. for sleep: Tinguely et al., 2006; for motion sickness: Chen et al., 2009].
CONCLUSIONS
In conclusion, this work demonstrates the feasibility and addresses the potential of using a multistep, data‐driven approach for source‐based EEG functional connectivity analysis, based on the combined advantages of ICA, source localization, graph theory, and multidimensional scaling in order to reveal the spatiotemporal dynamics of EEG changes from EC to EO states. Our results suggest that cerebral processing underlying eyes‐closed and eyes‐open baseline states consists of statistically clustered groups within spatially and functionally related cortical regions (frontal, central, parietal, occipitotemporal, and occipital), clearly identified in two‐dimensional and three‐dimensional space. From EC to EO resting states, and in line with previous fMRI studies, graph analyses and MDS plots indicated enhanced functional connectivity of frontal and parietal groups putatively subserved by the dorsal attentional network (DAN) and default‐mode network (DMN); there was moreover a tight coupling of occipitotemporal groups associated with processing in more ventral areas, in keeping with the dichotomy of the dorsal/ventral stream hypothesis of the visual information system [Hilgetag et al., 2000; Salvador et al., 2005]. These results suggest that two physiological mechanisms (ventral and dorsal attention networks) functionally coexist during simple resting states such as EO fixation. Since resting‐state connectivity has been shown to correlate with behavioral performance and cognitive measures in a host of published studies [for a review, see Greicius et al., 2008], EEG spectral‐power based RSNs, resolved with ICA, may provide a useful measure with which to directly quantify neuronal functional connectivity during resting state and/or task‐related conditions, in healthy subjects and those with mental illness.
Acknowledgements
This research was supported by grants from School of Medicine, Chang Gung University & Department of Physical Medicine and Rehabilitation, Chang Gung Memorial Hospital, Taiwan (CMRPG350813, CMRPG350814). Trevor Thompson is thanked for helpful suggestions.
REFERENCES
- Alper KR, John ER, Brodie J, Gunther W, Daruwala R, Prichep LS ( 2006): Correlation of PET and qEEG in normal subjects. Psychiatry Res 146: 271–282. [DOI] [PubMed] [Google Scholar]
- Arieli A, Sterkin A, Grinvald A, Aertsen A ( 1996): Dynamics of ongoing activity: Explanation of the large variability in evoked cortical responses. Science 273: 1868–1871. [DOI] [PubMed] [Google Scholar]
- Barry RJ, Clarke AR, Johnstone SJ, Brown CR ( 2009): EEG differences in children between eyes‐closed and eyes‐open resting conditions. Clin Neurophysiol 120: 1806–1811. [DOI] [PubMed] [Google Scholar]
- Barry RJ, Clarke AR, Johnstone SJ, Magee CA, Rushby JA ( 2007): EEG differences between eyes‐closed and eyes‐open resting conditions. Clin Neurophysiol 118: 2765–2773. [DOI] [PubMed] [Google Scholar]
- Barry RJ, Rushby JA, Wallace MJ, Clarke AR, Johnstone SJ, Zlojutro I ( 2005): Caffeine effects on resting‐state arousal. Clin Neurophysiol 116: 2693–2700. [DOI] [PubMed] [Google Scholar]
- Bell AJ, Sejnowski TJ ( 1995): An information‐maximization approach to blind separation and blind deconvolution. Neural Comput 7: 1129–1159. [DOI] [PubMed] [Google Scholar]
- Ben‐Simon E, Podlipsky I, Arieli A, Zhdanov A, Hendler T ( 2008): Never resting brain: Simultaneous representation of two alpha related processes in humans. PloS one 3: e3984. [DOI] [PMC free article] [PubMed] [Google Scholar]
- Bertrand O, Tallon‐Baudry C ( 2000): Oscillatory gamma activity in humans: A possible role for object representation. Int J Psychophysiol 38: 211–223. [DOI] [PubMed] [Google Scholar]
- Biswal B, Yetkin FZ, Haughton VM, Hyde JS ( 1995): Functional connectivity in the motor cortex of resting human brain using echo‐planar MRI. Magn Reson Med 34: 537–541. [DOI] [PubMed] [Google Scholar]
- Buckner RL, Sepulcre J, Talukdar T, Krienen FM, Liu H, Hedden T, Andrews‐Hanna JR, Sperling RA, Johnson KA. (2009): Cortical hubs revealed by intrinsic functional connectivity: Mapping, assessment of stability, and relation to Alzheimer's disease. J Neurosci 29: 1860–1873. [DOI] [PMC free article] [PubMed] [Google Scholar]
- Bullmore E, Sporns O ( 2009): Complex brain networks: Graph theoretical analysis of structural and functional systems. Nat Rev Neurosci 10: 186–198. [DOI] [PubMed] [Google Scholar]
- Brookes MJ, Gibson AM, Hall SD, Furlong PL, Barnes GR, Hillebrand A, Singh KD, Holliday IE, Francis ST, Morris PG ( 2005): GLM‐beamformer method demonstrates stationary field, alpha ERD and gamma ERS co‐localisation with fMRI BOLD response in visual cortex. Neuroimage 26: 302–308. [DOI] [PubMed] [Google Scholar]
- Broyd SJ, Demanuele C, Debener S, Helps SK, James CJ, Sonuga‐Barke EJ ( 2009): Default‐mode brain dysfunction in mental disorders: A systematic review. Neurosci Biobehav Rev 33: 279–296. [DOI] [PubMed] [Google Scholar]
- Buccino G, Binkofski F, Fink GR, Fadiga L, Fogassi L, Gallese V, Seitz RJ, Zilles K, Rizzolatti G, Freund HJ ( 2001): Action observation activates premotor and parietal areas in a somatotopic manner: An fMRI study. Eur J Neurosci 13: 400–404. [PubMed] [Google Scholar]
- Calhoun VD, Adali T, Pearlson GD, Pekar JJ ( 2001): A method for making group inferences from functional MRI data using independent component analysis. Hum Brain Mapp 14: 140–151. [DOI] [PMC free article] [PubMed] [Google Scholar]
- Calhoun VD, Adali T, Pekar JJ ( 2004): A method for comparing group fMRI data using independent component analysis: Application to visual, motor and visuomotor tasks. Magn Reson Imaging 22: 1181–1191. [DOI] [PubMed] [Google Scholar]
- Chen AC, Feng W, Zhao H, Yin Y, Wang P ( 2008): EEG default mode network in the human brain: Spectral regional field powers. Neuroimage 41: 561–574. [DOI] [PubMed] [Google Scholar]
- Chen YC, Duann JR, Chuang SW, Lin CL, Ko LW, Jung TP, Lin CT ( 2009): Spatial and temporal EEG dynamics of motion sickness. Neuroimage 49: 2862–2870. [DOI] [PubMed] [Google Scholar]
- Chorlian DB, Rangaswamy M, Porjesz B ( 2009): EEG coherence: Topography and frequency structure. Exp Brain Res 198: 59–83. [DOI] [PubMed] [Google Scholar]
- Comon P ( 1994): Independent component analysis: A new concept. Signal Processing 36: 287–314. [Google Scholar]
- Congedo M, Gouy‐Pailler C, Jutten C ( 2008): On the blind source separation of human electroencephalogram by approximate joint diagonalization of second order statistics. Clin Neurophysiol 119: 2677–2686. [DOI] [PubMed] [Google Scholar]
- Congedo M, John RE, De Ridder D, Prichep L, Isenhart R ( 2010). On the "dependence" of "independent" group EEG sources; an EEG study on two large databases. Brain Topogr 23: 134–138. [DOI] [PubMed] [Google Scholar]
- Corbetta M, Shulman GL ( 2002): Control of goal‐directed and stimulus‐driven attention in the brain. Nat Rev Neurosci 3: 201–215. [DOI] [PubMed] [Google Scholar]
- Damoiseaux JS, Beckmann CF, Arigita EJ, Barkhof F, Scheltens P, Stam CJ, Smith SM, Rombouts SA ( 2008): Reduced resting‐state brain activity in the "default network" in normal aging. Cereb Cortex 18: 1856–1864. [DOI] [PubMed] [Google Scholar]
- Damoiseaux JS, Rombouts SA, Barkhof F, Scheltens P, Stam CJ, Smith SM, Beckmann CF ( 2006): Consistent resting‐state networks across healthy subjects. Proc Natl Acad Sci USA 103: 13848–13853. [DOI] [PMC free article] [PubMed] [Google Scholar]
- De Luca M, Beckmann CF, De Stefano N, Matthews PM, Smith SM ( 2006): fMRI resting state networks define distinct modes of long‐distance interactions in the human brain. Neuroimage 29: 1359–1367. [DOI] [PubMed] [Google Scholar]
- De Vico Fallani F, Astolfi L, Cincotti F, Mattia D, Tocci A, Marciani MG, Colosimo A, Salinari S, Gao S, Cichocki A, Babiloni F ( 2007): Extracting information from cortical connectivity patterns estimated from high resolution EEG recordings: A theoretical graph approach. Brain Topogr 19: 125–136. [DOI] [PubMed] [Google Scholar]
- Debener S, Ullsperger M, Siegel M, Engel AK ( 2006): Single‐trial EEG‐fMRI reveals the dynamics of cognitive function. Trends Cogn Sci 10: 558–563. [DOI] [PubMed] [Google Scholar]
- Dick DE, Vaughn AO ( 1970): Mathematical description and computer detection of alpha waves. Math Biosci 7: 81–95. [Google Scholar]
- Dosenbach NU, Fair DA, Miezin FM, Cohen AL, Wenger KK, Dosenbach RA, Fox MD, Snyder AZ, Vincent JL, Raichle ME, Schlaggar BL, Petersen SE ( 2007): Distinct brain networks for adaptive and stable task control in humans. Proc Natl Acad Sci USA 104: 11073–11078. [DOI] [PMC free article] [PubMed] [Google Scholar]
- de Pasquale F, Della Penna S, Snyder AZ, Lewis C, Mantini D, Marzetti L, Belardinelli P, Ciancetta L, Pizzella V, Romani GL, et al. ( 2010): Temporal dynamics of spontaneous MEG activity in brain networks. Proc Natl Acad Sci USA 107: 6040–6045. [DOI] [PMC free article] [PubMed] [Google Scholar]
- Egner T, Gruzelier JH ( 2001): Learned self‐regulation of EEG frequency components affects attention and event‐related brain potentials in humans. Neuroreport 12: 4155–4159. [DOI] [PubMed] [Google Scholar]
- Egner T, Gruzelier JH ( 2004): EEG biofeedback of low beta band components: Frequency‐specific effects on variables of attention and event‐related brain potentials. Clin Neurophysiol 115: 131–139. [DOI] [PubMed] [Google Scholar]
- Esposito F, Scarabino T, Hyvarinen A, Himberg J, Formisano E, Comani S, Tedeschi G, Goebel R, Seifritz E, Di Salle F ( 2005): Independent component analysis of fMRI group studies by self‐organizing clustering. Neuroimage 25: 193–205. [DOI] [PubMed] [Google Scholar]
- Fox MD, Snyder AZ, Vincent JL, Corbetta M, Van Essen DC, Raichle ME ( 2005): The human brain is intrinsically organized into dynamic, anticorrelated functional networks. Proc Natl Acad Sci USA 102: 9673–9678. [DOI] [PMC free article] [PubMed] [Google Scholar]
- Fransson P ( 2005): Spontaneous low‐frequency BOLD signal fluctuations: An fMRI investigation of the resting‐state default mode of brain function hypothesis. Hum Brain Mapp 26: 15–29. [DOI] [PMC free article] [PubMed] [Google Scholar]
- Fransson P ( 2006): How default is the default mode of brain function? Further evidence from intrinsic BOLD signal fluctuations. Neuropsychologia 44: 2836–2845. [DOI] [PubMed] [Google Scholar]
- Grin‐Yatsenko VA, Baas I, Ponomarev VA, Kropotov JD ( 2010): Independent component approach to the analysis of EEG recordings at early stages of depressive disorders. Clin Neurophysiol 121: 281–289. [DOI] [PubMed] [Google Scholar]
- Gobbele R, Waberski TD, Simon H, Peters E, Klostermann F, Curio G, Buchner H ( 2004): Different origins of low‐ and high‐frequency components (600 Hz) of human somatosensory evoked potentials. Clin Neurophysiol 115: 927–937. [DOI] [PubMed] [Google Scholar]
- Goldman RI, Stern JM, Engel J Jr, Cohen MS ( 2002): Simultaneous EEG and fMRI of the alpha rhythm. Neuroreport 13: 2487–2492. [DOI] [PMC free article] [PubMed] [Google Scholar]
- Gollo LL, Mirasso CR, Atienza M, Crespo‐Garcia M, Cantero JL ( 2011): Theta band zero‐lag long‐range cortical synchronization via hippocampal dynamical relaying. PloS One 6: e17756. [DOI] [PMC free article] [PubMed] [Google Scholar]
- Gomez‐Herrero G, Atienza M, Egiazarian K, Cantero JL ( 2008): Measuring directional coupling between EEG sources. Neuroimage 43: 497–508. [DOI] [PubMed] [Google Scholar]
- Goncharova II, McFarland DJ, Vaughan TM, Wolpaw JR ( 2003): EMG contamination of EEG: Spectral and topographical characteristics. Clin Neurophysiol 114: 1580–1593. [DOI] [PubMed] [Google Scholar]
- Grech R, Cassar T, Muscat J, Camilleri KP, Fabri SG, Zervakis M, Xanthopoulos P, Sakkalis V, Vanrumste B ( 2008): Review on solving the inverse problem in EEG source analysis. J Neuroeng Rehabil 5: 25. [DOI] [PMC free article] [PubMed] [Google Scholar]
- Greicius M ( 2008): Resting‐state functional connectivity in neuropsychiatric disorders. Curr Opin Neurol 21: 424–430. [DOI] [PubMed] [Google Scholar]
- Greicius MD, Krasnow B, Reiss AL, Menon V ( 2003): Functional connectivity in the resting brain: A network analysis of the default mode hypothesis. Proc Natl Acad Sci USA 100: 253–258. [DOI] [PMC free article] [PubMed] [Google Scholar]
- Grin‐Yatsenko VA, Baas I, Ponomarev VA, Kropotov JD ( 2010): Independent component approach to the analysis of EEG recordings at early stages of depressive disorders. Clin Neurophysiol 121: 281–289. [DOI] [PubMed] [Google Scholar]
- Gruzelier J, Egner T, Vernon D ( 2006): Validating the efficacy of neurofeedback for optimising performance. Prog Brain Res 159: 421–431. [DOI] [PubMed] [Google Scholar]
- Gusnard DA, Akbudak E, Shulman GL, Raichle ME ( 2001): Medial prefrontal cortex and self‐referential mental activity: Relation to a default mode of brain function. Proc Natl Acad Sci USA 98: 4259–4264. [DOI] [PMC free article] [PubMed] [Google Scholar]
- Gusnard DA, Raichle ME ( 2001): Searching for a baseline: Functional imaging and the resting human brain. Nat Rev Neurosci 2: 685–694. [DOI] [PubMed] [Google Scholar]
- Hagmann P, Cammoun L, Gigandet X, Meuli R, Honey CJ, Wedeen VJ, Sporns O ( 2008): Mapping the structural core of human cerebral cortex. PLoS Biol 6: e159. [DOI] [PMC free article] [PubMed] [Google Scholar]
- Hamzei F, Dettmers C, Rijntjes M, Glauche V, Kiebel S, Weber B, Weiller C ( 2002): Visuomotor control within a distributed parieto‐frontal network. Exp Brain Res 146: 273–281. [DOI] [PubMed] [Google Scholar]
- Hilgetag CC, Burns GA, O'Neill MA, Scannell JW, Young MP ( 2000): Anatomical connectivity defines the organization of clusters of cortical areas in the macaque monkey and the cat. Philos Trans R Soc Lond B Biol Sci 355: 91–110. [DOI] [PMC free article] [PubMed] [Google Scholar]
- Hoedlmoser K, Pecherstorfer T, Gruber G, Anderer P, Doppelmayr M, Klimesch W, Schabus M ( 2008): Instrumental conditioning of human sensorimotor rhythm (12–15 Hz) and its impact on sleep as well as declarative learning. Sleep 31: 1401–1408. [PMC free article] [PubMed] [Google Scholar]
- Honey CJ, Kotter R, Breakspear M, Sporns O ( 2007): Network structure of cerebral cortex shapes functional connectivity on multiple time scales. Proc Natl Acad Sci USA 104: 10240–10245. [DOI] [PMC free article] [PubMed] [Google Scholar]
- Honey CJ, Sporns O, Cammoun L, Gigandet X, Thiran JP, Meuli R, Hagmann P ( 2009): Predicting human resting‐state functional connectivity from structural connectivity. Proc Natl Acad Sci USA 106: 2035–2040. [DOI] [PMC free article] [PubMed] [Google Scholar]
- Hutsler J, Galuske, RAW ( 2003): Hemispheric asymmetries in cerebral cortical networks. Trends Neurosci 26: 429–435. [DOI] [PubMed] [Google Scholar]
- Hyvarinen A, Oja E ( 2000): Independent component analysis: Algorithms and applications. Neural Netw 13: 411–430. [DOI] [PubMed] [Google Scholar]
- Hyvarinen A, Ramkumar P, Parkkonen L, Hari R ( 2010): Independent component analysis of short‐time Fourier transforms for spontaneous EEG/MEG analysis. Neuroimage 49: 257–271. [DOI] [PubMed] [Google Scholar]
- Innocenti GM ( 1994): Some new trends in the study of the corpus callosum. Behav Brain Res 64: 1–8. [DOI] [PubMed] [Google Scholar]
- Isaichev SA, Derevyankin VT, Koptelov Yu M, Sokolov EN ( 2001): Rhythmic alpha‐activity generators in the human EEG. Neurosci Behav Physiol 31: 49–53. [DOI] [PubMed] [Google Scholar]
- James CJ, Hesse CW ( 2005): Independent component analysis for biomedical signals. Physiol Meas 26: R15–R39. [DOI] [PubMed] [Google Scholar]
- Jann K, Dierks T, Boesch C, Kottlow M, Strik W, Koenig T ( 2009): BOLD correlates of EEG alpha phase‐locking and the fMRI default mode network. Neuroimage 45: 903–916. [DOI] [PubMed] [Google Scholar]
- Jung TP, Makeig S, Westerfield M, Townsend J, Courchesne E, Sejnowski TJ ( 2000): Removal of eye activity artifacts from visual event‐related potentials in normal and clinical subjects. Clin Neurophysiol 111: 1745–1758. [DOI] [PubMed] [Google Scholar]
- Jung TP, Makeig S, Mckeown MJ, Bell AJ, Lee TW, Sejnowski TJ ( 2001): Imaging brain dynamics using independent component analysis. Proc IEEE 89: 1107–1122. [DOI] [PMC free article] [PubMed] [Google Scholar]
- Kilner JM, Mattout J, Henson R, Friston KJ ( 2005): Hemodynamic correlates of EEG: A heuristic. Neuroimage 28: 280–286. [DOI] [PubMed] [Google Scholar]
- Kiviniemi V, Starck T, Remes J, Long X, Nikkinen J, Haapea M, Veijola J, Moilanen I, Isohanni M, Zang YF, Tervonen O ( 2009): Functional segmentation of the brain cortex using high model order group PICA. Hum Brain Mapp 30: 3865–3886. [DOI] [PMC free article] [PubMed] [Google Scholar]
- Klimesch W ( 1999): EEG alpha and theta oscillations reflect cognitive and memory performance: A review and analysis. Brain Res Brain Res Rev 29: 169–195. [DOI] [PubMed] [Google Scholar]
- Klimesch W, Doppelmayr M, Rohm D, Pollhuber D, Stadler W ( 2000): Simultaneous desynchronization and synchronization of different alpha responses in the human electroencephalograph: A neglected paradox? Neurosci Lett 284: 97–100. [DOI] [PubMed] [Google Scholar]
- Klimesch W, Sauseng P, Hanslmayr S ( 2007): EEG alpha oscillations: The inhibition‐timing hypothesis. Brain Res Rev 53: 63–88. [DOI] [PubMed] [Google Scholar]
- Lachaux JP, Fonlupt P, Kahane P, Minotti L, Hoffmann D, Bertrand O, Baciu M ( 2007): Relationship between task‐related gamma oscillations and BOLD signal: New insights from combined fMRI and intracranial EEG. Hum Brain Mapp 28: 1368–1375. [DOI] [PMC free article] [PubMed] [Google Scholar]
- Laufs H ( 2008): Endogenous brain oscillations and related networks detected by surface EEG‐combined fMRI. Hum Brain Mapp 29: 762–769. [DOI] [PMC free article] [PubMed] [Google Scholar]
- Laufs H, Daunizeau J, Carmichael DW, Kleinschmidt A ( 2008): Recent advances in recording electrophysiological data simultaneously with magnetic resonance imaging. Neuroimage 40: 515–528. [DOI] [PubMed] [Google Scholar]
- Laufs H, Hamandi K, Walker MC, Scott C, Smith S, Duncan JS, Lemieux L ( 2006): EEG‐fMRI mapping of asymmetrical delta activity in a patient with refractory epilepsy is concordant with the epileptogenic region determined by intracranial EEG. Magn Reson Imaging 24: 367–371. [DOI] [PubMed] [Google Scholar]
- Laufs H, Kleinschmidt A, Beyerle A, Eger E, Salek‐Haddadi A, Preibisch C, Krakow K ( 2003a): EEG‐correlated fMRI of human alpha activity. Neuroimage 19: 1463–1476. [DOI] [PubMed] [Google Scholar]
- Laufs H, Krakow K, Sterzer P, Eger E, Beyerle A, Salek‐Haddadi A, Kleinschmidt A ( 2003b): Electroencephalographic signatures of attentional and cognitive default modes in spontaneous brain activity fluctuations at rest. Proc Natl Acad Sci USA 100: 11053–11058. [DOI] [PMC free article] [PubMed] [Google Scholar]
- Lin CT, Wu RC, Liang SF, Chao WH, Chen YJ, Jung TP ( 2005): EEG‐based drowsiness estimation for safety driving using independent component analysis. IEEE Trans Circuits Syst 52: 12. [Google Scholar]
- Lowe MJ, Mock BJ, Sorenson JA ( 1998): Functional connectivity in single and multislice echoplanar imaging using resting‐state fluctuations. Neuroimage 7: 119–132. [DOI] [PubMed] [Google Scholar]
- Lu H, Zuo Y, Gu H, Waltz JA, Zhan W, Scholl CA, Rea W, Yang Y, Stein EA ( 2007): Synchronized delta oscillations correlate with the resting‐state functional MRI signal. Proc Natl Acad Sci USA 104: 18265–18269. [DOI] [PMC free article] [PubMed] [Google Scholar]
- Makeig S, Bell AJ, Jung TP, Sejnowski B ( 1996): Independent component analysis of electroencephalographic data. Adv Neural Inf Process Syst 8: 145–151. [Google Scholar]
- Makeig S, Delorme A, Westerfield M, Jung TP, Townsend J, Courchesne E, Sejnowski TJ ( 2004): Electroencephalographic brain dynamics following manually responded visual targets. PLoS Biol 2: e176. [DOI] [PMC free article] [PubMed] [Google Scholar]
- Makeig S, Jung TP, Bell AJ, Ghahremani D, Sejnowski TJ ( 1997): Blind separation of auditory event‐related brain responses into independent components. Proc Natl Acad Sci USA 94: 10979–10984. [DOI] [PMC free article] [PubMed] [Google Scholar]
- Makeig S, Westerfield M, Jung TP, Covington J, Townsend J, Sejnowski TJ, Courchesne E ( 1999): Functionally independent components of the late positive event‐related potential during visual spatial attention. J Neurosci 19: 2665–2680. [DOI] [PMC free article] [PubMed] [Google Scholar]
- Makeig S, Westerfield M, Jung TP, Enghoff S, Townsend J, Courchesne E, Sejnowski TJ ( 2002): Dynamic brain sources of visual evoked responses. Science 295: 690–694. [DOI] [PubMed] [Google Scholar]
- Mantini D, Perrucci MG, Del Gratta C, Romani GL, Corbetta M ( 2007): Electrophysiological signatures of resting state networks in the human brain. Proc Natl Acad Sci USA 104: 13170–13175. [DOI] [PMC free article] [PubMed] [Google Scholar]
- Marco‐Pallares J, Grau C, Ruffini G ( 2005): Combined ICA‐LORETA analysis of mismatch negativity. Neuroimage 25: 471–477. [DOI] [PubMed] [Google Scholar]
- Marx E, Deutschlander A, Stephan T, Dieterich M, Wiesmann M, Brandt T ( 2004): Eyes open and eyes closed as rest conditions: Impact on brain activation patterns. Neuroimage 21: 1818–1824. [DOI] [PubMed] [Google Scholar]
- Marx E, Stephan T, Nolte A, Deutschlander A, Seelos KC, Dieterich M, Brandt T ( 2003): Eye closure in darkness animates sensory systems. Neuroimage 19: 924–934. [DOI] [PubMed] [Google Scholar]
- Meltzer JA, Negishi M, Mayes LC, Constable RT ( 2007): Individual differences in EEG theta and alpha dynamics during working memory correlate with fMRI responses across subjects. Clin Neurophysiol 118: 2419–2436. [DOI] [PMC free article] [PubMed] [Google Scholar]
- Miwakeichi F, Martinez‐Montes E, Valdes‐Sosa PA, Nishiyama N, Mizuhara H, Yamaguchi Y ( 2004): Decomposing EEG data into space‐time‐frequency components using Parallel Factor Analysis. Neuroimage 22: 1035–1045. [DOI] [PubMed] [Google Scholar]
- Mizuhara H, Wang LQ, Kobayashi K, Yamaguchi Y ( 2004): A long‐range cortical network emerging with theta oscillation in a mental task. Neuroreport 15: 1233–1238. [DOI] [PubMed] [Google Scholar]
- Neuper C, Pfurtscheller G ( 1992): [Event‐related negativity and alpha band desynchronization in motor reactions]. EEG EMG Z Elektroenzephalogr Elektromyogr Verwandte Geb 23: 55–61. [PubMed] [Google Scholar]
- Neuper C, Wortz M, Pfurtscheller G ( 2006): ERD/ERS patterns reflecting sensorimotor activation and deactivation. Prog Brain Res 159: 211–222. [DOI] [PubMed] [Google Scholar]
- Niessing J, Ebisch B, Schmidt KE, Niessing M, Singer W, Galuske RA ( 2005): Hemodynamic signals correlate tightly with synchronized gamma oscillations. Science 309: 948–951. [DOI] [PubMed] [Google Scholar]
- Nunez PL ( 1987): Removal of reference electrode and volume conduction effects by spatial deconvolution of evoked potentials using a three‐concentric sphere model of the head. Electroencephalogr Clin Neurophysiol Suppl 39: 143–148. [PubMed] [Google Scholar]
- Nunez PL, Silberstein RB ( 2000): On the relationship of synaptic activity to macroscopic measurements: Does co‐registration of EEG with fMRI make sense? Brain Topogr 13: 79–96. [DOI] [PubMed] [Google Scholar]
- Nunez PL, Srinivasan R ( 2006): A theoretical basis for standing and traveling brain waves measured with human EEG with implications for an integrated consciousness. Clin Neurophysiol 117: 2424–2435. [DOI] [PMC free article] [PubMed] [Google Scholar]
- Nunez PL, Srinivasan R, Westdorp AF, Wijesinghe RS, Tucker DM, Silberstein RB, Cadusch PJ ( 1997): EEG coherency. I: Statistics, reference electrode, volume conduction, Laplacians, cortical imaging, and interpretation at multiple scales. Electroencephalogr Clin Neurophysiol 103: 499–515. [DOI] [PubMed] [Google Scholar]
- Nuwer MR, Lehmann D, da Silva FL, Matsuoka S, Sutherling W, Vibert JF ( 1999): IFCN guidelines for topographic and frequency analysis of EEGs and EPs. The International Federation of Clinical Neurophysiology. Electroencephalogr Clin Neurophysiol Suppl 52: 15–20. [PubMed] [Google Scholar]
- Oishi N, Mima T, Ishii K, Bushara KO, Hiraoka T, Ueki Y, Fukuyama H, Hallett M ( 2007): Neural correlates of regional EEG power change. Neuroimage 36: 1301–1312. [DOI] [PubMed] [Google Scholar]
- Onton J, Westerfield M, Townsend J, Makeig S ( 2006): Imaging human EEG dynamics using independent component analysis. Neurosci Biobehav Rev 30: 808–822. [DOI] [PubMed] [Google Scholar]
- Pascual‐Marqui RD, Esslen M, Kochi K, Lehmann D ( 2002): Functional imaging with low‐resolution brain electromagnetic tomography (LORETA): A review. Methods Find Exp Clin Pharmacol 24( Suppl C): 91–95. [PubMed] [Google Scholar]
- Pfurtscheller G, Flotzinger D, Mohl W, Peltoranta M ( 1992): Prediction of the side of hand movements from single‐trial multi‐channel EEG data using neural networks. Electroencephalogr Clin Neurophysiol 82: 313–315. [DOI] [PubMed] [Google Scholar]
- Pfurtscheller G, Neuper C, Krausz G ( 2000): Functional dissociation of lower and upper frequency mu rhythms in relation to voluntary limb movement. Clin Neurophysiol 111: 1873–1879. [DOI] [PubMed] [Google Scholar]
- Pfurtscheller G, Stancak A Jr, Neuper C ( 1996): Event‐related synchronization (ERS) in the alpha band‐‐An electrophysiological correlate of cortical idling: a review. Int J Psychophysiol 24: 39–46. [DOI] [PubMed] [Google Scholar]
- Pineda JA ( 2005): The functional significance of mu rhythms: translating "seeing" and "hearing" into "doing". Brain Res Brain Res Rev 50: 57–68. [DOI] [PubMed] [Google Scholar]
- Pollen DA, Trachtenberg MC ( 1972): Some problems of occipital alpha block in man. Brain Res 41: 303–314. [DOI] [PubMed] [Google Scholar]
- Raichle ME, MacLeod AM, Snyder AZ, Powers WJ, Gusnard DA, Shulman GL ( 2001): A default mode of brain function. Proc Natl Acad Sci USA 98: 676–682. [DOI] [PMC free article] [PubMed] [Google Scholar]
- Raichle ME, Snyder AZ ( 2007): A default mode of brain function: A brief history of an evolving idea. Neuroimage 37: 1083–1090; discussion 1097–1089. [DOI] [PubMed] [Google Scholar]
- Roelfsema PR, Engel AK, König P, Singer W ( 1997): Visuomotor integration is associated with zero time‐lag synchronization among cortical areas. Nature 385: 157–161. [DOI] [PubMed] [Google Scholar]
- Rosas HD, Lee SY, Bender AC, Zaleta AK, Vangel M, Yu P, Fischl B, Pappu V ( 2010): Altered white matter microstructure in the corpus callosum in Huntington's disease: Implications for cortical. Neuroimage 49: 2995–3004. [DOI] [PMC free article] [PubMed] [Google Scholar]
- Rubinov M, Sporns O ( 2010): Complex network measures of brain connectivity: Uses and interpretations. Neuroimage 52: 1059–1069. [DOI] [PubMed] [Google Scholar]
- Salvador R, Suckling J, Coleman MR, Pickard JD, Menon D, Bullmore E ( 2005): Neurophysiological architecture of functional magnetic resonance images of human brain. Cereb Cortex 15: 1332–1342. [DOI] [PubMed] [Google Scholar]
- Scheeringa R, Bastiaansen MC, Petersson KM, Oostenveld R, Norris DG, Hagoort P ( 2008): Frontal theta EEG activity correlates negatively with the default mode network in resting state. Int J Psychophysiol 67: 242–251. [DOI] [PubMed] [Google Scholar]
- Schmithorst VJ, Holland SK ( 2004): Comparison of three methods for generating group statistical inferences from independent component analysis of functional magnetic resonance imaging data. J Magn Reson Imaging 19: 365–368. [DOI] [PMC free article] [PubMed] [Google Scholar]
- Schurmann M, Basar E ( 1999): Alpha oscillations shed new light on relation between EEG and single neurons. Neurosci Res 33: 79–80. [DOI] [PubMed] [Google Scholar]
- Sereno MI, Pitzalis S, Martinez A ( 2001): Mapping of contralateral space in retinotopic coordinates by a parietal cortical area in humans. Science 294: 1350–1354. [DOI] [PubMed] [Google Scholar]
- Shackman AJ, McMenamin BW, Slagter HA, Maxwell JS, Greischar LL, Davidson RJ ( 2009): Electromyogenic artifacts and electroencephalographic inferences. Brain Topogr 22: 7–12. [DOI] [PMC free article] [PubMed] [Google Scholar]
- Shulman GL, Fiez JA, Corbetta M, Buckner RL, Miezin FM, Raichle ME, Petersen SE ( 1997): Common blood flow changes across visual tasks: II. Decreases in cerebral cortex. J Cogn Neurosci 9: 648–663. [DOI] [PubMed] [Google Scholar]
- Sridharan D, Levitin DJ, Menon V ( 2008): A critical role for the right fronto‐insular cortex in switching between central‐executive and default‐mode networks. Proc Natl Acad Sci USA 105: 12569–12574. [DOI] [PMC free article] [PubMed] [Google Scholar]
- Stam CJ, Nolte G, Daffertshofer A ( 2007): Phase lag index: Assessment of functional connectivity from multi channel EEG and MEG with diminished bias from common sources. Hum Brain Mapp 28: 1178–1193. [DOI] [PMC free article] [PubMed] [Google Scholar]
- Steriade M ( 2001): Impact of network activities on neuronal properties in corticothalamic systems. J Neurophysiol 86: 1–39. [DOI] [PubMed] [Google Scholar]
- Steriade M ( 2006): Grouping of brain rhythms in corticothalamic systems. Neuroscience 137: 1087–1106. [DOI] [PubMed] [Google Scholar]
- Sun M ( 1997): An efficient algorithm for computing multishell spherical volume conductor models in EEG dipole source localization. IEEE Trans Biomed Eng 44: 1243–1252. [DOI] [PubMed] [Google Scholar]
- Talairach J, Tournoux P ( 1988): Co‐planar stereotaxic atlas of the human brain. 3‐Dimensional proportional system: An approach to cerebral imaging. Stuttgart, New York: Georg Thieme Verlag/Thieme Medical Publishers. [Google Scholar]
- Tinguely G, Finelli LA, Landolt HP, Borbely AA, Achermann P ( 2006): Functional EEG topography in sleep and waking: state‐dependent and state‐independent features. Neuroimage 32: 283–292. [DOI] [PubMed] [Google Scholar]
- Torgerson WS ( 1952): Multidimensional scaling: Theory and method. Psychometrika 17: 401–419. [DOI] [PubMed] [Google Scholar]
- Trujillo‐Barreto NJ, Aubert‐Vazquez E, Valdes‐Sosa PA ( 2004): Bayesian model averaging in EEG/MEG imaging. Neuroimage 21: 1300–1319. [DOI] [PubMed] [Google Scholar]
- Tyvaert L, Levan P, Grova C, Dubeau F, Gotman J ( 2008): Effects of fluctuating physiological rhythms during prolonged EEG‐fMRI studies. Clin Neurophysiol 119: 2762–2774. [DOI] [PMC free article] [PubMed] [Google Scholar]
- Uddin LQ, Kelly AM, Biswal BB, Xavier Castellanos F, Milham MP ( 2009): Functional connectivity of default mode network components: Correlation, anticorrelation, and causality. Hum Brain Mapp 30: 625–637. [DOI] [PMC free article] [PubMed] [Google Scholar]
- Vanni S, Portin K, Virsu V, Hari R ( 1999): Mu rhythm modulation during changes of visual percepts. Neuroscience 91: 21–31. [DOI] [PubMed] [Google Scholar]
- Vigario R, Oja E ( 2000): Independence: a new criterion for the analysis of the electromagnetic fields in the global brain? Neural Netw 13: 891–907. [DOI] [PubMed] [Google Scholar]
- Viola FC, Thorne J, Edmonds B, Schneider T, Eichele T, Debener S ( 2009): Semi‐automatic identification of independent components representing EEG artifact. Clin Neurophysiol 120: 868–877. [DOI] [PubMed] [Google Scholar]
- Virji‐Babul N, Cheung T, Weeks D, Herdman AT, Cheyne D ( 2007): Magnetoencephalographic analysis of cortical activity in adults with and without Down syndrome. J Intellect Disabil Res 51: 982–987. [DOI] [PubMed] [Google Scholar]
- van den Heuvel MP, Hulshoff Pol HE ( 2010): Exploring the brain network: A review on resting‐state fMRI functional connectivity. Eur Neuropsychopharmacol 20: 519–534. [DOI] [PubMed] [Google Scholar]
- van de Ven VG, Formisano E, Prvulovic D, Roeder CH, Linden DEJ ( 2004): Functional connectivity as revealed by spatial independent component analysis of fMRI measurements during rest. Hum Brain Mapp 22: 165–178. [DOI] [PMC free article] [PubMed] [Google Scholar]
- von Stein A, Chiang C, Konig P ( 2000): Top‐down processing mediated by interareal synchronization. Proc Natl Acad Sci USA 97: 14748–14753. [DOI] [PMC free article] [PubMed] [Google Scholar]
- Winter WR, Nunez PL, Ding J, Srinivasan R ( 2007): Comparison of the effect of volume conduction on EEG coherence with the effect of field spread on MEG coherence. Stat Med 26: 3946–3957. [DOI] [PubMed] [Google Scholar]
- Yan C, Liu D, He Y, Zou Q, Zhu C, Zuo X, Long X, Zang Y ( 2009): Spontaneous brain activity in the default mode network is sensitive to different resting‐state conditions with limited cognitive load. PLoS One 4: e5743. [DOI] [PMC free article] [PubMed] [Google Scholar]