

Abstract
Neuropathological studies in Huntington disease (HD) have demonstrated neuronal loss in the striatum, as well as in other brain regions including the cortex. With diffusion tensor MRI we evaluated the hypothesis that the clinical dysfunction in HD is related to regionally specific lesions of circuit‐specific cortico–basal ganglia networks rather than to the striatum only. We included 27 HD and 24 controls from the TRACK‐HD Paris cohort. The following assessments were used: self‐paced tapping tasks, trail B making test (TMT), University of Pennsylvania smell identification test (UPSIT), and apathy scores from the problem behaviors assessment. Group comparisons of fractional anisotropy and mean diffusivity and correlations were performed using voxel‐based analysis. In the cortex, HD patients showed significant correlations between: (i) self paced tapping and mean diffusivity in the parietal lobe at 1.8 Hz and prefrontal areas at 3 Hz, (ii) UPSIT and mean diffusivity in the parietal, and median temporal lobes, the cingulum and the insula, and fractional anisotropy in the insula and the external capsule, (iii) TMT B and mean diffusivity in the white matter of the superior frontal, orbital, temporal, superior parietal and post central areas, and (iv) apathy and fractional anisotropy in the white matter of the rectus gyrus. In the basal ganglia, we found correlations between the self paced tapping, UPSIT, TMT tests, and mean diffusivity in the anterior part of the putamen and the caudate nucleus. In conclusion, disruption of motor, associative and limbic cortico‐striatal circuits differentially contribute to the clinical signs of the disease. Hum Brain Mapp 34:2141–2153, 2013. © 2012 Wiley Periodicals, Inc.
Keywords: Huntington's disease, MRI, diffusion tensor imaging, VBM
INTRODUCTION
Huntington disease (HD) is an inherited neurodegenerative disorder, which is caused by a CAG repeat expansion in the gene encoding huntingtin on chromosome 4. The clinical characteristics of the disease include progressive motor dysfunction, cognitive decline, and psychiatric disturbances. Onset of symptoms occur between the ages of 30 and 50 and is defined by the presence of movement disorders mostly chorea [Huntington's Disease Study Group, 1996], but psychiatric or behavioral symptoms are usually present prior to motor signs.
Neuropathological studies in HD have demonstrated neuronal loss in the striatum [Vonsattel, 2008], as well as in other brain regions including the cortex [Halliday et al., 1998]. Several neuropathological studies indicated degeneration of pyramidal neurons projecting to the basal ganglia. This degeneration of pyramidal neurons is region specific predominating in Brodmann areas 8, 9, and 10 [Heinsen et al., 1994; Macdonald and Halliday, 2002; Mann et al., 1993; Selemon et al., 2004] and appeared less pronounced in adjacent area 46 [Selemon et al., 2004]. Dendritic pruning and synaptic loss may precede this cell death [Sapp et al., 1997].
Structural magnetic resonance imaging (MRI) provides markers of the macroscopic effects of neuronal damage and loss including striatal volume loss [Aylward et al., 1997; Hobbs et al., 2009], cortical thinning [Rosas et al., 2002], and global brain volume loss [Henley et al., 2009; Squitieri et al., 2009]. As both cortex and striatum are affected it is likely that fibers connecting these structures are also disrupted. Evidence for such a disruption has been reported previously using diffusion imaging [Douaud et al., 2009; Kloppel et al., 2008; Mascalchi et al., 2004; Rosas et al., 2006]. Disruption of cortico‐striatal white matter circuits are therefore likely to contribute to the clinical signs of the disease and to play a role in symptom development. Diffusion tensor imaging (DTI) is an MRI technique that is sensitive to the Brownian motion of water molecules in biological tissues [Basser and Pierpaoli, 1996; Le Bihan et al., 1995] and can demonstrate the orientation and integrity of white matter fibers in vivo. Within cerebral white matter, water molecules diffuse more freely along the direction of axonal fascicles than across them, arising from the restriction of free water diffusion by the axonal membrane, microtubuli, and myelin sheath [Moseley et al., 1990; Pierpaoli and Basser, 1996]. Such directional dependence of diffusivity is termed anisotropy. An integrated MR measure of water diffusion is used to calculate the diffusion tensor, from which fractional anisotropy (FA‐the amount of anisotropy) and the mean diffusivity (the global amount of diffusion) can be derived [Basser and Pierpaoli, 1998]. The aim of this study was to determine the structural correlates of selected psychomotor, cognitive and neuropsychiatric deficits using 3 T MRI and diffusion imaging in early HD patients included in the TRACK‐HD study [Tabrizi et al., 2009]. We evaluated the hypothesis that these deficits are related to circuit‐specific lesions within the brain implicating not only the basal ganglia but also cortical regions.
METHODS
Subjects
We included 24 controls and 27 early HD subjects from the Paris part of the TRACK‐HD study [Tabrizi et al., 2009]. Clinical assessment was performed according to the TRACK‐HD standards. Clinical assessment included the unified Huntington disease rating scale UHDRS‐99 1996, medical and psychiatric history, current medications, HD history, clinical motor scores, portions of the cognitive component (Symbol Digit Modalities [Smith, 1991], Stroop Word condition [Stroop, 1935]), and functional capacity. The study was approved by the local ethics committee and written informed consent was obtained from each subject according to the Declaration of Helsinki.
Clinical Assessments
We selected the self‐paced tapping task for the psychomotor function, the trail making tests (Parts A and B) and an abbreviated (20‐item) version of the University of Pennsylvania smell identification test (UPSIT) for cognitive functions, and apathy scores from the problem behaviors assessment for behavioral function. These tests were selected because they showed significant cross‐sectional differences compared with healthy subjects at baseline in the TRACK‐HD cohort [Tabrizi et al., 2009].
Motor functions
In the self‐paced tapping task, isometric force during finger taps was recorded using a force transducer [Tabrizi et al., 2009]. Larger standard deviations are indicative of poorer performance.
Cognitive functions
We used the trail making tests Parts A and B and an abbreviated (20‐item) version of the UPSIT (Sensonics, Haddon Heights, NJ).
In the TMT B test, correlations were performed with the timing. Trail A making test was evaluated to calculate the mental flexibility index [Stuss et al., 2001]. The mental flexibility index was defined as follows: log (Timing B ‐ Timing A)/Timing A [Stuss et al., 2001]. This index reduces intergroup variability due to nonnormally distributed raw data [Stuss et al., 2001].
The UPSIT test was used to assess recognition of common odors, as described previously [Tabrizi et al., 2009]. Briefly, subjects were presented with a “scratch and smell” panel. They were asked to identify the smell from four options. This task was not timed.
Neuropsychiatric functions
We used apathy item of the short version of the problem behaviors assessment for HD (PBA‐s). Apathy was scored using a five‐point scale for severity and for frequency during the 4 weeks preceding the examination. An apathy score was calculated by multiplying the severity and frequency scores over the past month. Higher scores indicate more severe apathy.
Disease burden score
The disease burden score is a measure which indicates the severity of disease. The disease burden score is based on CAG‐repeat length and age and is calculated with the following equation: ([number of CAG repeats – 35.5] × age) [Penney et al., 1997].
Image Acquisition
Images were acquired using a 3 Tesla system (Siemens TRIO 32‐channel TIM system) and a 12‐channel head coil for signal reception. The protocol included high resolution anatomical T1‐ and T2‐weighted images and diffusion tensor imaging (DTI). Anatomical scans were acquired using an axial three‐dimensional (3D) inversion recovery MP‐RAGE acquisition (voxel size, 1.1 × 1.1 × 1.1 mm3). DTI was performed using echo‐planar imaging (EPI). DTI axial slices were obtained using the following parameters: TR/TE/flip angle = 12 s/86 ms/90°, matrix 128 × 128, field of view 256 × 256 mm2, slice thickness 2 mm, no gap, 1 average. Diffusion weighting was performed along 50 independent directions, with b value of 1,000 s mm−2, and a reference image with no diffusion weighting was also obtained.
Image Processing
Diffusion image processing
Raw diffusion‐weighted data were corrected for motion and geometric distortions secondary to eddy currents using a registration technique based upon the geometric model of distortions [Mangin et al., 2002]. Maps of fractional anisotropy (FA) and mean diffusivity (MD), which corresponds to one third the trace of the diffusion tensor [Trace (D)/3], were calculated from the diffusion‐weighted images using the FSL software (http://www.fmrib.ox.ac.uk/fsl/fdt/index.html).
SPM data analysis
To allow voxel‐by‐voxel statistical comparisons, the T2‐weighted EPI images obtained for b = 0 and the diffusion maps of all subjects were normalized to the standard MNI space using SPM5 software and resliced to a voxel size of 2 × 2 × 2 mm3. Diffusion maps were first coregistered to the T1‐weighted images and then spatially normalized using the parameters determined from the normalization of the T1‐weighted images obtained in VBM procedure and using linear steps with 12° of freedom and 16 nonlinear iterations. The normalized FA and ADC maps were smoothed with an 8‐mm isotropic Gaussian kernel. This filter size corresponded to the spatial extent of the expected patient‐control differences in the basal ganglia and midbrain and allowed the anisotropy data to conform more closely to a Gaussian field model by reducing the proportion of voxels with nonnormally distributed residuals [Jones et al., 2005].
Statistical Analysis
Clinical analysis
Comparisons of means were performed using a nonparametric test (Mann–Whitney U test). Values are presented as means ± standard deviation.
VB‐DTI analyses
Group comparisons and correlations were performed using analysis of covariance (ANCOVA). Age and burden scores were incorporated in the design matrix to remove regional differences between groups due to age or disease severity. For group analyses, we used a voxel‐wise threshold at P < 0.05 corrected for family wise error (FWE) for multiple comparisons.
For correlation analyses, we increased sensitivity of correlations by restricting the analysis within a priori selected anatomical areas (small volume correction—SVC) [Friston, 1997; Worsley et al., 1996]. For gray matter analysis, these areas included fronto‐parietal, medial temporal, insula, basal ganglia, and thalamic areas. Regions were defined by using an anatomical atlas [Tzourio‐Mazoyer et al., 2002]. For white matter analysis, regions included the basal ganglia/external/internal capsule area, the centrum ovale, the cingulate bundle, the superior longitudinal fasciculus, and the corpus callosum. White matter regions were defined using an anatomical atlas of white matter (FSL tool, http://www.fmrib.ox.ac.uk/fsl). Within these regions, we used a threshold of P < 0.05 FWE corrected for multiple comparisons as for group analysis. No further correction was applied between these regions, and thus the possibility of false positives at this level cannot be completely discarded. Positive and negative correlations were tested for each clinical score.
Previous imaging studies have demonstrated that changes in brain structure were strongly correlated with pathological disease burden score [Tabrizi et al., 2009]. Therefore, to assess associations between clinical measures and specific brain changes, we calculated correlations after controlling for disease burden score. This allowed studying the specific associations between brain and clinical measure changes for participants who had similar levels of disease progression.
RESULTS
Clinical Data and Behavioral Performances
The clinical characteristics of HD patients and controls are shown in Table 1. Gender distribution and age at examination was similar in both groups. In HD patients, the motor assessment of the UHDRS scale ranged from 5 to 40 (worst possible score of 124).
Table 1.
Clinical characteristics of patients with Huntington disease and controls
| HD (n = 27) | Controls (n = 24) | P | |
|---|---|---|---|
| Gender (M/F) | 10/17 | 12/12 | 0.578 |
| Age (mean years ± SD) | 49.4 ± 8.2 | 45.3 ± 12 | 0.156 |
| CAG | 43 ± 2 | NA | |
| Burden | 354.1 ± 74.5 | NA | |
| Motor tasks | |||
| UHDRS motor assessment (max value 124) | 20.6 ± 11.2 | 1.1 ± 1.5 | <0.001** |
| Self paced taping test (1.8 Hz), (mean ± SD) | 189 ± 221 | 58.0 ± 30.3 | <0.001** |
| Self paced taping test (3 Hz), standard deviation | 289 ± 422 | 53.7 ± 38.8 | <0.001** |
| Cognitive tasks | |||
| UPSIT (number correct) | 13.6 ± 3.4 | 17.0 ± 2.5 | <0.001** |
| TRAIL A timing | 57.3 ± 25.8 | 31 ± 12 | |
| TRAIL A error | 0.07 ± 0.3 | 0.04 ± 0.2 | |
| TRAIL B timing | 165.8 ± 86.4 | 71.2 ± 35.2 | 0.036* |
| TRAIL B error | 1.3 ± 2.1 | 0.2 ± 0.5 | <0.001** |
| Mental flexibility index | 0.0399 ± 0.0154 | 0.055 ± 0.0155 | 0.002* |
| Neuropsychiatric tasks | |||
| PBA apathy | 3.9 ± 4.7 | 0.8 ± 2.3 | 0.004* |
Abbreviations: HD: Huntington disease; UHDRS: unified Huntington disease rating scale; UPSIT, University of Pennsylvania Smell Identification Test; NA: not applicable.
All assessments showed significant impairment in early HD compared with the control subjects (Table 1).
Self‐paced tapping at 1.8 Hz and 3 Hz
HD patients compared to control subjects showed reduced precision, i.e., increased tap deviation.
UPSIT
HD patients identified 3.4 fewer smells out of 20 on average compared to controls (P < 0.0001).
Trail making test part B
HD patients showed higher errors (range: 0–6) compared with control subjects (range: 0–1). HD patients were slower at the TMT A and B tests but changes did not reach significance for the TMT A test. The mental flexibility index was significantly lower in patients compared to control subjects.
Apathy Score
Apathy scores were greater by 3.1 points (range 1.8–3.0) in HD compared with controls.
Diffusion Changes
Between group voxel‐based comparisons
Changes in early HD
Voxel‐based analysis revealed significant FA decrease compared to controls in several white matter association pathways including the corpus callosum, the external capsule, the white matter between the anterior thalamus and the head of the caudate nucleus, and the white matter of the posterior corona radiata bilaterally, and the left ventrolateral, orbitofrontal, and temporal areas (Fig. 1a; Tables 2 and 3). FA was increased in the anterior putamen bilaterally in patients compared to controls (Fig. 1b).
Figure 1.
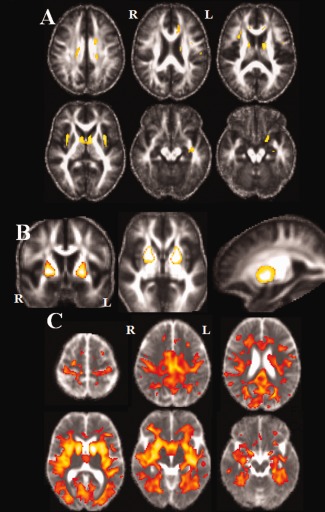
Statistical parametric maps (SPMs) in group's comparisons (P < 0.05 FWE). (A) FA maps in controls compared to patients: Significant clusters of lower FA in patients group were observed in the white matter of the frontal and temporal lobes, the external capsule, the corpus callosum and the corona radiata. (B) FA maps in patients compared to controls: higher FA was found bilaterally in the anterior putamen of patients. (C) MD maps in Patients compared to Controls: Diffuse higher MD was found in patients with relative preservation of the prefrontal lobe. [Color figure can be viewed in the online issue, which is available at http://wileyonlinelibrary.com.]
Table 2.
MNI coordinates of significant difference between groups in FA
| MNI coordinates | ||||||
|---|---|---|---|---|---|---|
| Brodmann area | Side | x | y | Z | T score | |
| Controls vs. HD | ||||||
| Orbitofrontal | L | −18 | 4 | −18 | 7.35 | |
| Ventrolateral frontal | L | −38 | 0 | 20 | 6.85 | |
| White matter anterior thalamus/ head caudate nucleus | L | −12 | −2 | 10 | 9.30 | |
| R | 12 | 0 | 8 | 7.77 | ||
| External capsule | L | −34 | 2 | 6 | 8.16 | |
| R | 34 | 6 | 6 | 8.17 | ||
| Corpus callosum | L | −12 | 30 | 10 | 5.98 | |
| Corpus callosum/corona radiata | L | −16 | 2 | 34 | 6.74 | |
| R | 18 | −16 | 36 | 6.63 | ||
| Posterior corona radiata | L | −18 | −28 | 34 | 6.95 | |
| R | 20 | −28 | 34 | 6.32 | ||
| Temporal WM | L | −38 | −12 | −14 | 6.89 | |
| HD vs. controls | ||||||
| Anterior putamen | R | 24 | 8 | 0 | 8.85 | |
| L | −18 | 0 | −2 | 7.96 | ||
MNI: Montreal national institute coordinate; WM: white matter, clusters were considered significant at P < 0.05 FWE corrected for multiple comparisons.
Table 3.
MNI coordinates of significant between group differences in MD
| MNI coordinates | ||||||
|---|---|---|---|---|---|---|
| Brodmann area | Side | x | y | Z | T score | |
| MD | HD vs. controls | |||||
| Precentral gyrus | 4 | L | −30 | −16 | 52 | 7.19 |
| R | 30 | −18 | 48 | 7.33 | ||
| Superior frontal gyrus | 9 | L | −10 | 44 | 30 | 6.44 |
| Middle frontal gyrus | 8 | R | 26 | 20 | 42 | 5.83 |
| Inferior frontal gyrus | 46 | L | −36 | 28 | 12 | 11.09 |
| Inferior frontal gyrus | 47 | R | 38 | 36 | −6 | 9.88 |
| Anterior cingular | 32 | L | −20 | 6 | 48 | 8.18 |
| Middle cingular | 31 | L | −2 | −34 | 26 | 9.99 |
| R | 4 | −22 | 36 | 10.17 | ||
| Post central gyrus | 1–3 | L | −28 | −32 | 62 | 7.48 |
| R | 26 | −32 | 60 | 7.92 | ||
| Precuneus | 31 | L | −22 | −72 | 24 | 10.49 |
| Inferior parietal gyrus | 39 | R | 52 | −66 | 32 | 6.14 |
| Middle temporal gyrus | 39 | L | −46 | −70 | 36 | 6.67 |
| Middle temporal gyrus | 21 | L | −40 | −24 | −4 | 12.59 |
| R | 46 | −24 | 4 | 12.36 | ||
| Lingual gyrus | 19 | L | −18 | −62 | −4 | 10.23 |
| Lingual gyrus | 18 | R | 8 | −76 | 4 | 10.39 |
| Fusiforme gyrus | 38 | R | 26 | −46 | −12 | 10.11 |
| Parahippocampal gyrus | L | −26 | −30 | −18 | 10.10 | |
| Insula | L | −36 | −18 | −8 | 12.63 | |
| R | 32 | 8 | 14 | 12.58 | ||
| Internal capsule | R | −14 | 4 | 8 | 15.94 | |
| External capsule | L | −28 | 10 | 6 | 13.12 | |
| Caudate nucleus | ||||||
| Head | R | 12 | 8 | 4 | 12.87 | |
| L | −12 | 4 | 8 | 15.90 | ||
| Body | R | 14 | 6 | 6 | 12.96 | |
| L | −14 | 0 | 14 | 12.79 | ||
| Putamen anterior | L | −30 | 4 | 2 | 14.01 | |
| R | 28 | 6 | −2 | 14.95 | ||
| Putamen posterior | L | −32 | −16 | 0 | 11.79 | |
| R | 30 | −14 | 12 | 7.18 | ||
Clusters were considered significant at P < 0.05 FWE corrected for multiple comparisons.
Voxel‐based MD analysis showed diffuse higher values in cortical gray and white matter. Increased MD values were also found in the basal ganglia (Fig. 1c).
Correlations With Clinical Variables
Motor tests
There was a positive correlation between self paced tapping standard deviation at 1.8 Hz and MD in the medial prefrontal gyrus (BA 10) and the superior temporal gyrus (BA 22) in the right hemisphere, the superior parietal gyrus (BA 7), the middle temporal gyrus (BA 22), and the anterior cingulate gyrus in the left hemisphere (BA 32), the anterior part of the putamen and the caudate nucleus bilaterally (Fig. 2a; Table 4).
Figure 2.
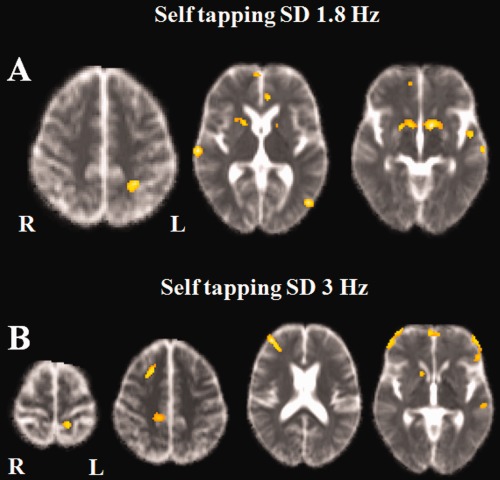
Positive correlation between MD maps and self tapping task (standard deviation) at 1.8 Hz (A) and 3 Hz (B). (A) 1.8 Hz: Correlations were found in the right medial prefrontal and the right superior temporal gyrus, the superior parietal gyrus, the middle and superior temporal gyri, and the anterior cingulate gyrus in the left hemisphere, the putamen and caudate nucleus bilaterally. (B) 3 Hz: Correlations was found in the right prefrontal cortex, the left orbital and left superior temporal gyri and bilaterally in the paracentral gyri, the putamen, and caudate nucleus bilaterally. [Color figure can be viewed in the online issue, which is available at http://wileyonlinelibrary.com.]
Table 4.
Anatomical regions of correlations between MD and motor tasks
| MNI coordinates | ||||||
|---|---|---|---|---|---|---|
| Brodmann area | Side | x | y | z | T score | |
| MD | Self SD 1.8 Hz positive correlation | |||||
| Medial prefrontal gyrus | 10 | R | 6 | 58 | 0 | 5.25 |
| Anterior cingulate gyrus | 32 | L | −6 | 38 | 6 | 4.60 |
| Superior parietal gyrus | 7 | L | −26 | −48 | 50 | 5.24 |
| Superior temporal gyrus | 22 | R | 68 | −20 | 4 | 5.71 |
| Middle temporal gyrus | 22 | L | −60 | −60 | −2 | 6.95 |
| Putamen anterior | L | −10 | 8 | −6 | 5.23 | |
| R | 20 | 6 | −4 | 4.83 | ||
| Caudate nucleus | L | −8 | 8 | −6 | 4.54 | |
| R | 10 | 8 | −6 | 4.13 | ||
| Self SD 3 Hz positive correlation | ||||||
| Superior frontal gyrus | 6/8 | R | 22 | 18 | 48 | 5.11 |
| Middle frontal gyrus | 46 | R | 34 | 44 | 12 | 6.04 |
| Orbital gyrus | 11 | L | −6 | 60 | −6 | 4.68 |
| Paracentral gyrus | 5 | L | −14 | −40 | 62 | 4.41 |
| R | 14 | −34 | 48 | 4.06 | ||
| Superior temporal gyrus | L | −52 | −2 | −12 | 4.8 | |
| Putamen anterior | L | −22 | 2 | −8 | 4.59 | |
| R | 30 | 16 | 6 | 4.17 | ||
| Caudate nucleus | R | 14 | 14 | −6 | 4.22 | |
P FWE < 0.05 corrected after SVC correction.
There was a positive correlation between self paced tapping standard deviation at 3 Hz and MD in the right prefrontal cortex (BA 8 and 46), the left orbital (BA 11) and superior temporal gyri (BA 22) and bilaterally in the paracentral gyri (BA 11), (Fig. 2b). At subcortical level, there was a positive correlation in the anterior part of the putamen and the caudate nucleus bilaterally. There was no correlation between FA and motor performances.
Cognitive Tests
UPSIT
There was a negative correlation between UPSIT scores and MD in olfactory areas (BA 11), the insula, the limbic temporal lobe including the amygdala and hippocampus—parahippocampal area, the precentral (BA 4), the inferior parietal (BA 39–40), superior temporal (BA 22), and superior occipital gyri (BA 19) bilaterally, the precuneus (BA7), the postcentral gyrus (BA 1–3), the superior fontal (BA 6), the cingulate (BA 29), and inferior temporal gyri (BA 37) in the right hemisphere, the paracentral area (BA 5), the superior parietal (BA 7), middle temporal (BA 21), and orbital gyri (BA 11) in the left hemisphere (Fig. 3a). In subcortical areas, MD correlated negatively with UPSIT scores in the caudate nucleus, the anterior part of the putamen, and the globus pallidus in the left hemisphere and the right thalamus.
Figure 3.
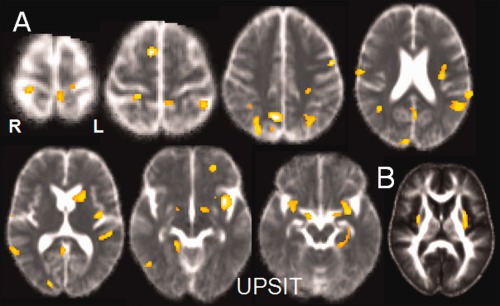
(A) Negative correlation between UPSIT scores and MD: correlations were found bilaterally in the central areas, the superior and inferior parietal gyri, the temporal and superior occipital gyri, the right superior frontal gyrus, and in olfactory areas (olfactory areas, insula and limbic temporal lobe). In subcortical areas, MD correlated negatively with UPSIT scores in the caudate nucleus, the anterior part of the putamen and the globus pallidus in the left hemisphere and the right thalamus. (B) Positive correlation between UPSIT scores and FA in the white matter of the insular area and the left external capsule. [Color figure can be viewed in the online issue, which is available at http://wileyonlinelibrary.com.]
There was a positive correlation between UPSIT scores and FA in the white matter of the insular area and the left external capsule (Table 5, Fig. 3b).
Table 5.
Anatomical regions of correlations between MD and FA and the UPSIT test
| MNI coordinates | ||||||
|---|---|---|---|---|---|---|
| Brodmann area | Side | x | y | Z | T score | |
| MD | UPSIT negative correlation | |||||
| Superior frontal gyrus | 6 | L | −20 | 2 | 66 | 5.10 |
| 6 | R | 10 | 6 | 60 | 7.20 | |
| Olfactory gyrus | 11 | L | −26 | 6 | −18 | 3.86 |
| 11 | R | 30 | 10 | −20 | 4.18 | |
| Orbital gyrus | 11 | L | −24 | 46 | −8 | 4.76 |
| Precentral gyrus | 4 | L | −52 | −2 | 44 | 5.77 |
| R | 22 | −32 | 68 | 4.85 | ||
| Paracentral gyrus | 5 | L | −12 | −34 | 52 | 4.16 |
| Post central | 123 | R | 22 | −34 | 66 | 5.48 |
| Precuneus | 7 | R | 10 | −60 | 44 | 6.80 |
| Superior parietal gyrus | 7 | L | −34 | −62 | 52 | 5.09 |
| Inferior parietal gyrus | 40 | L | −34 | −62 | 52 | 5.09 |
| 39 | R | 42 | −62 | 34 | 5.00 | |
| Posterior cingulate gyrus | 29 | R | 12 | −36 | 6 | 3.67 |
| Superior temporal gyrus | 22 | L | −62 | −38 | 22 | 5.11 |
| R | 60 | −54 | 4 | 4.95 | ||
| Middle temporal gyrus | 21 | L | −54 | −54 | 22 | 4.94 |
| Inferior temporal gyrus | 37 | R | 50 | −62 | −4 | 4.73 |
| Amygdala | L | −30 | 2 | −18 | 4.73 | |
| R | 20 | 0 | −12 | 4.65 | ||
| Hippocampus | L | −32 | −16 | −20 | 3.94 | |
| R | 18 | −4 | −12 | 4.39 | ||
| Parahippocampus | L | −26 | −32 | 8 | 4.25 | |
| R | 18 | −42 | −6 | 4.54 | ||
| Superior occipital gyrus | 19 | L | −26 | −58 | 34 | 5.87 |
| 19 | R | 30 | −74 | 38 | 4.79 | |
| Insula | L | −36 | 8 | −8 | 6.21 | |
| R | 30 | 12 | −20 | 4.25 | ||
| External capsule | L | −26 | 12 | −12 | 5.35 | |
| Caudate nucleus | L | −16 | 12 | 8 | 4.17 | |
| Putamen anterior | L | −20 | 12 | 10 | 4.39 | |
| Thalamus | R | 16 | −34 | 2 | 4.07 | |
| Pallidum | L | −12 | 0 | −6 | 4.22 | |
| FA | UPSIT positive correlation | |||||
| Insula | L | −38 | 10 | −10 | 6.35 | |
| R | 34 | 10 | −14 | 4.92 | ||
| External capsule | L | −30 | 2 | 10 | 5.41 | |
P FWE < 0.05 corrected after SVC correction.
Trail B timing
There was a positive correlation between MD and TMT B timing scores in the parahippocampal gyrus and the superior longitudinal fasciculus in the right hemisphere, the superior parietal gyrus (BA 7), the globus pallidus, and the anterior putamen in the left hemisphere (Fig. 4a). There was a negative correlation between FA and TMT B timing scores in the white matter of the left anterior corona radiata and the anterior limb of the internal capsule (Fig. 4b; Table 6).
Figure 4.
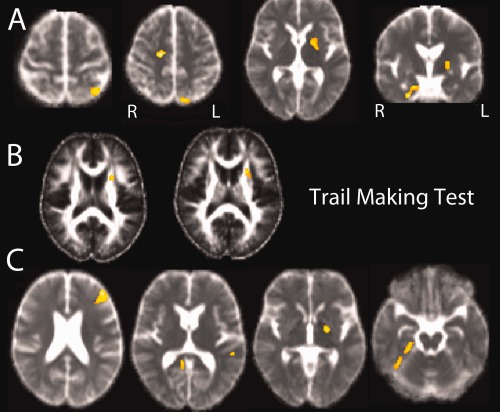
(A) Positive correlation between MD and TMT B timing scores: correlations were found in the parahippocampal gyrus and the superior longitudinal fasciculus in the right hemisphere, the superior parietal gyrus, the globus pallidus and the anterior putamen in the left hemisphere. (B) Negative correlation between FA and TMT B timing scores: correlations were found in the white matter of the left anterior corona radiata and the anterior limb of the internal capsule. (C) Positive correlation between mental flexibility index and MD in the left prefrontal region, the left superior temporal gyrus, the left globus pallidus, the right parahippocampus, and the right lingual gyrus. [Color figure can be viewed in the online issue, which is available at http://wileyonlinelibrary.com.]
Table 6.
Anatomical regions of correlations between MD and FA and the trail making test
| MNI coordinates | ||||||
|---|---|---|---|---|---|---|
| Brodmann area | Side | x | y | z | T score | |
| MD | Trail B timing positive correlation | |||||
| Superior parietal gyrus | 7 | L | −34 | −58 | 60 | 5.13 |
| Parahippocampal gyrus | 31 | R | 20 | −6 | −26 | 4.98 |
| Superior longitudinal fasciculus | R | 28 | −22 | 40 | 4.46 | |
| Putamen anterior | L | −20 | 2 | 4 | 4.31 | |
| Globus pallidus | L | −20 | 0 | 4 | 4.27 | |
| MD | Mental flexibility index positive correlation | |||||
| Middle frontal gyrus | 46 | L | −40 | 36 | 16 | 6.30 |
| Superior temporal gyrus | 22 | L | −54 | −36 | 10 | 5.14 |
| Parahippocampus | R | 26 | −28 | −20 | 4.31 | |
| Lingual gyrus | 18 | R | 10 | −46 | 4 | 4.45 |
| Globus pallidus | L | −20 | −8 | −2 | 5.02 | |
| FA | Trail B timing negative correlation | |||||
| Anterior capsule | L | −24 | 10 | 16 | 5.10 | |
| Anterior corona radiata | L | −24 | 12 | 16 | 5.07 | |
P FWE < 0.05 corrected after SVC correction.
Mental flexibility index
There was a positive correlation between this score and MD in the left prefrontal region (BA 46), the left superior temporal gyrus (BA 22), the left globus pallidus, the right parahippocampus, and the right lingual gyrus (BA 18), (Fig. 4c; Table 6).
Neuropsychiatric Test
Apathy
There was a negative correlation between scores of apathy and FA in the white matter of the gyrus rectus bilaterally (MNI coordinates: ‐2, 22, ‐30, T score: 4.65 in the left hemisphere, and 10, 22, ‐28, T score 6.53 in the right hemisphere, Fig. 5).
Figure 5.
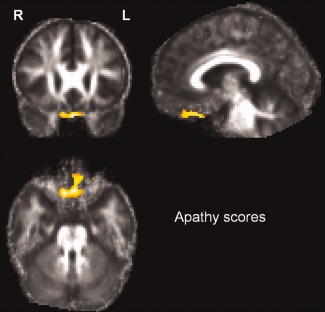
Correlation between scores of apathy and FA. There was a negative correlation between scores and FA in the white matter of the gyrus rectus bilaterally. [Color figure can be viewed in the online issue, which is available at http://wileyonlinelibrary.com.]
DISCUSSION
Using voxel‐based DTI analysis, we showed that cognitive, behavioral and motor deficits were associated with distinct regionally specific cortico‐striatal degeneration. These results suggest that the clinical dysfunction in HD results from cortical as well as subcortical damage. We also confirm that water diffusivity and anisotropy are diffusely altered in the brain of HD patients in early stages of the disease.
This study took advantage of the well controlled TRACK‐HD studies to examine structural correlates between DTI and the analyzed tasks. We showed that in early HD there was increased MD and decreased FA in the gray and white matter involving the occipital, temporal, parietal and frontal lobes with relative preservation of prefrontal areas. These results are in accordance with numerous previous DTI studies; which reported lower FA using ROI analysis in presymptomatic gene carriers and symptomatic HD in the frontal [Reading et al., 2005; Rosas et al., 2006, 2010], occipital [Reading et al., 2005; Rosas et al., 2006], and parietal lobes [Rosas et al., 2006], in the white matter of the corpus callosum and the internal capsule [Kloppel et al., 2008; Rosas et al., 2006], and in the fronto–striatal connections [Kloppel et al., 2008]. Using whole brain methods, decreased FA was demonstrated along the white matter of the fronto striatal fibers, the internal capsule, the centrum ovale [Weaver et al., 2009], and associated fiber bundles [Stoffers et al., 2010]. We also found increased FA and MD in the caudate nucleus and the putamen bilaterally, in line with the higher MD [Douaud et al., 2009; Henley et al., 2009; Mascalchi et al., 2004] and FA [Douaud et al., 2009] reported in both HD and presymptomatic gene carriers [Rosas et al., 2006]. FA increase in the striatum and globus pallidus was attributed to a decreased dispersion of fiber orientation, with a preferential loss of connections along specific radiating directions from the striatum while other fibers were relatively spared [Douaud et al., 2009].
HD patients and premanifest gene carriers showed impaired performance during self‐paced timing tasks that worsened with disease progression [Bechtel et al., 2010; Michell et al., 2008; Rowe et al., 2010; Zimbelman et al., 2007]. We found that the variability of tap deviation at 1.8 and 3Hz correlated with diffusion changes in the superior temporal and parietal regions, and the anterior part of the striatum. Activity in the superior temporal gyrus has been previously demonstrated using fMRI in voluntary timing tasks involving auditory stimuli: paced finger tapping synchronized with an external auditory cue [Jantzen et al., 2004, 2005], taping using rhythmic sequences [Lewis et al., 2004], and reproduction of rhythmic sequences [Penhune et al., 1998]. In the synchronization–continuation paradigm, superior temporal activity was seen with auditory stimuli, but not with visual stimuli [Jantzen et al., 2005]. Together with the inferior frontal and parietal regions, the posterior and dorsal part of the superior temporal gyrus constitutes a dorsal auditory stream that is involved in auditory‐motor control [Hickok et al., 2000]. Involvement of auditory areas in HD patients may reflect that the sequences were learned from auditory stimuli or that an auditory metronome was used to set the tempo in the self‐paced tapping task. We also observed a correlation between task performances and diffusion changes in anterior striatal regions. The variability of tap deviation in self paced tapping tasks was previously correlated with striatal volume in HD [Biglan et al., 2009] and premanifest gene carriers [Bechtel et al., 2010]. In healthy subjects performing self‐paced finger tapping tasks, the basal ganglia were constantly activated [Jenkins et al., 2000; Lehericy et al., 2006; Witt et al., 2008; Wu and Hallett, 2005; Wu et al., 2004]. Striatal activation was observed in anterior regions corresponding to those with diffusion changes observed here [Jenkins et al., 2000]. Lastly, a correlation was also observed in the prefrontal cortex at 3 Hz but not at 1.8 Hz. Involvement of the prefrontal cortex is in agreement with the observation that this region was recruited at high (3 Hz) but not low movement frequencies [Lehericy et al., 2006]. Paced timing tasks required subjects to tap in time to the tones from working memory. At 3 Hz the task became more difficult as shown by the increased SD as compared with 1.8 Hz and therefore probably required greater involvement of the prefrontal cortex. The structural correlates of self tapping tasks were not reported previously in HD. However, motor symptoms expression in HD subjects was associated with distinct cortical involvement [Rosas et al., 2008]. Bradykinesia and chorea were associated with extensive damage of lateral premotor, supplementary motor, and prefrontal areas than in chorea, in spite of similar reductions in caudate volumes between the two clinical phenotypes [Rosas et al., 2008].
Correct identification of the odor name is a complex task involving the hippocampus, the amygdala, the piriform, entorhinal, perirhinal, orbitofrontal, and inferior frontal regions and the insula [Kareken et al., 2003]. The caudate nucleus was implicated during the smelling of single odors and the discrimination of odor quality [Savic et al., 2000]. Deficits in odor discrimination, identification, and detection occur in patients with HD [Bylsma et al., 1997; Hamilton et al., 1999; Moberg and Doty, 1997; Nordin et al., 1995] and neuropathology studies have demonstrated that huntingtin aggregates in the olfactory system [Hamilton et al., 1999; Nordin et al., 1995]. In our study, specific deficit in the UPSIT test correlated with abnormalities in the insula, and the anterior part of the caudate nucleus bilaterally and the medial temporal cortex, these regions being associated with olfaction [Kareken et al., 2003]. This result is in line with previous study, which demonstrated that volume loss in the insula and the caudate nucleus had significant impact on olfactory function in HD patients [Barrios et al., 2007].
TMT is a measure of executive functions that assesses cognitive flexibility, selective attention, visual scanning, and visual‐motor tracking [Zakzanis et al., 2005]. In our HD subjects, the mental flexibility index correlated with diffusion changes in the left prefrontal cortex and the white matter of the frontal lobe. Performances at the TMT‐B correlated inversely with diffusion changes in the superior longitudinal fasciculus, the superior parietal lobe, and the temporal areas. This is in line with a previous study in HD, which related the volume of the frontal and temporal cortex to performances at the TMT‐A and TMT‐B [Backman et al., 1997]. The TMT‐B has the greatest working memory demands [Crowe, 1998] and is sensitive to dorsolateral frontal damage [Stuss et al., 2001]. Functional imaging studies have also demonstrated that set‐shifting in the TMT test recruits temporal and parietal regions in addition to frontal regions [Zakzanis et al., 2005]. In healthy ageing, decline in set‐shifting performance in TMT tests was associated with decreased FA in the corpus callosum and association tracts that connect frontal cortex to posterior brain regions, including the inferior fronto‐occipital fasciculus, the uncinate fasciculus, and the superior longitudinal fasciculus [Perry et al., 2009]. Taken together, our data and these previous studies suggest that accurate performance at the TMT involves a number of functionally specialized frontal, parietal, and temporal regions and that the integrity of white matter tracts connecting these regions is a critical factor of performance. Reduced cortical thickness in frontal cortical areas has been previously shown to correlate with worse performance in cognitive tests including emotion recognition [Henley et al., 2008], symbol digit in presymptomatic gene carriers [Rosas et al., 2005].
Apathy, depression and irritability are commonly observed in HD [Thompson et al., 2002]. Apathy can be observed even before motor symptoms occur [Kingma et al., 2008]. Apathy is also strongly correlated with disease progression [Craufurd et al., 2001]. In contrast with the irritability and depression subscales, scores on the Apathy subscale of the PBA‐HD strongly correlated with measures of cognition and motor functions [Thompson et al., 2002]. Here, apathy correlated with FA changes in the white matter underlying the gyrus rectus bilaterally. The orbitomedial prefrontal cortex (OMPFC) is connected to limbic and visceromotor brain regions, including the ventral striatum [Ongur et al., 2003]. Behavioral and electrophysiological studies in monkeys [Levy and Dubois, 2006] and imaging studies in humans [Elliott et al., 2003] indicated that the OMPFC is essential to provide the contextual value of reward and to integrate the rewarding value of a stimulus into behavior. Electrophysiological studies in monkeys have demonstrated that lesions or dysfunctions of the OMPFC can lead to insensitivity to reward, which may in turn lead to a decreased number of voluntary actions [Tremblay and Schultz, 1999]. Apathy may in this case be related to a disruption of affective and emotional processing. We did not find any correlation between the ventral striatum and apathy scores. An explanation may be that the ventral limbic striatum is relatively preserved in early HD in histological studies [Vonsattel, 2008].
For each score, clinical deficits were correlated with higher MD and lower FA. Increased MD in cortical areas and basal ganglia was consistent with the neuronal loss in patients. The most significant neuropathological change in HD is a preferential loss of medium spiny neurons in the neostriatum, but other regions, including the cortex become increasingly affected as the disease progresses. A significant loss of neurons, a decreased cortical neuron number, reduction in cortical width and increased glial density are observed in the cerebral cortex of HD patients at moderate and terminal stages of the illness including frontal, parietal and temporal regions [Heinsen et al., 1994; Mann et al., 1993; Selemon et al., 2004]. In the white matter, decreased FA may either reflect the secondary neuronal damage due to deafferentation or the axonal degeneration. Histopathological studies have documented a marked reduction in the number of axonal fibers and synaptic proteins early in the course of HD [Li et al., 2001]. The distribution of huntingtin aggregates in the axons of striatal projection neurons was specifically associated with axonal degeneration [Li et al., 2001]. Axonal degeneration was also found in corticostriatal pathways in the brains of HD patients [Sapp et al., 1999]. Fibers in the subcortical white matter of HD patients had significantly increased huntingtin immunoreactivity compared with those of controls [Sapp et al., 1997]. These neuropathological changes may underlie DTI changes that demonstrated early signs of white matter degeneration in pre symptomatic HD and suggested that alterations in neuronal connectivity play a major role in HD pathology.
In conclusion, this study showed that the clinical symptoms observed in HD were related to region‐specific cortical as well as basal ganglia damage. Our findings suggest that while striatal degeneration clearly plays a major role in movement disorders of HD, cortical dysfunction in region‐specific areas contribute to the different clinical expression in line with previous reports.
Acknowledgments
The authors wish to extend their gratitude to the TRACK‐HD study participants and the TRACK‐HD Investigators.
REFERENCES
- Aylward EH, Li Q, Stine OC, Ranen N, Sherr M, Barta PE, Bylsma FW, Pearlson GD, Ross CA (1997): Longitudinal change in basal ganglia volume in patients with Huntington's disease. Neurology 48:394–399. [DOI] [PubMed] [Google Scholar]
- Backman L, Robins‐Wahlin TB, Lundin A, Ginovart N, Farde L (1997): Cognitive deficits in Huntington's disease are predicted by dopaminergic PET markers and brain volumes. Brain 120 ( Part 12):2207–2217. [DOI] [PubMed] [Google Scholar]
- Barrios FA, Gonzalez L, Favila R, Alonso ME, Salgado PM, Diaz R, Fernandez‐Ruiz J (2007): Olfaction and neurodegeneration in HD. Neuroreport 18:73–76. [DOI] [PubMed] [Google Scholar]
- Basser PJ, Pierpaoli C (1996): Microstructural and physiological features of tissues elucidated by quantitative‐diffusion‐tensor MRI. J Magn Reson B 111:209–219. [DOI] [PubMed] [Google Scholar]
- Basser PJ, Pierpaoli C (1998): A simplified method to measure the diffusion tensor from seven MR images. Magn Reson Med 39:928–934. [DOI] [PubMed] [Google Scholar]
- Bechtel N, Scahill RI, Rosas HD, Acharya T, van den Bogaard SJ, Jauffret C, Say MJ, Sturrock A, Johnson H, Onorato CE, Salat DH, Durr A, Leavitt BR, Roos RA, Landwehrmeyer GB, Langbehn DR, Stout JC, Tabrizi SJ, Reilmann R (2010): Tapping linked to function and structure in premanifest and symptomatic Huntington disease. Neurology 75:2150–2160. [DOI] [PMC free article] [PubMed] [Google Scholar]
- Biglan KM, Ross CA, Langbehn DR, Aylward EH, Stout JC, Queller S, Carlozzi NE, Duff K, Beglinger LJ, Paulsen JS (2009): Motor abnormalities in premanifest persons with Huntington's disease: The PREDICT‐HD study. Mov Disord 24:1763–1772. [DOI] [PMC free article] [PubMed] [Google Scholar]
- Bylsma FW, Moberg PJ, Doty RL, Brandt J (1997): Odor identification in Huntington's disease patients and asymptomatic gene carriers. J Neuropsychiatry Clin Neurosci 9:598–600. [DOI] [PubMed] [Google Scholar]
- Craufurd D, Thompson JC, Snowden JS (2001): Behavioral changes in Huntington disease. Neuropsychiatry Neuropsychol Behav Neurol 14:219–226. [PubMed] [Google Scholar]
- Crowe SF (1998): The differential contribution of mental tracking, cognitive flexibility, visual search, and motor speed to performance on parts A and B of the trail making test. J Clin Psychol 54:585–591. [DOI] [PubMed] [Google Scholar]
- Douaud G, Behrens TE, Poupon C, Cointepas Y, Jbabdi S, Gaura V, Golestani N, Krystkowiak P, Verny C, Damier P, Bachoud-Levi AC, Hantraye P, Remy P (2009): In vivo evidence for the selective subcortical degeneration in Huntington's disease. Neuroimage 46:958–966. [DOI] [PubMed] [Google Scholar]
- Elliott R, Newman JL, Longe OA, Deakin JF (2003): Differential response patterns in the striatum and orbitofrontal cortex to financial reward in humans: A parametric functional magnetic resonance imaging study. J Neurosci 23:303–307. [DOI] [PMC free article] [PubMed] [Google Scholar]
- Friston KJ (1997): Testing for anatomically specified regional effects. Hum Brain Mapp 5:133–136. [DOI] [PubMed] [Google Scholar]
- Halliday GM, McRitchie DA, Macdonald V, Double KL, Trent RJ, McCusker E (1998): Regional specificity of brain atrophy in Huntington's disease. Exp Neurol 154:663–672. [DOI] [PubMed] [Google Scholar]
- Hamilton JM, Murphy C, Paulsen JS (1999): Odor detection, learning, and memory in Huntington's disease. J Int Neuropsychol Soc 5:609–615. [DOI] [PubMed] [Google Scholar]
- Heinsen H, Strik M, Bauer M, Luther K, Ulmar G, Gangnus D, Jungkunz G, Eisenmenger W, Gotz M (1994): Cortical and striatal neurone number in Huntington's disease. Acta Neuropathol 88:320–333. [DOI] [PubMed] [Google Scholar]
- Henley SM, Wild EJ, Hobbs NZ, Warren JD, Frost C, Scahill RI, Ridgway GR, MacManus DG, Barker RA, Fox NC, Tabrizi SJ. (2008): Defective emotion recognition in early HD is neuropsychologically and anatomically generic. Neuropsychologia 46:2152–2160. [DOI] [PubMed] [Google Scholar]
- Henley SM, Wild EJ, Hobbs NZ, Frost C, MacManus DG, Barker RA, Fox NC, Tabrizi SJ (2009): Whole‐brain atrophy as a measure of progression in premanifest and early Huntington's disease. Mov Disord 24:932–936. [DOI] [PubMed] [Google Scholar]
- Hickok G, Erhard P, Kassubek J, Helms‐Tillery AK, Naeve‐Velguth S, Strupp JP, Strick PL, Ugurbil K (2000): A functional magnetic resonance imaging study of the role of left posterior superior temporal gyrus in speech production: Implications for the explanation of conduction aphasia. Neurosci Lett 287:156–160. [DOI] [PubMed] [Google Scholar]
- Hobbs NZ, Henley SM, Ridgway GR, Wild EJ, Barker RA, Scahill RI, Barnes J, Fox NC, Tabrizi SJ (2009): The progression of regional atrophy in premanifest and early Huntington's disease: A longitudinal voxel‐based morphometry study. J Neurol Neurosurg Psychiatry 81:756–763. [DOI] [PubMed] [Google Scholar]
- Huntington Study Group (1996): Unified Huntington's disease rating scale: Reliability and consistency. Mov Disord 11:136–142. [DOI] [PubMed] [Google Scholar]
- Jantzen KJ, Steinberg FL, Kelso JA (2004): Brain networks underlying human timing behavior are influenced by prior context. Proc Natl Acad Sci USA 101:6815–6820. [DOI] [PMC free article] [PubMed] [Google Scholar]
- Jantzen KJ, Steinberg FL, Kelso JA (2005): Functional MRI reveals the existence of modality and coordination‐dependent timing networks. Neuroimage 25:1031–1042. [DOI] [PubMed] [Google Scholar]
- Jenkins IH, Jahanshahi M, Jueptner M, Passingham RE, Brooks DJ (2000): Self‐initiated versus externally triggered movements. II. The effect of movement predictability on regional cerebral blood flow. Brain 123 ( Part 6):1216–1228. [DOI] [PubMed] [Google Scholar]
- Kareken DA, Mosnik DM, Doty RL, Dzemidzic M, Hutchins GD (2003): Functional anatomy of human odor sensation, discrimination, and identification in health and aging. Neuropsychology 17:482–495. [DOI] [PubMed] [Google Scholar]
- Kingma EM, van Duijn E, Timman R, van der Mast RC, Roos RA (2008): Behavioral problems in Huntington's disease using the problem behaviors assessment. Gen Hosp Psychiatry 30:155–161. [DOI] [PubMed] [Google Scholar]
- Klöppel S, Draganski B, Golding CV, Chu C, Nagy Z, Cook PA, Hicks SL, Kennard C, Alexander DC, Parker GJ, Tabrizi SJ, Frackowiak RS (2008): White matter connections reflect changes in voluntary‐guided saccades in pre‐symptomatic Huntington's disease. Brain 131 ( Part 1):196–204. [DOI] [PubMed] [Google Scholar]
- Le Bihan D, Jezzard P, Haxby J, Sadato N, Rueckert L, Mattay V (1995): Functional magnetic resonance imaging of the brain. Ann Intern Med 122:296–303. [DOI] [PubMed] [Google Scholar]
- Lehericy S, Bardinet E, Tremblay L, Van de Moortele PF, Pochon JB, Dormont D, Kim DS, Yelnik J, Ugurbil K (2006): Motor control in basal ganglia circuits using fMRI and brain atlas approaches. Cereb Cortex 16:149–161. [DOI] [PubMed] [Google Scholar]
- Levy R, Dubois B (2006): Apathy and the functional anatomy of the prefrontal cortex‐basal ganglia circuits. Cereb Cortex 16:916–928. [DOI] [PubMed] [Google Scholar]
- Lewis PA, Wing AM, Pope PA, Praamstra P, Miall RC (2004): Brain activity correlates differentially with increasing temporal complexity of rhythms during initialization, synchronization, and continuation phases of paced finger tapping. Neuropsychologia 42:1301–1312. [DOI] [PubMed] [Google Scholar]
- Li H, Li SH, Yu ZX, Shelbourne P, Li XJ (2001): Huntington aggregate‐associated axonal degeneration is an early pathological event in Huntington's disease mice. J Neurosci 21:8473–8481. [DOI] [PMC free article] [PubMed] [Google Scholar]
- Macdonald V, Halliday G (2002): Pyramidal cell loss in motor cortices in Huntington's disease. Neurobiol Dis 10:378–386. [DOI] [PubMed] [Google Scholar]
- Mangin JF, Poupon C, Clark C, Le Bihan D, Bloch I (2002): Distortion correction and robust tensor estimation for MR diffusion imaging. Med Image Anal 6:191–198. [DOI] [PubMed] [Google Scholar]
- Mann DM, Oliver R, Snowden JS (1993): The topographic distribution of brain atrophy in Huntington's disease and progressive supranuclear palsy. Acta Neuropathol 85:553–559. [DOI] [PubMed] [Google Scholar]
- Mascalchi M, Lolli F, Della Nave R, Tessa C, Petralli R, Gavazzi C, Politi LS, Macucci M, Filippi M, Piacentini S (2004): Huntington disease: Volumetric, diffusion‐weighted, and magnetization transfer MR imaging of brain. Radiology 232:867–873. [DOI] [PubMed] [Google Scholar]
- Michell AW, Goodman AO, Silva AH, Lazic SE, Morton AJ, Barker RA (2008): Hand tapping: A simple, reproducible, objective marker of motor dysfunction in Huntington's disease. J Neurol 255:1145–1152. [DOI] [PubMed] [Google Scholar]
- Moberg PJ, Doty RL (1997): Olfactory function in Huntington's disease patients and at‐risk offspring. Int J Neurosci 89:133–139. [DOI] [PubMed] [Google Scholar]
- Moseley ME, Cohen Y, Kucharczyk J, Mintorovitch J, Asgari HS, Wendland MF, Tsuruda J, Norman D (1990): Diffusion‐weighted MR imaging of anisotropic water diffusion in cat central nervous system. Radiology 176:439–445. [DOI] [PubMed] [Google Scholar]
- Nordin S, Paulsen JS, Murphy C (1995): Sensory‐ and memory‐mediated olfactory dysfunction in Huntington's disease. J Int Neuropsychol Soc 1:281–290. [DOI] [PubMed] [Google Scholar]
- Ongur D, Ferry AT, Price JL (2003): Architectonic subdivision of the human orbital and medial prefrontal cortex. J Comp Neurol 460:425–449. [DOI] [PubMed] [Google Scholar]
- Penhune VB, Zattore RJ, Evans AC (1998): Cerebellar contributions to motor timing: A PET study of auditory and visual rhythm reproduction. J Cogn Neurosci 10:752–765. [DOI] [PubMed] [Google Scholar]
- Penney JB Jr, Vonsattel JP, MacDonald ME, Gusella JF, Myers RH (1997): CAG repeat number governs the development rate of pathology in Huntington's disease. Ann Neurol 41:689–692. [DOI] [PubMed] [Google Scholar]
- Perry ME, McDonald CR, Hagler DJ Jr, Gharapetian L, Kuperman JM, Koyama AK, Dale AM, McEvoy LK (2009): White matter tracts associated with set‐shifting in healthy aging. Neuropsychologia 47:2835–2842. [DOI] [PMC free article] [PubMed] [Google Scholar]
- Pierpaoli C, Basser PJ (1996): Toward a quantitative assessment of diffusion anisotropy. Magn Reson Med 36:893–906. [DOI] [PubMed] [Google Scholar]
- Reading SA, Yassa MA, Bakker A, Dziorny AC, Gourley LM, Yallapragada V, Rosenblatt A, Margolis RL, Aylward EH, Brandt J, Mori S, van Zijl P, Bassett SS, Ross CA (2005): Regional white matter change in pre‐symptomatic Huntington's disease: A diffusion tensor imaging study. Psychiatry Res 140:55–62. [DOI] [PubMed] [Google Scholar]
- Rosas HD, Liu AK, Hersch S, Glessner M, Ferrante RJ, Salat DH, van der Kouwe A, Jenkins BG, Dale AM, Fischl B (2002): Regional and progressive thinning of the cortical ribbon in Huntington's disease. Neurology 58:695–701. [DOI] [PubMed] [Google Scholar]
- Rosas HD, Hevelone ND, Zaleta AK, Greve DN, Salat DH, Fischl B (2005): Regional cortical thinning in preclinical Huntington disease and its relationship to cognition. Neurology 65:745–747. [DOI] [PubMed] [Google Scholar]
- Rosas HD, Tuch DS, Hevelone ND, Zaleta AK, Vangel M, Hersch SM, Salat DH (2006): Diffusion tensor imaging in presymptomatic and early Huntington's disease: Selective white matter pathology and its relationship to clinical measures. Mov Disord 21:1317–1325. [DOI] [PubMed] [Google Scholar]
- Rosas HD, Salat DH, Lee SY, Zaleta AK, Pappu V, Fischl B, Greve D, Hevelone N, Hersch SM (2008): Cerebral cortex and the clinical expression of Huntington's disease: Complexity and heterogeneity. Brain 131 ( Part 4):1057–1068. [DOI] [PMC free article] [PubMed] [Google Scholar]
- Rosas HD, Lee SY, Bender AC, Zaleta AK, Vangel M, Yu P, Fischl B, Pappu V, Onorato C, Cha JH, Salat DH, Hersch SM. (2010): Altered white matter microstructure in the corpus callosum in Huntington's disease: Implications for cortical “disconnection.” Neuroimage 49:2995–3004. [DOI] [PMC free article] [PubMed] [Google Scholar]
- Rowe KC, Paulsen JS, Langbehn DR, Duff K, Beglinger LJ, Wang C, O'Rourke JJ, Stout JC, Moser DJ (2010): Self‐paced timing detects and tracks change in prodromal Huntington disease. Neuropsychology 24:435–442. [DOI] [PMC free article] [PubMed] [Google Scholar]
- Sapp E, Schwarz C, Chase K, Bhide PG, Young AB, Penney J, Vonsattel JP, Aronin N, DiFiglia M (1997): Huntingtin localization in brains of normal and Huntington's disease patients. Ann Neurol 42:604–612. [DOI] [PubMed] [Google Scholar]
- Sapp E, Penney J, Young A, Aronin N, Vonsattel JP, DiFiglia M (1999): Axonal transport of N‐terminal huntingtin suggests early pathology of corticostriatal projections in Huntington disease. J Neuropathol Exp Neurol 58:165–173. [DOI] [PubMed] [Google Scholar]
- Savic I, Gulyas B, Larsson M, Roland P (2000): Olfactory functions are mediated by parallel and hierarchical processing. Neuron 26:735–745. [DOI] [PubMed] [Google Scholar]
- Selemon LD, Rajkowska G, Goldman‐Rakic PS (2004): Evidence for progression in frontal cortical pathology in late‐stage Huntington's disease. J Comp Neurol 468:190–204. [DOI] [PubMed] [Google Scholar]
- Smith A (1991): Symbol Digit Modalities Test. Los Angeles: Western Psychological Services. [Google Scholar]
- Squitieri F, Cannella M, Simonelli M, Sassone J, Martino T, Venditti E, Ciammola A, Colonnese C, Frati L, Ciarmiello A (2009): Distinct brain volume changes correlating with clinical stage, disease progression rate, mutation size, and age at onset prediction as early biomarkers of brain atrophy in Huntington's disease. CNS Neurosci Ther 15:1–11. [DOI] [PMC free article] [PubMed] [Google Scholar]
- Stoffers D, Sheldon S, Kuperman JM, Goldstein J, Corey‐Bloom J, Aron AR (2010): Contrasting gray and white matter changes in preclinical Huntington disease: An MRI study. Neurology 74:1208–1216. [DOI] [PMC free article] [PubMed] [Google Scholar]
- Stroop JR (1935): Studies on interference in serial verbal reactions. J Exp Psychol 18:643–662. [Google Scholar]
- Stuss DT, Bisschop SM, Alexander MP, Levine B, Katz D, Izukawa D (2001): The trail making test: A study in focal lesion patients. Psychol Assess 13:230–239. [PubMed] [Google Scholar]
- Tabrizi SJ, Langbehn DR, Leavitt BR, Roos RA, Durr A, Craufurd D, Kennard C, Hicks SL, Fox NC, Scahill RI, Borowsky B, Tobin AJ, Rosas HD, Johnson H, Reilmann R, Landwehrmeyer B, Stout JC; TRACK-HD investigators (2009): Biological and clinical manifestations of Huntington's disease in the longitudinal TRACK‐HD study: Cross‐sectional analysis of baseline data. Lancet Neurol 8:791–801. [DOI] [PMC free article] [PubMed] [Google Scholar]
- Thompson JC, Snowden JS, Craufurd D, Neary D (2002): Behavior in Huntington's disease: Dissociating cognition‐based and mood‐based changes. J Neuropsychiatry Clin Neurosci 14:37–43. [DOI] [PubMed] [Google Scholar]
- Tremblay L, Schultz W (1999): Relative reward preference in primate orbitofrontal cortex. Nature 398:704–708. [DOI] [PubMed] [Google Scholar]
- Tzourio‐Mazoyer N, Landeau B, Papathanassiou D, Crivello F, Etard O, Delcroix N, Mazoyer B, Joliot M (2002): Automated anatomical labeling of activations in SPM using a macroscopic anatomical parcellation of the MNI MRI single‐subject brain. Neuroimage 15:273–289. [DOI] [PubMed] [Google Scholar]
- Vonsattel JP (2008): Huntington disease models and human neuropathology: Similarities and differences. Acta Neuropathol 115:55–69. [DOI] [PMC free article] [PubMed] [Google Scholar]
- Weaver KE, Richards TL, Liang O, Laurino MY, Samii A, Aylward EH (2009): Longitudinal diffusion tensor imaging in Huntington's Disease. Exp Neurol 216:525–529. [DOI] [PMC free article] [PubMed] [Google Scholar]
- Witt ST, Laird AR, Meyerand ME (2008): Functional neuroimaging correlates of finger‐tapping task variations: An ALE meta‐analysis. Neuroimage 42:343–356. [DOI] [PMC free article] [PubMed] [Google Scholar]
- Worsley KJ, Marrett S, Neelin P, Vandal AC, Friston KJ, Evans AC (1996): A unified statistical approach for determining significant signals in images of cerebral activation. Hum Brain Mapp 4:58–73. [DOI] [PubMed] [Google Scholar]
- Wu T, Hallett M (2005): A functional MRI study of automatic movements in patients with Parkinson's disease. Brain 128 ( Part 10):2250–2259. [DOI] [PubMed] [Google Scholar]
- Wu T, Kansaku K, Hallett M (2004): How self‐initiated memorized movements become automatic: A functional MRI study. J Neurophysiol 91:1690–1698. [DOI] [PubMed] [Google Scholar]
- Zakzanis KK, Mraz R, Graham SJ (2005): An fMRI study of the trail making test. Neuropsychologia 43:1878–1886. [DOI] [PubMed] [Google Scholar]
- Zimbelman JL, Paulsen JS, Mikos A, Reynolds NC, Hoffmann RG, Rao SM (2007): fMRI detection of early neural dysfunction in preclinical Huntington's disease. J Int Neuropsychol Soc 13:758–769. [DOI] [PubMed] [Google Scholar]