

Abstract
Numerosity and duration processing have been modeled by a functional mechanism taking the form of an accumulator working under two different operative modes. Separate investigations of their cerebral substrates have revealed partly similar patterns of activation, mainly in parietal and frontal areas. However, the precise cerebral implementation of the accumulator model within these areas has not yet been directly assessed. In this study, we asked participants to categorize the numerosity of flashed dot sequences or the duration of single dot displays, and we used functional magnetic resonance imaging (fMRI) to examine the common neural correlates of these processes. The results reveal a large right‐lateralized fronto‐parietal network, including the intraparietal sulcus (IPS) and areas in the precentral, middle and superior frontal gyri, which is activated by both numerosity and duration processing. Complementary psychophysiological interaction (PPI) analyses show a functional connectivity between the right IPS and the frontal areas in both tasks, whereas the right IPS was functionally connected to the left IPS and the right precentral area in the numerosity categorization task only. We propose that the right IPS underlies a common magnitude processing system for both numerosity and duration, possibly corresponding to the encoding and accumulation stages of the accumulator model, whereas the frontal areas are involved in subsequent working‐memory storage and decision‐making processes. Hum Brain Mapp, 2011. © 2011 Wiley‐Liss, Inc.
Keywords: numerosity processing, duration processing, intraparietal sulcus, functional magnetic resonance imaging
INTRODUCTION
Number and time are fundamental dimensions of the environment, and are constantly used by animals and human beings to regulate and adapt their behavior to the external world. There is strong evidence that the abilities to quantify numerosities (i.e., the number of elements in a collection) and temporal intervals are shared by animals and human beings, and that they develop early in infancy [e.g., Boysen and Capaldi, 1993; Brannon et al., 2007; Breukelaar and Dalrymple‐Alford, 1998]. In the early 1980s, Meck and Church [1983] proposed the accumulator model, a functional mechanism capable of representing both numerical and temporal estimation processes on a common representational medium. In this model, a pacemaker corresponding to a counter or a clock initially sends pulses to an accumulator, either each time an event occurs or at a given frequency as long as an event lasts. Then, the pulses are summed in the accumulator and stored in working memory before being compared with previously memorized numerical or temporal magnitudes. Finally, a decision is taken on the basis of the comparison between the values in working memory and those stored in reference memory.
Such a shared functional mechanism for numerical and temporal processes might explain the close links between numbers and time that have been reported in several behavioral studies. Psychophysical data in numerical and temporal estimation tasks have indeed revealed very similar response‐function distributions with Weber's signature (i.e., the precision of magnitude estimation decreases logarithmically as the size of the magnitude to be estimated increases), as well as classical distance (i.e., the time required to discriminate two magnitudes increases as the distance between them decreases) and size (i.e., holding the distance between two magnitudes constant, the time required to discriminate them increases as their magnitudes increase) effects [Buckley and Gillman, 1974; Cohen Kadosh et al., 2008; Dormal et al., 2006; Meck and Church, 1983; Moyer and Landauer, 1967]. Manipulating the numerosity and presentation time of patterns of symbolic and nonsymbolic stimuli demonstrated that more stimuli are generally perceived as lasting longer [Cappelletti et al., 2009; Dormal et al., 2006; Droit‐Volet et al., 2003; Roitman et al., 2007a; Xuan et al., 2007; for a review see Dormal and Pesenti, submitted]. Studies searching for direct functional links between these two dimensions have also consistently reported unidirectional interference of numerosity on duration judgments. This has been interpreted in terms of differences in the mandatory processing of numerosity and duration, suggesting a greater automaticity in processing numerosity [Dormal et al., 2006; Roitman et al., 2007a]. Although behavioral studies have highlighted important similarities, and supported the existence of strong interactions between numerical and temporal factors, they have failed to demonstrate the existence of a common representation. Indeed, the experimental designs used so far have not allowed the stage in the processing at which the interference between dimensions occurs to be determined. Interference could take place at a late stage, such as the decision making, and may thus not necessarily involve a common representation.
The accumulator model assumes a similar representational mechanism (i.e., the accumulation) for number and time but this does not necessarily imply a common neural substrate. Recently, the hypothesis of a common functional mechanism shared by numerical and temporal processes has been integrated within a neuro‐functional theory of generalized magnitude processing (ATOM). This theory postulates that the inferior parietal cortex hosts a system underlying the representation of various types of quantifiable dimensions, including numerosity, duration and space, on a common metric system, tightly linking them together in order to guide behavior [Bueti and Walsh, 2009; Walsh, 2003]. Neuropsychological, single‐cell recording and neuroimaging studies have usually investigated numerosity and duration processing separately, and have shown that several cerebral regions are involved. On one hand the crucial role of the intraparietal sulcus (IPS) in numerical cognition has been widely documented in brain‐lesioned patients [Cipollotti et al., 1991; Dehaene and Cohen, 1991; Lemer et al., 2003; Polk et al., 2001; Warrington and James, 1967], and has been confirmed in brain imaging studies with healthy participants [Dehaene et al., 2003]. More specifically, bilateral activations of the IPS have been observed in response to numerosity changes in passively presented patterns of geometrical shapes, such as dots and squares [Cantlon et al., 2006; Piazza et al., 2004, 2007]. In line with this, bilateral fronto‐parietal activations including the IPS have been identified during explicit comparison or categorization of visual collections [Ansari and Dhital, 2006; Castelli et al., 2006; Dormal et al., 2010; Dormal and Pesenti, 2009]. A similar but strictly right‐lateralized network has been reported during comparison tasks involving sequentially presented visual and/or auditory sequences [Dormal et al., 2010; Piazza et al., 2006]. Moreover, transcranial magnetic stimulation (TMS) studies have revealed drops in performance during nonsymbolic numerical estimation tasks following left IPS stimulation [Cappelletti et al., 2007; Dormal et al., 2008]. Finally, electrophysiological recordings of monkeys' brains have identified single neurons in parietal and prefrontal areas that respond selectively to the numerical properties of visual collection of dots [Nieder et al., 2002; Nieder and Miller, 2004; Roitman et al., 2007b]. On the other hand, studies of the neural correlates of duration perception suggest that the frontal cortex, the cerebellum and the basal ganglia are involved, as lesions to these structures lead to impairments in duration processing [Harrington et al., 1998; Ivry and Keele, 1989; Nichelli et al., 1995, 1996]. Importantly, some lesional studies have also revealed duration perception deficits following parietal damage [Cappelletti et al., 2009; Coslett et al., 2009; Harrington et al., 1998]. Recent brain‐imaging studies in healthy adults have confirmed the involvement of these structures in duration‐estimation tasks, with consistently reported activation of an extended cerebral circuit including bilaterally the basal ganglia, the supplementary motor area and the cerebellum, as well as a fronto‐parietal network located mainly in the right hemisphere [e.g., Belin et al., 2002; Ferrandez et al., 2003; Jueptner et al., 1995; Lewis and Miall, 2003a, b; Macar et al., 2002; Pouthas et al., 2005; Rao et al., 2001; for a meta‐analysis, see Wiener et al., 2010]. Inferior parietal cortex activity, sometimes along the IPS, has been reported in many of these studies during estimation tasks on durations inferior to 1 s, in both the visual and the auditory modalities [Belin et al., 2002; Ferrandez et al., 2003; Lewis and Miall, 2003b; Pouthas et al., 2005; Rao et al., 2001]. TMS studies have confirmed the crucial role of the inferior parietal cortex, mainly in the right hemisphere [Alexander et al., 2005; Bueti et al., 2008]. Several electrophysiological studies investigating duration processing in monkeys have highlighted the existence of sensitive neurons localized in the parietal [Janssen and Shadlen, 2005; Leon and Shadlen, 2003] and prefrontal [Oshio et al., 2006, 2008; Sakurai et al., 2004] cortices, and in the striatum [Chiba et al., 2008].
Such separate pieces of evidence fit with the existence of a generalized magnitude system underlain by a common cerebral substrate in the parietal cortex, and with the systematic involvement of prefrontal regions. However, only a few studies have explored the direct functional and neuroanatomical links between numerosity and duration processing. To the best of our knowledge, only two studies on humans have investigated the estimation of these two types of magnitude in the same experiment. Surprisingly, these studies did not find a similar involvement of the parietal cortices in the different types of estimation. A neuropsychological study in a patient with a right temporo‐parietal lesion revealed a dissociation between duration, numerosity, and space processing: the patient was impaired in processing duration but his numerical and spatial comparison abilities were totally preserved [Cappelletti et al., 2009]. This suggests the existence of a specific and partially independent mechanism dedicated to temporal processing. Similarly, in a TMS experiment in healthy adults, stimulating the left IPS impaired performance in a numerosity comparison task, whereas duration comparison was not affected [Dormal et al., 2008]. This shows that, in at least one parietal area, the numerosity and duration estimation processes are dissociated.
To sum up, various pieces of evidence from different research fields on the neuroanatomical correlates of numerosity and duration processing converge toward the demonstration of a crucial role of parietal and prefrontal areas in both processes. However, lesional data from neuropsychological and TMS studies have demonstrated the existence of dissociations, suggesting different levels of involvement of the parietal areas in magnitude processing. Within‐subject data are thus needed to decide whether the cerebral areas involved in numerical and temporal judgments are identical. The main goals of the present study were: to directly compare the patterns of neural activation during numerosity and duration categorization using fMRI; to reveal the cerebral network common to both types of process; and to provide, for the first time, a possible neuroanatomical implementation of the accumulator model. To this end, participants were scanned while performing a numerosity categorization of sequences of dots (hereafter, N for numerosity) and a duration categorization of single dots (hereafter, D for duration). A whole‐brain analysis was performed to reveal the distinct and common cerebral activations involved in numerosity and duration categorization. If the same representational mechanism and medium underlie the two processes, then similar activations should be found, possibly in areas along the IPS. Other cerebral activations, possibly in prefrontal regions, were also expected, and these would support the idea of common working‐memory storage and decision‐making steps for both categorizations. We also computed psychophysiological interaction (PPI) analyses [Friston, 2004; Friston et al., 1997] to assess the functional connectivity enhanced by the IPS and dedicated to numerosity and duration processing, respectively. If other areas interact with the IPS activation, their level of activity should correlate over time, which will suggest a functional association.
METHODS
Participants
Fifteen healthy male adults (mean age: 21.0 ± 2.3 years) took part in this experiment after giving their written informed consent. All the participants were right‐handed (as shown by the Edinburgh Inventory; [Oldfield, 1971]), had no history of neurological or psychiatric disorders, had normal or corrected‐to‐normal vision, and were unaware of the purpose of the study. The experiment was noninvasive and was performed in accordance with the ethical standards laid down in the 1964 Helsinki Declaration. The experimental protocol was approved by the Biomedical Ethical Committee of the Université Catholique de Louvain.
Tasks and Stimuli
Two experimental categorization tasks and two matched reference tasks were used, all equated in terms of the visual complexity of the stimuli and a forced, two‐choice, button‐press decision.
To avoid, as far as possible, potential explicit or implicit counting strategies, nonsubitizable numerosities, and short durations were used. The stimuli in the numerosity categorization task were composed of sequences of 6 or 8 black dots (diameter: 3.5 cm) presented one at a time at the centre of the screen (see Fig. 1). The sequences were constructed using nonperiodic signals such that temporal ratios did not constitute a potential confound, and rhythm biases as well as pattern recognition were avoided [Breukelaar and Dalrymple‐Alford, 1998; Dormal et al., 2006]. The total duration of the sequences was kept constant (1,800 ms), whereas the duration of each dot presentation and the duration of the interdot intervals varied randomly from 50 to 270 ms. The stimulus in the duration task was a single black dot (diameter: 3.5 cm) presented at the centre of the screen for 600 or 900 ms (see Fig. 1). The stimuli in the reference tasks were identical to those in the experimental categorization tasks except for the fact that the last dot in half the numerical sequences and the last 100 ms in half the single dots were presented in red (see Fig. 1).
Figure 1.
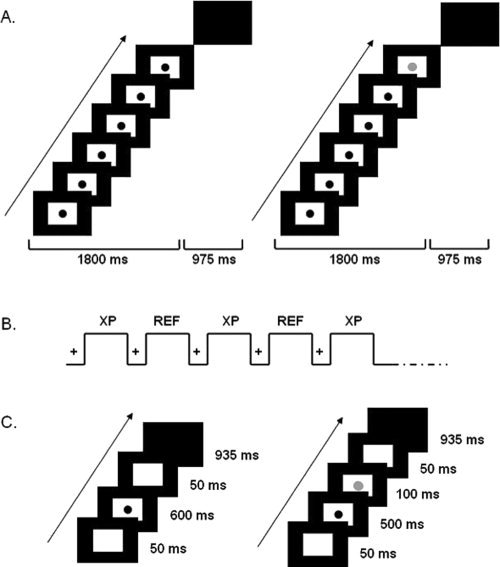
Schematic representation of the temporal structure of the experiment. A: examples of experimental (left) and reference (right) numerosity tasks; B: fMRI design; C: examples of experimental (left) and reference (right) duration tasks Notes: (A) Each trial was composed of a stimulus (a sequence of flashed dots) displayed for 1800 ms, and a blank response screen for 975 ms. In the reference task, the last dot of the sequence was black in 50% of the trials and red (grey in the figure) in the other 50%. (B) Each run consisted of 10 alternations of a 12.5 sec fixation period (black cross on white background) and a 25 sec activation period. Each activation period corresponded to either an experimental condition or its reference condition. (C) Examples of experimental (left) and reference (right) duration tasks: each trial was composed of a stimulus (one central black dot) displayed for 600 or 900 ms, followed by a blank response screen for 935 ms. In the reference task, the color of the dot turned red during the last 100 ms of half the trials.
In the numerosity categorization task, the participants had to decide whether each sequence of dots contained “few” (i.e., 6) or “many” (i.e., 8) dots by pressing a left‐ or right‐hand response button on a response box. In the duration task, they were asked to categorize each dot as being presented for a “short” (i.e., 600 ms) or a “long” (i.e., 900 ms) duration by using the same two‐choice button‐press decision. In the corresponding reference tasks, the participants were asked to report whether the last dot in each sequence, or the last 100 ms of each single dot, was red or not.
Experimental Design
Before the scanning session, the participants were trained in all the tasks outside the magnet room. For each categorization task, a training session consisted of a learning block, a training block with feedback, and an example of a 4‐block fMRI acquisition run. In the learning block, 20 trials with “few” and “many” dots were presented for the numerosity categorization task, and 20 trials of “short” and “long” dots were presented for the duration categorization task; the participants were instructed to observe them carefully, but the numerosity of the sequences and the duration of the presentation of the single dots were not mentioned. During the training block with feedback, stimuli from each category were presented in a randomized order and participants were required to categorize each sequence as containing “few” or “many” dots, and each single dot as being “short” or “long” by pressing one of two keys on the numerical pad (Key 1 with the right index finger for sequences/single dots categorized as “few” or “short,” and Key 3 with the middle finger for sequences/single dots categorized as “many” or “long”). Visual feedback informed the participant after each trial of whether or not his answer was correct. Finally, the participants underwent a 4‐block run (i.e., 2 blocks of the experimental task alternating with 2 blocks of the corresponding reference task) without feedback to familiarize them with the fMRI procedure.
In the magnet room, back‐projected images were viewed through a tilted mirror mounted on the head coil, and the participants answered by pressing a two‐button response pad with the index and middle fingers of their right hand; the projector and the mirror (Silent VisionTM System, Avotec <http://www.avotec.org>) and the response pad (Imagilys, <http://www.imagilys.com/>) were compatible with the MRI environment. Stimulus presentation and response recording were controlled with e‐Prime [Schneider et al., 2002]. Two runs were constructed for the fMRI experiment. One consisted of 5 blocks of the numerosity‐categorization task alternating with 5 blocks of its reference task, and the other was composed of 5 blocks of the duration‐categorization task alternating with 5 blocks of its reference task. The blocks lasted for 25 s and were interleaved with 12.5‐sec fixation periods (see Fig. 1). All the participants completed each run twice, in two counterbalanced orders (i.e., ABBA or BAAB). At the beginning of each run, they were reminded of the instructions, and examples of sequences/single dots from each category (“few” or “many,” and “short” or “long”) were presented.
fMRI Data Acquisition
Functional images were acquired with a 3.0 Tesla magnetic resonance imager and an 8‐channel phased array head coil (Achieva, Philips Medical Systems) as series of blood‐oxygen‐sensitive T2*‐weighted echo‐planar image volumes (GRE‐EPI). The acquisition parameters were: TE = 32 ms, TR = 2,500 ms, flip angle = 90°, field of view = 220 × 220 mm, slice thickness = 3.5 mm with no interslice gap, SENSE factor (parallel imaging) = 2.5. Each image volume comprised 36 axial slices acquired in an ascending interleaved sequence. High‐resolution anatomical images were also acquired for each participant using a T1‐weighted 3D turbo fast‐field echo sequence with an inversion recovery prepulse (150 contiguous axial slices of 1 mm, TE = 4.6 ms, TR = 9.1 ms, flip angle = 8°, FOV = 220 × 197 mm, voxel size = 0.81 × 0.95 × 1 mm3, SENSE factor = 1.4). Head movement was limited by foam padding within the head coil and a restraining band across the forehead.
fMRI Data Analyses
The data were processed and analyzed using Statistical Parametric Mapping (SPM2, Welcome Department of Cognitive Neurology, London, UK, <http://www.fil.ion.ac.uk/spm>). Functional images were (1) corrected for slice acquisition delays, (2) realigned to the first scan of the first run (closest to the anatomical scan) to correct for within‐ and between‐run motion, (3) coregistered with the anatomical scan, (4) normalized to the MNI template using an affine fourth degree ß‐spline interpolation transformation and a voxel size of 2 × 2 × 2 mm3 after the skull and bones had been removed with a mask based on individual anatomical images, and (5) spatially smoothed using a 10‐mm FWHM Gaussian kernel.
Condition‐related changes in regional brain activity were estimated for each participant using a general linear model in which the responses evoked by each condition of interest were modeled by a standard hemodynamic response function. The comparisons of interest were first computed at the individual level to identify the cerebral regions significantly activated by numerosity and duration processing relative to the fixation periods used as a general baseline ([N ‐ fix], and [D ‐ fix], respectively); a similar procedure was applied to each reference task. Significant cerebral activations for the critical contrasts (experimental task minus reference task, each relative to the fixation periods) were then examined at the group level in random‐effect analyses using analyses of variance (ANOVA) and one‐sample t‐tests, with the statistical threshold set at P < 0.05 (FWE corrected at the voxel level) and extending to at least 50 contiguous voxels. Given the strong a priori hypotheses, activations in the parietal cortices were also screened at lower, uncorrected thresholds. The conjunction [using the minimum statistic (MS) compared to the conjunction null (CN); Nichols et al., 2005] of the contrasts between each experimental task and its reference isolated the cerebral activations elicited by both numerosity and duration categorization.
This group analysis should reveal areas playing an important role in both numerosity and duration processing, but it will not show whether functional integration occurs between these regions or whether there are distinct patterns of integration for the two judgments. It is indeed well established that cognitive processing depends on functional integration across anatomically distributed networks [Friston, 2010], but that conventional fMRI analyses are not able to assess which regions within a given network interact to support a given cognitive function. Standard analyses of Blood‐Oxygenation‐Level‐Dependent (BOLD) effects indicating the brain regions that respond to psychological stimulus do not indicate whether there are any psychologically or physiologically relevant interactions between these areas. PPI analyses can clarify whether functional integration between regions occurs, and whether this integration changes with the psychological contexts [Friston et al., 1997]. To capture the modulation of activity in one brain region by activity in another brain region depending on a specific task, we explored the connectivity of the right IPS region (identified in the conjunction analysis; MNI coordinates of peak activation [44 −46 52]) by computing PPI analyses for N and D tasks, respectively [Friston et al., 1997; Friston, 2004]. We chose the right IPS as the seed region because this area is commonly identified as a crucial region for both numerosity and duration processing in humans [e.g., Lewis and Miall, 2003a; Piazza et al., 2006]. Moreover, early recruitment of neurons in this region was observed during duration estimates in humans [Rao et al., 2001] and numerosity estimates in monkeys [Nieder and Miller, 2004], suggesting that the IPS contributes to the perceptual encoding of magnitude information. The PPI analyses thus examined differences in functional connectivity between regions (i.e., the influence of one region on another) as a function of task manipulation. Each PPI analysis employed three regressors: one representing the deconvolved activation time course in the volume of interest (the physiological variable); one representing the psychological variable of interest; and a third representing their cross‐product (the psychophysiological interaction term). To perform the PPI analyses, the deconvolved time series from a 5‐mm radius sphere around the peak activation voxel (right IPS, [44 −46 52]) identified in the conjunction analysis for the group was extracted for each participant. The time course of the activity was corrected for the effect of interest. The individual contrast images were then entered into a second‐level random effects analysis in which task‐dependent effects ([N ‐ RefN]; [D ‐ RefD]) were investigated using one‐sample t‐tests, to identify which, if any, areas of the brain exhibited activity that covaried with that of the right IPS significantly more during the experimental tasks than during the reference tasks for N and D, respectively. Significant clusters exhibiting PPI‐related IPS coupling were identified, with a threshold of P < 0.001 (uncorrected, with at least 10 contiguous voxels in the cluster; Forman et al., 1995].
RESULTS
Behavioral Data
Two ANOVAs were performed, one on the latencies of correct answers and the other on the error rates, with task (N vs. D) and condition (Experimental vs. Reference) as within‐subject variables. A significant main effect of condition was observed both for latencies [F(1,14) = 7.261, P < 0.02] and error rates (F(1,14) = 42.263, P < 0.001). Participants responded faster and made fewer errors overall on the reference (340 ± 58 ms; 2 ± 2%) than on the experimental (371 ± 63 m; 10 ± 6%) tasks. No other main effect or interaction was significant (all P at least > 0.2).
Functional Data
Numerosity processing
Contrasting the N task to its reference revealed the cerebral areas involved in numerosity processing on sequentially presented nonsymbolic material. A right‐lateralized hemispheric activation was identified in the inferior parietal lobule, all along the IPS. Foci of activation were also observed in the right middle and inferior frontal gyri, and the right supplementary motor area (SMA; Table I, a and Fig. 2A). A small left superior parietal activation (k = 2) also appeared, which was significant at an uncorrected threshold (P < 0.003). The N task did not present any specific activation when compared to D; a focus of activation, significant at an uncorrected threshold (P < 0.001), was however observed in the right inferior parietal lobule (Table I, c).
Table I.
Brain areas showing significant activation for (a) numerosity (N) and (b) duration (D) categorizations, each compared with its own reference task (Ref), (c) N categorization compared with D task, and (d) for D categorization compared with N task, and (e) the conjunction of the two categorization tasks (N and D)
| Brain regions | L/R | k | x | y | z | t‐statistic | |
|---|---|---|---|---|---|---|---|
| a | [N‐Fix]‐[RefN‐Fix] | ||||||
| Middle frontal gyrus/precentral gyrus | R | 1416 | 50 | 38 | 34 | 8.00**** | |
| Superior frontal gyrus/SMA | R | 401 | 10 | 22 | 52 | 7.91**** | |
| IPS/inferior parietal lobule | R | 337 | 44 | −46 | 50 | 7.82**** | |
| Inferior frontal gyrus | R | 177 | 40 | 24 | 4 | 6.82**** | |
| Superior parietal lobule | L | 2 | −40 | −52 | 68 | 2.97** | |
| b | [D‐Fix]‐[RefD‐Fix] | ||||||
| Middle frontal gyrus/Precentral gyrus | R | 1448 | 50 | 38 | 34 | 8.10**** | |
| Superior frontal gyrus/SMA | L/R | 560 | 10 | 26 | 48 | 8.62**** | |
| IPS/inferior parietal lobule | R | 428 | 44 | −46 | 52 | 7.91**** | |
| Cerebellum (superior semi‐lunar lobule) | L | 63 | −38 | −64 | −32 | 6.31**** | |
| IPS/inferior parietal lobule | L | 3 | −46 | −42 | 54 | 2.72* | |
| c | [N‐RefN]‐[D‐RefD] | ||||||
| Inferior parietal lobule | R | 9 | 36 | −62 | 52 | 3.85*** | |
| d | [D‐RefD]‐[N‐RefN] | ||||||
| no supra‐threshold activation | |||||||
| e | [N‐RefN] and [D‐RefD] | ||||||
| Middle frontal gyrus/precentral gyrus | R | 690 | 50 | 38 | 34 | 8.00**** | |
| Superior frontal gyrus/SMA | R | 368 | 8 | 26 | 48 | 7.89**** | |
| IPS/inferior parietal lobule | R | 290 | 44 | −46 | 52 | 7.71**** | |
| IPS/inferior parietal lobule | L | 69 | −40 | −48 | 48 | 2.27* |
L = left hemisphere; R = right hemisphere; k = cluster size (number of voxels); x, y, z = MNI stereotaxic coordinates of peak‐height voxels;
= P‐values < 0.05 FWE corrected for multiple comparisons;
= P‐values < 0.001 uncorrected;
= P‐values < 0.003 uncorrected;
= P‐values < 0.005 uncorrected; SMA = supplementary motor area; IPS = intraparietal sulcus.
Figure 2.

A: Brain regions activated specifically and commonly in the N and D tasks on a 3D reconstructed brain (left panel) and on a glass brain (right panel). B: Axial, sagital and coronal views of the brain regions showing increased activity in the conjunction analysis. Note: The red lines in the right‐most sagital and coronal views of (B) indicate the position of the slices on the corresponding horizontal (upper panel), sagital (middle panel), and coronal (lower panel) views.
Duration Processing
Contrasting the D task to its reference revealed a large focus of activation in the right middle and superior frontal gyri. Other activation foci were found in the right inferior parietal lobule along the IPS and in the left cerebellum (Table I, b and Fig. 2A). At an uncorrected threshold (P < 0.005), a small left inferior parietal activation (k = 3) was observed. When compared with N, the D task did not present any specific activation at the corrected threshold; there was no additional activation in the parietal cortices at uncorrected thresholds (Table I, d).
Numerosity and Duration Processing
The conjunction of N and D tasks, each contrasted to its own reference, revealed the areas involved in both numerosity and duration processing. Three main activation foci were observed: one spreading from the right middle frontal gyrus and extending to the precentral gyrus, one in the right SMA, and one in the horizontal segment of the right IPS (with a local maximum at 44 −46 52; see Table I, e, Fig. 2A and B). A left IPS focus (k = 69) also appeared, which was significant at an uncorrected threshold (P < 0.005).
The PPI analyses assessed the cerebral areas connected to the right IPS activation observed in both categorization tasks. First, an analysis performed on the contrast [N‐RefN] revealed that the right IPS, used as a region of interest, had an enhanced connectivity with an area in the right middle frontal gyrus extending to the upper part of the precentral gyrus, the SMA bilaterally, the lower part of the right precentral gyrus and the left inferior parietal lobule, along the IPS (Table II, a; Fig. 3). The same analysis performed on the contrast [D‐RefD] revealed that the right IPS showed an enhanced functional connectivity with the right inferior frontal gyrus, the SMA bilaterally, and the lower part of the right precentral gyrus (Table II, b; Fig. 3).
Table II.
Brain areas showing enhanced connectivity with the right IPS (44 −46 52) during (a) numerosity processing [N‐RefN], and (b) duration processing [D‐RefD]
| Brain regions | L / R | x | y | z | t‐statistic | |
|---|---|---|---|---|---|---|
| a | [N‐RefN] | |||||
| Middle frontal gyrus/precentral gyrus | R | 50 | 12 | 28 | 5.18 | |
| Superior frontal gyrus/SMA | L/R | −4 | 6 | 54 | 4.86 | |
| Precentral gyrus | R | 34 | 0 | 52 | 4.74 | |
| IPS/Inferior parietal lobule | L | −30 | −48 | 52 | 4.57 | |
| b | [D‐RefD] | |||||
| Superior frontal gyrus/SMA | L/R | −6 | 8 | 56 | 4.10 | |
| Inferior frontal gyrus | R | 40 | 22 | −10 | 3.92 | |
| Middle frontal gyrus/precentral gyrus | R | 50 | 10 | 30 | 3.57 |
L = left hemisphere; R = right hemisphere; x, y, z = MNI stereotaxic coordinates of peak‐height voxels; threshold set at p‐values < 0.001 uncorrected; SMA = supplementary motor area.
Figure 3.
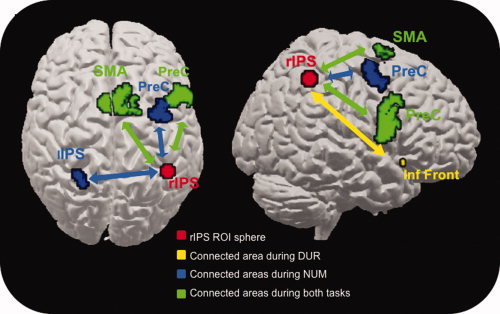
Psychophysiological interaction (PPI) of the right intraparietal sulcus (IPS) showing task‐specific coupling rendered on a canonical brain surface (left panel: view from above; right panel: view of right hemisphere). Note: Areas that are coupled to the right IPS during the N task are shown in blue, those that are correlated during the D task in yellow, and their overlap in green, using an uncorrected threshold of P < 0.001. PreC = precentral gyrus; rIPS = right intraparietal sulcus; SMA = supplementary motor area; Inf Front = inferior frontal gyrus; lIPS = left intraparietal sulcus.
DISCUSSION
Adults, infants and animals can process and represent numerosity and duration. They approximate the number of elements in a set and the duration of events, and they use these quantification processes to guide learning and behavior. To account for this strong parallel between numerosity and duration estimation, Meck and Church [1983] proposed a single accumulator operating in different modes to represent both dimensions. The recent proposal of a generalized magnitude system widened this accumulator model to the processing of other magnitudes, such as space or weight, to account for the existence of a common functional mechanism involved in all estimation processes and underlain by a common cerebral substrate [Walsh, 2003]. In line with such a proposal, many similarities and interactions between numerosity and duration estimation processes have been reported at the behavioral level (for a review, see Dormal and Pesenti, submitted), and separate neuroanatomical investigations of the cerebral areas involved in numerosity and duration estimation have suggested that the parietal cortices are crucially involved in both types of magnitude processing [e.g., Piazza et al., 2006; Lewis and Miall, 2003a]. However, until now, the precise cerebral network commonly involved in magnitude estimation processing has not been directly assessed.
In this study, participants had to perform a numerosity categorization on dot sequences and a duration categorization on a single dot display. A direct contrast for the numerosity task revealed the cerebral network involved in sequential numerosity processing to be a right‐lateralized fronto‐parietal network comprising areas in the prefrontal cortex (inferior, middle, and superior frontal gyri, SMA) and a large portion of the IPS. This network of areas has recently been documented in numerical comparison or categorization tasks with sequentially and simultaneously presented series of elements [e.g., Castelli et al., 2006; Dormal et al., 2010; Piazza et al., 2006]. When contrasting the N and D tasks directly, a more posterior right parietal focus of activation was observed during the N task, which might correspond to the number‐sensitive area recently reported by Santens et al., [2010] and reflect an intermediate stage of numerical properties extraction. PPI analyses showed two regions connected to the right IPS which were only activated for the N task: a very close homologous area in the left inferior parietal lobule, along the IPS, and another in the upper part of the right precentral gyrus. Although a common left IPS activation was observed in both categorization tasks (at an uncorrected threshold), this area was functionally connected with the right IPS when processing numerosity but not when processing duration. This result is in agreement with a recent TMS study [Dormal et al., 2008] showing an impaired performance after left IPS stimulation during a numerosity comparison task, whereas the duration task was not affected, which emphasized the critical role of the left IPS in numerosity processing, the left hemisphere possibly sustaining the triggering of the verbal numeral system. The connection with the right precentral gyrus supports the proposal that this area contributes directly to numerosity processing, possibly reflecting the use of hands and fingers to keep track of numerosity estimates [Andres et al., 2008; Pesenti et al., 2000].
During the duration task, activations were found in right prefrontal, SMA and parietal areas, and in the left cerebellum, recalling the activation patterns mainly reported in cognitively controlled duration measurement tasks [i.e., tasks involving a perceptive judgment on discrete durations of around the second; for a review, see Lewis and Miall, 2003a]. Moreover, the PPI analysis emphasized the connectivity of the right IPS with the right inferior frontal gyrus and the SMA bilaterally, two regions identified as being part of the core network of temporal processing, especially interval timing processes, in patients suffering from disorders affecting the dopaminergic pathways [e.g., Huntington disease; Paulsen et al., 2004], and in a recent voxel‐wise meta‐analysis [Wiener et al., 2010].
The major finding of this study is the set of cerebral areas involved in both duration and numerosity processing. Functional data revealed two main regions of activation: a large area extending from the right middle to the superior frontal gyri and the SMA, and a right IPS focus. This fronto‐parietal network may reflect the functional implementation of the common mechanism processing and the way in which numerosity and duration are represented as mental magnitudes [Meck and Church, 1983; Gallistel and Gelman, 2000]. As prefrontal and parietal regions are functionally interconnected [Cavada and Goldman‐Rakic, 1989; Chafee and Goldman‐Rakic, 2000], the parietal activations suggest two initial steps in the process of encoding information (i.e., one specific to discrete numerical dimension corresponding to the individual numerical extraction, and the second stage common to duration and numerosity and reflecting the increase of continuous quantity in the accumulator), as well as its continuous accumulation through functional connections to the frontal cortex. This two‐step process would be necessary to go from a discrete reality to a continuous representation in the accumulator but not for duration processing because of its continuous nature. The prefrontal cortex areas may be more specifically implicated in later stages of magnitude processing, such as comparing the perceived values to reference memory and decision making; the SMA may also be involved in the numerosity task because of the sequential mode of presentation of the dots, with interdot intervals varying in an unpredictable way. Although firm conclusions about any causal relationship cannot be drawn from the PPI analyses, our results support this fronto‐parietal network proposal. Indeed, the right IPS showed enhanced connectivity with a large part of the right precentral and middle frontal gyri and bilaterally with the SMA for both the numerosity and the duration tasks (Fig. 3; Table II), suggesting functional links between these regions. It is worth noting that, although both tasks require the same type of response (i.e., more than/less than), the results do not simply boil down to a mere response coding or selection bias, because such a bias would predict bilateral or left‐hemispheric activations in more anterior parts of the parietal cortices. Moreover, we used several different dot sequences in the numerosity task, which makes a direct stimulus‐response mapping little plausible. Finally, these tasks have already been used in other studies in which the proportion of few/short vs. many/long choices varied as a function of numerosity and duration, respectively [e.g., Roitman et al., 2007a], which does clearly not fit with a response selection bias.
Electrophysiological studies on numerosity and duration estimation in monkeys accord with the above speculative proposal. Neural populations sensitive to numerosity and duration have been recorded in separate studies in various parietal areas and in the prefrontal cortex (for numerosity Nieder et al., 2002; Nieder and Miller, 2004]; for duration [Chiba et al., 2008; Janssen and Shadlen, 2005; Leon and Shadlen, 2003; Oshio et al., 2006, 2008; Sakurai et al., 2004]). More importantly, differences have been reported in the activity profiles of these neural populations depending on their neuroanatomical implementation. For instance, numerosity‐coding cells in the IPS of monkeys have been demonstrated to possess shorter latencies than the homologous neural populations located in the prefrontal cortex, suggesting the recruitment of a parieto‐frontal network for numerosity processing in which numerical information is initially processed in the IPS and then transmitted to the frontal areas for subsequent processing [Nieder and Miller, 2004]. With respect to the neural populations underlying duration processing, sensitive neurons in parietal areas seem to represent temporal information quantitatively, whereas prefrontal neurons encode this information in a binary or categorical way [Chiba et al., 2008; Janssen and Shadlen, 2005; Leon and Shadlen, 2003; Oshio et al., 2006; Sakurai et al., 2004]. Interestingly, an fMRI study exploring the time course of brain activation during a duration estimation task in humans convincingly evidenced an early right inferior parietal cortex contribution in duration processing, possibly underlying perceptual encoding of information, and the later recruitment of the prefrontal cortex, most probably reflecting comparison processes and decision making [Rao et al., 2001]. When participants had to compare sequentially presented numerosities, parietal and frontal areas were activated, reflecting a fronto‐parietal loop known to be involved in several cognitive processes where the active maintenance of information is necessary [Dormal et al., 2010; Piazza et al., 2004]. Capitalizing on these findings, we suggest that the common fronto‐parietal network found in this study reflects the mechanism by which numerical and temporal magnitudes are first extracted in the parietal cortex through encoding and accumulation processes and then sent to the frontal regions for subsequent processing.
Within this fronto‐parietal network, the right IPS focus may sustain the common representation of duration and numerosity. Indeed, separate neuroanatomical findings in numerosity and duration processing converge towards this region as the best candidate for the cerebral correlate of a common representational magnitude system, as proposed by Walsh [2003]. In line with this hypothesis, a previous fMRI study [Dormal and Pesenti, 2009] exploring cerebral correlates of numerosity and length processing revealed a common focus of activation in the right IPS, with coordinates very close to the focus found here (peak activation: 40 −42 48; the Euclidean distance between the present IPS peak and IPS activation found in that study is 6 mm). Taken together, these results suggest that the voxels activated in both studies in the right IPS might be sustained by neural populations coding for different magnitude dimensions such as numerosity, space and duration. However, because of the limited spatial resolution of fMRI and the fact that the coactivation of cerebral areas does not necessarily imply a common neural code but may simply be due to the activation of distinct intermingled neural populations [Cohen Kadosh et al., 2005; Pinel et al., 2004], this finding must be interpreted with caution. An electrophysiological study in monkeys recorded neural populations in IPS responding either to numerosity and length specifically, or to both dimensions indiscriminately [Tudusciuc and Nieder, 2007], but this has never been reported for duration and numerosity processing. In humans, although direct comparisons of numerosity and duration processing at the neuroanatomical level have been very sparse, there are some indications that dissociations are possible. For instance, a recent TMS study demonstrated that stimulation of a region in the left IPS impaired performance during a numerosity comparison task while leaving a duration comparison task unaffected [Dormal et al., 2008]. Similarly, a patient suffering from a large lesion in the right inferior parietal cortex but with an intact IPS exhibited specific deficits in temporal estimation with preserved numerical abilities [Cappelletti et al., 2009]. Such dissociations of the processing capacities for numerosity and duration support the idea of partially independent, rather than fully‐shared, magnitude systems. Future studies combining neuroimaging, TMS and ERPs techniques are needed to clarify how parietal and frontal areas code magnitude information, and to investigate the precise temporal course of magnitude processing.
Acknowledgements
GD is a Research Fellow and MP a Research Associate at the National Fund for Scientific Research (Belgium). The authors thank Cécile Grandin and the Radiodiagnosis Unit at the Cliniques St Luc (Brussels) for their support during testing.
REFERENCES
- Alexander I, Cowey A, Walsh V ( 2005): The right parietal cortex and time perception: Back to Critchley and the Zeitraffer phenomenon. Cogn Neuropsych 22: 306–315. [DOI] [PubMed] [Google Scholar]
- Andres M, Di Luca S, Pesenti M ( 2008): Finger counting: The missing tool? Behav Brain Sci 31: 642–643. [Google Scholar]
- Ansari D, Dhital B ( 2006): Age‐related changes in the activation of the intraparietal sulcus during nonsymbolic magnitude processing: an event‐related functional magnetic resonance imaging study. J Cogn Neurosci 18: 1820–1828. [DOI] [PubMed] [Google Scholar]
- Belin P, McAdams S, Thivard L, Smith B, Savel S, Zilbovicius M, Samson S, Samson Y ( 2002): The neuroanatomical substrate of sound duration discrimination. Neuropsychologia 40: 1956–1964. [DOI] [PubMed] [Google Scholar]
- Boysen ST, Capaldi EJ ( 1993): The Development of Numerical Competence: Animal and Human Models. Hillsdale, NY: Erlbaum. [Google Scholar]
- Brannon EM, Suanda U, Libertus K ( 2007): Temporal discrimination increases in precision over development and parallels the development of numerosity. Dev Sci 10: 770–777. [DOI] [PMC free article] [PubMed] [Google Scholar]
- Breukelaar JW, Dalrymple‐Alford JC ( 1998): Timing ability and numerical competence in rats. J Exp Psychol Anim Behav Process 24: 84–97. [DOI] [PubMed] [Google Scholar]
- Buckley PB, Gillman, CB ( 1974): Comparison of digits and dots patterns. J Exp Psychol 103: 1131–1136. [DOI] [PubMed] [Google Scholar]
- Bueti D, Bahrami B, Walsh V ( 2008): The sensory and association cortex in time perception. J Cogn Neurosci 20: 1054–1062. [DOI] [PubMed] [Google Scholar]
- Bueti D, Walsh V ( 2009): The parietal cortex and the representation of time, space, number and other magnitudes. Phil Trans R Soc B 364: 1831–1840. [DOI] [PMC free article] [PubMed] [Google Scholar]
- Cantlon J, Brannon E, Carter E, Pelphrey K ( 2006): Functional imaging of numerical processing in adults and 4‐y‐old children. PLoS Biol 4: 844–854. [DOI] [PMC free article] [PubMed] [Google Scholar]
- Cappelletti M, Barth H, Fregni F, Spelke ES, Pascual‐Leone A ( 2007): rTMS over the intraparietal sulcus disrupts numerosity processing. Exp Brain Res 179: 631–642. [DOI] [PMC free article] [PubMed] [Google Scholar]
- Cappelletti M, Freeman ED, Cipollotti L ( 2009): Dissociations and interactions between time, numerosity and space processing. Neuropsychologia 47: 2732–2748. [DOI] [PMC free article] [PubMed] [Google Scholar]
- Castelli F, Glaser D, Butterworth B ( 2006): Discrete and analogue quantity processing in the parietal lobe: A functional MRI study. Proc Natl Acad Sci USA 103: 4693–4698. [DOI] [PMC free article] [PubMed] [Google Scholar]
- Cavada C, Goldman‐Rakic PS ( 1989): Posterior parietal cortex in rhesus monkey: II. Evidence for segregated corticocortical networks linking sensory and limbic areas with the frontal lobe. J Comp Neurol 287: 422–445. [DOI] [PubMed] [Google Scholar]
- Chafee MV, Goldman‐Rakic PS ( 2000): Inactivation of parietal and prefrontal cortex reveals interdependence of neural activity during memory‐guided saccades. J Neurophys 83: 1550–1566. [DOI] [PubMed] [Google Scholar]
- Chiba A, Oshio K, Inase M ( 2008): Striatal neurons encoded temporal information in duration discrimination task. Exp Brain Res 186: 671–676. [DOI] [PubMed] [Google Scholar]
- Cipollotti L, Butterworth B, Denes G ( 1991): A specific deficit for numbers in a case of dense acalculia. Brain 114: 2619–2637. [DOI] [PubMed] [Google Scholar]
- Cohen Kadosh R, Henik A, Rubinsten O, Mohr H, Dori H, van de Ven V, Zorzi M, Hendler T, Goebel R, Linden DE ( 2005): Are numbers special? The comparison systems of the human brain investigated by fMRI. Neuropsychologia 43: 1238–1248. [DOI] [PubMed] [Google Scholar]
- Cohen Kadosh RC, Lammertyn J, Izard V ( 2008): Are numbers special? An overview of chronometric, neuroimaging, developmental and comparative studies of magnitude representation. Prog Neurobiol 84: 132–147. [DOI] [PubMed] [Google Scholar]
- Coslett HB, Shenton J, Dyer T, Wiener M ( 2009): Cognitive timing: neuropsychology and anatomic basis. Brain Res 1254: 38–48. [DOI] [PMC free article] [PubMed] [Google Scholar]
- Dehaene S, Cohen L ( 1991): Two mental calculation systems: A case study of severe acalculia with preserved approximation. Neuropsychol 29: 1045–1074. [DOI] [PubMed] [Google Scholar]
- Dehaene S, Piazza M, Pinel P, Cohen L ( 2003): Three parietal circuits for number processing. Cogn Neuropsych 20: 487–506. [DOI] [PubMed] [Google Scholar]
- Dormal V, Seron X, Pesenti M ( 2006): Numerosity‐duration interference: A Stroop experiment. Acta Psychol 121: 109–124. [DOI] [PubMed] [Google Scholar]
- Dormal V, Andres M, Pesenti M ( 2008): Dissociation of numerosity and duration processing in the left intraparietal sulcus: a transcranial magnetic stimulation study. Cortex 44: 462–469. [DOI] [PubMed] [Google Scholar]
- Dormal V, Pesenti M ( 2009): Common and specific contributions of the intraparietal sulci to numerosity and length processing. Hum Brain Mapp 30: 2466–2476. [DOI] [PMC free article] [PubMed] [Google Scholar]
- Dormal V, Andres M, Dormal G, Pesenti M ( 2010): Mode‐dependent and mode‐independent representations of numerosity in the right intraparietal sulcus. Neuroimage 52: 1677–1686. [DOI] [PubMed] [Google Scholar]
- Dormal V, Pesenti M (submitted): Processing numerosity, length and duration in a three dimensional Stroop‐like task: Towards a gradient of processing automaticity? [DOI] [PubMed]
- Droit‐Volet S, Clément A, Fayol M ( 2003): Time and number discrimination in a bisection task with a sequence of stimuli: A developmental approach. J Exp Child Psych 84: 63–76. [DOI] [PubMed] [Google Scholar]
- Ferrandez AM, Hugueville L, Lehércy S, Poline JB, Marsault C, Pouthas V ( 2003): Basal ganglia and supplementary motor area subtend duration perception: An fMRI study. Neuroimage 19: 1532–1544. [DOI] [PubMed] [Google Scholar]
- Forman SD, Cohen JD, Fitzgerald M, Eddy WF, Mintun MA, Noll DC ( 1995): Improved assessment of significant activation in functional magnetic resonance imaging (fMRI): Use of a cluster‐size threshold. Magn Reson Med 33: 636–47. [DOI] [PubMed] [Google Scholar]
- Friston KJ, Buechel C, Fink GR, Morris J, Rolls E, Dolan RJ ( 1997): Psychophysiological and modulatory interactions in neuroimaging. Neuroimage 6: 218–229. [DOI] [PubMed] [Google Scholar]
- Friston KJ ( 2004): Functional and effective connectivity in neuroimaging: a synthesis. Hum Brain Mapp 2: 56–78. [Google Scholar]
- Friston KJ ( 2010): The free‐energy principle: A unified brain theory? Nat Rev Neurosci 11: 127–138. [DOI] [PubMed] [Google Scholar]
- Gallistel CR, Gelman R ( 2000): Non‐verbal numerical cognition: from reals to integers. Trends Cogn Sci 4: 59–65. [DOI] [PubMed] [Google Scholar]
- Harrington DL, Haaland KY, Knight RT ( 1998): Cortical networks underlying mechanisms of time perception. J Neurosci 18: 1085–1095. [DOI] [PMC free article] [PubMed] [Google Scholar]
- Ivry RB, Keele SW ( 1989): Timing functions of the cerebellum. J Cogn Neurosci 1: 136–152. [DOI] [PubMed] [Google Scholar]
- Janssen P, Shadlen MN ( 2005): A representation of the hazard rate of elapsed time in macaque area LIP. Nature Neurosci 8: 234–241. [DOI] [PubMed] [Google Scholar]
- Jueptner M, Rijntjes M, Weiller C, Faiss JH, Timmann D, Mueller SP, Diener HC ( 1995): Localization of a cerebellar timing process using TEP. Neurology 45: 1540–1545. [DOI] [PubMed] [Google Scholar]
- Lemer C, Dehaene S, Spelke E, Cohen L ( 2003): Approximate quantities and exact number words: Dissociable systems. Neuropsychologia 41: 1942–1958. [DOI] [PubMed] [Google Scholar]
- Leon M, Shadlen M ( 2003): Representation of time by neurons in the posterior parietal cortex of the macaque. Neuron 38: 317–327. [DOI] [PubMed] [Google Scholar]
- Lewis PA, Miall RC ( 2003a): Distinct systems for automatic and cognitively controlled time measurement: Evidence from neuroimaging. Curr Opin Neurobiol 13: 250–255. [DOI] [PubMed] [Google Scholar]
- Lewis PA, Miall RC ( 2003b): Brain activation patterns during measurement of sub‐ and supra‐second intervals. Neuropsychologia 41: 1583–1592. [DOI] [PubMed] [Google Scholar]
- Macar F, Lejeune H, Bonnet M, Ferrara A, Pouthas V, Vidal F, Maquet P ( 2002): Activation of the supplementary motor area and attentional networks during temporal processing. Exp Brain Res 142: 475–485. [DOI] [PubMed] [Google Scholar]
- Meck WH, Chuch RM ( 1983): A mode control model of counting and timing processes. J Exp Psychol Anim Behav Process 9: 320–334. [PubMed] [Google Scholar]
- Moyer RS, Landauer TK ( 1967): Time required for judgments of numerical inequality. Nature 215: 1519–1520. [DOI] [PubMed] [Google Scholar]
- Nichelli P, Clark K, Hollnagel C, Grafman J ( 1995): Duration processing after frontal lobe lesions. Ann N Y Acad Sci 769: 183–190. [DOI] [PubMed] [Google Scholar]
- Nichelli P, Alway D, Grafman J ( 1996): Perceptual timing in cerebellar degeneration. Neuropsychologia 34: 863–871. [DOI] [PubMed] [Google Scholar]
- Nichols T, Brett M, Andersson J, Wager T, Poline JB ( 2005): Valid conjunction inference with the minimum statistic. Neuroimage 25: 653–660. [DOI] [PubMed] [Google Scholar]
- Nieder A, Freedman DJ, Miller EK ( 2002): Representation of quantity of visual items in the primate prefrontal cortex. Science 297: 1708–1711. [DOI] [PubMed] [Google Scholar]
- Nieder A, Miller EK ( 2004): A parieto‐frontal network for visual numerical information in the monkey. Proc Natl Acad Sci USA 101: 7457–7462. [DOI] [PMC free article] [PubMed] [Google Scholar]
- Oldfield RC ( 1971): The assessment and analysis of handedness: The Edinburgh Inventory. Neuropsychologia 9: 97–113. [DOI] [PubMed] [Google Scholar]
- Oshio K, Chiba A, Inase M ( 2006): Delay period activity of monkey prefrontal neurons during duration‐discrimination task. Eur J Neurosci 23: 2779–2790. [DOI] [PubMed] [Google Scholar]
- Oshio K, Chiba A, Inase M ( 2008): Temporal filtering by prefrontal neurons in duration discrimination. Eur J Neurosci 28: 2333–2343. [DOI] [PubMed] [Google Scholar]
- Paulsen JS, Zimbelman JL, Hinton SC, Langbehn DR, Leveroni CL, Benjamin ML, Reynolds NC, Rao SM ( 2004): fMRI biomarker of early neuronal dysfunction in presymptomatic Huntington's Disease. Am J Neuroradiol 25: 1715–1721. [PMC free article] [PubMed] [Google Scholar]
- Pesenti M, Thioux M, Seron X, De Volder A ( 2000): Neuroanatomical substrate of Arabic number processing, numerical comparison and simple addition: A PET study. J Cogn Neurosci 12: 461–479. [DOI] [PubMed] [Google Scholar]
- Piazza M, Izard V, Pinel P, Le Bihan D, Dehaene S ( 2004): Tuning curves for approximate numerosity in the human intraparietal sulcus. Neuron 44: 547–555. [DOI] [PubMed] [Google Scholar]
- Piazza M, Mechelli A, Price CJ, Butterworth B ( 2006): Exact and approximate judgments of visual and auditory numerosity: an fMRI study. Brain Res 1106: 177–188. [DOI] [PubMed] [Google Scholar]
- Piazza M, Pinel P, Le Bihan D, Dehaene S ( 2007): A magnitude code common to numerosities and number symbols in human intraparietal cortex. Neuron 53: 293–305. [DOI] [PubMed] [Google Scholar]
- Pinel P, Piazza M, Le Bihan D, Dehaene S ( 2004): Distributed and overlapping cerebral representations of number, size, and luminance during comparative judgments. Neuron 41: 983–993. [DOI] [PubMed] [Google Scholar]
- Polk TA, Reed CL, Keenan JM, Hogarth P, Anderson CA ( 2001): A dissociation between symbolic number knowledge and analogue magnitude information. Brain Cogn 47: 545–563. [DOI] [PubMed] [Google Scholar]
- Pouthas V, George N, Poline J‐B, Pfeuty M, VandeMoortele P‐F, Hugueville L, Ferrandez A‐M, Lehéricy S, LeBihan D, Renault B ( 2005): Neural network involved in time perception: An fMRI study comparing long and short durations. Hum Brain Mapp 25: 433–441. [DOI] [PMC free article] [PubMed] [Google Scholar]
- Rao SM, Mayer AR, Harrington DL ( 2001): The evolution of brain activation during temporal processing. Nat Neurosci 4: 317–323. [DOI] [PubMed] [Google Scholar]
- Roitman JD, Brannon EM, Andrews RA, Platt ML ( 2007a): Nonverbal representation of time and number in adults. Acta Psychol 124: 296–318. [DOI] [PubMed] [Google Scholar]
- Roitman JD, Brannon EM, Platt ML ( 2007b): Monotonic coding of numerosity in macaque lateral intraparietal area. PLoS Biol 5: 1672–1682. [DOI] [PMC free article] [PubMed] [Google Scholar]
- Sakurai Y, Takahashi S, Inoue M ( 2004): Stimulus duration in working memory is represented by neuronal activity in the monkey prefrontal cortex. Eur J Neurosci 20: 1069–1080. [DOI] [PubMed] [Google Scholar]
- Santens S, Roggeman C, Fias W, Verguts T ( 2010): Number processing pathways in human parietal cortex. Cereb Cortex 20: 77–88. [DOI] [PMC free article] [PubMed] [Google Scholar]
- Schneider W, Eschmann A, Zuccolotto A ( 2002): E‐Prime Reference Guide. Pittsburgh, PA: PsychologySoftware Tools. [Google Scholar]
- Tudusciuc O, Nieder A ( 2007): Neuronal population coding of continuous and discrete quantity in the primate posterior parietal cortex. Proc Natl Acad Sci USA 104: 14513–14518. [DOI] [PMC free article] [PubMed] [Google Scholar]
- Walsh V ( 2003): A theory of magnitude: Common cortical metrics of time, space and quantity. Trends Cogn Sci 7: 483–488. [DOI] [PubMed] [Google Scholar]
- Warrington EK, James M ( 1967): Tachistoscopic number estimation in patients with unilateral cerebral lesions. J Neurol Neurosurg Psychiatry 30: 468–474. [DOI] [PMC free article] [PubMed] [Google Scholar]
- Wiener M, Turkeltaub P, Coslett HB ( 2010): The image of time: a voxel‐wise meta‐analysis Neuroimage 49: 1728–1740. [DOI] [PubMed] [Google Scholar]
- Xuan B, Zhang D, He S, Chen X ( 2007): Larger stimuli are judged to last longer. J Vision 7: 1–5. [DOI] [PubMed] [Google Scholar]