

Abstract
Knowledge about the principles that govern large‐scale neural representations of objects is central to a systematic understanding of object recognition. We used functional magnetic resonance imaging (fMRI) and multivariate pattern classification to investigate two such candidate principles: category preference and location encoding. The former designates the preferential activation of distinct cortical regions by a specific category of objects. The latter refers to information about where in the visual field a particular object is located. Participants viewed exemplars of three object categories (faces, bodies, and scenes) that were presented left or right of fixation. The analysis of fMRI activation patterns revealed the following. Category‐selective regions retained their preference to the same categories in a manner tolerant to changes in object location. However, category preference was not absolute: category‐selective regions also contained location‐tolerant information about nonpreferred categories. Furthermore, location information was present throughout high‐level ventral visual cortex and was distributed systematically across the cortical surface. We found more location information in lateral‐occipital cortex than in ventral‐temporal cortex. Our results provide a systematic account of the extent to which the principles of category preference and location encoding determine the representation of objects in the high‐level ventral visual cortex. Hum Brain Mapp, 2013. © 2012 Wiley Periodicals, Inc.
Keywords: category preference, location encoding, ventral stream
INTRODUCTION
Knowing the principles that govern large‐scale object representations in the brain is central to a systematic understanding of object recognition [Grill‐Spector et al.,2001; Logothetis and Sheinberg,1996; Op de Beeck et al.,2008a; Reddy and Kanwisher,2006]. Category preference, the tendency of a cortical patch to preferentially activate upon presentation of objects of specific category, and location encoding, information about the position in the visual field at which an object is presented, are two candidates for such principles [Malach et al.,2002; Schwarzlose et al.,2008]. However, the extent to which category preference and location encoding govern object representation in the brain and how they interact is a matter of controversy and current research [Op de Beeck et al.,2008a].
Category Preference
The use of functional magnetic resonance imaging (fMRI) in the investigation of object representation led to the discovery of a number of focal cortical regions in high‐level ventral visual cortex that display category preference. That is, these regions respond more strongly to a particular object category, i.e., faces, places, or bodies, than to other object categories [Grill‐Spector and Malach,2004; Op de Beeck et al.,2008a,b; Reddy and Kanwisher,2007]. However, the category preference observed in these regions is not absolute, i.e., these respond to nonpreferred categories as well, albeit to a lesser extent.
Prior studies have resulted in a mixed picture on the degree of location tolerance in high‐level ventral visual cortex. Some studies have indicated location‐tolerant encoding of object information in both monkey and human [Carlson et al., 2011; Cichy et al.,2011a,b; Hung et al.,2005; Sayres and Grill‐Spector,2008; Schwarzlose et al.,2008; Stokes et al.,2011]. Conversely, other studies have not found evidence for location‐tolerant object encoding [Kravitz et al., 2010] or argued that changes in low‐level features of presented objects strongly modulate encoding of preferred and nonpreferred categories in category‐selective regions [Yue et al.,2011]. Thus, we investigated the degree to which category‐selective regions encode both preferred and nonpreferred object categories tolerant to changes in location.
Location Encoding
Several strands of research have indicated that high‐level ventral visual cortex encodes object location. fMRI studies have documented a contralateral visual field bias, i.e., a preferential response to contralateral compared with ipsilateral visual stimulation [Grill‐Spector et al.,1998; Hemond et al.,2007; MacEvoy and Epstein,2007; McKyton and Zohary,2007; Niemeier et al.,2005; Sayres and Grill‐Spector,2008]. Also, an eccentricity bias seems to exist: Face‐selective fusiform face area (FFA) is activated preferentially by foveal stimulation, whereas scene‐selective parahippocampal place area (PPA) is preferentially activated by peripheral visual stimulation [Hasson et al.,2002; Levy et al.,2001; Malach et al.,2002]. Moreover, high‐level ventral visual cortex was observed to partially overlap with retinotopic cortex [Brewer et al.,2005; Larsson and Heeger,2006; Sayres and Grill‐Spector,2008]. Finally, high‐level ventral visual cortex was shown to contain information about veridical and perceived locations of objects using multivariate pattern analysis [Carlson et al., 2003; Fischer et al.,2011; Schwarzlose et al.,2008]. Taken together, these results indicate that the encoding of object location may be another principle of the large‐scale representation in object‐selective cortex. However, the exact extent of location encoding in the ventral visual stream remains to be determined.
In this study, we used fMRI and multivariate pattern analysis [Cox and Savoy,2003; Haxby et al.,2001; Haynes and Rees,2005a,b; Kamitani and Tong,2005; Kriegeskorte et al.,2007; Spiridon and Kanwisher,2002; Williams et al.,2008] to systematically investigate category preference and location encoding and the way they interact in the human ventral visual system.
METHODS
Participants and Experimental Design
Sixteen healthy, right‐handed volunteers with normal or corrected to normal vision (age 22–33 years, 8 female) participated in the study. The study was approved by the local ethics committee of the Max‐Planck Institute of Human Cognitive and Brain Sciences (Leipzig) and conducted according to the Declaration of Helsinki.
Each participant completed 5 runs (duration 642 s) of the main experiment. During each run, participants viewed pictures of three different object exemplars in four different categories (Fig. 1A). The pictures (size 4.8°) were presented for 4 s at a position either 6° left or right of fixation (Fig. 1B) in pseudorandom order. In total, there were 48 stimulus presentations per run (2 locations × 12 exemplars × 2 repetitions). Stimulus presentations were interleaved with randomly jittered interstimulus intervals of 2–6 s duration during which a gray background screen was shown. During stimulus presentation, participants were instructed to fixate a central white square. Between stimulus presentations, the central white square turned red and opened left or right every second (open 800 ms, closed 200 ms), forming a Landolt‐C. Participants pressed a button indicating the direction of the opening of the Landolt‐C. The pictures were equalized in mean luminance. Visual stimulation was interleaved with conditions not relevant for the analysis presented here.
Figure 1.
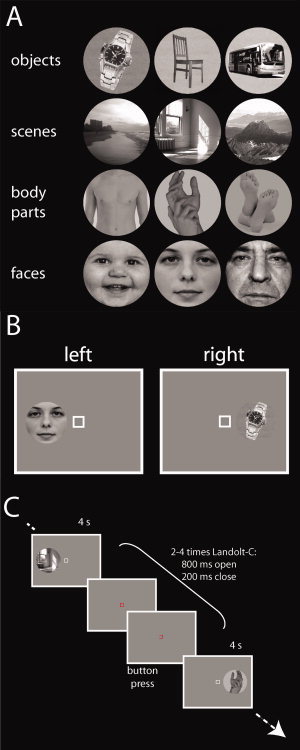
Stimuli and experimental design of the main experiment. A: Participants viewed photos of three object exemplars in four categories: objects, scenes, body parts, and faces. B: Schematic drawing of the visual stimulation conditions. Participants were presented with stimuli either left or right of a central fixation square. C: Stimulus presentations (duration 4 s) were interleaved with periods of a gray background screen with a variable duration of 2–6 s. During the whole experiment, participants were instructed to fixate a central square. During stimulus presentation, the fixation square was white. At the end of a stimulus presentation, the central fixation square turned red and opened left or right every 1,000 ms (open 800 ms, closed 200 ms). Subjects indicated the direction of the opening by a button press. [Color figure can be viewed in the online issue, which is available at wileyonlinelibrary.com.]
Before scanning, participants completed 1–3 modified runs of the main experiment to learn the fixation task and to familiarize themselves with the experiment. The modified runs were identical in setup to the main experiment with the exception of the substitution of the gray background with a random‐dot display of black and white dots in the practice session. The display inverted pixel luminance in every frame. When participants held fixation as required, the alternating displays gave the impression of a uniform gray background. In contrast, eye movements led to a striking experience of a flash [Guzman‐Martinez et al.,2009]. Participants were asked to maintain fixation to avoid the experience of the flash. All participants reported noticing the effect and using it as feedback to improve fixation.
After the main fMRI experiment, each participant performed 5 localizer runs (duration 180 s each) to identify category‐selective regions and lateral occipital complex (LOC) [Grill‐Spector and Malach,2004; Malach et al.,1995]. Participants viewed blocks of images from five different stimulus classes (bodies, faces, scenes and houses, everyday objects, and grid‐scrambled objects). In each run, two blocks of images from each of the five different stimulus classes were shown, i.e., in total 10 image blocks. Blocks of images were interleaved with 16 s periods of a uniform black background. Each image block had a duration of 16 s and consisted of 20 images (presentation time 600 ms, 200 ms gap). To preclude a foveal bias in the cortical activation, the same picture was presented simultaneously at three adjacent positions (left, middle, and right) along the horizontal meridian. Participants were asked to maintain fixation on a central fixation dot. In each block, at random, four of the 20 images were selected to be repeated consecutively. Participants performed a one‐back task on repetitions of an image to sustain attention to the images indicating their response via a button press. The serial order of conditions was counterbalanced within participants.
Finally, 10 participants participated in a retinotopic mapping session to identify low‐level visual regions V1, V2, and V3 using the standard traveling wave method with a double wedge and expanding ring stimuli [DeYoe et al.,1996; Sereno et al.,1995; Wandell et al.,2007]. Gray matter segmentation of anatomical images was conducted using FreeSurfer [Dale et al.,1999], and mrGray was used for cortical flattening [Wandell et al., 2000].
fMRI Acquisition
A 3 T Trio scanner (Siemens, Erlangen, Germany) with a 12‐channel head‐coil was used to acquire MRI data. Structural images were acquired with a T 1 weighted sequence (192 sagittal slices, field of view (FOV) = 256 mm2, repetition time (TR) = 1,900 ms, echo time (TE) = 2.52 ms, flip angle = 9°). For the main experiment, 5 runs of 321 volumes were acquired for each participant (gradient‐echo echo planar imaging (EPI) sequence: TR = 2,000 ms, TE = 30 ms, flip angle = 70°, FOV = 256 × 192 mm2, FOV phase = 75%, matrix = 128 × 96, ascending acquisition, gap = 10%, resolution = 2 mm isotropic, slices = 24). Slices were positioned parallel to the temporal lobe, such that the fMRI volume covered the ventral visual regions from low‐level visual to anterior temporal cortex. For the 5 localizer scans, consisting of 90 volumes each, the parameters were identical. For the retinotopic mapping, 6–8 runs of 160 volumes were acquired for each participant (gradient‐echo EPI sequence: TR = 1,500 ms, TE = 30 ms, flip angle = 90°, FOV = 256 × 192 mm2, matrix = 128 × 96, ascending acquisition, gap = 50%, resolution = 2 mm isotropic, slices = 25). The slices were positioned parallel to the calcarine sulcus.
fMRI Analysis
All functional data were processed using SPM2 (http://www.fil.ion.ucl.ac.uk/spm). Data were realigned and slice‐time corrected. In the following, we will first describe the analysis of the functional localizers that served the definition of regions of interest (ROIs). We then explain the analysis of the main experiment.
Localizers and Definition of Regions of Interest
First, we modeled the fMRI response in the localizer runs to identify category‐selective regions and LOC. Functional data of the localizer runs were spatially smoothed with a 4 mm full width half maximum (FWHM) Gaussian kernel. The data were modeled with a general linear model (GLM) that included the five stimulus classes as conditions (faces, places, bodies, objects, and scrambled objects).
Next, we identified voxels that showed category preference by contrasting parameter estimates evoked by the specific category in question with parameter estimates evoked by all other categories. In this manner, face‐selective (T‐contrast faces > objects + places + bodies), body‐selective (T‐contrast bodies > objects + places + faces, and place‐selective (T‐contrast places > objects + faces + bodies) voxels were defined. Similarly, we identified voxels activated more by pictures of objects than by their scrambled counterparts (T‐contrast objects > scrambled objects). Next, we defined (ROIs) in a multistep process. First, we identified the most activated voxel in each contrast (thresholded at P < 0.0001, uncorrected) on the lateral‐occipital and ventral‐temporal surface of the brain respectively. Then, we defined a sphere with a 7 voxel radius around this voxel. This step limited further voxel selection by vicinity and by anatomical location. Next, within this sphere, we selected all voxels that passed a P < 0.0001 threshold (uncorrected). Finally, we excluded every voxel present in more than a single ROI from all ROIs. This procedure ensured that ROIs never overlapped. This yielded up to 12 category‐selective ROIs in each subject: bilateral FFA and occipital face area (OFA) for faces [Clark et al.,1996; Gauthier et al.,2000; Halgren et al.,1999; Haxby et al.,2000; Kanwisher et al.,1997; Puce et al.,1995]; the fusiform body area (FBA) and extrastriate body area (EBA) for bodies [Downing et al.,2001; Peelen and Downing,2005; Schwarzlose et al.,2005]; and the PPA and transverse occipital sulcus (TOS) to places and scenes [Aguirre et al.,1998; Epstein and Kanwisher,1998; Hasson et al.,2003]. In addition, up to four object‐selective ROIs were identified in the same fashion: bilateral fusiform gyrus (FUS) and lateral‐occipital activation (LO) [Eger et al.,2008; Grill‐Spector and Malach,2004; Malach et al.,1995]. Note that not every ROI was present in all participants. The following numbers of ROIs were identified: FFA (30), OFA (30), PPA (32), TOS (31), FBA (21), EBA (31), FUS (32), and LO (32). For illustrative purposes, a rendering of the ROIs defined in a representative subject is available in Supporting Information Figure 1. Importantly, our ROI identification procedure takes into account individual differences in the location and size of category‐selective regions.
Finally, we selected voxels in low‐level visual areas V1, V2, and V3 as defined by retinotopic mapping. We calculated a T‐contrast all classes of visual stimulation > baseline and chose the 300 most activated voxels in V1, V2, and V3 each.
Main Experiment
For the analysis of the main experiment, we modeled the fMRI response to the experimental conditions for each run separately using a GLM. We treated each of the 12 objects presented either in the left or the right hemifield as single conditions, yielding in total 24 conditions. The onsets and durations of the stimulus presentations were entered into a GLM as regressors and convolved with a hemodynamic response function (HRF). This yielded 24 parameter estimates per run, representing the responsiveness of each voxel to the 12 different objects presented either in the right or the left visual hemifield.
Pattern Classification
Data from the main experiment were subjected to three multivoxel pattern classification analyses [Haynes and Rees,2006; Kriegeskorte et al.,2006; Müller et al.,2001; Norman et al.,2006] using a linear support vector classifier (SVC) with a fixed regularization parameter C = 1 in the LibSVM implementation (http://www.csie.ntu.edu.tw/~cjlin/libsvm). The three analyses investigated (1) classification of objects within location, (2) location classification across objects, and (3) classification of objects across locations. Each analysis shared a basic framework that was adapted. Analyses were conducted independently for each ROI and for each subject. For each run, we extracted parameter estimates for the experimental conditions under investigation (see below). Pattern estimates were ordered as vectors before entering pattern classification. Pattern vectors from four out of five runs were assigned to a training data set which was used to train the SVC. The trained SVC was used to classify pattern vectors from the independent test data set consisting of the fifth run. Fivefold cross‐validation was carried out by repeating this procedure, each time with pattern vectors from a different run assigned to the independent test data set. Decoding accuracies were averaged over these 5 iterations. Second‐level analyses were conducted across identified ROIs. We tested decoding accuracies by means of repeated‐measures analyses of variance (ANOVA), one‐sample t‐tests against chance‐level, and paired t‐tests. In the case where ROIs could not be identified in all subjects, missing ROIs were excluded case by case. Error bars indicate the standard error of the mean across ROIs. All t‐tests were Bonferroni‐corrected.
Classification of Objects Within Location
We tested whether activation patterns in category‐selective regions contain object information within location. This allowed us to ascertain whether activation patterns evoked in the main experiment in regions determined by the independent localizer run display category preference. That is, it allowed us to determine whether activation patterns in category‐selective regions contained more information about the preferred category than about nonpreferred categories. Moreover, it allowed us to determine whether activation patterns are influenced by stimulus location by testing for a contralateral visual field bias.
For this purpose, a classifier was trained and tested pair‐wise to discriminate between activation patterns evoked by different exemplars within location (Fig. 2A). That is, the location of stimulus presentation (left or right of fixation) was identical for both the training and the test set. The classification was conducted in each of the category‐selective ROIs and for all possible exemplar pairs. Decoding results were grouped and sorted in a three‐stage process. First, only decoding results of classifications of exemplars from different categories were considered for further analysis. These, in contrast to classifications between exemplars of the same category that yield information on the level of exemplars within a category are important for our investigation of category preference. Second, decoding results were grouped as originating either from a ROI ipsi‐ or contra‐lateral to the hemifield of visual stimulation. This allowed us to test for the contralateral visual field bias. Third, results were grouped according to category preference. In particular, results of classifications involving an exemplar of the preferred category (e.g., a face in FFA) were averaged together and considered to indicate preferred category information. Results of classification not involving an exemplar of the preferred category (e.g., a body part and a place in FFA) were averaged together and considered to indicate nonpreferred category information. As a control analysis, we tested for a contralateral visual field bias in low‐ and high‐level visual cortex. Thus, we repeated the analysis on activation patterns in V1, V2, and V3. Here, decoding results were grouped together and averaged depending only on whether they originated from a ROI ipsi‐ or contra‐lateral to the hemifield of visual stimulation.
Figure 2.
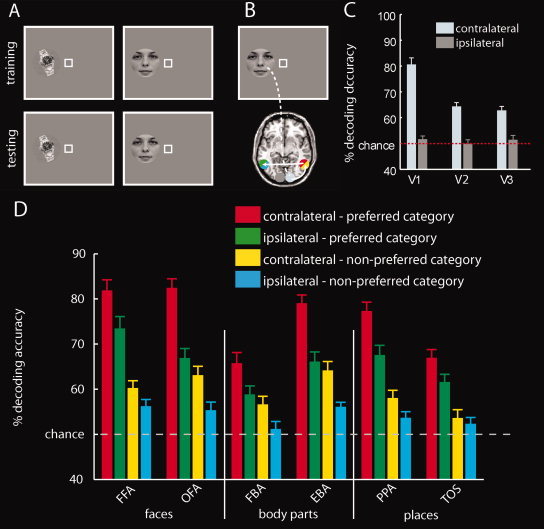
Object classification within location. A: To assess object encoding within location, a classifier was trained and tested pair‐wise to discriminate between activation patterns evoked by different exemplars (A). That is, the location of stimulus presentation (left or right of fixation) was identical for both the training and the test set. B: Illustration of the hypothetical flow of visual object information in the brain. Visual information from the left visual hemifield is fed forward to low‐level visual areas in the right (contralateral) hemisphere exclusively. As visual information is processed further in the visual hierarchy, information from the right (contralateral) hemisphere crosses over to the left (ipsilateral) hemisphere through transcallosal connections. Note that the nodes in the information flow are color‐coded such that the colors reflect the origin of the classification results reported in panels (C) and (D) (e.g., red and yellow for classification results originating from higher order regions contralateral to the hemifield of visual stimulation). C: Category classification within location in low‐level visual areas. All low‐level visual areas show a strong bias for the contralateral visual field. The gray striped line indicates classification chance level (50%). Results show the mean decoding accuracy ± SEM. D: Results of object classification within location in category‐selective regions. All ROIs exhibited category preference. Moreover, all regions except TOS showed a contralateral visual field bias, as indicated by higher category information contralateral than ipsilateral to visual stimulation. [Color figure can be viewed in the online issue, which is available at wileyonlinelibrary.com.]
Classification of Objects Across Locations
We examined whether activity patterns in category‐selective regions contain information about objects across locations. We trained a classifier to differentiate between activation patterns evoked by exemplars presented in one visual hemifield (Figure 3A) and tested the classifier on activation patterns evoked by exemplars presented in the other hemifield. The classification was conducted for all possible exemplar pairs and for both possible location assignments to the training and test set. Only decoding results of classifications of exemplars from different categories were considered for further analysis, as these indicate object information at the category level. Decoding results were grouped according to category (preferred vs. nonpreferred) as described for the first classification analysis (location‐dependent category information). To test for the presence of location‐tolerant category information in low‐level visual cortex, a classifier was trained and tested on activation patterns derived from V1, V2, and V3, respectively.
Figure 3.
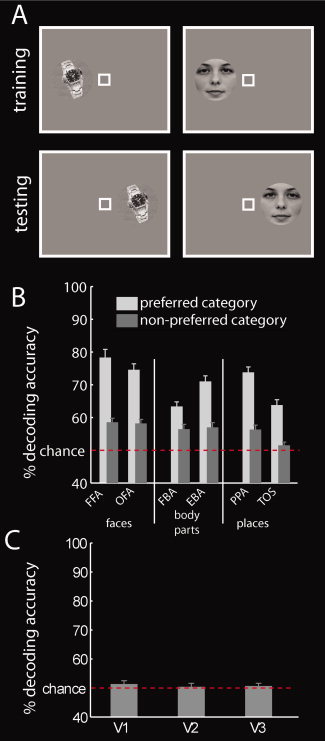
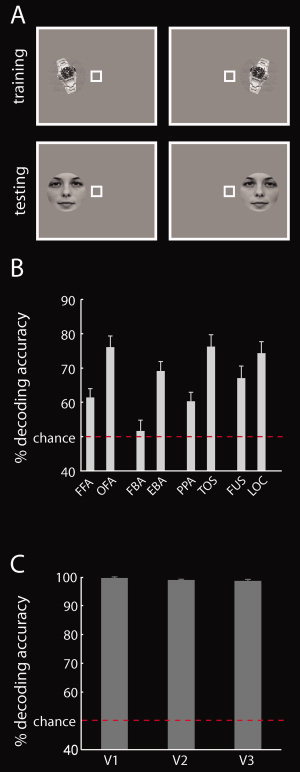
Category classification across locations. A: We asked how much information about preferred and nonpreferred categories is present in category‐selective regions across locations. Thus, we trained a classifier to distinguish between activation patterns of exemplars from different categories presented in one location, and tested the classifier on activation patterns of the same exemplars in the other location. B: Results of category classification across locations in category‐selective cortex. All regions contained more information about preferred than nonpreferred categories. Interestingly, nearly all regions also contained information about nonpreferred categories. Results represent the mean decoding accuracy ± SEM. The red dashed line indicates classification chance level (50%). C: Results of category classification across locations in low‐level visual cortex. There was no evidence for category information across locations in low‐level visual areas. Results represent the mean decoding accuracy ± SEM. [Color figure can be viewed in the online issue, which is available at wileyonlinelibrary.com.]
Next, we tested whether nonpreferred responses in category‐selective regions may form a part of a wider representation of the nonpreferred category. We investigated whether nonpreferred responses in category‐selective regions are structured by category using two steps of analysis. In the first step, we visualized the category structure by performing multidimensional scaling (MDS). Decoding accuracies for discriminations between exemplars can be regarded as a dissimilarity measure between activation patterns. The more dissimilar two activation patterns are, the easier it is to discriminate between them. Activation patterns of two object exemplars belonging to the same category should be more similar to each other than activation patterns of two exemplars belonging to different categories. Thus, we visualized the similarity structure present in decoding accuracies for pair‐wise comparisons of exemplars by MDS. Second, we investigated the category structure quantitatively. For each subject and for each category‐selective region, we averaged decoding accuracies across discriminations between exemplars from the same category and across exemplars from different categories (Fig. 5A). Then, in each category‐selective region, we tested for differences between the resulting groups by paired t‐tests across participants. This analysis excluded any decoding accuracies of discriminations involving exemplars of the preferred category (e.g., exclusion of faces for FFA and places for PPA) to exclusively investigate category structure in nonpreferred responses.
Figure 5.
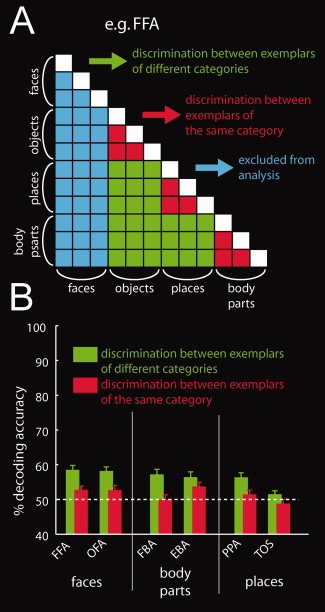
Structure in the representation of nonpreferred categories in category‐selective cortex. A: The matrix represents a schema of decoding accuracy for all possible category pair discriminations. For each region, we excluded all discriminations involving the preferred category (e.g., here all discriminations involving faces in FFA, indicated in blue). Then, we averaged decoding accuracies depending on whether they were the results of discrimination between exemplars from the same category (by red color) or the results of discrimination between exemplars from different categories (green). Note that the matrix is symmetric across the diagonal. Further, the diagonal is undefined as discriminations between one and the same object exemplar were not carried out (indicated in white). B: Location‐tolerant information about nonpreferred categories in category‐selective regions. In nearly all regions, classifications involving exemplars from different categories resulted in higher decoding accuracies than classifications involving exemplars from the same category. This directly indicates a category structure in nonpreferred responses in category‐selective regions. The gray striped line indicates classification chance level (50%). [Color figure can be viewed in the online issue, which is available at wileyonlinelibrary.com.]
Classification of Locations Across Objects
To investigate the encoding of location information in the ventral visual cortex in a spatially unbiased fashion, we used a novel surface‐based searchlight decoding technique [Chen et al.,2011]. We first extracted the cortical surface for each subject using Freesurfer [Dale et al.,1999; Fischl et al.,1999a,2001; Ségonne et al.,2004]. Second, we defined disks of voxels of a radius of 16 mm around each vertex on the extracted cortical surface. Third, all voxels that were included in the disk were assigned to the searchlight corresponding to the disk's center. For each vertex, we extracted the unsmoothed parameter estimates in the searchlight in each run evoked by objects presented either in the left or the right visual hemifield. Data from 4 runs of the main experiment were used to train a linear SVC to distinguish activation patterns evoked by an exemplar presented either left or right of fixation. Then, data from the fifth run were used to test the classifier on activation patterns evoked by another exemplar presented in identical locations (Fig. 6A). This analysis was repeated for all possible exemplar pairs. Fivefold cross‐validation was carried out as described above. For each subject, the resulting decoding accuracy was used to create a two‐dimensional surface of decoding accuracy of location. These decoding accuracy surfaces were normalized to a standard surface based on cortical curvature [Fischl et al.,1999b] and spatially smoothed along the cortical surface using a 15‐mm Gaussian kernel. Finally, we used second‐level across‐subjects t‐tests to compare decoding accuracy maps against chance level. Results are reported as t‐values at a significance level of P < 0.01, false discovery rate (FDR)‐corrected.
Figure 6.
Location classification across objects. A: To reveal location information, a classifier was trained to distinguish between two locations of a specific exemplar. Then, the classifier was then tested on the two locations of a different exemplar. B: Results of location classification across objects in high‐level visual cortex. All regions investigated contained location information. Interestingly, regions on the lateral‐occipital surface of the cortex contained more location information than regions on the ventral‐temporal surface. Results represent the mean decoding accuracy ± SEM. The red line indicates classification chance level (50%). C: Results of location classification across objects in low‐level visual areas V1, V2, and V3. As expected, all low‐level visual areas showed nearly perfect location classification. Results represent the mean over ROIs ± SEM. [Color figure can be viewed in the online issue, which is available at wileyonlinelibrary.com.]
In addition, we determined whether activation patterns in predefined ROIs encode location across objects. As for the surface‐based analysis, a classifier was trained to distinguish between two locations of a specific exemplar. The classifier was then tested on the two locations of a different exemplar (Fig. 6A). The classification was repeated for all possible exemplar pairs and decoding accuracies were averaged. This analysis was conducted in each category‐selective ROI and in low‐level visual areas (V1, V2, and V3).
RESULTS
In the following, we will present the results of the three multivoxel pattern classification analyses. First, we investigated object information within location and ascertained both category preference and a contralateral visual field bias in category‐selective regions. Second, we found that category‐selective regions contain information about exemplars of their preferred and, importantly, also nonpreferred categories tolerant to changes in location in a structured fashion. Third, location information tolerant to changes in object category was present throughout the ventral visual steam and systematically distributed across category‐ and object‐selective regions.
Classification of Objects Within Location
We examined whether activation patterns in category‐selective regions were predictive of objects presented at the same location (Fig. 2A). Therefore, we determined how much location‐dependent information is contained in category‐selective regions ipsi‐ and contra‐lateral to the hemifield of visual presentation (Fig. 2B). The results are displayed in Figure 2C. The results are color‐coded dependent on the relation of the ROI to the hemifield of visual presentation (see Fig. 2B) and whether exemplars form preferred or nonpreferred categories were classified.
All category‐selective regions contained more category information for the preferred category than for the nonpreferred category. Furthermore, all category‐selective regions showed a clear contralateral visual field bias: They contained more information about objects presented in the contralateral than in the ipsilateral visual hemifield.
We tested the statistical significance of these observations by conducting 2 × 2 repeated‐measures ANOVAs on decoding accuracies for location‐dependent category classification with factors laterality of region (contralateral vs. ipsilateral to the side of visual stimulation) and category preference (preferred vs. nonpreferred category) for each category‐selective region. All ANOVAS showed a significant main effect of the factor category preference (all P < 1.0 × 10⁻⁴, Supporting Information Table 1). Further, all ANOVAs showed a significant main effect of the factor laterality of region (P < 0.05). Only the ANOVA for EBA showed a significant interaction effect (P < 0.05). However, paired‐samples post hoc t‐tests on category preference and laterality in EBA were highly significant (all P < 1 × 10⁻⁴). A supplementary analysis in FUS and LOC yielded comparable results (Supporting Information Analysis 1).
Finally, in a control analysis (Fig. 2C and Supporting Information Table 2), we ascertained that low‐level visual cortex exhibited a contralateral visual field bias. This result is expected for low‐level visual areas that are retinotopically organized [Grill‐Spector and Malach,2004; Wandell et al.,2007].
Classification of Objects Across Locations
In a second set of analyses, we investigated whether activation patterns in category‐selective regions allow decoding of object information across locations. For this, we trained a classifier to differentiate between activation patterns evoked by exemplars presented in one visual hemifield (Fig. 3A) and tested the classifier on activation patterns evoked by exemplars presented in the other hemifield.
Our results indicate that category‐selective regions contained information about categories across locations. One‐sampled t‐tests indicated the significance of this effect for the preferred category in all category‐selective regions (all P < 1 × 10⁻⁸, Fig. 3B, light gray bars and Supporting Information Table 3) and for nonpreferred categories in nearly all regions (except TOS, all P < 1 × 10⁻⁴, Fig. 3B, dark gray bars, Supporting Information Table 3). A control analysis in low‐level visual cortex ascertained that categories were not encoded across hemifield, as was to be expected from the retinotopic structure of those areas (Fig. 3C and Supporting Information Table 4).
Our results further indicate that activity patterns in category‐selective regions allowed the read‐out of more information about the preferred than about the nonpreferred category (Fig. 3C). Thus, category‐selective regions retain category preference to the same category in spite of changes in object location. Paired t‐tests comparing decoding accuracies for preferred and nonpreferred categories in each category‐selective region ascertained the significance of this effect (all P < 0.005, Supporting Information Table 5).
Next, we investigated whether the encoding of object exemplars in category‐selective regions is structured by category for both preferred and nonpreferred categories. That is, we determined whether activation patterns of two object exemplars belonging to the same category are more similar to each other than activation patterns of two exemplars belonging to different categories. We visualized the structure of activation patterns in category‐selective regions using MDS. The results are shown in Figure 4 and Supporting Information Figure 4. Visual inspection shows that object exemplars for both preferred as well as nonpreferred categories cluster together. This supports the notion that activation patterns in category‐selective regions are structured by category. We then tested for category structure specifically in the nonpreferred responses in category‐selective regions. Thus, we asked whether classifications involving exemplars from different categories result in higher decoding accuracies than pair‐wise classifications involving exemplars from the same category (Fig. 5A). For this analysis, we excluded any decoding accuracies of discriminations involving exemplars of the preferred category (e.g., exclusion of faces for FFA and places for PPA). Thus, observed differences cannot be merely driven by the preferred category. In all regions, except FBA and TOS, classifications involving exemplars from different categories resulted in higher decoding accuracies than classifications involving exemplars from the same category (all P < 1 × 10⁻³, Fig. 5B, green bars for different‐category classification and red for same‐category classifications, Supporting Information Table 6). This directly indicates a category structure in the activation patterns carried by nonpreferred responses in category‐selective regions.
Figure 4.
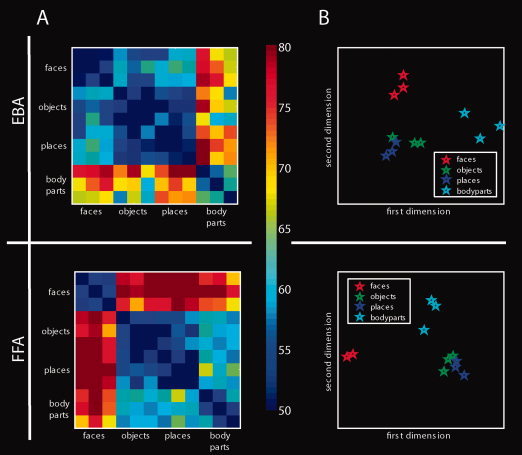
Classification results across locations and MDS. A: Exemplary results of object classification across location in EBA and FFA for all pair‐wise object classifications. Each colored cell in a matrix represents decoding accuracy for classification between two object exemplars (see color bar on the right). B: The right panel displays the location of object exemplars in the space defined by the first 2 dimensions derived by MDS on representational dissimilarity between object exemplars. The results indicate that object exemplars in both preferred and nonpreferred categories tend to cluster together according to category. [Color figure can be viewed in the online issue, which is available at wileyonlinelibrary.com.]
Classification of Location Across Objects
The contralateral visual field bias observed in high‐level ventral visual areas suggests that location information might be present in these areas. Thus, in a third analysis, we directly investigated the encoding of location in ventral visual cortex in a spatially unbiased fashion. We used a novel surface‐based searchlight method to determine whether local activation patterns are predictive of the location of objects independent of the specific exemplar presented (Fig. 6A). Results are shown in Figure 7. Significant location information was present throughout the ventral visual pathway. This result was ascertained by a ROI analysis (Fig. 6B). One‐sample t‐tests of decoding accuracy for location classification against chance revealed that all category‐ and object‐selective regions with the exception of FBA contained location information (all P < 1 × 10⁻³, Supporting Information Table 7). A control analysis in low‐level visual areas yielded near‐perfect classification performance for location decoding (Fig. 6C and Supporting Information Table 8), as expected for retinotopically organized areas. Overall, these results indicate the widespread encoding of location information in both low‐ and high‐level visual areas in the ventral visual stream.
Figure 7.
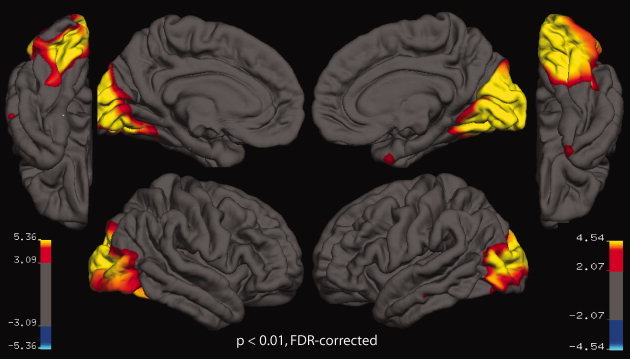
Surface‐based searchlight analysis of location information across objects in ventral visual cortex. We explored the encoding of location information in ventral visual cortex in a spatially unbiased fashion. Location information was present widely in the ventral visual pathway (P < 0.01, FDR‐corrected separately for each hemisphere). Note that location information in parietal and frontal cortex could not be assessed, because it was not covered in the MRI acquisition. [Color figure can be viewed in the online issue, which is available at wileyonlinelibrary.com.]
Next, we investigated whether high‐level ventral visual regions differ systematically in the amount of location information they contain across positions on the cortical surface [Hasson et al.,2003; Schwarzlose et al.,2008]. For this, we determined whether regions located on the lateral‐occipital surface of cortex contain more information than regions located on the ventral‐temporal surface. Thus, we conducted four paired t‐tests on decoding accuracies for location classification (Fig. 6A) for four region pairs. Each region pair was defined by the same category preference with one region on each surface (ventral‐temporal: FFA, FBA, PPA, FUS; lateral‐occipital: OFA, EBA, TOS, LO). The results are reported in Supporting Information Table 9 and visualized in Figure 6B. For all region pairs, except FUS and LO, we found significantly more location information in lateral‐occipital regions than in ventral‐temporal regions (all P < 1 × 10⁻³). This indicates a systematic difference in the distribution of location information in the ventral visual stream.
DISCUSSION
Our results provide a systematic account of two major principles of object representation in the human brain: category preference and location encoding. The results of the set of analyses we have performed are as follows: First, category‐selective regions contained information about objects from their preferred and, importantly, also nonpreferred categories tolerant to changes in location in a structured fashion. Second, location information was present widely in high‐level ventral visual cortex. A systematic difference was observed in the extent of location information across the cortical surface: Regions on the lateral‐occipital regions contained more location information than ventral‐temporal regions. Third, category‐selective regions exhibited a contralateral visual field bias.
Category Preference and Location Tolerance
Prior studies demonstrated that ventral visual cortex contains information about object category tolerant to changes in object location [Carlson et al.,2011; Cichy et al.,2011a; Sayres and Grill‐Spector,2008; Schwarzlose et al.,2008; Supporting Information Analysis 2]. We extend these findings in two ways.
First, we investigated location‐tolerance of responses in category‐selective regions separately for preferred and nonpreferred categories. Thus, we established not only that category‐selective regions contain location‐tolerant information, but also that the amount of such information is larger for preferred than for nonpreferred categories. This strengthens the notion that category is a major principle of object representation [Op de Beeck et al.,2008b].
Interestingly, this result is in apparent contrast to a recent study by Yue et al. [2011] in which the authors argued that category preference can be reverted by changes in low‐level features of the visual stimulus. One difference between the study of Yue et al. [2011] and ours is the methodology by which category preference was investigated. Yue et al. [2011] investigated category preference by mean blood oxygenated level dependent (BOLD) activation, whereas we investigated category preference by encoding of information in fMRI activation patterns. Thus, our results suggest that the encoding of object category in category‐selective regions might be independent of BOLD activation caused by changes in low‐level features of the visual stimulus.
A possible explanation for the independence of object encoding from mean activation might be given by response properties of neurons in inferior temporal cortex (IT) in monkey. Although the absolute magnitude of the neuronal response of an IT neuron is typically modulated by changes in object location, the neurons maintain their rank order [DiCarlo and Maunsell,2003; Ito et al.,1995; Logothetis and Sheinberg,1996; Op De Beeck and Vogels,2000; Tovee et al.,1994]. Thus, although the average single neuron activation in a region might be modulated by changes in object location, the neuronal activation pattern across neurons might encode objects independent of absolute activation [Li et al.,2009]. This explanation might carry over from neuronal activation patterns to fMRI activation patterns: Although mean BOLD responses in category‐selective regions might be modulated or even reversed by changes in low level features, BOLD activation patterns may allow the reliable read‐out of object category. It remains an intriguing question for further research to what extent changes in viewing conditions preserve category preference when category preference is measured by mean activation, or when it is measured by encoding in activation patterns.
Our results indicate location‐tolerant, not location‐invariant coding of objects in high‐level visual cortex. Activation patterns evoked by objects in different locations are similar enough to allow above‐chance decoding, but the extent of read‐out of object information depends on the object location in the visual field [Cichy et al.,2011a; Kravitz et al.,2010; Schwarzlose et al.,2008]. This difference in read‐out is open to interpretation. For one, it might indicate that high‐level visual regions code objects in a location‐dependent manner [Kravitz et al., 2010]. Alternatively, it might indicate that decoding of object information within location reflects both relevant shape information and irrelevant low‐level features, where the latter might not be behaviorally relevant [Cichy et al.,2011a,b; Williams et al., 2007]. Future studies using transcranial brain stimulation or lesion studies might be able to disambiguate these possibilities.
A plausible neural basis for location‐tolerant object encoding could be neurons with large receptive fields that cross the vertical meridian. Electrophysiological studies have indicated that neurons in monkey inferotemporal cortex, i.e., the homologue to human object sensitive cortex, have receptive fields that range in size typically from 5 to 30 degrees visual angle [Boussaoud et al.,1991; Desimone et al.,1984; DiCarlo and Maunsell,2003; Gross et al.,1969,1972; Kobatake and Tanaka,1994; Li et al.,2009; Op de Beeck and Vogels,2000; Richmond et al.,1983; Tovee et al.,1994]. Thus, receptive fields in high‐level visual cortex in humans would be large enough to encompass our stimuli in both locations.
Second, we extend prior studies by showing that nonpreferred responses in nearly all category‐selective regions encode information tolerant to changes in location. For one, this suggests that category‐selective regions participate in the processing of nonpreferred categories [Downing et al.,2007; Haxby et al.,2001]. Location‐tolerance is a crucial property of object representations for successful object recognition [DiCarlo and Cox,2007; Riesenhuber and Poggio,2002], and here we show that nonpreferred responses pass this test. However, an opposing interpretation is that nonpreferred responses in category‐selective regions are purely epiphenomenal [Spiridon and Kanwisher,2002]. The coordinate frame of object representations in high‐level ventral visual cortex is unknown for both preferred and nonpreferred responses. Thus, epiphenomenal responses could appear in the same location‐tolerant coordinate frame as preferred responses. Further research is needed to assess the exact role and coordinate frame of preferred and nonpreferred responses in category‐selective regions.
Further, the idea of a role for nonpreferred responses in object recognition stands in contrast to two recent studies. First, Tsao et al. [2003,2006] conducted monkey studies showing that neurons in patches of cortex which exhibit category preference for faces in fMRI nearly exclusively prefer faces to other stimuli when assessed electrophysiologically. However, characterizing the representational scheme of a region by the preferred stimulus of neurons may underestimate the amount of information present in nonpreferred responses. Future experiments may determine whether distributed neuronal activation patterns in face‐selective regions contain information about nonpreferred responses. Second, a recent study showed that the disruption of the function of category‐selective regions by transcranial magnetic stimulation selectively impaired the recognition of the preferred category, whereas leaving the recognition of nonpreferred categories intact [Pitcher et al.,2009]. However, nonpreferred responses in category‐selective regions may only be behaviorally relevant in the presence of attention [Reddy and Kanwisher,2007] or depend on task demands. Studies which systematically investigate the relation between attentional state, behavior, and encoding in category‐selective regions may help to answer these open questions.
Last, we found a category structure in nonpreferred responses in category‐selective regions: Activation patterns evoked by single exemplars of nonpreferred categories clustered together according to category. This category structure could be used by the brain for object exemplar categorization: Objects could be classified based on the representational distance of the evoked brain pattern to established category representations. Thus, our result strengthens the notion of category membership as a dominant property of object representation in the ventral visual stream [Kriegeskorte et al.,2008].
Taken together, our results further corroborate an intermediate position [O'Toole et al.,2005] between strictly distributed [Haxby et al.,2001] and strictly modular accounts [Spiridon et al., 2006] of the representational scheme in category‐selective regions.
Object‐Tolerant Location Information in the Ventral Visual Stream
By using a surface‐based searchlight technique, we found widespread and strong category‐tolerant location information throughout ventral visual cortex. A classical volumetric searchlight analysis yielded comparable results (Supporting Information Analysis 3 and Supporting Information Fig. 5). Also, a ROI analysis corroborated the encoding of location in high‐level ventral visual cortex. Thus, our results support a growing body of evidence for encoding of location information in the ventral visual pathway [Carlson et al., 2011; Fischer et al.,2011; Schwarzlose et al.,2008].
Importantly, the encoding of object location in high‐level ventral visual cortex may play several different roles in object recognition. Location information may be necessary to allow separate coding of multiple objects in parallel [Li et al.,2009] and to encode the relative position of object parts [Edelman and Intrator,2000; Missal et al.,1999]. Conversely, the lack of location information in high‐level ventral visual cortex may create a binding problem [Riesenhuber and Poggio,1999; Treisman,1999]. Thus, the joint encoding of location and object identity information in the same cortical region might be beneficial for object recognition.
Our finding of location information in high‐level ventral visual cortex is also compatible with the view that high‐level ventral visual cortex might be governed by a weak retinotopic organization [Op de Beeck et al.,2008b]. In fact, high‐level ventral visual cortex has been found to partly overlap with retinotopic cortex [Arcaro et al.,2009; Brewer et al.,2005; Larsson and Heeger,2006; Sayres and Grill‐Spector,2008]. However, the exact extent of retinotopic organization remains unclear. Interestingly, the presence of location information in the ventral visual stream constitutes a minimal and necessary, although not sufficient requirement for a potential retinotopic organization. Thus, our results suggest that the ventral visual cortex might be retinotopically organized beyond the regions in which a retinotopic organization has been demonstrated by retinotopic mapping.
Interestingly, location information was not encoded equally strongly across high‐level ventral visual cortex: Lateral‐occipital regions contained more location information than ventral‐temporal regions. A recent study found similar sensitivity differences to object location for locations across the horizontal meridian across the cortical surface in high‐level ventral visual cortex [Schwarzlose et al.,2008]. This suggests that lateral‐occipital and ventral‐temporal regions may play systematically different computational roles in visual object processing [Hasson et al.,2003]. Future studies might resolve the putatively different computational roles of regions on the lateral‐occipital versus ventral‐temporal surface in more detail.
Location‐Dependent Category Representation
We found a contralateral visual field bias in category‐selective regions and LOC (Supporting Information Analysis 1 and Supporting Information Fig. 2). This result concurs with prior studies [Grill‐Spector et al.,1998; Hemond et al.,2007; MacEvoy and Epstein,2007; McKyton and Zohary,2007; Niemeier et al.,2005; Sayres and Grill‐Spector,2008]. Thus, category‐selective regions implicitly contain location information. A simple comparison of information content in the two hemispheres indicates the location of the object. This finding is in coherence with the discovery of location information independent of the object throughout the ventral visual stream. It strengthens the notion of ventral visual cortex as containing information that to some extent is constrained by location [Kravitz et al.,2010]. Importantly though, the presence of a visual field bias or a constraint by location does not preclude the concurrent presence of location‐tolerant category representations.
CONCLUSIONS
In summary, the implications of our results are the following. By quantifying the extent to which category determines activation patterns in ventral visual cortex, we support the hypothesis of category‐preference as a principle of object representation in high‐level ventral visual cortex. However, this principle is not absolute. Our results lend plausibility to a role of nonpreferred responses in category‐selective regions as well. Moreover, we further strengthen the recently formed link between high‐level ventral visual cortex and location information. In conjunction, our results indicate that both category membership and location in the visual field determine the representation of objects in the ventral visual stream.
Supporting information
Additional Supporting Information may be found in the online version of this article.
Supporting Information
Acknowledgements
We thank Stefan Bode for discussion and helpful suggestions.
Contributor Information
Radoslaw Martin Cichy, Email: rmcichy@gmail.com.
John‐Dylan Haynes, Email: haynes@bccn-berlin.de.
REFERENCES
- Aguirre GK, Zarahn E, D'Esposito M ( 1998): An area within human ventral cortex sensitive to “building” stimuli: Evidence and implications. Neuron 21: 373–383. [DOI] [PubMed] [Google Scholar]
- Arcaro MJ, McMains SA, Singer BD, Kastner S ( 2009): Retinotopic organization of human ventral visual cortex. J Neurosci 29: 10638–10652. [DOI] [PMC free article] [PubMed] [Google Scholar]
- Boussaoud D, Desimone R, Ungerleider LG ( 1991): Visual topography of area TEO in the macaque. J Comp Neurol 306: 554–575. [DOI] [PubMed] [Google Scholar]
- Brewer AA, Liu J, Wade AR, Wandell BA ( 2005): Visual field maps and stimulus selectivity in human ventral occipital cortex. Nat Neurosci 8: 1102–1109. [DOI] [PubMed] [Google Scholar]
- Carlson TA, Schrater P, He S ( 2003): Patterns of activity in the categorical representations of objects. J Cogn Neurosci 15: 704–717. [DOI] [PubMed] [Google Scholar]
- Carlson T, Hogendoorn H, Fonteijn H, Verstraten FA ( 2011): Spatial coding and invariance in object‐selective cortex. Cortex 47: 14–22. [DOI] [PubMed] [Google Scholar]
- Chen Y, Namburi P, Elliott LT, Heinzle J, Soon CS, Chee MWL, Haynes J ( 2011): Cortical surface‐based searchlight decoding. Neuroimage 56: 582–592. [DOI] [PubMed] [Google Scholar]
- Cichy RM, Chen Y, Haynes JD ( 2011a): Encoding of identity and location of objects in human LOC. Neuroimage 54: 2297–2307. [DOI] [PubMed] [Google Scholar]
- Cichy RM, Heinzle J, Haynes JD ( 2011b). Imagery and perception share cortical representations of content and location. Cereb Cortex, doi: 10.1093/cercor/bhr106. [DOI] [PubMed] [Google Scholar]
- Clark VP, Keil K, Maisog JM, Courtney S, Ungerleider LG, Haxby JV ( 1996): Functional magnetic resonance imaging of human visual cortex during face matching: A comparison with positron emission tomography. Neuroimage 4: 1–15. [DOI] [PubMed] [Google Scholar]
- Cox DD, Savoy RL ( 2003): Functional magnetic resonance imaging (fMRI) “brain reading”: Detecting and classifying distributed patterns of fMRI activity in human visual cortex. Neuroimage 19: 261–270. [DOI] [PubMed] [Google Scholar]
- Dale AM, Fischl B, Sereno MI ( 1999): Cortical surface‐based analysis. I. Segmentation and surface reconstruction. Neuroimage 9: 179–194. [DOI] [PubMed] [Google Scholar]
- Desimone R, Albright TD, Gross CG, Bruce C ( 1984): Stimulus‐selective properties of inferior temporal neurons in the macaque. J Neurosci 4: 2051–2062. [DOI] [PMC free article] [PubMed] [Google Scholar]
- DeYoe EA, Carman GJ, Bandettini P, Glickman S, Wieser J, Cox R, Miller D, Neitz J ( 1996): Mapping striate and extrastriate visual areas in human cerebral cortex. Proc Natl Acad Sci USA 93: 2382–2386. [DOI] [PMC free article] [PubMed] [Google Scholar]
- DiCarlo JJ, Cox DD ( 2007): Untangling invariant object recognition. Trends Cogn Sci 11: 333–341. [DOI] [PubMed] [Google Scholar]
- DiCarlo JJ, Maunsell JHR ( 2003): Anterior inferotemporal neurons of monkeys engaged in object recognition can be highly sensitive to object retinal position. J Neurophysiol 89: 3264–3278. [DOI] [PubMed] [Google Scholar]
- Downing PE, Jiang Y, Shuman M, Kanwisher N ( 2001): A cortical area selective for visual processing of the human body. Science 293: 2470–2473. [DOI] [PubMed] [Google Scholar]
- Downing PE, Wiggett AJ, Peelen MV ( 2007): Functional magnetic resonance imaging investigation of overlapping lateral occipitotemporal activations using multi‐voxel pattern analysis. J Neurosci 27: 226–233. [DOI] [PMC free article] [PubMed] [Google Scholar]
- Edelman S, Intrator N ( 2000): (Coarse coding of shape fragments) + (retinotopy) representation of structure. Spatial Vision 13: 255–264. [DOI] [PubMed] [Google Scholar]
- Eger E, Ashburner J, Haynes J, Dolan RJ, Rees G ( 2008): fMRI activity patterns in human LOC carry information about object exemplars within category. J Cogn Neurosci 20: 356–370. [DOI] [PMC free article] [PubMed] [Google Scholar]
- Epstein R, Kanwisher N ( 1998): A cortical representation of the local visual environment. Nature 392: 598–601. [DOI] [PubMed] [Google Scholar]
- Fischer J, Spotswood N, Whitney D ( 2011): The emergence of perceived position in the visual system. J Cogn Neurosci 23: 119–136. [DOI] [PMC free article] [PubMed] [Google Scholar]
- Fischl B, Sereno MI, Dale AM ( 1999a): Cortical surface‐based analysis. II. Inflation, flattening, and a surface‐based coordinate system. Neuroimage 9: 195–207. [DOI] [PubMed] [Google Scholar]
- Fischl B, Sereno MI, Tootell RB, Dale AM ( 1999b): High‐resolution intersubject averaging and a coordinate system for the cortical surface. Hum Brain Mapp 8: 272–284. [DOI] [PMC free article] [PubMed] [Google Scholar]
- Fischl B, Liu A, Dale AM ( 2001): Automated manifold surgery: Constructing geometrically accurate and topologically correct models of the human cerebral cortex. IEEE Trans Med Imaging 20: 70–80. [DOI] [PubMed] [Google Scholar]
- Gauthier I, Tarr MJ, Moylan J, Skudlarski P, Gore JC, Anderson AW ( 2000): The fusiform “face area” is part of a network that processes faces at the individual level. J Cogn Neurosci 12: 495–504. [DOI] [PubMed] [Google Scholar]
- Grill‐Spector K, Malach R ( 2004): The human visual cortex. Annu Rev Neurosci 27: 649–647. [DOI] [PubMed] [Google Scholar]
- Grill‐Spector K, Kushnir T, Hendler T, Edelman S, Itzchak Y, Malach R ( 1998): A sequence of object‐processing stages revealed by fMRI in the human occipital lobe. Hum Brain Mapp 6: 316–328. [DOI] [PMC free article] [PubMed] [Google Scholar]
- Grill‐Spector K, Kourtzi Z, Kanwisher N ( 2001): The lateral occipital complex and its role in object recognition. Vision Res 41: 1409–1422. [DOI] [PubMed] [Google Scholar]
- Gross CG, Bender DB, Rocha‐Miranda CE ( 1969): Visual receptive fields of neurons in inferotemporal cortex of the monkey. Science 166: 1303–1306. [DOI] [PubMed] [Google Scholar]
- Gross CG, Rocha‐Miranda CE, Bender DB ( 1972) Visual properties of neurons in inferotemporal cortex of the Macaque. J Neurophysiol 35: 96–111. [DOI] [PubMed] [Google Scholar]
- Guzman‐Martinez E, Leung P, Franconeri S, Grabowecky M, Suzuki S ( 2009): Rapid eye‐fixation training without eyetracking. Psychon Bull Rev 16: 491–496. [DOI] [PMC free article] [PubMed] [Google Scholar]
- Halgren E, Dale AM, Sereno MI, Tootell RB, Marinkovic K, Rosen BR ( 1999): Location of human face‐selective cortex with respect to retinotopic areas. Hum Brain Mapp 7: 29–37. [DOI] [PMC free article] [PubMed] [Google Scholar]
- Hasson U, Levy I, Behrmann M, Hendler T, Malach R ( 2002): Eccentricity bias as an organizing principle for human high‐order object areas. Neuron 34: 479–490. [DOI] [PubMed] [Google Scholar]
- Hasson U, Harel M, Levy I, Malach R ( 2003): Large‐scale mirror‐symmetry organization of human occipito‐temporal object areas. Neuron 37: 1027–1041. [DOI] [PubMed] [Google Scholar]
- Haxby JV, Hoffman EA, Gobbini MI ( 2000): The distributed human neural system for face perception. Trends Cogn Sci 4: 223–233. [DOI] [PubMed] [Google Scholar]
- Haxby JV, Gobbini MI, Furey ML, Ishai A, Schouten JL, Pietrini P ( 2001): Distributed and overlapping representations of faces and objects in ventral temporal cortex. Science 293: 2425–2430. [DOI] [PubMed] [Google Scholar]
- Haynes J, Rees G ( 2005a): Predicting the orientation of invisible stimuli from activity in human primary visual cortex. Nat Neurosci 8: 686–691. [DOI] [PubMed] [Google Scholar]
- Haynes J, Rees G ( 2005b): Predicting the stream of consciousness from activity in human visual cortex. Curr Biol 15: 1301–1307. [DOI] [PubMed] [Google Scholar]
- Haynes J, Rees G ( 2006): Decoding mental states from brain activity in humans. Nat Rev Neurosci 7: 523–534. [DOI] [PubMed] [Google Scholar]
- Hemond CC, Kanwisher NG, Op de Beeck HP ( 2007): A preference for contralateral stimuli in human object‐ and face‐selective cortex. PLoS ONE 2: e574. doi:10.1371/journal.pone.0000574. [DOI] [PMC free article] [PubMed] [Google Scholar]
- Hung CP, Kreiman G, Poggio T, DiCarlo JJ ( 2005): Fast readout of object identity from macaque inferior temporal cortex. Science 310: 863–866. [DOI] [PubMed] [Google Scholar]
- Ito M, Tamura H, Fujita I, Tanaka K ( 1995): Size and position invariance of neuronal responses in monkey inferotemporal cortex. J Neurophysiol 73: 218–226. [DOI] [PubMed] [Google Scholar]
- Kamitani Y, Tong F ( 2005): Decoding the visual and subjective contents of the human brain. Nat Neurosci 8: 679–685. [DOI] [PMC free article] [PubMed] [Google Scholar]
- Kanwisher N, McDermott J, Chun MM ( 1997): The Fusiform Face Area: A module in human extrastriate cortex specialized for face perception. J Neurosci 17: 4302–4311. [DOI] [PMC free article] [PubMed] [Google Scholar]
- Kobatake E, Tanaka K ( 1994): Neuronal selectivities to complex object features in the ventral visual pathway of the macaque cerebral cortex. J. Neurophysiol 71: 856–867. [DOI] [PubMed] [Google Scholar]
- Kravitz DJ, Kriegeskorte N, Baker CI ( 2010): High‐level visual object representations are constrained by position. Cereb Cortex 20: 2916–2925. [DOI] [PMC free article] [PubMed] [Google Scholar]
- Kriegeskorte N, Goebel R, Bandettini P ( 2006): Information‐based functional brain mapping. Proc Natl Acad Sci U S A 103: 3863–3868. [DOI] [PMC free article] [PubMed] [Google Scholar]
- Kriegeskorte N, Formisano E, Sorger B, Goebel R ( 2007): Individual faces elicit distinct response patterns in human anterior temporal cortex. Proc Natl Acad Sci USA 104: 20600–20605. [DOI] [PMC free article] [PubMed] [Google Scholar]
- Kriegeskorte N, Mur M, Ruff DA, Kiani R, Bodurka J, Esteky H, Tanaka K, Bandettini PA ( 2008): Matching Categorical object representations in inferior temporal cortex of man and monkey. Neuron 60: 1126–1141. [DOI] [PMC free article] [PubMed] [Google Scholar]
- Larsson J, Heeger DJ ( 2006): Two retinotopic visual areas in human lateral occipital cortex. J Neurosci 26: 13128–13142. [DOI] [PMC free article] [PubMed] [Google Scholar]
- Levy I, Hasson U, Avidan G, Hendler T, Malach R ( 2001): Center‐periphery organization of human object areas. Nat Neurosci 4: 533–539. [DOI] [PubMed] [Google Scholar]
- Li N, Cox DD, Zoccolan D, DiCarlo JJ ( 2009): What response properties do individual neurons need to underlie position and clutter “invariant” object recognition? J Neurophysiol 102: 360–376. [DOI] [PMC free article] [PubMed] [Google Scholar]
- Logothetis NK, Sheinberg DL ( 1996): Visual object recognition. Annu Rev Neurosci 19: 577–621. [DOI] [PubMed] [Google Scholar]
- MacEvoy SP, Epstein RA ( 2007): Position selectivity in scene‐ and object‐responsive occipitotemporal regions. J Neurophysiol 98: 2089–2098. [DOI] [PubMed] [Google Scholar]
- Malach R, Reppas JB, Benson RR, Kwong KK, Jiang H, Kennedy WA, Ledden PJ, Brady TJ, Rosen BR, Tootell RB ( 1995): Object‐related activity revealed by functional magnetic resonance imaging in human occipital cortex. Proc Natl Acad Sci USA 92: 8135–8139. [DOI] [PMC free article] [PubMed] [Google Scholar]
- Malach R, Levy I, Hasson U ( 2002): The topography of high‐order human object areas. Trends Cogn Sci 6: 176–184. [DOI] [PubMed] [Google Scholar]
- McKyton A, Zohary E ( 2007): Beyond retinotopic mapping: The spatial representation of objects in the human lateral occipital complex. Cereb Cortex 17: 1164–1172. [DOI] [PubMed] [Google Scholar]
- Missal M, Vogels R, Li CY, Orban GA ( 1999): Shape interactions in macaque inferior temporal neurons. J Neurophysiol 82: 131–42. [DOI] [PubMed] [Google Scholar]
- Müller K, Mika S, Rätsch G, Tsuda K, Schölkopf B ( 2001): An introduction to kernel‐based learning algorithms. IEEE Trans Neural Network 12: 181–201. [DOI] [PubMed] [Google Scholar]
- Niemeier M, Goltz HC, Kuchinad A, Tweed DB, Vilis T ( 2005): A contralateral preference in the lateral occipital area: sensory and attentional mechanisms. Cereb Cortex 15: 325–331. [DOI] [PubMed] [Google Scholar]
- Norman KA, Polyn SM, Detre GJ, Haxby JV ( 2006): Beyond mind‐reading: multi‐voxel pattern analysis of fMRI data. Trends Cogn Sci 10: 424–430. [DOI] [PubMed] [Google Scholar]
- Op De Beeck H, Vogels R ( 2000): Spatial sensitivity of macaque inferior temporal neurons. J Comp Neurol 426: 505–518. [DOI] [PubMed] [Google Scholar]
- Op de Beeck HP, DiCarlo JJ, Goense JBM, Grill‐Spector K, Papanastassiou A, Tanifuji M, Tsao DY ( 2008a): Fine‐scale spatial organization of face and object selectivity in the temporal lobe: Do functional magnetic resonance imaging, optical imaging, and electrophysiology agree? J Neurosci 28: 11796–11801. [DOI] [PMC free article] [PubMed] [Google Scholar]
- Op de Beeck HP, Haushofer J, Kanwisher NG ( 2008b): Interpreting fMRI data: Maps, modules and dimensions. Nat Rev Neurosci 9: 123–135. [DOI] [PMC free article] [PubMed] [Google Scholar]
- O'Toole AJ, Jiang F, Abdi H, Haxby JV ( 2005): Partially distributed representations of objects and faces in ventral temporal cortex. J Cogn Neurosci 17: 580–590. [DOI] [PubMed] [Google Scholar]
- Peelen MV, Downing PE ( 2005): Selectivity for the human body in the fusiform gyrus. J Neurophysiol 93: 603–608. [DOI] [PubMed] [Google Scholar]
- Pitcher D, Charles L, Devlin JT, Walsh V, Duchaine B ( 2009): Triple dissociation of faces, bodies, and objects in extrastriate cortex. Curr Biol 19: 319–324. [DOI] [PubMed] [Google Scholar]
- Puce A, Allison T, Gore JC, McCarthy G ( 1995): Face‐sensitive regions in human extrastriate cortex studied by functional MRI. J Neurophysiol 74: 1192–1199. [DOI] [PubMed] [Google Scholar]
- Reddy L, Kanwisher N ( 2006): Coding of visual objects in the ventral stream. Curr Opin Neurobiol 16: 408–414. [DOI] [PubMed] [Google Scholar]
- Reddy L, Kanwisher N ( 2007): Category selectivity in the ventral visual pathway confers robustness to clutter and diverted attention. Curr Biol 17: 2067–2072. [DOI] [PMC free article] [PubMed] [Google Scholar]
- Richmond BJ, Wurtz RH, Sato T ( 1983): Visual responses of inferior temporal neurons in awake rhesus monkey. J Neurophysiol 50: 1415–1432. [DOI] [PubMed] [Google Scholar]
- Riesenhuber M, Poggio T ( 1999): Are cortical models really bound by the “Binding problem”? Neuron 24: 87–93. [DOI] [PubMed] [Google Scholar]
- Riesenhuber M, Poggio T ( 2002): Neural mechanisms of object recognition. Curr Opin Neurobiol 12: 162–168. [DOI] [PubMed] [Google Scholar]
- Sayres R, Grill‐Spector K ( 2008): Relating retinotopic and object‐selective responses in human lateral occipital cortex. J Neurophysiol 100: 249–267. [DOI] [PMC free article] [PubMed] [Google Scholar]
- Schwarzlose RF, Baker CI, Kanwisher N ( 2005): Separate face and body selectivity on the fusiform gyrus. J Neurosci 25: 11055–11059. [DOI] [PMC free article] [PubMed] [Google Scholar]
- Schwarzlose RF, Swisher JD, Dang S, Kanwisher N ( 2008): The distribution of category and location information across object‐selective regions in human visual cortex. Proc Natl Acad Sci USA 105: 4447–4452. [DOI] [PMC free article] [PubMed] [Google Scholar]
- Ségonne F, Dale AM, Busa E, Glessner M, Salat D, Hahn HK, Fischl B ( 2004): A hybrid approach to the skull stripping problem in MRI. Neuroimage 22: 1060–1075. [DOI] [PubMed] [Google Scholar]
- Sereno MI, Dale AM, Reppas JB, Kwong KK, Belliveau JW, Brady TJ, Rosen BR, Tootell RB ( 1995): Borders of multiple visual areas in humans revealed by functional magnetic resonance imaging. Science 268: 889–893. [DOI] [PubMed] [Google Scholar]
- Spiridon M, Kanwisher N ( 2002): How distributed is visual category information in human occipito‐temporal cortex? An fMRI study. Neuron 35: 1157–1165. [DOI] [PubMed] [Google Scholar]
- Spiridon M, Fischl B, Kanwisher N (2006): Location and spatial profile of category‐specific regions in human extrastriate cortex. Hum Brain Mapp 27:77–89. [DOI] [PMC free article] [PubMed] [Google Scholar]
- Stokes M, Saraiva A, Rohenkohl G, Nobre AC ( 2011): Imagery for shapes activates position‐invariant representations in human visual cortex. Neuroimage 56: 1540–1545. [DOI] [PubMed] [Google Scholar]
- Tovee MJ, Rolls ET, Azzopardi P ( 1994): Translation invariance in the responses to faces of single neurons in the temporal visual cortical areas of the alert macaque. J Neurophysiol 72: 1049–1060. [DOI] [PubMed] [Google Scholar]
- Treisman A ( 1999): Solutions to the binding problem: progress through controversy and convergence. Neuron 24: 105–125. [DOI] [PubMed] [Google Scholar]
- Tsao DY, Freiwald WA, Knutsen TA, Mandeville JB, Tootell RBH ( 2003): Faces and objects in macaque cerebral cortex. Nat Neurosci 6: 989–995. [DOI] [PMC free article] [PubMed] [Google Scholar]
- Tsao DY, Freiwald WA, Tootell RBH, Livingstone MS ( 2006): A cortical region consisting entirely of face‐selective cells. Science 311: 670–674. [DOI] [PMC free article] [PubMed] [Google Scholar]
- Wandell BA, Chial S, Backus BT (2000): Visualization and measurement of the cortical surface. J Cogn Neurosci 12:739–752. [DOI] [PubMed] [Google Scholar]
- Wandell BA, Dumoulin SO, Brewer AA ( 2007): Visual field maps in human cortex. Neuron 56: 366–383. [DOI] [PubMed] [Google Scholar]
- Williams MA, Baker CI, Op de Beeck HP, Mok Shim W, Dang S, Triantafyllou C, Kanwisher N ( 2008): Feedback of visual object information to foveal retinotopic cortex. Nat Neurosci 11: 1439–1445. [DOI] [PMC free article] [PubMed] [Google Scholar]
- Williams MA, Dang S, Kanwisher NG (2008): Only some spatial patterns of fMRI response are read out in task performance. Nat Neurosci 10:685–686. [DOI] [PMC free article] [PubMed] [Google Scholar]
- Yue X, Cassidy BS, Devaney KJ, Holt DJ, Tootell RBH ( 2011): Lower‐level stimulus features strongly influence responses in the fusiform face area. Cereb Cortex 21: 35–47. [DOI] [PMC free article] [PubMed] [Google Scholar]
Associated Data
This section collects any data citations, data availability statements, or supplementary materials included in this article.
Supplementary Materials
Additional Supporting Information may be found in the online version of this article.
Supporting Information