

Abstract
The aim of this study was to evaluate the gender and age differences in the normal adult human brain, using voxel‐based morphometry. In this study, 227 right‐handed normal adults (male:female = 111:116) were examined. Three‐dimensional magnetic resonance brain images of each subject were segmented into gray and white matter using statistical parametric mappings. All individual data were transformed to standard brain space and then divided into older and younger age groups before examining the effects of age and gender. There was a significant negative correlation between gray matter concentration and age in each gender group. The differences were more prominent in the older age groups compared with the younger age groups. Gray matter concentrations in the bilateral inferior frontal lobes, anterior cingulate gyrus, medial thalamus, and hypothalamus were more retained in females as they aged, whereas those in the occipital regions were more retained in aging males. Our findings are consistent with biologically and hormonally established gender differences. Hum Brain Mapp, 2011. © 2010 Wiley‐Liss, Inc.
Keywords: gender difference, magnetic resonance imaging, normal brain, VBM, sex difference, aging
INTRODUCTION
Gender differences have been investigated in numerous studies using various modalities with respect to behavior, diseases, healing processes, and results of disease therapy. There have been a number of discussions concerning the anatomical gender differences in the normal adult human brain. It is well known that the brain size of males is larger than that of females, as revealed by postmortem examination [Ankney,1992] and in vivo imaging studies [Filipek et al.,1994; Nopoulos et al.,2000; Witelson et al.,1995]. Females have a larger volume of cortical gray matter after correction for total brain volume [Gur et al.,1999; Luders et al.,2005]. Females also possess larger dorsolateral prefrontal cortex [Schlaepfer et al.,1995], thalamus [Murphy et al.,1996; Xu et al.,2000], hippocampal regions [Filipek et al.,1994; Murphy et al.,1996], anterior cingulate gyrus [Brun et al.,2009; Paus et al.,1996], and parietal lobes [Nopoulos et al.,2000] as compared with males. Furthermore, females have more gray matter in language‐associated regions, including Broca's area and the auditory cortex [Brun et al.,2009; Harasty et al.,1997], and more cortical complexity in the inferior frontal lobe [Luders et al.,2004] than males. However, it should be noticed that some studies [Luders et al.,2002, Brun et al.,2009] have reported that brain size (not gender‐specific differences) is the main variable determining the concentration of the gray matter even after correction of the global differences by using proportional scaling. However, the other aforementioned studies have not accounted for the effect of the brain size on gray‐matter concentration. On the other hand, men have a larger volume of cortical gray matter in the cerebellum [Escalona et al.,1991; Raz et al.,2001; Xu et al.,2000] and the limbic region [Giedd et al.,1997; Good et al.,2001a]. Thus, gender differences in the volume of regional gray matter appear to be inconsistent. However, these inconsistencies may be owing to various methodological approaches. Earlier studies using computed tomography (CT) and magnetic resonance imaging (MRI) morphometry have mainly used regions of interest (ROI) analyses to explore gender differences. This method is time consuming and can only provide measures for rather large areas, i.e., finer differences might be overlooked. In recent years, voxel‐based morphometric (VBM) analysis has been developed to investigate focal differences in brain anatomy, using the statistical parametric mapping (SPM) approach. This is performed by segmenting each brain image set into gray matter, white matter, and cerebrospinal fluid (CSF) regions subsequent to warping the individual brain images to the same template. Each brain image is smoothed to cope with the functional anatomical variability that is not compensated by spatial normalization and to improve the signal‐to‐noise ratio, which increases statistical power. Therefore, prospective voxel‐by‐voxel analysis of gray matter concentration can be performed [Ashburner and Friston,2000]. This method can eliminate the effect of size differences in brains and allow for prospective statistical analysis of the differences in gray matter loss in a voxel‐by‐voxel comparison. We should note that, although VBM is quite a effective in identifying small structures, different results between ROIs analyses and VBM in a few structures, such as the insula cortex and the thalamus, have been reported [Good et al.,2001b; Tisserand et al.,2004]. The reasons for these inconsistencies remain unclear. One possible reason may be registration error in structures surrounding the sulcus or ventricles in VBM processing [Bookstein,2001].
There have been a few VBM studies with regard to gender differences. A large study that examined 465 normal human brains reported that females had significantly increased gray matter concentration, which is relatively symmetrical in the cortical mantle, parahippocampal gyrus, and in the banks of the cingulate and calcarine sulci. Males had increased gray matter volume bilaterally in the mesial temporal lobes, in the entorhinal and perirhinal cortex, and in the anterior lobes of the cerebellum, but no regions of increased gray matter concentration [Good et al.,2001a]. Results from analyses of the parahippocampal gyrus [Filipek et al.,1994; Murphy et al.,1996] and cingulate gyrus [Brun et al.,2009; Paus et al.,1996] were consistent with some previous ROI analyses. However, the gender differences in these studies were compared while regarding all the generations as one group, which means that younger females and older females were classified into the same group. We propose that the synchronicity between brain alterations and hormonal changes with aging should be taken into account. Estrogen use is associated with greater cerebellar and cerebral gray matter volume in postmenopausal women [Boccardi et al.,2006]. Occipital lobe volume was negatively correlated with higher estradiol and estrone concentrations [Lessov‐Schlaggar et al.,2005]. They also demonstrated a positive correlation between testosterone concentrations and total brain volume. Therefore, it is reasonable to infer that gender differences in brain volume may differ before and after menopause owing to changes in the hormonal status. Moreover, aging results in regional alterations in the cortical gray matter [Allen et al.,2005; Good et al.,2001b; Tisserand et al.,2004]. We believe that studies exploring gender differences would be enhanced if gender groups were age‐matched.
ROI‐based studies have explored the gender differences by classifying subjects into old and young age groups [Murphy et al.,1996; Xu et al.,2000]. Two VBM studies have examined age‐matched comparisons. One of the VBM studies carried out a strict age‐matched gender comparison in 441 healthy subjects (aged 44–48 years) and found that males have more gray matter volume in the midbrain, left inferior temporal gyrus, right occipital lingual gyrus, right middle temporal gyrus, and in both cerebellar hemispheres, while females showed greater volume in the cingulate cortices and right inferior parietal lobule [Chen et al.,2007]. The other VBM gender comparison study, using a larger age range (58–95 years) failed to detect any gender differences [Smith et al.,2006]. However, no VBM study has yet examined gender differences within different age groups. In this study, we examined 227 right‐handed normal adults to complement two previous ROI analyses of similar design. First, regional brain alterations with aging were examined in each gender. Second, voxel‐by‐voxel comparisons were made between males and females in two groups: an older age group (over 50 years) and a younger age group (under 50 years).
SUBJECTS AND METHODS
Subjects
Our institutional ethical committee approved this study, and the informed consent was obtained from each subject after explanation of the purpose and procedure of the study. The recruitment of 227 healthy, right‐handed subjects (111 male and 116 female) took place at our institution. The subjects displayed no clinical evidence of cognitive deficits or neurological disease and were not receiving any short‐ or long‐term drug therapies at the time of the imaging examinations. The subjects presented no abnormal findings on MR images, disregarding age‐related atrophy and white matter changes on T2‐weighted images. We divided the subjects into subgroups by gender and age, as shown in Table I.
Table I.
Age distribution of subjects
| Age group | Female (y) (mean ± SD) | Male (y) (mean ± SD) |
|---|---|---|
| 20–29 | 25.0 ± 2.4 (n = 15) | 24.3 ± 1.8 (n = 28) |
| 30–39 | 32.9 ± 2.8 (n = 11) | 34.0 ± 3.0 (n = 22) |
| 40–49 | 46.0 ± 2.4 (n = 9) | 45.8 ± 3.0 (n = 6) |
| 50–59 | 55.9 ± 2.1 (n = 27) | 56.0 ± 2.6 (n = 8) |
| 60–69 | 64.8 ± 2.8 (n = 29) | 64.8 ± 3.0 (n = 34) |
| 70–79 | 73.6 ± 3.1 (n = 21) | 72.0 ± 2.1 (n = 8) |
| >80 | 84.3 ± 2.7 (n = 4) | 86.4 ± 6.2 (n = 5) |
| <50 | 32.9 ± 8.8 (n = 35) | 30.4 ± 7.4 (n = 56) |
| >50 | 65.1 ± 8.5 (n = 81) | 66.5 ± 8.3 (n = 55) |
| All | 55.4 ± 17.1 (n = 116) | 48.3 ± 20.0 (n = 111) |
MR Imaging Procedures
The MR imager was a 1.5‐T Signa Horizon (GE Medical Systems, Milwaukee, WI). Sagittal, coronal, and axial T1‐weighted spin‐echo (SE) images (550/15/2 [TR/TE/NEX], 5‐mm thickness, 2.5‐mm gap) and axial T2‐weighted fast SE images (3,000/21, 105/2) were obtained for abnormality detection. Coronal 3D spoiled gradient‐echo (SPGR) imaging (14/3/2, 20° flip angle, 220‐mm field of view, 256 × 256 matrix, 124 × 1.5 mm contiguous sections) was performed for VBM analysis.
Data Analysis
SPM 8 software (Wellcome Department of Cognitive Neurology, London, United Kingdom) was used for the statistical analyses. Calculations and image matrix manipulations were performed in MATLAB 2006a (MathWorks Inc., Natick, MA). For VBM analysis with SPM 8, all coronal SPGR MR imaging data sets were reconstructed to axial data sets and then converted to ANALYZE format. Using a cluster analysis technique, each subject's image was anatomically segmented. This process partitioned the images into gray matter, white matter, and CSF by using a modified mixture model cluster analysis technique with correction for nonuniform image intensity. Anatomic normalization and statistical processing were also performed with SPM 8 software. All individual MR images were transformed into a standard stereotactic anatomic space, and the image sets were smoothed with an isotropic Gaussian filter (12 mm full‐width at half‐maximum). Proportional scaling was used to normalize the individual global gray matter densities.
Correlations between aging and gray matter loss within age groups were examined in both males and females. Voxel‐by‐voxel comparisons were made between males and females in the two groups: an older age group (over 50 years) and a younger age group (under 50 years).
At the significance level of P < 0.001, uncorrected, the gray matter concentration of almost the entire cortex was significantly negatively correlated with age. Therefore, data were considered significant if the voxels passed a corrected significance threshold of P < 0.01 for correlation with age and P < 0.001, uncorrected for gender difference.
RESULTS
Global Effect in Aging
The bilateral insula, thalamus, cingulate, and medial frontal and occipital gray matter concentrations showed a significant negative correlation with age in both female and male groups (P < 0.01, corrected) (Table II, Fig. 1). It appeared that the gray matter in the occipital regions, such as regions for visual association, had a greater negative correlation in females than in males, and the medial frontal region showed greater negative correlation with age in males than in females. However, there was no positive correlation between gray matter concentration and age in either the male or the female groups.
Table II.
Negative correlation with age
| Brain region | Talairach coordinates | t‐value | ||||
|---|---|---|---|---|---|---|
| Side | x | y | z | |||
| Female | Insula | R | 41 | −15 | 1 | 11.35 |
| Fusiform gyrus | L | −42 | −38 | −30 | 10.20 | |
| Insula | L | −40 | −19 | 7 | 10.20 | |
| Thalamus | R | 0 | −4 | 6 | 9.61 | |
| Middle frontal gyrus | R | 1 | 68 | 0 | 8.39 | |
| Parieto‐occipital lobe | L | −6 | −74 | 31 | 5.63 | |
| Parieto‐occipital lobe | R | 2 | −76 | 41 | 5.52 | |
| Male | Thalamus | R | 8 | −5 | 14 | 11.88 |
| Insula | R | 44 | −10 | −3 | 11.74 | |
| Insula | L | −42 | −4 | −3 | 11.72 | |
| Occipital lobe | L | −29 | −104 | −4 | 9.38 | |
| Inferior temporal gyrus | L | −64 | −30 | −18 | 7.61 | |
| Medial frontal lobe | L | −2 | 0 | 70 | 6.99 | |
Figure 1.
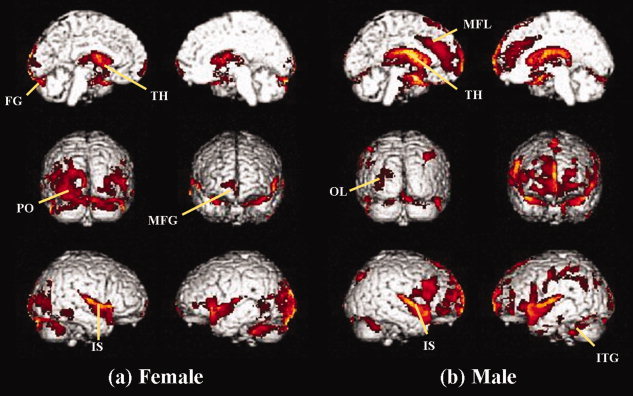
Negative correlation with aging. Statistical parametric maps show the area where the gray matter concentration was negatively correlated with aging in females (a) and males (b) (P < 0.01, uncorrected). The bilateral insula, thalamus, cingulate, medial frontal, and medial occipital gray matter densities showed a significant negative correlation with aging in both female and male groups. FG, fusiform gyrus; IS, insula gyrus; ITG, inferior temporal gyrus; MFG, middle frontal gyrus; MFL, medial frontal lobe; OL, occipital lobe; PO, parieto‐occipital lobe; TH, thalamus. [Color figure can be viewed in the online issue, which is available at wileyonlinelibrary.com.]
Gender Differences in the Older Age Group
Females had higher gray matter concentration in the bilateral inferior frontal gyrus, anterior cingulate gyrus, thalamus, and the bilateral hypothalamus (P < 0.001, uncorrected) (Table III, Fig. 2a) than males. Males had higher gray matter concentration in the bilateral occipital regions, fusiform gyrus, left parieto‐occipital lobe, cerebellum, and temporal lobe (P < 0.001, uncorrected) (Table III, Fig. 2b).
Table III.
Gender differences in gray matter concentration
| Brain region | Talairach coordinates | t‐value | |||||
|---|---|---|---|---|---|---|---|
| Side | x | y | z | ||||
| Older age | Females > males | Inferior frontal gyrus | R | 59 | 30 | 15 | 5.67 |
| Thalamus | R | 2 | −11 | 6 | 5.54 | ||
| Inferior frontal gyrus | L | −44 | 42 | −12 | 5.47 | ||
| Anterior cingulate gyrus | R | 6 | 27 | 30 | 5.42 | ||
| Thalamus | L | −2 | −15 | 5 | 5.02 | ||
| Anterior cingulate gyrus | L | −4 | 25 | 36 | 4.88 | ||
| Hypothalamus | R | 2 | −7 | −18 | 4.80 | ||
| Hypothalamus | L | −2 | −5 | −15 | 4.29 | ||
| Males > females | Occipital lobe | L | −36 | −79 | 15 | 5.56 | |
| Cerebellum | L | −32 | −78 | −38 | 4.56 | ||
| Parieto‐occipital lobe | L | −20 | −74 | 37 | 4.46 | ||
| Temporal lobe | L | −36 | −5 | −18 | 4.25 | ||
| Occipital lobe | R | 26 | −92 | −6 | 4.04 | ||
| Fusiform gyrus | R | 30 | −74 | −10 | 4.01 | ||
| Fusiform gyrus | L | −32 | −51 | −13 | 3.66 | ||
| Younger age | Females > males | Callosomarginalis | R | 16 | −31 | 42 | 4.50 |
| Orbitofrontal gyrus | L | −8 | 32 | −18 | 4.23 | ||
| Inferior occipital gyrus | L | −52 | −77 | −28 | 4.20 | ||
| Males > female | Midbrain | L | −14 | −14 | −6 | 4.41 | |
Figure 2.
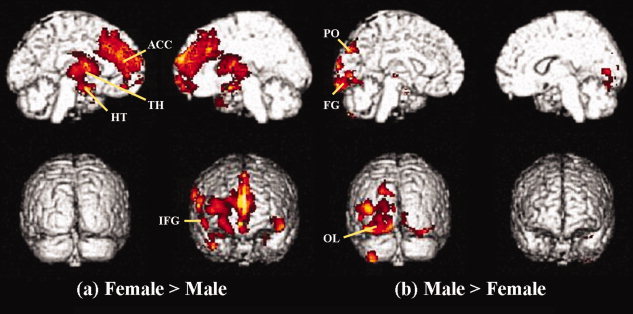
Gender differences in the older group. (a) Statistical parametric maps comparing the gray matter volume between females and males in the older age group (P < 0.001, uncorrected). Gray matter concentrations in the bilateral inferior frontal gyrus, anterior cingulate gyrus, thalamus, and the bilateral hypothalamus regions are highlighted. (b) Gray matter concentrations in the bilateral occipital regions, fusiform gyrus, left parieto‐occipital lobe, and temporal lobe are highlighted. ACC, anterior cingulate gyrus; FG, fusiform gyrus; HT, hypothalamus; IFG, inferior frontal gyrus; OL, occipital lobe; PO, parieto‐occipital lobe; TH, thalamus.
Gender Differences in the Younger Age Group
Females had a higher gray matter concentration in the right callosomarginalis, left frontal lobe, and inferior occipital gyrus (P < 0.001, uncorrected) (Table III, Fig. 3a). Males had higher gray matter concentration in the bilateral midbrain. (P < 0.001, uncorrected) (Table III, Fig. 3b).
Figure 3.
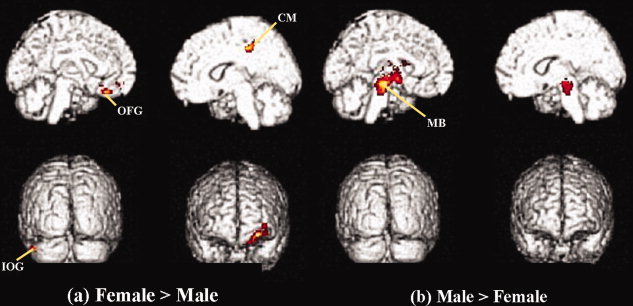
Gender differences in the younger group. (a) Statistical parametric maps comparing gray matter volume between females and males in the younger age group (P < 0.001, uncorrected). Gray matter concentrations in the right callosomarginalis, left frontal lobe, and inferior occipital gyrus are highlighted. (b) Gray matter concentrations in the bilateral midbrain are highlighted. CM, callosomarginalis; OFG, orbitofrontal gyrus; IOG, inferior occipital gyrus; MB, midbrain. [Color figure can be viewed in the online issue, which is available at wileyonlinelibrary.com.]
DISCUSSION
This study revealed that the regions where gray matter concentration was negatively correlated with age were widely distributed within the cortex, notably in the bilateral insula, thalamus, and medial frontal lobe. These findings are consistent with the results of previous VBM studies investigating the effects of aging on gray matter [Good et al.,2001b; Sato et al.,2003]. It appeared that gray matter concentration in the occipital regions, such as in the visual association areas, had greater negative correlation with age in females than in males, while the medial frontal region showed greater negative correlation with age in males than in females.
Gender differences in cortical gray matter concentration were apparent in the comparison between the older age group, although a few regions exhibiting gender differences were detected in the younger age group. In the younger age group, we found that females had greater gray matter concentration in the callosomarginalis, orbitofrontal gyrus, and inferior occipital gyrus, though these results are not consistent with previous studies. The males exhibited significantly higher gray matter concentration in the midbrain. A greater concentration in the midbrain was also detected in another, larger comparison of 44–48‐year‐old normal subjects [Chen et al.,2007]. However, we did not find any consistent tendency in gender differences within each decade in the under 50‐year‐old group (data not shown).
In the gender comparison in subjects over 50‐years of age, females displayed more gray matter concentration in the bilateral inferior frontal cortex, anterior cingulate gyrus, hypothalamus, and medial thalamus. The gray matter concentrations in the inferior frontal cortex [Luders et al.,2004], thalamus [Murphy et al.,1996; Xu et al.,2000], and anterior cingulate gyrus [Brun et al.,2009; Chen et al.,2007; Good et al.,2001a; Paus et al.,1996] obtained in this study are consistent with previous studies. Brun et al. [2009] detected gender‐specific differences in the anterior cingulate gyrus in the case of young subjects. It is difficult to provide a complete explanation in this regard. A different rendering approach and a relatively small number of young subjects in this study might have led to the differences in our and previous findings. A deformation‐based morphometry study suggested that males have an occipital pole that protrudes to a greater extent, whereas women have more prominent frontal poles [Ashburner et al.,1998].
In general terms, this study revealed that gender differences were prominent in subjects over 50‐years of age and that the differences were seen mainly in the frontal structures. This may result from gender effects on structural alterations with aging. In one ROI study comparing older and younger age groups, the rate of reduction of cortex from younger to older age in the right frontal lobe was significantly higher in males [Xu et al.,2000].
Frontal predominance in females has been shown in other contexts. Cowell et al. [1994] reported that frontal and temporal lobe decreases were seen in men only. Furthermore, Jill et al. found that the frontal lobe increase was significantly larger in females than in males, which is homologous with changes identified in animal studies showing a greater level of estrogen receptors [Goldstein et al.,2001]. Therefore, one possible explanation is that the difference in estrogen levels between males and females affects these regions functionally and structurally, as seen in the frontal cortex of the brain. An MRI study also supports our results; females showed greater activation than males in the dorsolateral prefrontal cortex, whereas males showed higher activity in the precuneus in the Tower of London task [Boghi et al.,2006].
Abnormalities have been shown in the anterior cingulate and thalamus of autistic patients [Haznedar et al.,2006; Tsatsanis et al.,2003; Waiter et al.,2004]. Although the cause of autism is still unknown, it is typically described as an exaggeration of the male brain. Our data suggests that frontal gray matter dominance is present in females.
The present study also demonstrated that the hypothalamus was larger in older females. There have been some conflicting results concerning gender differences in the hypothalamus. Previous ROI analyses found that males had a larger volume in the hypothalamus [Allen et al.,1989; Swaab and Fliers,1985]. However, a PET study suggested that glucose metabolism in the hypothalamus was significantly higher in females than in males [Kawachi et al.,2002]. One potential factor is alteration of the hypothalamus with aging. A postmortem study documented that major cell reduction in the sexually dimorphic nucleus of the preoptic area [Gorski et al.,1978] was observed between the ages of 50 and 60 years, whereas cell death was seen at the age of 70 years and over in females [Swaab et al.,2001]. In this study, a significant decrease in gray matter concentration in males compared with females was found only in comparisons of subjects over 50 years of age. Differences in the cell loss of the hypothalamus with aging might explain our results.
This study demonstrated that in males, gray matter concentration in posterior parts of the cortex, including the occipital lobes, parieto‐occipital cortex, and fusiform gyrus, was greater than that in females in the same regions. An earlier ROI study [Xu et al.,2000] and a more recent study using tensor‐based morphometry [Brun et al.,2009] are in agreement with our findings. Interestingly, the latter study found greater occipital gray matter volume in the left side of the brain; this laterality is consistent with the present study. The widespread leftward asymmetry in males brain has also been documented in a previous study [Gur et al.,1999]. Good et al. [2001a] found leftward asymmetry in the posterior temporal regions. This asymmetry might cause the greater gray matter concentration observed in the leftward dominant occipital cortex in males. However, we should note that gray matter volume asymmetry across the cortex has not yet been established.
With regard to sex hormones, Lessov‐Schlaggar et al. [2005] demonstrated by measuring brain morphology in 280 aged male twins that the volume of the occipital lobe was associated with sex hormones, indicating a significant negative correlation between higher estradiol and estrone concentrations and occipital lobe volumes and a positive correlation between testosterone concentration and total brain volumes.
Other studies using various modalities have shown male dominance in visuo‐spatial function in relation to the parieto‐occipital lobe. Boghi et al. [2006] reported that males showed higher activity in the precuneus on the Tower of London task; they concluded that males rely more on visuo‐spatial abilities, whereas females rely more on executive processing. Levin et al. [1998] examined gender differences in response to photic stimulation and found that the primary visual cortex was more activated in males than in females. Two animal studies may explain possible mechanisms by which sex hormones functionally and structurally affect the occipital lobe in males. In one study, androgens were shown to reduce cell death in the developing rat visual cortex [Nunez et al.,2000]. In another study [Nunez et al.,2003], it was revealed that the level of androgen receptor (AR) expression was specific to the cortical region, with a higher androgen immunoreactive cell density and more AR mRNA in the occipital lobe than in the cingulate cortex and frontal lobe. This study also indicated that males had a higher AR immunoreactive cell density and more AR mRNA in the occipital lobe than did females. However, in humans, occipital dominance in males has not been sufficiently determined in previous studies compared with frontal dominance in females. These results need to be replicated in future studies.
In this study, gender differences were most prominent in the over 50‐year‐old groups. Although our results primarily emphasized the morphometric gender differences in the older groups, functional gender differences in adolescence have also been reported in a number of studies [Kimura,2002; Peters et al.,2007]. Estrogen concentrations reach a peak at adolescence and are reduced by the time of menopause. Our data suggest that hormonal effects occur after the reduction of estrogen concentration. The estrogen concentration during mid‐life may affect the reduction of gray matter in older age, but this hypothesis requires further hormonal evidence. In this study, we were not able to collect the necessary information regarding menopausal state and sex hormone concentrations required to examine the correlation between sex hormones and gray matter concentration. Our findings, therefore, may be influenced by menopausal state as well as by aging. In these respects, further studies are needed to confirm our results.
Limitations of this study arise from the VBM methodological approach. The major problem is the registration error of the atrophied brain to the standard template brain in SPM [Bookstein,2001]. This effect is seen mainly in the area close to the ventricles, such as the insula cortex and the thalamus and is caused by the expansion of the CSF regions accompanying aging [Allen et al.,2005]. It should be noted that some of the regions detected in this study are very close to the ventricles, as can be seen in the Figures. However, this study suggests that, if errors actually occurred in the significantly detected regions, there would be gender differences in the errors related to the detected regions.
Further, we were not able to eliminate the effects of brain size, because our study included subjects belonging to a wide range of age groups. It was difficult to eliminate the effects of aging on the decrease in the concentration of gray matter and of the brain size on the regional gray‐matter concentration. Studies involving comparisons between a large number of subjects belonging to the same age group are necessary to complement our results.
In addition, the number of middle‐aged subjects was relatively small. This could weaken the statistical power of the gender comparisons in this age group. Larger numbers of subjects in this age group will be needed for additional studies in the future.
CONCLUSION
This study showed a consistent gender difference in older groups of subjects. Gray matter concentration in the frontal regions was retained more in aged females, whereas gray matter concentration in the occipital regions was retained, to a greater extent, in aged males. Our findings are consistent with biologically established gender differences and suggest the possibility of connecting morphometric studies with biological studies.
REFERENCES
- Allen JS, Bruss J, Brown C, Damasio H ( 2005): Methods for studying the aging brain: Volumetric analyses versus VBM. Neurobiol Aging 26: 1275–1278. [Google Scholar]
- Allen LS, Hines M, Shryne JE, Gorski RA ( 1989): Two sexually dimorphic cell groups in the human brain. J Neurosci 9: 497–506. [DOI] [PMC free article] [PubMed] [Google Scholar]
- Ankney CD ( 1992): Differences in brain size. Nature 358: 532. [DOI] [PubMed] [Google Scholar]
- Ashburner J, Friston KJ. ( 2000): Voxel‐based morphometry—The methods. Neuroimage 11( 6 Part 1): 805–821. [DOI] [PubMed] [Google Scholar]
- Ashburner J, Hutton C, Frackowiak R, Johnsrude I, Price C, Friston K ( 1998): Identifying global anatomical differences: Deformation‐based morphometry. Hum Brain Mapp 6: 348–357. [DOI] [PMC free article] [PubMed] [Google Scholar]
- Boccardi M, Ghidoni R, Govoni S, Testa C, Benussi L, Bonetti M, Binetti G, Frisoni GB ( 2006): Effects of hormone therapy on brain morphology of healthy postmenopausal women: A voxel‐based morphometry study. Menopause 13: 584–591. [DOI] [PubMed] [Google Scholar]
- Boghi A, Rasetti R, Avidano F, Manzone C, Orsi L, D'Agata F, Caroppo P, Bergui M, Rocca P, Pulvirenti L, Bradac GB, Bogetto F, Mutani R, Mortara P. ( 2006): The effect of gender on planning: An fMRI study using the Tower of London task. Neuroimage 33: 999–1010. [DOI] [PubMed] [Google Scholar]
- Bookstein FL ( 2001): “Voxel‐based morphometry” should not be used with imperfectly registered images. Neuroimage 14: 1454–1462. [DOI] [PubMed] [Google Scholar]
- Brun CC, Lepore N, Luders E, Chou YY, Madsen SK, Toga AW, Thompson PM ( 2009): Sex differences in brain structure in auditory and cingulate regions. Neuroreport 20: 930–935. [DOI] [PMC free article] [PubMed] [Google Scholar]
- Chen X, Sachdev PS, Wen W, Anstey KJ ( 2007): Sex differences in regional gray matter in healthy individuals aged 44–48 years: A voxel‐based morphometric study. Neuroimage 36: 691–699. [DOI] [PubMed] [Google Scholar]
- Cowell PE, Turetsky BI, Gur RC, Grossman RI, Shtasel DL, Gur RE ( 1994): Sex differences in aging of the human frontal and temporal lobes. J Neurosci 14: 4748–4755. [DOI] [PMC free article] [PubMed] [Google Scholar]
- Escalona PR, McDonald WM, Doraiswamy PM, Boyko OB, Husain MM, Figiel GS, Laskowitz D, Ellinwood EH Jr, Krishnan KR ( 1991): In vivo stereological assessment of human cerebellar volume: Effects of gender and age. AJNR Am J Neuroradiol 12: 927–929. [PMC free article] [PubMed] [Google Scholar]
- Filipek PA, Richelme C, Kennedy DN, Caviness VS Jr ( 1994): The young adult human brain: An MRI‐based morphometric analysis. Cereb Cortex 4: 344–360. [DOI] [PubMed] [Google Scholar]
- Giedd JN, Castellanos FX, Rajapakse JC, Vaituzis AC, Rapoport JL ( 1997): Sexual dimorphism of the developing human brain. Prog Neuropsychopharmacol Biol Psychiatry 21: 1185–1201. [DOI] [PubMed] [Google Scholar]
- Goldstein JM, Seidman LJ, Horton NJ, Makris N, Kennedy DN, Caviness VS Jr, Faraone SV, Tsuang MT ( 2001): Normal sexual dimorphism of the adult human brain assessed by in vivo magnetic resonance imaging. Cereb Cortex 11: 490–497. [DOI] [PubMed] [Google Scholar]
- Good CD, Johnsrude I, Ashburner J, Henson RN, Friston KJ, Frackowiak RS ( 2001a) Cerebral asymmetry and the effects of sex and handedness on brain structure: A voxel‐based morphometric analysis of 465 normal adult human brains. Neuroimage 14: 685–700. [DOI] [PubMed] [Google Scholar]
- Good CD, Johnsrude IS, Ashburner J, Henson RN, Friston KJ, Frackowiak RS. ( 2001b): A voxel‐based morphometric study of ageing in 465 normal adult human brains. Neuroimage 14( 1 Part 1): 21–36. [DOI] [PubMed] [Google Scholar]
- Gorski RA, Gordon JH, Shryne JE, Southam AM ( 1978): Evidence for a morphological sex difference within the medial preoptic area of the rat brain. Brain Res 148: 333–346. [DOI] [PubMed] [Google Scholar]
- Gur RC, Turetsky BI, Matsui M, Yan M, Bilker W, Hughett P, Gur RE ( 1999): Sex differences in brain gray and white matter in healthy young adults: Correlations with cognitive performance. J Neurosci 19: 4065–4072. [DOI] [PMC free article] [PubMed] [Google Scholar]
- Harasty J, Double KL, Halliday GM, Kril JJ, McRitchie DA ( 1997): Language‐associated cortical regions are proportionally larger in the female brain. Arch Neurol 54: 171–176. [DOI] [PubMed] [Google Scholar]
- Haznedar MM, Buchsbaum MS, Hazlett EA, LiCalzi EM, Cartwright C, Hollander E ( 2006): Volumetric analysis and three‐dimensional glucose metabolic mapping of the striatum and thalamus in patients with autism spectrum disorders. Am J Psychiatry 163: 1252–1263. [DOI] [PubMed] [Google Scholar]
- Kawachi T, Ishii K, Sakamoto S, Matsui M, Mori T, Sasaki M ( 2002): Gender differences in cerebral glucose metabolism: A PET study. J Neurol Sci 199: 79–83. [DOI] [PubMed] [Google Scholar]
- Kimura D ( 2002): Sex hormones influence human cognitive pattern. Neuro Endocrinol Lett 23( Suppl 4): 67–77. [PubMed] [Google Scholar]
- Lessov‐Schlaggar CN, Reed T, Swan GE, Krasnow RE, DeCarli C, Marcus R, Holloway L, Wolf PA, Carmelli D ( 2005): Association of sex steroid hormones with brain morphology and cognition in healthy elderly men. Neurology 65: 1591–1596. [DOI] [PubMed] [Google Scholar]
- Levin JM, Ross MH, Mendelson JH, Mello NK, Cohen BM, Renshaw PF ( 1998): Sex differences in blood‐oxygenation‐level‐dependent functional MRI with primary visual stimulation. Am J Psychiatry 155: 434–436. [DOI] [PubMed] [Google Scholar]
- Luders E, Steinmetz H, Jancke L ( 2002): Brain size and grey matter volume in the healthy human brain. Neuroreport 13: 2371–2374. [DOI] [PubMed] [Google Scholar]
- Luders E, Narr KL, Thompson PM, Rex DE, Jancke L, Steinmetz H, Toga AW ( 2004): Gender differences in cortical complexity. Nat Neurosci 7: 799–800. [DOI] [PubMed] [Google Scholar]
- Luders E, Narr KL, Thompson PM, Woods RP, Rex DE, Jancke L, Steinmetz H, Toga AW ( 2005): Mapping cortical gray matter in the young adult brain: Effects of gender. Neuroimage 26: 493–501. [DOI] [PubMed] [Google Scholar]
- Murphy DG, DeCarli C, McIntosh AR, Daly E, Mentis MJ, Pietrini P, Szczepanik J, Schapiro MB, Grady CL, Horwitz B, Rapoport SI. ( 1996): Sex differences in human brain morphometry and metabolism: An in vivo quantitative magnetic resonance imaging and positron emission tomography study on the effect of aging. Arch Gen Psychiatry 53: 585–594. [DOI] [PubMed] [Google Scholar]
- Nopoulos P, Flaum M, O'Leary D, Andreasen NC ( 2000): Sexual dimorphism in the human brain: Evaluation of tissue volume, tissue composition and surface anatomy using magnetic resonance imaging. Psychiatry Res 98: 1–13. [DOI] [PubMed] [Google Scholar]
- Nunez JL, Jurgens HA, Juraska JM ( 2000): Androgens reduce cell death in the developing rat visual cortex. Brain Res Dev Brain Res 125: 83–88. [DOI] [PubMed] [Google Scholar]
- Nunez JL, Huppenbauer CB, McAbee MD, Juraska JM, DonCarlos LL ( 2003): Androgen receptor expression in the developing male and female rat visual and prefrontal cortex. J Neurobiol 56: 293–302. [DOI] [PubMed] [Google Scholar]
- Paus T, Otaky N, Caramanos Z, MacDonald D, Zijdenbos A, D'Avirro D, Gutmans D, Holmes C, Tomaiuolo F, Evans AC ( 1996): In vivo morphometry of the intrasulcal gray matter in the human cingulate, paracingulate, and superior‐rostral sulci: Hemispheric asymmetries, gender differences and probability maps. J Comp Neurol 376: 664–673. [DOI] [PubMed] [Google Scholar]
- Peters M, Manning JT, Reimers S ( 2007): The effects of sex, sexual orientation, and digit ratio (2D:4D) on mental rotation performance. Arch Sex Behav 36: 251–260. [DOI] [PubMed] [Google Scholar]
- Raz N, Gunning‐Dixon F, Head D, Williamson A, Acker JD ( 2001): Age and sex differences in the cerebellum and the ventral pons: A prospective MR study of healthy adults. AJNR Am J Neuroradiol 22: 1161–1177. [PMC free article] [PubMed] [Google Scholar]
- Sato K, Taki Y, Fukuda H, Kawashima R ( 2003): Neuroanatomical database of normal Japanese brains. Neural Netw 16: 1301–1310. [DOI] [PubMed] [Google Scholar]
- Schlaepfer TE, Harris GJ, Tien AY, Peng L, Lee S, Pearlson GD ( 1995): Structural differences in the cerebral cortex of healthy female and male subjects: A magnetic resonance imaging study. Psychiatry Res 61: 129–135. [DOI] [PubMed] [Google Scholar]
- Smith CD, Chebrolu H, Wekstein DR, Schmitt FA, Markesbery WR. ( 2006): Age and gender effects on human brain anatomy: A voxel‐based morphometric study in healthy elderly. Neurobiol Aging 28: 1075–1087. [DOI] [PubMed] [Google Scholar]
- Swaab DF, Fliers E ( 1985): A sexually dimorphic nucleus in the human brain. Science 228: 1112–1115. [DOI] [PubMed] [Google Scholar]
- Swaab DF, Chung WC, Kruijver FP, Hofman MA, Ishunina TA ( 2001): Structural and functional sex differences in the human hypothalamus. Horm Behav 40: 93–98. [DOI] [PubMed] [Google Scholar]
- Tisserand DJ, van Boxtel MP, Pruessner JC, Hofman P, Evans AC, Jolles J ( 2004): A voxel‐based morphometric study to determine individual differences in gray matter density associated with age and cognitive change over time. Cereb Cortex 14: 966–973. [DOI] [PubMed] [Google Scholar]
- Tsatsanis KD, Rourke BP, Klin A, Volkmar FR, Cicchetti D, Schultz RT ( 2003): Reduced thalamic volume in high‐functioning individuals with autism. Biol Psychiatry 53: 121–129. [DOI] [PubMed] [Google Scholar]
- Waiter GD, Williams JH, Murray AD, Gilchrist A, Perrett DI, Whiten A ( 2004): A voxel‐based investigation of brain structure in male adolescents with autistic spectrum disorder. Neuroimage 22: 619–625. [DOI] [PubMed] [Google Scholar]
- Witelson SF, Glezer, II , Kigar DL ( 1995): Women have greater density of neurons in posterior temporal cortex. J Neurosci 15( 5 Part 1): 3418–3428. [DOI] [PMC free article] [PubMed] [Google Scholar]
- Xu J, Kobayashi S, Yamaguchi S, Iijima K, Okada K, Yamashita K ( 2000): Gender effects on age‐related changes in brain structure. AJNR Am J Neuroradiol 21: 112–118. [PMC free article] [PubMed] [Google Scholar]