

Abstract
Increases in peripheral cytokines during acute inflammation may affect various neuropsychological functions. The aim of this functional magnetic resonance imaging (fMRI) study was to investigate the effects of acute endotoxemia on mood and the neural response to emotionally aversive visual stimuli in healthy human subjects. In a double‐blind, randomized crossover study, 18 healthy males received a bolus injection of bacterial lipopolysaccharide (LPS; 0.4 ng/kg) or saline. Plasma levels of pro‐ and anti‐inflammatory cytokines and cortisol as well as mood ratings were analyzed together with the blood‐oxygen‐level dependent (BOLD) response during the presentation of aversive versus neutral pictures. Endotoxin administration induced pronounced transient increases in plasma levels of TNF‐α, IL‐1ra, IL‐6, IL‐10, and cortisol. Positive mood was decreased and state anxiety increased. In addition, activation of right inferior orbitofrontal cortex (OFC) in response to emotional visual stimuli was significantly increased in the LPS condition. Increased prefrontal activation during the presentation of emotional material may reflect enhanced cognitive regulation of emotions as an adaptive response during an acute inflammation. These findings may have implications for the putative role of inflammatory processes in the pathophysiology of depression. Hum Brain Mapp 34:2217–2227, 2013. © 2012 Wiley Periodicals, Inc.
Keywords: cytokines, endotoxin, emotional processing, fMRI, sickness behavior, peripheral inflammation
INTRODUCTION
Systemic inflammation including the release of inflammatory cytokines is discussed to be involved in the pathophysiology of depression [Irwin and Miller, 2007; Miller et al., 2009; Raison et al., 2006]. Given the relevance of disturbed neural processing of emotions in the pathophysiology of affective disorders including depression [Leppanen, 2006; Phillips et al., 2003b], more knowledge about the neural basis of inflammation‐mediated changes in emotional processing is needed.
The administration of endotoxin (lipopolysaccharide, LPS), a complex glycolipid found in the outer membrane of gram‐negative bacteria, constitutes an established experimental model to study the effects of an acute systemic inflammatory response on physiological and psychological functions in animals as well as humans. Physiological effects of LPS‐administration are well‐characterized and include transient increases in body temperature, release of pro‐ and anti‐inflammatory cytokines (e.g., TNF‐α, Il‐6, IL‐10) by activated immune cells, and activation of the hypothalamic‐pituitary‐adrenal (HPA) axis, depending on the specific type of endotoxin and dose utilized [Bahador and Cross, 2007]. This complex physiological response is associated with behavioral changes, collectively termed “sickness behavior,” characterized by increased anxiety, reduced exploration, impaired cognitive abilities and social withdrawal in experimental animals [Dantzer et al., 2008; Engler et al., 2011; Murray et al., 2012; Sparkman et al., 2006]. In humans, endotoxin‐induced mood impairment, anorexia, and cognitive deficits have been described, indicating that endotoxin administration may constitute an experimental model to analyze the role of innate immune system activation in some aspects of human depression [DellaGioia and Hannestad, 2010].
Employing functional magnetic resonance imaging (fMRI), previous studies have assessed effects of peripheral immune activation induced by endotoxin on neural responses in a reward paradigm [Eisenberger et al., 2010a] and during a social exclusion task [Eisenberger et al., 2009]. However, effects of endotoxin‐induced peripheral immune activation on the neural processing of emotional stimuli remain incompletely understood. The only existing brain imaging study which has specifically addressed the neural processing of emotions (i.e., an implicit emotional face perception task) employed the typhoid vaccination model which did not evoke systemic increases in the pro‐inflammatory cytokines TNF‐α and IL‐1β [Harrison et al., 2009] which are known to play a key role in sickness behavior [Dantzer et al., 2008].
To investigate the neural basis of inflammation‐mediated changes in emotional processing, we conducted a fMRI study to assess the effects of endotoxin administration on emotion processing in healthy humans. By implementing a double‐blind, randomized crossover study with an injection of LPS or saline, we aimed to test the hypothesis that endotoxin‐induced peripheral inflammation alters the neural response to emotional stimuli in specific regions of interest (ROIs) including the medial prefrontal and orbitofrontal regions, amygdala, hippocampus, fusiform gyrus, temporal gyrus and occipital areas known to be involved in emotional processing.
METHODS AND MATERIALS
Recruitment and Screening Process
Eighteen healthy, right‐handed male volunteers were recruited by public advertisement (i.e., flyers posted at the University Hospital Essen; internet‐posted advertisements). The in‐depth screening process consisted of a physical examination, a personal semistructured interview performed by an experienced clinical psychologist, completion of standardized questionnaires and repeated laboratory analyses of blood samples (i.e., complete blood cell count, liver enzymes, renal parameters, electrolytes, coagulation factors, C‐reactive protein) prior to and up to 1 week following completion of the study (see below). Exclusion criteria included age <18 or >40 years, BMI <17 and >30, any concurrent medical condition, including neurological, psychiatric, cardiovascular, immunological, endocrine conditions, any abnormality of blood laboratory analyses, any evidence of structural brain abnormality upon structural MRI scan; MRI‐specific exclusion criteria (i.e., phobic anxiety, claustrophobia, ferromagnetic implantations), history of allergies, current use of prescription and nonprescription medications, smoking, regular high alcohol use (>4 drinks per week).
Additional safety measures included a physical examination and normal blood cell counts 6 h postinjection as a precondition for subjects being allowed to leave the laboratory. Further, participants were not allowed to drive a vehicle on the days of the study, and underwent follow‐up examinations including laboratory analysis of CRP levels 24 h after each session and 7 days after the final session. Subjects were informed about the study design, and were only enrolled after written informed consent had been obtained. The study was conducted in accordance with the declaration of Helsinki and approved by the local Ethics committee. Subjects were paid for their participation.
Study Design
The study employed a balanced, randomized, double‐blind crossover design and consisted of two identical study sessions (at least 7 days apart) during which blood samples and mood rating were obtained at multiple time points (Fig. 1). Subjects received either an intravenous injection of lipopolysaccharide (0.4 ng per kilogram of body weight) or an identical volume of endotoxin‐free saline (placebo) as previously described, [Grigoleit et al., 2010]. Two hours postinjection, when proinflammatory cytokines have been shown to peak after LPS application [Eisenberger et al., 2010b; Grigoleit et al., 2010; Reichenberg et al., 2001], participants underwent structural MRI scanning followed by a fMRI session, consisting of a visual stimulation and an emotion processing task. In addition, subjects underwent a fMRI task assessing social cognition, which will be reported elsewhere. Blood samples were drawn 0.25 h before and 1, 1.75, 3, 4, 6, and 24 h postinjection together with assessments of vital signs (blood pressure, pulse, temperature). Participants also completed mood questionnaires at baseline (−0.25 h) and twice postinjection (3 and 6 h).
Figure 1.
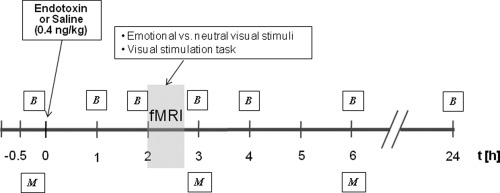
Time schedule of the experimental sessions. Subjects received either endotoxin or placebo on the first study session. B = blood samples for analysis of cortisol and cytokine (IL‐6, IL‐1ra, IL‐10, and TNF‐α) plasma concentrations and record of vital signs and M = mood questionnaires. During fMRI scanning, subjects underwent a visual stimulation task and were asked to look at alternating emotional and neutral visual stimuli.
Procedures
Each study session lasted 7 h starting at 12:00 pm. After arriving at the laboratory, an intravenous cannula was inserted into an antecubital forearm vein for repeated blood sampling and bolus drug injection (LPS or saline). Lipopolysaccharide from Escherichia coli (United States Pharmacopeia, Lot G3E069) was prepared for use in humans by dissolving the lyophilisate in sterile water, filtration through a 0.2‐μm membrane, and a microbial safety testing routine approved by the German Federal Agency for Sera and Vaccines (Paul Ehrlich Institute, Langen, Germany), as previously described [Grigoleit et al., 2010]. Until use, the LPS solution was stored in endotoxin‐free borosilicate tubes at −20°C. The injection of LPS or saline occurred thirty minutes after cannula insertion at 1:00 pm. Participants stayed at the laboratory until 6 h postinjection, and returned 24 h after each session for a medical check‐up.
fMRI Paradigms
Subjects completed two visual fMRI paradigms. First, to exclude a possible perturbation of systemic inflammation on visual neurovascular coupling, a simple visual stimulation task was implemented, which is known to induce potent BOLD responses in striate and extrastriate visual cortices (BA17, BA18) [DeYoe et al., 1996; Engel et al., 1997]. We utilized a task involving the intermittent presentation of a high‐contrast flickering black and white checkerboard stimulus (on) vs. a black screen (off) (10° × 15° FOV, 4Hz). The stimulus was presented in alternating blocks of 31 s on and 31 s off. A total of 4 on blocks and 4 off blocks were presented. Subjects were asked to focus on a central red fixation point, ensuring that their attention was on the center of the screen.
Subsequently, the emotional stimulation paradigm was implemented during which subjects focused on alternating neutral and emotionally evocative visual stimuli drawn from the International Affective Picture System (IAPS) [Lang, 1997]. Two different sets of 36 emotional pictures with aversive contents, such as facial mutilation, wounds, dead bodies and 36 neutral pictures, such as furniture, appliance, which did not elicit strong emotions, were selected. On the basis of published ratings [Lang, 1997], these sets were comparable with respect to the dimensions valence, arousal and dominance. Each dimension was assessed with the Self‐Assessment Manikin (SAM), an affective rating system devised by Lang 1980, employing a 9‐point rating scale with “9” representing a high rating and “1” a low rating on each dimension. Hence, the emotional sets induced arousal (Set 1: valence 2.29 ± 1.53, arousal 6.44 ± 2.19, dominance 3.27 ± 2.15; Set 2: valence 2.33 ± 1.5, arousal 6.41 ± 2.21, dominance 3.28 ± 2.18; mean ratings ± SD) whereas the neutral sets induced minimal arousal (Set 1: valence 5.41 ± 1.28, arousal 3 ± 2, dominance 6.1 ± 2; Set 2: valence 5.56 ± 1.38, arousal 2.98 ± 2.06, dominance 6.04 ± 2.04; mean ratings ± SD). To avoid any nonrandom version‐dependent bias, the stimuli were presented in random order in each block for each subject. All presentations started with an off block. A total of 6 off blocks (each 6 neutral stimuli) and 6 on blocks (each 6 emotional stimuli) were presented. Each picture appeared for 5 s. Thus, each block lasted 30 s. Subjects were instructed not to look away or distract themselves with irrelevant thoughts.
fMRI Acquisition and Analysis
All MR images were acquired using a 1.5 T MR (Sonata; Siemens, Erlangen, Germany) with a standard head coil. A 3D FLASH sequence (TR 9.2 ms, TE 4.46 ms, flip angle 30°, FOV 240 mm, matrix 256 × 256, slice‐thickness 1.5 mm) was acquired for individual coregistration of functional and structural images. BOLD contrast fMRI images were acquired using an echo‐planar technique (TR 3.1 s, TE 50 ms, flip angle 90°, FOV 240 mm, matrix 64 × 64) with 36 transverse slices with a thickness of 3‐mm and 0.3‐mm slice gap.
For data analysis, SPM 05 software (Wellcome Department of Cognitive Neurology, London, UK) was used. Prior to statistical analysis, three “dummy” scans were eliminated to account for T1 relaxation effects and images were realigned utilizing since interpolation and normalized to the standard stereotactic space corresponding to the template from the Montreal Neurological Institute (http://www.mrc-cbu.cam.ac.uk/Imaging/mnispace.html). Bilinear interpolation was applied for normalization. The images were smoothed with an isotropic Gaussian kernel of 9 mm. High‐pass filtering with a cut‐off period of 120 s and low‐pass filtering with the hrf were applied. A voxel‐by‐voxel comparison according to the general linear model was used to calculate differences in activation between the active and resting conditions. For each subject, the first level design matrix included a 2 × 2 factorial design with the factors “on and off condition” for the emotional processing task [emotional pictures (emotional); neutral pictures (neutral)] as well as for the visual stimulation task [flickering black and white checkerboard (flickering); black screen (black)] and “treatment condition” (LPS, placebo). All regressors were obtained by convolving a box‐car function of the event duration with the canonical hemodynamic response function implemented in SPM. Specific effects were tested with appropriate linear contrasts of the parameter estimates for the different regressors resulting in a t‐statistic for each voxel. After model estimation, the ensuing first‐level contrast images (LPSemotional > LPSneutral; placeboemotional > placeboneutral) from each subject were used for second‐level analysis treating individual subjects as a random factor and including nonsphericity correction. Three separate analyses were conducted on the second (group) level: (1) As an initial step, we performed a one‐sample t‐test on data from the placebo condition to confirm activation in regions of interest (ROIs) during emotion processing. (2) To directly compare brain activation in the LPS condition and the placebo condition, paired t‐tests were computed for the general effect of inflammation on neurovascular coupling during the visual stimulation task (LPSflickering>black > placeboflickering>black; placeboflickering>black > LPSflickering>black) and for emotion processing (LPSemotional>neutral > placeboemotional > neutral; placeboemotional > neutral>LPSemotional>neutral). (3) To clarify if changes in mood contribute to (or mediate) changes in activation in ROIs, peak mood scores were included as covariate of no interest in the one‐sample t‐test within the LPS condition.
Small volume correction (SVC) with familywise error (FWE) correction for multiple comparisons in specific a‐priori ROIs at a level of P < 0.05 was performed. ROI analysis was computed using Montreal Neurological Institute (MNI) coordinates reported in previous studies with comparable emotion processing paradigms. On the basis of previous studies using the presentation of alternating neutral and emotionally negative pictures these ROIs included the amygdala [−18, −3, −27; 21, −6, −18; (Stark et al., 2004)], hippocampus [30, −39, 3; (Stark et al., 2004)], fusiform gyrus [41, −55, −16; −41, −55, −18; (Simpson et al., 2000)], orbitofrontal gyrus [−45, 30, −21; 34, 24, −16; (Ochsner et al., 2004; Stark et al., 2004)], inferior frontal gyrus [45, 9, 33; 47, 33, 19; (Simpson et al., 2000; Stark et al., 2004)], occipital areas [−29, −93, −10; −43, −77, −7; 37, −90, 6; 15, −96, −1; (Simpson et al., 2000)] and temporal gyrus [45, 12, −21; −60, 0, −18; 37, −74, 18; (Simpson et al., 2000; Stark et al., 2004)]. Cortical regions were corrected using a sphere with a 15 mm radius, and subcortical regions were corrected using a sphere with a 10 mm radius, which were centered around the peak coordinates of the above mentioned studies to avoid the issue of circularity. Emotion‐related activations outside our areas of interest are reported if they reached a P‐value of < 0.001 uncorrected for the whole brain. All results are given as MNI coordinates.
Questionnaires
Mood was assessed with a validated German questionnaire (“Mehrdimensionaler Befindlichkeitsfragebogen”, MDBF), designed to estimate state emotions [Steyer, 1997]. The MDBF has twelve items and three subscales quantifying current mood, alertness and calmness, similar to the Profile of Mood States (POMS) [McNair, 1971]. In addition, trait and state anxiety was assessed by using the State‐Trait‐Anxiety Inventory (state version: STAI‐S; trait version: STAI‐T) [Laux, 1981] before and after administration of LPS and saline outside the scanner (−0.25 h, 3 h, 6 h).
Blood Cell Counts, Cytokines, and Cortisol
Total leukocyte numbers and a three‐part white blood cell differential count were assessed in EDTA‐treated blood samples using an automated hematology analyzer (KX‐21N, Sysmex Deutschland GmbH, Norderstedt, Germany). Plasma for the measurement of cytokine and cortisol levels was separated by centrifugation and stored at −80°C until analysis. Concentrations of plasma cytokines were analyzed using multiplexed bead‐based assays (Bio‐Plex Cytokine Assays, Bio‐Rad Laboratories GmbH, Munich, Germany) as recently described [Grigoleit et al., 2010]. Samples were prepared according to the manufacturer's instructions and were analyzed on a triple‐laser FACSCanto II flow cytometer using FACS‐Diva software (BD Immunocytometry Systems, Heidelberg, Germany). Absolute cytokine levels were calculated based on the mean fluorescence intensity of cytokine standard dilutions using a four‐parameter logistic model (GraphPad Prism 5, La Jolla, CA). Detection limits of the assays were 0.2 pg/ml (IL‐6), 0.4 pg/ml (IL‐10), 3 pg/ml (TNF‐α), and 39.9 pg/ml (IL‐1ra), respectively. Total plasma cortisol concentrations were measured with a commercial enzyme‐linked immunosorbent assay (Cortisol ELISA, IBL International, Hamburg, Germany) according to the manufacturer's instructions. Intra‐ and interassay variance were 5.6 and 8.8%, respectively.
Statistical Analysis (Non‐fMRI Data)
Absolute changes in psychological or biological variables following endotoxin vs. saline administration were analyzed with repeated measures analysis of variance (ANOVA). Only significant interactions (time x treatment) are presented unless indicated otherwise. These were followed by paired t‐test comparing endotoxin vs. placebo at specific time points. The alpha level was set at 0.05. All data are presented as mean and standard error of the mean (SEM), unless indicated otherwise.
RESULTS
Sociodemographic and Psychological Characteristics
Eighteen healthy, right‐handed male volunteers (mean age, 26.4 ± 3.1 years; mean BMI, 25.2 ± 0.2) completed the study. The majority were medical students (88%, n = 17), all were unmarried, all rated their overall health as either good or very good. Mean trait anxiety scores were well‐within the normal range (32.6 ± 1.0) compared with published normative data [Laux, 1981].
Immune and Endocrine Measures
Endotoxin administration induced a pronounced inflammatory response reflected by transient increases in pro‐ and anti‐inflammatory cytokines, circulating neutrophils, plasma cortisol levels, and body temperature. Plasma concentrations of the proinflammatory cytokines IL‐6 and TNF‐α increased significantly after LPS administration compared to saline injection (F(1, 23) = 30.7, P < 0.001 for IL‐6 and F(1, 25) = 13.62, P < 0.001 for TNF‐α; Fig. 2A,B). In addition, LPS injection resulted in significantly elevated plasma levels of the anti‐inflammatory cytokine IL‐10 (F(2, 31) = 25.65, P < 0.001; Fig. 2C) and the soluble IL‐1 receptor antagonist IL‐1ra (F(6, 102) = 21.01, P < 0.001; Fig. 2D).
Figure 2.
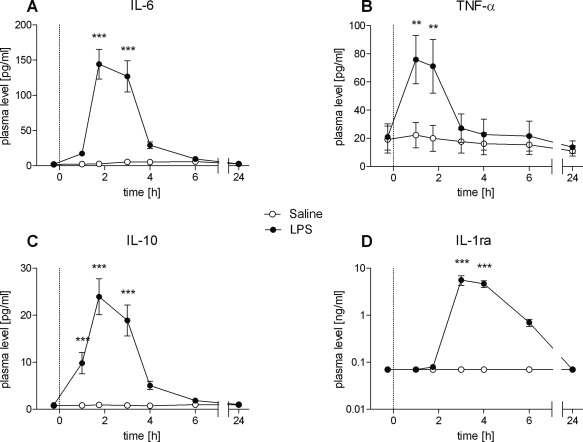
A–D: Temporal changes of plasma cytokine levels in healthy male subjects (n = 18) following bolus administration of 0.4 ng/kg endotoxin (LPS) or placebo (saline). Data are shown as mean ± SEM. Significant differences between treatments: *P < 0.05, **P < 0.01, ***P < 0.001.
The LPS condition was also characterized by a rapid and profound increase in the number of circulating neutrophils peaking 3 h post injection (F(3, 56) = 90.55, P < 0.001; Fig. 3A) as well as by a slight but significant increase in body temperature with a maximum of 37.7°C ± 0.08 (vs. 36.8°C ± 0.07 in the saline condition) at 3 h post injection (F(3, 54) = 16, P < 0.001; Fig. 3B). In addition, HPA‐axis activation was induced by LPS as reflected by a significant increase in plasma cortisol at 1.75 h to 6 h post‐injection (F(3, 44) = 20.67, P < 0.001; Fig. 3C). Subjective symptoms were assessed using a semistructured (verbal) interview every hour postinjection. Importantly, there were no differences in reported symptoms between the saline and the LPS condition, supporting that subjects were not aware of the condition (LPS or saline).
Figure 3.
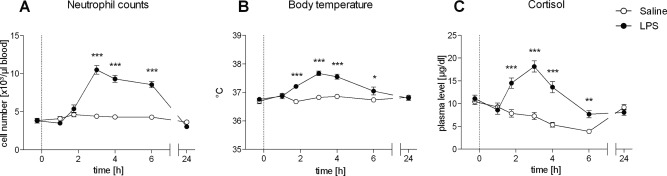
A–C: Numbers of circulating neutrophils, body temperature, and plasma cortisol levels in healthy male subjects (n = 18) following bolus administration of 0.4 ng/kg endotoxin (LPS) or placebo (saline). Data are shown as mean ± SEM. Significant differences between treatments: *P < 0.05, **P < 0.01, ***P < 0.001.
Psychological Responses to Endotoxin
The LPS condition was characterized by significantly impaired mood (F(1, 21) = 8.11, P < 0.01; Fig. 4A), alertness (F(2, 32) = 3.77, P < 0.05; Fig. 4B) and calmness (F(2, 32) = 9.56, P < 0.01; Fig. 4C) and increased state anxiety (F(2, 34) = 4.73, P < 0.05; Fig. 4D).
Figure 4.
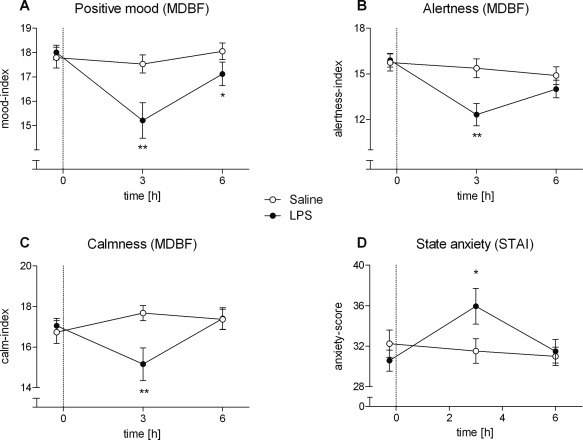
A–D: Results of the modified German version of the Profile of Mood States (MDBF) (A–C) and the State Anxiety (STAI‐S) questionnaires (D) in healthy male subjects (n = 18) following bolus administration of 0.4 ng/kg endotoxin (LPS) or placebo (saline). Data are shown as mean ± SEM. Significant differences between treatments: *P < 0.05, **P < 0.01, ***P < 0.001.
Neural Responses to Visual Stimulation Task and Emotional Pictures
To exclude general effects of inflammation on visual neurovascular coupling affecting visual perception during the emotion processing task, initially a visual stimulation task was implemented. No significant activation in the LPSflickering>black > placeboflickering>black contrast as well as in the placeboflickering>black > LPSflickering>black contrast were found, indicating no general effect of inflammation on the general visual processing.
To confirm previous fMRI findings with regard to brain areas mediating the processing of emotional visual stimuli, we subsequently conducted a one‐sample t‐test for the presentation of emotional vs. neutral visual stimuli within the placebo condition. As predicted, emotionally salient pictures activated the amygdala, hippocampus, fusiform gyrus, inferior frontal gyrus, inferior orbitofrontal cortex, occipital cortex, and temporal gyrus compared with neutral pictures (P < 0.05 based on ROI analysis using SVC with FWE correction, Table 1).
Table 1.
Neural activation during the presentation of emotional vs. neutral visual stimuli
| Regions of interest | MNI coordinates for emotional > neutral pictures, placebo condition | ||||
|---|---|---|---|---|---|
| H | x | y | z | t‐value | |
| Amygdala | L | –22 | –6 | –18 | 7.43 |
| Amygdala | R | 22 | –6 | –18 | 6.83 |
| Hippocampus | R | 22 | –30 | –4 | 5.65 |
| Fusiform gyrus | R | 44 | –46 | –20 | 13.81 |
| Fusiform gyrus | L | –42 | –46 | –18 | 12.06 |
| Inferior orbitofrontal cortex | L | –32 | 26 | –22 | 5.05 |
| Inferior orbitofrontal cortex | R | 34 | 32 | –22 | 4.61 |
| Inferior frontal gyrus | R | 42 | 18 | 22 | 4.50 |
| Inferior frontal gyrus | R | 56 | 38 | 6 | 5.49 |
| Inferior occipital gyrus | L | –36 | –92 | –16 | 10.42 |
| Inferior occipital gyrus | L | –44 | –88 | –6 | 8.70 |
| Middle occipital gyrus | R | 40 | –80 | –4 | 10.05 |
| Middle occipital gyrus | R | 28 | –92 | –4 | 5.00 |
| Superior temporal gyrus | R | 36 | 18 | –30 | 6.07 |
| Middle temporal gyrus | L | –64 | –4 | –14 | 5.44 |
| Middle temporal gyrus | R | 46 | –70 | 8 | 9.38 |
H, Hemisphere with activation; R, right asymmetrical activation; L, left asymmetrical activation; one‐sample t‐test for emotional > neutral pictures during placebo condition (n = 18). All P < 0.05 based on ROI analysis using SVC with FWE correction.
Finally, to assess effects of endotoxin administration, analysis of the LPSemotional>neutral > placeboemotional>neutral contrast was performed. Results demonstrated an enhanced activation of the right inferior orbitofrontal cortex (P < 0.05 based on ROI analysis using SVC with FWE correction, Table II, Fig. 5) during presentation of emotional stimuli. Moreover, whole‐brain analysis revealed greater activation of the left orbitofrontal gyrus, left medial and right superior frontal gyrus, left and right middle temporal gyrus, left hypothalamus, right supramarginal gyrus, left parietal lobule as well as the left middle occipital gyrus (P < 0.001, uncorrected) (Table 2, Fig. 5) in the LPSemotional>neutral > placeboemotional>neutral contrast. The placeboemotional>neutral > LPSemotional>neutral contrast within the ROI and whole brain analysis revealed no significant activations.
Figure 5.
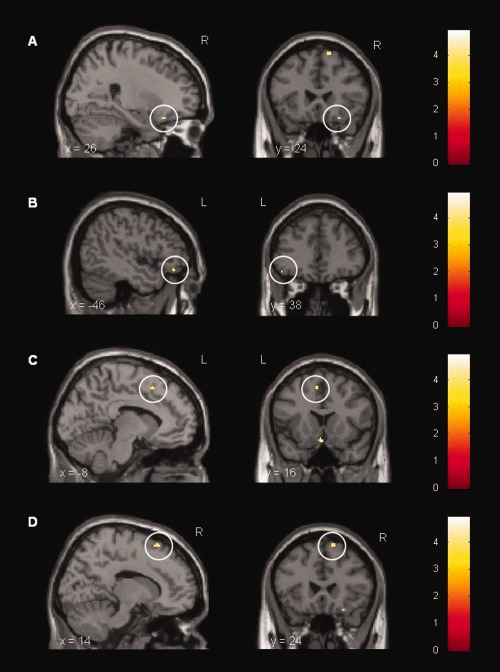
Cortical activation during the presentation of emotional vs. neutral visual stimuli. Paired t‐test computed for the LPSemotional>neutral > placeboemotional>neutral condition. LPS‐treated subjects displayed a stronger activation in (A) right inferior orbitofrontal gyrus ([26, 24, −20], t = 4.39, P < 0.05 based on ROI analysis using SVC with FWE correction), (B) left inferior orbitofrontal gyrus ([−46, 38, −14], t = 3.68, P < 0.001, uncorr.), (C) left medial frontal gyrus ([−8, 16, 50], t = 3.91, P < 0.001, uncorr.), and (D) right superior frontal gyrus ([14, 24, 62], t = 4.16, P < 0.001, uncorr.) after administration of 0.4 ng/kg E. coli endotoxin (n = 18).
Table 2.
Neural activation during the presentation of emotional vs. neutral visual stimuli
| Brain areas | MNI coordinates for LPSemotional>neutral > placeboemotional>neutral | ||||
|---|---|---|---|---|---|
| H | x | y | z | t‐value | |
| Inferior orbitofrontal gyrus | L | –46 | 38 | –14 | 3.68 |
| Inferior orbitofrontal gyrus | R | 26 | 24 | –20 | 4.39* |
| Hypothalamus | L | –2 | 16 | –16 | 4.34 |
| Medial frontal gyrus | L | –8 | 16 | 50 | 3.91 |
| Superior frontal gyrus | R | 14 | 24 | 62 | 4.16 |
| Middle temporal gyrus | L | –61 | –42 | –1 | 3.64 |
| Middle temporal gyrus | R | 66 | –36 | –6 | 3.84 |
| Supramarginal gyrus | R | 38 | –56 | 28 | 4.29 |
| Parietal lobule | L | –30 | –60 | 34 | 3.66 |
| Middle occipital gyrus | L | –28 | –60 | 36 | 3.84 |
H, hemisphere with activation; R, right asymmetrical activation; L, left asymmetrical activation; paired t‐test for LPSemotional>neutral > placeboemotional>neutral (n = 18). The opposite contrast revealed no significant activations. All P < 0.05 based on ROI analysis using SVC with FWE correction (*) or whole‐brain statistics at P < 0.001 uncorrected.
During the presentation of emotional salient stimuli in the LPS condition, controlling for mood changes did not alter enhanced brain activity in inferior orbitofrontal cortex. Analysis revealed significant brain activation in inferior orbitofrontal cortex controlling for positive mood ([28, 24, −18], t = 6.57, P < 0.01), alterness ([28, 24, −18], t = 6.33, P < 0.01), calmness ([28, 24, −18], t = 6.49, P < 0.01) and state anxiety ([28, 24, −18], t = 7.24, P < 0.01) (all based on ROI analysis using SVC with FWE correction).
DISCUSSION
To elucidate the neural basis of inflammation‐mediated changes to aversive emotional stimuli, we conducted a fMRI study to assess the effects of endotoxin administration on the processing of these stimuli by implementing a double‐blind, randomized, crossover study with healthy males receiving an injection of LPS or saline. Endotoxin administration induced a transient systemic inflammation characterized by increased plasma levels of pro‐ (IL‐6, TNF‐α) and anti‐inflammatory (IL‐10, IL‐1ra) cytokines, a pronounced neutrophilia, increased plasma cortisol concentration, and elevated body temperature. These physiological responses are in line with reports from previous studies in which either the same concentration (0.4 ng/kg) and source of LPS (Escherichia coli) [Grigoleit et al., 2010], or a higher (0.8 ng/kg) concentration and a different source of LPS (Salmonella abortus equi) [Reichenberg et al., 2001] were used. At the psychological level, the acute inflammatory response to endotoxin was associated with significantly impaired mood, alertness, and calmness and increased state anxiety, which is also consistent with previous findings using LPS [Eisenberger et al., 2009, 2010b; Reichenberg et al., 2001]. Together, these findings support the notion that experimental endotoxin administration constitutes a model to study the neural mechanisms mediating specific aspects of human sickness behavior, including possible alterations in emotion processing, resulting from peripheral innate immune system activation. Interestingly, our ROI analysis of BOLD responses revealed an enhanced activation of the right inferior orbitofrontal cortex during the presentation of emotional stimuli in the LPS condition. Moreover, whole‐brain analysis revealed additional greater activation of medial and superior prefrontal regions, hypothalamus, supramarginal gyrus, parietal lobule as well as middle occipital gyrus in the LPS condition. These effects were not attributable to LPS effects on early stages of visual processing and/or on neurovascular coupling, as evidenced by the lack of differences between conditions during the visual stimulation task.
Our findings of enhanced LPS‐induced activation of the inferior orbitofrontal cortex, and (albeit at a lower statistical threshold) also of superior and medial prefrontal regions during aversive visual stimulation are of interest since these prefrontal regions reportedly play a crucial role in different aspects of emotion regulation, including reappraisal [Davidson, 2002; Ochsner et al., 2004; Phillips et al., 2003a]. Reappraisal processes are aimed at buffering the emotional impact of a situation and modulating affective states to maintain well‐being [Davidson et al., 2000; Gross, 2002]. Interestingly, enhanced activity of the orbitofrontal cortex has previously been reported during the cognitive control of emotionally salient stimuli [Eippert et al., 2007; Levesque et al., 2003; Levesque et al., 2004; Ohira et al., 2006; Phan et al., 2005]. Further, the orbitofrontal cortex is also known to be involved in the identification and recognition of emotions such as fear and anger [Adolphs, 2002] and constitutes a pivotal prefrontal area relevant for the production of affective states in response to emotional stimuli [Davidson and Irwin, 1999; Phillips et al., 2003a]. Given the observed mood changes, including enhanced state anxiety, induced by the acute inflammatory response in our study, we speculate that in the LPS‐condition subjects may have been more susceptible to the emotional impact of visual stimuli. Noticeable, we did not assess the emotionality of the IAPS pictures within both conditions (LPS, placebo). Hence, the missing ratings constitute a limitation of the present study. This suggestion is underscored by our finding that enhanced activation of inferior orbitofrontal cortex was not mediated by changes in mood. Thus, the enhanced activation of prefrontal regions in the LPS condition may reflect an adaptive process characterized by increased cognitive control and down‐regulation of emotional brain circuits (e.g., the amygdala) in order to maintain normal psychosocial functioning. Indeed, it has been demonstrated that prefrontal regions modulate and specifically inhibit the amygdala during the suppression or down‐regulation of negative emotions [Davidson, 2002; Ochsner et al., 2002; Phan et al., 2005]. Since our study revealed significant activation of the amygdala by negative emotional stimuli in the placebo condition, but no (additional) effect of LPS, one could hypothesize that increased prefrontal activation during peripheral inflammation prevented an increased negative emotional impact of the aversive stimuli. Clearly, future studies are needed to more carefully discern the interactions between inflammation, emotions and neural responses at the physiological, behavioral and neural levels.
The present results complement and extend previous fMRI studies assessing effects of peripheral immune activation induced by endotoxin on neural responses in a reward paradigm [Eisenberger et al., 2010a] and during a social exclusion task [Eisenberger et al., 2009]. However, this is the first study employing the LPS‐model to specifically assess the neural processing of aversive emotional stimuli. The only previously existing brain imaging study on the subject employed the typhoid vaccination model which did not evoke systemic increases in the pro‐inflammatory cytokines TNF‐α and IL‐1β which may explain effects on different brain regions (i.e., sulcus temporalis superior, sACC) then what we observed in our study [Harrison et al., 2009]. Nevertheless, together these findings support the notion that peripheral immune alterations are capable of inducing functional brain changes relevant to motivational and emotional behavior, which may also correlate with inflammation‐mediated changes in mood [Eisenberger et al., 2010a; Eisenberger et al., 2009; Harrison et al., 2009]. These findings are relevant in the context of human affective disorders including depression, characterized by both immune system alterations [Dowlati et al., 2010; Miller et al., 2009] and abnormalities in the central processing of emotions [Drevets, 2000; Phillips et al., 2003b]. In fact, abnormalities in orbitofrontal and/or medial prefrontal activation during emotional stimulation have been reported in depressed individuals [Dichter et al., 2009; Elliott et al., 2002], which are thought to be important in the pathogenesis of depressive symptoms. Hence, even though LPS application may not be a valid model of all aspects of human depression [DellaGioia and Hannestad, 2010], we conclude that it may be a useful paradigm to study interactions between innate immune system activation and emotion processing in healthy subjects with implications for the pathophysiology of affective disorders.
Acknowledgments
The authors thank Anne Winkelhaus and Armin de Greiff for their technical assistance.
REFERENCES
- Adolphs R (2002): Neural systems for recognizing emotion. Curr Opin Neurobiol 12:169–177. [DOI] [PubMed] [Google Scholar]
- Bahador M, Cross AS (2007): From therapy to experimental model: A hundred years of endotoxin administration to human subjects. J Endotoxin Res 13:251–279. [DOI] [PubMed] [Google Scholar]
- Dantzer R, O'Connor JC, Freund GG, Johnson RW, Kelley KW (2008): From inflammation to sickness and depression: When the immune system subjugates the brain. Nat Rev Neurosci 9:46–56. [DOI] [PMC free article] [PubMed] [Google Scholar]
- Davidson RJ (2002): Anxiety and affective style: Role of prefrontal cortex and amygdala. Biol Psychiatry 51:68–80. [DOI] [PubMed] [Google Scholar]
- Davidson RJ, Irwin W (1999): The functional neuroanatomy of emotion and affective style. Trends Cogn Sci 3:11–21. [DOI] [PubMed] [Google Scholar]
- Davidson RJ, Jackson DC, Kalin NH (2000): Emotion, plasticity, context, and regulation: Perspectives from affective neuroscience. Psychol Bull 126:890–909. [DOI] [PubMed] [Google Scholar]
- DellaGioia N, Hannestad J (2010): A critical review of human endotoxin administration as an experimental paradigm of depression. Neurosci Biobehav Rev 34:130–143. [DOI] [PMC free article] [PubMed] [Google Scholar]
- DeYoe EA, Carman GJ, Bandettini P, Glickman S, Wieser J, Cox R, Miller D, Neitz J (1996): Mapping striate and extrastriate visual areas in human cerebral cortex. Proc Natl Acad Sci USA 93:2382–2386. [DOI] [PMC free article] [PubMed] [Google Scholar]
- Dichter GS, Felder JN, Smoski MJ (2009): Affective context interferes with cognitive control in unipolar depression: An fMRI investigation. J Affective Disorders 114( 1–3):131–142. [DOI] [PMC free article] [PubMed] [Google Scholar]
- Dowlati Y, Herrmann N, Swardfager W, Liu H, Sham L, Reim EK, Lanctot KL (2010): A meta‐analysis of cytokines in major depression. Biol Psychiatry 67:446–457. [DOI] [PubMed] [Google Scholar]
- Drevets WC (2000): Neuroimaging studies of mood disorders. Biol Psychiatry 48:813–829. [DOI] [PubMed] [Google Scholar]
- Eippert F, Veit R, Weiskopf N, Erb M, Birbaumer N, Anders S (2007): Regulation of emotional responses elicited by threat‐related stimuli. Hum Brain Mapp 28:409–423. [DOI] [PMC free article] [PubMed] [Google Scholar]
- Eisenberger NI, Inagaki TK, Rameson LT, Mashal NM, Irwin MR (2009): An fMRI study of cytokine‐induced depressed mood and social pain: The role of sex differences. Neuroimage 47:881–890. [DOI] [PMC free article] [PubMed] [Google Scholar]
- Eisenberger NI, Berkman ET, Inagaki TK, Rameson LT, Mashal NM, Irwin MR (2010a) Inflammation‐induced anhedonia: Endotoxin reduces ventral striatum responses to reward. Biol Psychiatry 68:748–754. [DOI] [PMC free article] [PubMed] [Google Scholar]
- Eisenberger NI, Inagaki TK, Mashal NM, Irwin MR (2010b) Inflammation and social experience: An inflammatory challenge induces feelings of social disconnection in addition to depressed mood. Brain Behav Immun 24:558–563. [DOI] [PMC free article] [PubMed] [Google Scholar]
- Elliott R, Rubinsztein JS, Sahakian BJ, Dolan RJ (2002): The neural basis of mood‐congruent processing biases in depression. Arch Gen Psychiatry 59:597–604. [DOI] [PubMed] [Google Scholar]
- Engel SA, Glover GH, Wandell BA (1997): Retinotopic organization in human visual cortex and the spatial precision of functional MRI. Cereb Cortex 7:181–192. [DOI] [PubMed] [Google Scholar]
- Engler H, Doenlen R, Engler A, Riether C, Prager G, Niemi MB, Pacheco‐Lopez G, Krugel U, chedlowski M (2011): Acute amygdaloid response to systemic inflammation. Brain Behav Immunity 25:1384–1392. [DOI] [PubMed] [Google Scholar]
- Grigoleit JS, Oberbeck JR, Lichte P, Kobbe P, Wolf OT, Montag T, Rey AD, Gizewski ER, Engler H, Schedlowski M (2010): Lipopolysaccharide‐induced experimental immune activation does not impair memory functions in humans. Neurobiol Learn Mem 94:561–567. [DOI] [PubMed] [Google Scholar]
- Gross JJ (2002): Emotion regulation: Affective, cognitive, and social consequences. Psychophysiology 39:281–291. [DOI] [PubMed] [Google Scholar]
- Harrison NA, Brydon L, Walker C, Gray MA, Steptoe A, Critchley HD (2009): Inflammation causes mood changes through alterations in subgenual cingulate activity and mesolimbic connectivity. Biol Psychiatry 66:407–414. [DOI] [PMC free article] [PubMed] [Google Scholar]
- Irwin MR, Miller AH (2007): Depressive disorders and immunity: 20 years of progress and discovery. Brain Behav Immunity 21:374–383. [DOI] [PubMed] [Google Scholar]
- Lang PJ, Bradley MM, Cuthbert BN, editors (1997): International Affective Picture System (IAPS): Technical Manual and Affective Ratings. Gainesville, FL: NIMH Center for the Study of Emotion and Attention, University of Florida. [Google Scholar]
- Lang PJ (1980): Behavioral treatment and bio‐behavioral assessment: Computer applications In: Sidowski JB, Johnson JH, Williams TA, editors. Technology in Mental Health Care Delivery Systems. Norwood, NJ: Ablex; pp119–137. [Google Scholar]
- Laux L, Glanzmann P, Schaffner P, Spielberger CD (1981): State‐Trait‐Angstinventar. (STAI). Weinheim: Beltz. [Google Scholar]
- Leppanen JM (2006): Emotional information processing in mood disorders: A review of behavioral and neuroimaging findings. Curr Opin Psychiatry 19:34–39. [DOI] [PubMed] [Google Scholar]
- Levesque J, Eugene F, Joanette Y, Paquette V, Mensour B, Beaudoin G, Leroux JM, Bourgouin P, Beauregard M (2003): Neural circuitry underlying voluntary suppression of sadness. Biol Psychiatry 53:502–510. [DOI] [PubMed] [Google Scholar]
- Levesque J, Joanette Y, Mensour B, Beaudoin G, Leroux JM, Bourgouin P, Beauregard M (2004): Neural basis of emotional self‐regulation in childhood. Neuroscience 129:361–369. [DOI] [PubMed] [Google Scholar]
- McNair DM, Lorr,M. , Doppelman LF (1971): EITS Manual for Profile of Mood States. San Diego, CA: EdITS. [Google Scholar]
- Miller AH, Maletic V, Raison CL (2009): Inflammation and its discontents: the role of cytokines in the pathophysiology of major depression. Biol Psychiatry 65:732–741. [DOI] [PMC free article] [PubMed] [Google Scholar]
- Murray C, Sanderson DJ, Barkus C, Deacon RM, Rawlins JN, Bannerman DM, Cunningham C (2012): Systemic inflammation induces acute working memory deficits in the primed brain: Relevance for delirium. Neurobiol Aging 33:603–616e3. [DOI] [PMC free article] [PubMed] [Google Scholar]
- Ochsner KN, Bunge SA, Gross JJ, Gabrieli JD (2002): Rethinking feelings: An FMRI study of the cognitive regulation of emotion. J Cogn Neurosci 14:1215–1229. [DOI] [PubMed] [Google Scholar]
- Ochsner KN, Ray RD, Cooper JC, Robertson ER, Chopra S, Gabrieli JD, Gross JJ (2004): For better or for worse: Neural systems supporting the cognitive down‐ and up‐regulation of negative emotion. Neuroimage 23:483–499. [DOI] [PubMed] [Google Scholar]
- Ohira H, Nomura M, Ichikawa N, Isowa T, Iidaka T, Sato A, Fukuyama S, Nakajima T, Yamada J (2006): Association of neural and physiological responses during voluntary emotion suppression. Neuroimage 29:721–733. [DOI] [PubMed] [Google Scholar]
- Phan KL, Fitzgerald DA, Nathan PJ, Moore GJ, Uhde TW, Tancer ME (2005): Neural substrates for voluntary suppression of negative affect: A functional magnetic resonance imaging study. Biol Psychiatry 57:210–219. [DOI] [PubMed] [Google Scholar]
- Phillips ML, Drevets WC, Rauch SL, Lane R (2003a) Neurobiology of emotion perception. I. The neural basis of normal emotion perception. Biol Psychiatry 54:504–514. [DOI] [PubMed] [Google Scholar]
- Phillips ML, Drevets WC, Rauch SL, Lane R (2003b) Neurobiology of emotion perception. II. Implications for major psychiatric disorders. Biol Psychiatry 54:515–528. [DOI] [PubMed] [Google Scholar]
- Raison CL, Capuron L, Miller AH (2006): Cytokines sing the blues: Inflammation and the pathogenesis of depression. Trends Immunol 27:24–31. [DOI] [PMC free article] [PubMed] [Google Scholar]
- Reichenberg A, Yirmiya R, Schuld A, Kraus T, Haack M, Morag A, Pollmacher T (2001): Cytokine‐associated emotional and cognitive disturbances in humans. Arch General Psychiatry 58:445–452. [DOI] [PubMed] [Google Scholar]
- Simpson JR, Ongur D, Akbudak E, Conturo TE, Ollinger JM, Snyder AZ, Gusnard DA, Raichle ME (2000): The emotional modulation of cognitive processing: An fMRI study. J Cogn Neurosci 12 (Suppl 2):157–170. [DOI] [PubMed] [Google Scholar]
- Sparkman NL, Buchanan JB, Heyen JR, Chen J, Beverly JL, Johnson RW (2006): Interleukin‐6 facilitates lipopolysaccharide‐induced disruption in working memory and expression of other proinflammatory cytokines in hippocampal neuronal cell layers. J Neurosci 26:10709–10716. [DOI] [PMC free article] [PubMed] [Google Scholar]
- Stark R, Schienle A, Walter B, Kirsch P, Blecker C, Ott U, Schafer A, Sammer G, Zimmermann M, Vaitl D (2004): Hemodynamic effects of negative emotional pictures—A test‐retest analysis. Neuropsychobiology 50:108–118. [DOI] [PubMed] [Google Scholar]
- Steyer R, Schwenkmezger P, Notz P, Eid M, editors (1997): Der Mehrdimensionale Befindlichkeitsfragebogen (MDBF). Göttingen: Hogrefe‐Verlag. [Google Scholar]