

Abstract
The short allele of the serotonin‐transporter‐linked promoter region (5‐HTTLPR) polymorphism is associated with increased amygdala activation in response to emotional stimuli. Although top–down processes may moderate this association, available evidence is conflicting, showing the genotype influence on amygdala reactivity to be either decreased or increased during emotion regulation. Because the effects of the 5‐HTTLPR polymorphism on amygdala reactivity are also conditional on self‐reported life stress, differences in life stress exposure may account for this apparent discrepancy. Here, we hypothesized that self‐reported life stress would moderate the relationships between genotype, cognitive appraisal, and amygdala reactivity. Forty‐five healthy never‐depressed subjects were presented with emotional stimuli and performed two cognitive tasks: a self‐referential task and an emotion‐labeling task. Life‐stress exposure was measured through a semistructured interview. First, there was a genotype × condition interaction in the right amygdala: short allele carriers displayed increased amygdala activation and decreased functional connectivity with the subgenual anterior cingulate cortex in self‐referential processing versus emotion labeling. Second, in line with our hypothesis, there was a genotype × condition × stress interaction in bilateral amygdala the amygdala activation during self‐referential processing was negatively correlated with self‐reported life stress in short allele carriers and positively in individuals homozygous for the long allele, whereas an opposite pattern was observed during emotion labeling. These results confirm that the influence of the 5‐HTTLPR polymorphism on amygdala reactivity is at least partially under cognitive control. Additionally, they suggest that measuring life stress exposure is a critical step when imaging genetics. Hum Brain Mapp, 2011. © 2011 Wiley‐Liss, Inc.
Keywords: depressive disorder, emotions, genetics, magnetic resonance imaging, psychological stress, self concept, serotonin, serotonin plasma membrane transport proteins
INTRODUCTION
Following an impactful study by Caspi et al. [2003], it has been suggested that a polymorphism of the serotonin‐transporter‐linked promoter region (5‐HTTLPR), which was first considered as a biallelic locus with alleles designated as either short (S) or long (L), may moderate the impact of life stress on depression. Several replications of this finding [Uher and McGuffin,2010] stimulated the search of neural endophenotypes of the 5‐HTTLPR polymorphism [Caspi and Moffit,2006]. Taking advantage of the shorter distance from genes to brain than from genes to behavior, this line of research consistently showed that individuals carrying at least one S allele displayed greater amygdala reactivity to emotional stimuli than individuals homozygous for the L allele [Hariri et al.,2005]. Although the association of the S allele with vulnerability for depression has been challenged by two recent negative meta‐analyses [Munafò et al.,2009a; Risch et al.,2009], another meta‐analysis confirmed its association with a greater amygdala reactivity in healthy subjects [Munafò et al.,2008].
Because amygdala reactivity is modulated by cognitive appraisal [Hariri et al.,2003; Yoshimura et al.,2008], previous studies that examined its dependence upon the 5‐HTTLPR polymorphism relied either on lower‐order cognitive processes such as emotion matching or gender recognition [Canli et al.,2006; Hariri et al.,2005], or passive viewing [Heinz et al.,2005], or even masked stimuli [Dannlowski et al.,2008]. As a drawback, most of these studies have overlooked the effects of higher‐order cognitive processes in moderating the influence of genotype on amygdala reactivity. Two studies have recently addressed this issue but have yielded conflicting results, showing the genotype influence on amygdala reactivity to be either decreased [Schardt et al., in press] or increased [Gillihan et al.,2010] during emotion regulation (e.g., assuming a detached attitude toward the emotional stimuli rather than experiencing the subjective impact). A possible explanation of this apparent discrepancy lies in the fact that the effects of the 5‐HTTLPR polymorphism on amygdala reactivity are indeed conditional on self‐reported life stress [Canli et al.,2006; Williams et al.,2009]. However, self‐reported life stress was not considered in these two studies.
This study aimed to examine the effects of both cognitive appraisal and self‐reported life stress on the 5‐HTTLPR polymorphism influence on amygdala reactivity. We took advantage of a previous study in which we addressed the links between the Harm Avoidance (HA) temperamental trait and the activation of the cortical midline structures during self‐referential processing [Lemogne et al., 2011]. Consistently with meta‐analytic data [Munafò et al.,2009b], there was no relationship between the genotype and the level of HA in our sample. Here, we reanalyzed the same data set based on the 5‐HTTLPR polymorphism and focusing on amygdala as a region of interest (ROI), taking into account both self‐reported life stress and cognitive appraisal. More specifically, we examined the effects of self‐referential processing (i.e., the appraisal of stimuli as strongly related to one's own person) versus emotion labeling (i.e., the appraisal of stimuli according to their intrinsic emotional valence) in moderating the influence of the 5‐HTTLPR polymorphism on amygdala reactivity to emotional stimuli. These two tasks have been reported to modulate the amygdala reactivity [Hariri et al.,2003; Yoshimura et al.,2008]. Additionally, given the reciprocal relationships between self‐focused attention and depressive mood [Mor and Winquist,2002], self‐referential processing is a task of interest when studying the neural bases of vulnerability for depression [Lemogne et al.,2009,2010, 2011]. Relative brain activation was obtained in contrast with a control task using neutral pictures.
Self‐referential processing is widely used in emotion‐regulation experiments to increase emotional intensity and amygdala reactivity [Ochsner and Gross,2005; Yoshimura et al.,2008], whereas emotion labeling has been associated with decreased amygdala reactivity [Hariri et al.,2000]. Although self‐referential processing involves looking for personal relevance, emotion labeling may promote a detached attitude toward the emotional stimuli. In line with the findings of Schardt et al. [in press], we thus hypothesized that the increased amygdala reactivity in S allele carriers should be more evident during self‐referential processing than emotion labeling (i.e., a genotype × condition interaction). Furthermore, considering the discrepancies between the results of Schardt et al. [in press] and Gillihan et al. [2010], we postulated that self‐reported life stress could moderate the relationships between genotype, cognitive appraisal, and amygdala reactivity (i.e., a genotype × condition × stress interaction). Canli et al. [2006] showed that the correlation between life stress and rumination, which is characterized by spontaneous self‐referential processing [Nolen‐Hoeksema,1991], is positive in S allele carriers but negative in individuals homozygous for the L allele. At a brain level, we postulated that life stress would minimize the differences between the two conditions in S allele carriers, due to an increasing amount of unsolicited self‐referential processing during emotion labeling. In contrast, we postulated that life stress would maximize these differences in individuals homozygous for the L allele, due to a decreasing amount of unsolicited self‐referential processing during emotion labeling. Therefore, we predicted that the correlation between life stress and amygdala activation in self‐referential processing versus emotion labeling would be negative in S allele carriers but positive in individuals homozygous for the L allele.
MATERIALS AND METHODS
Subjects
All volunteers were native French‐speaking Caucasian young adults and gave written informed consent after complete description of the study. The Ethics Committee for Biomedical Research of the Pitié‐Salpêtrière Hospital approved the study. The volunteers were screened for past and present DSM‐IV diagnoses with the Mini International Neuropsychiatric Interview [Sheehan et al.,1998]. Exclusion criteria were current or past psychiatric disorders (including substance‐related disorders), medical disorders or medication likely to affect cognition, and left‐handedness. Forty‐five right‐handed healthy subjects were included in the study (21 men and 24 women, mean age ± standard deviation: 23.3 ± 2.0 years). Vision was normal or corrected to near normal using contact lenses.
Genotyping
Genomic deoxyribonucleic acid (DNA) was extracted from endobuccal cell swabs with the BuccalAmp DNA Extraction Kit (Epicentre®). All subjects were genotyped for the 5‐HTTLPR polymorphism, including SNP rs25531 (A/G), according to published protocols [Dannlowski et al.,2008] with minor variation. Primers 5′‐GGCGTTGCCGCTCTGAATGC‐3′ and 5′‐GAGGGACTGAGCTGGACAACCAC‐3′ (10 pM each) were used for a 25‐μl polymerase chain reaction (PCR) containing 5‐μl DNA (20–100 ng), 200 mM dNTPs, 0.5 U Taq Polymerase (Eurobio), 1.5 mM MgCl2, and 1× buffer (Eurobio), with an initial 15‐min denaturation step at 95°C followed by 35 PCR cycles of 94°C (60 s), 64°C (60 s), and 72°C (120 s) and a final extension step of 10 min at 72°C. PCR products were digested with HpaII at 37°C overnight and separated in 3% agarose gels, stained with SYBRsafe DNA stain (Invitrogen), which resulted in fragments between 62 and 340‐bp length allowing differentiation and assignment of all 5‐HTTLPR genotypes. Allele and genotype frequencies were compared to chi‐square tests, and the test for Hardy–Weinberg equilibrium was performed.
Paykel's Scale of Stressful Life Events
This is semistructured interview that explores 64 life events that may have occurred during the preceding 12 months, ranging from mild stressors to a single, large traumatic event [Paykel et al.,1971]. Because the subjective impact of a life event may be linked to the 5‐HTTLPR polymorphism, we only took into account the number of endorsed life stress events [Canli et al.,2006; Caspi et al.,2003].
fMRI Task Design
Stimuli were 318 black and white pictures that were either affectively positive, negative, or neutral, including 276 that were used during fMRI (92 per valence) and 42 that were used during a practice session (14 per valence). Positive, negative, and neutral pictures were taken from either the International Affective Picture System [Lang et al.,1997] or the Empathy Picture System [Geday et al.,2003]. Neutral pictures were divided in 53 “outdoor” and 53 “indoor” pictures. Positive and negative pictures were matched for arousal. Additionally, positive, negative, indoor, and outdoor pictures that were used during fMRI were strictly matched regarding their social content: pictures showing mainly faces were divided according to whether the gaze was oriented or not toward the subject; more complex pictures were classified according to the presence of none, one, or at least two human beings. The pictures did not involve any famous person and no person appeared in more than one picture.
There were three judgment conditions: self, label, and a control condition. In both self and label conditions, the subjects were presented with an equal number of positive and negative pictures. In the self condition, subjects judged whether the picture was self‐related (e.g., a picture connected with personal interests, relatives, or past experiences) or not. In the label condition, subjects judged whether the picture was positive (e.g., happy social interactions) or negative (e.g., starving children). For each subject, positive and negative pictures were randomly allocated to either self or label condition. In the control condition, subjects were presented with neutral pictures. They judged whether the picture was taken indoor or outdoor. In all conditions and for each picture, subjects gave either a “yes” or “no” response for the self condition, a “positive” or “negative” response for the label condition, or a “indoor” or “outdoor” response for the “control” condition by pushing a button with the right or the left thumb, respectively.
The task encompassed one practice run, performed outside the scanner, and six scanning runs. The practice run and the scanning runs were similar. Each run contained three blocks. Each block was associated with only one condition. The order of the conditions was counterbalanced across the runs to avoid presenting the same condition in two consecutive blocks. Before each block, an instruction cue was displayed for 5.330 s (e.g., self), followed by a central fixation crosshair for 3.5 s. Each block contained 12 trials including six negative and six positive pictures for self and label conditions, or six indoor and six outdoor neutral pictures for the control condition. Each trial consisted of a picture displayed for 2.565 s, followed by a fixation crosshair for 3.5 s. The duration of each trial (i.e., 6.065 s) was computed to optimize the hemodynamic response sampling over the course of each block, taking into account the echo‐planar imaging (EPI) sequence repetition time (see below). To introduce jitter into the fMRI time series, each block contained six null events, consisting of a fixation crosshair for 6.065 s. Pictures and null events were pseudo‐randomly intermixed such that events of each type (i.e., positive, negative, and null, or indoor, outdoor, and null) followed each other equally often.
fMRI Scanning
Stimuli were generated by the E‐Prime software and projected on the centre of a screen mounted outside the scanner. Subjects viewed the screen through mirror glasses.
Six functional runs of 183 contiguous volumes were acquired on a 3 Tesla TRIO 32‐channel TIM scanner (Siemens Medical Solutions, Erlangen, Germany), with a 12‐channel head coil, using T2‐weighted gradient echo, EPI sequence, sensitive to blood oxygen level‐dependent contrast (41 axial slices, repetition time: 2 s, echo time: 25 ms, bandwidth: 2,230 Hz, flip angle: 90°, matrix: 64 × 64, field of view: 192 × 192 mm2, voxel size: 3 × 3 × 3 mm3). Each run lasted 366 s. The first two volumes of each run were discarded to reach signal equilibrium. High‐resolution three‐dimensional T1‐weighted images (3D fast gradient echo inversion recovery sequence, inversion time: 400 ms, repetition time: 2,300 ms, echo time: 4.18 ms, bandwidth: 150 Hz, flip angle: 9°, matrix: 256 × 256, field of view: 220 × 220 mm, voxel size: 1 × 1 × 1 mm3) were acquired for anatomical localization.
fMRI Data Analysis
We used SPM5 software (http://www.fil.ion.ucl.ac.uk/spm/software/spm5) for data analysis.
Preprocessing
EPI volumes were corrected for slice timing, realigned to the first image, co‐registered with the high‐resolution T1‐weighted image, and normalized into a standard stereotactic space. The normalization used the Montreal Neurological Institute (MNI) template and the transformations computed during the segmentation of the high‐resolution T1‐weighted image. Finally, the normalized EPI volumes were smoothed using an isotropic Gaussian kernel filter of 8‐mm full‐width half‐maximum.
Activation Analyses
For each subject, we computed an individual statistical parametric map using the general linear model and an event‐related approach [Friston et al.,1998]. Each trial onset was convolved with the canonical hemodynamic response function (HRF) to create regressors of interest. A high‐pass filter was applied, and the motion realignment parameters were included as regressors of noninterest.
The following first‐level individual contrast images were obtained for the HRF estimates: self/positive, self/negative, label/positive, and label/negative (vs. control). We used these images in a second‐level three‐way ANCOVA with one group factor (i.e., S′ vs. L′), two within‐groups factors (i.e., self vs. label and positive vs. negative), and the number of stressful life events as a covariate. We modeled a stress main effect as well as every possible interaction between stress and the other factors, including within‐groups factors. We used the Wake Forest University School of Medicine PickAtlas software toolbox [Maldjian et al.,2003] and the automated anatomical labeling Atlas [Tzourio‐Mazoyer et al.,2002] to generate a mask encompassing right and left amygdala. Whenever a small volume family wise error (FWE)‐corrected threshold of P < 0.05 was reached, a whole‐brain analysis with a more liberal threshold (P < 0.001, uncorrected) was performed to examine the specificity of the results regarding the amygdala.
All analyses were repeated with gender and age as covariates.
Post hoc functional connectivity analyses
To examine the functional connectivity of the amygdala in relation to genotype, cognitive appraisal, and life stress, we modeled a psycho‐physiological interaction (PPI), which has been defined as the change in contribution of one brain area to another with the psychological context [Gitelman et al.,2003]. We used the amygdala BOLD signal as the physiological activity and the self versus label condition as the psychological context. Activation analyses identified a genotype × condition × stress interaction in both right and left amygdala (see Results section). We extracted the individual time‐series data for these two amygdala clusters separately. There was no condition main effect within these clusters at a liberal threshold of P < 0.05, uncorrected. We estimated the time series of the neuronal signal through Bayesian deconvolution of the time series of the BOLD signal, resulting in a “physiological” vector. We derived a “psychological” vector from the individual design matrix, coding the self, label, and control conditions as +1, −1, and 0, respectively. We finally computed the product of the “physiological” and the “psychological” vector, resulting in one PPI vector. These vectors were forward‐convolved with the canonical HRF, resulting in three regressors.
We then computed an individual statistical parametric map for each subject, with the PPI regressor as the only regressor of interest. The “physiological” and the “psychological” regressors, as well as the motion realignment parameters, were simultaneously entered as regressors of noninterest. A high‐pass filter was applied. We obtained one first‐level contrast image for each subject, which showed regions with significant differential connectivity to the right amygdala because of the condition (i.e., self vs. label). We used these images in a second‐level ANCOVA with one group factor (i.e., S′ vs. L′) and the number of stressful life events as a covariate, modeling a genotype × stress interaction. We were therefore able to examine the extent to which the differences of amygdala functional connectivity according to condition were related to genotype and life stress.
Because previous reports showed an effect of the 5‐HTTLPR polymorphism on the functional connectivity between the amygdala and the subgenual part of the anterior cingulate cortex (ACC) [Pezawas et al.,2005; Schardt et al., in press], we considered this region as a ROI. We used the Wake Forest University School of Medicine PickAtlas software toolbox [Maldjian et al.,2003] to generate a 10‐mm radius sphere centered on the maximum of volumetric reduction reported by Pezawas et al. [2005] in S allele carriers within the subgenual ACC (i.e., Talairach coordinates: −3, 33, −2 corresponding to MNI coordinates: −3, 34, 0). Whenever a small volume FWE‐corrected threshold of P < 0.05 was reached, a whole‐brain analysis with a more liberal threshold (P < 0.001, uncorrected) was performed to examine the specificity of the results regarding the subgenual ACC.
RESULTS
Subjects
The 5‐HTTLPR polymorphism was considered as a triallelic locus, the L allele being subdivided with respect to a single‐nucleotide polymorphism (SNP rs25531) into functional variants designated as LA and LG [Nakamura et al.,2000]. The S and LG alleles are associated with comparable levels of gene expression in cell lines, both of which being lower than the gene expression associated with LA. Because of the dominant effect of the S and LG alleles, we considered two groups according to their putative level of gene expression, distinguishing subjects with the potentially at‐risk genotypes (SS, SLA, SLG, LGLG, and LGLA) versus without (LALA), henceforth referred as to S′ and L′ subjects, respectively [Dannlowski et al.,2008].
The S′ group included 28 subjects with the following genotypes: SS (n = 7), SLA (n = 15), SLG (n = 2), and LGLA (n = 4). The L′ group included 17 subjects with a LALA genotype. The genotype frequencies were in accordance with Hardy–Weinberg equilibrium (χ2 = 1.798, P = 0.773). The S′ group was slightly older than the L′ group (mean age ± standard deviation = 23.9 ± 2.1 years vs. 22.5 ± 1.6 years, t = 2.370, P = 0.022), but the two groups were similar regarding gender, education level, and family history of depression. The two groups were similar regarding self‐reported recent life stress (mean ± standard deviation = 5.2 ± 2.4 events vs. 4.9 ± 2.1 events, t = 0.495, P = 0.695).
Behavioral Results
We used SPSS 16.0.2 software to perform ANCOVAs with one group factor (i.e., S′ vs. L′), two within‐groups factors (i.e., self vs. label and positive vs. negative), and the number of stressful life events as a covariate. Because of technical problems, behavioral data were lost for three subjects. Regarding responses during self and label conditions, there was a valence main effect [F (1,40) = 310.59, P < 0.001], with more “yes” and “positive” response for positive pictures overall, and a condition × valence interaction [F (1,40) = 22.41, P < 0.001], this valence effect being less pronounced for “yes” responses in self condition than for “positive” responses in label condition. None of the other main effects or interactions was significant. Regarding the reaction times during self and label conditions, there was only a condition main effect [F (1,40) = 8.23, P = 0.007], with slower responses in self condition. None of the other main effects or interactions was significant.
fMRI Results
Activation analyses
Consistent with our hypotheses, there was a genotype × condition in right amygdala [216 mm3; MNI coordinates: 21, −6, −12; t (1,172) = 3.61; P = 0.009, small volume FWE‐corrected] (Fig. 1a) and a genotype × condition × stress interaction in right [216 mm3; MNI coordinates: 18, −3, −15; t (1,172) = 3.59; P = 0.010, small volume FWE‐corrected] and left amygdala [216 mm3; MNI coordinates: −18, 0, −18; t (1,172) = 3.37; P = 0.018, small volume FWE‐corrected] (Fig. 2a). None of the other main effects or interaction was significant. Significant main effects and interactions at a whole brain level using a threshold of P < 0.05, FWE‐corrected, are displayed in Table I. Condition main effect according to the valence of stimuli at a whole brain level (P < 0.05, FWE‐corrected) is displayed in Table II.
Figure 1.
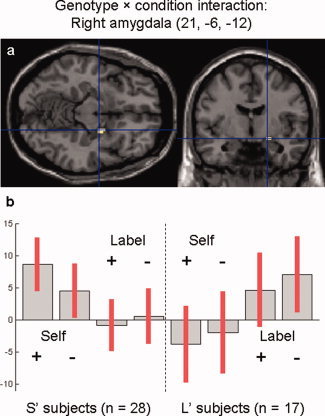
Genotype × condition interaction within the right amygdala. (a) Voxels activated in S' versus L′ subjects in self versus label condition (P < 0.05, small volume FWE‐corrected). (b) Contrast estimates and 95% confidence interval at the main peak of activation (MNI coordinates: 21, −6, −12). [Color figure can be viewed in the online issue, which is available at wileyonlinelibrary.com.]
Figure 2.
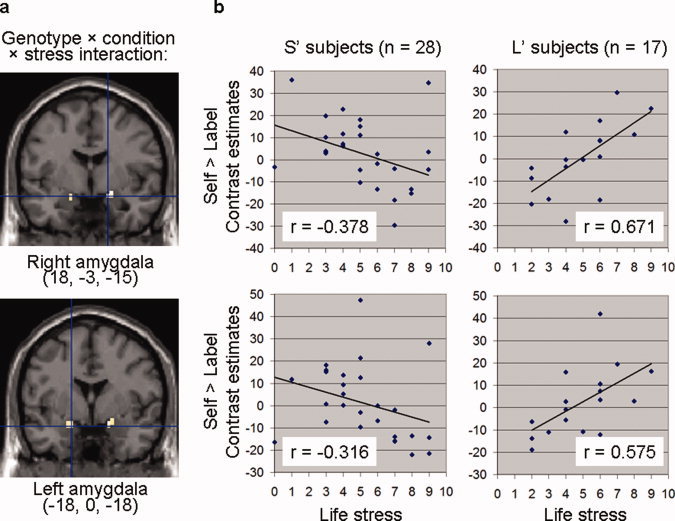
Genotype × condition × stress interaction within right and left amygdala. (a) Voxels whose activation in self versus label condition was inversely correlated with recent life stress across genotype (P < 0.05, small volume FWE‐corrected). (b) This genotype × condition × stress interaction was explained by a correlation between self‐reported life stress and amygdala activation in self versus label condition that was negative in S′ subjects but positive in L′ subjects. [Color figure can be viewed in the online issue, which is available at wileyonlinelibrary.com.]
Table I.
Significant main effects and interaction at a whole brain level (P < 0.05, FWE‐corrected)
| Regions | mm3 | t | P FWE‐corrected | x | y | z |
|---|---|---|---|---|---|---|
| S′ subjects > L′ subjects | ||||||
| Left superior occipital gyrus | 297 | 5.31 | 0.006 | −24 | −72 | 21 |
| Self > Label | ||||||
| Left angular gyrus | 1,728 | 5.64 | 0.001 | −45 | −63 | 36 |
| Left angular gyrus | 5.59 | 0.002 | −36 | −57 | 27 | |
| Left middle frontal gyrus | 1,107 | 5.55 | 0.002 | −39 | 12 | 51 |
| Left superior frontal gyrus | 351 | 5.53 | 0.002 | −15 | 39 | 45 |
| Right supplemental motor area | 81 | 5.01 | 0.019 | 12 | 18 | 63 |
| Left middle frontal gyrus | 54 | 4.97 | 0.022 | −30 | 48 | 9 |
| Left middle temporal gyrus | 54 | 4.94 | 0.025 | −63 | −21 | −12 |
| Positive > Negative | ||||||
| Left postcentral gyrus | 11,070 | 9.00 | <0.001 | −48 | −24 | 57 |
| Left postcentral gyrus | 8.99 | <0.001 | −42 | −21 | 48 | |
| Left precentral gyrus | 8.61 | <0.001 | −33 | −24 | 57 | |
| Left rolandic operculum | 54 | 4.92 | 0.027 | −48 | −21 | 18 |
| Culmen | 54 | 4.87 | 0.032 | 18 | −51 | −21 |
| Negative > Positive | ||||||
| Right precentral gyrus | 15,417 | 10.63 | <0.001 | 36 | −21 | 54 |
| Right rolandic operculum | 1,647 | 7.25 | <0.001 | 45 | −18 | 18 |
| Culmen | 783 | 6.07 | <0.001 | −15 | −51 | −21 |
| Right supplemental motor area | 81 | 4.86 | 0.033 | 6 | −6 | 54 |
| (Self > Label)positive > (Self > Label)negative | ||||||
| Right precentral gyrus | 243 | 5.04 | 0.017 | 33 | −24 | 51 |
| Left precentral gyrus | 54 | 4.89 | 0.030 | −27 | −9 | 42 |
| White matter | 54 | 4.88 | 0.031 | −27 | −24 | 33 |
| Right postcentral gyrus | 189 | 4.85 | 0.034 | 45 | −27 | 51 |
| [(Self > Label)positive > (Self > Label)negative] × life stress | ||||||
| White matter | 135 | 5.57 | 0.002 | −27 | 39 | 0 |
| Left middle frontal gyrus | 162 | 5.02 | 0.018 | −24 | −9 | 42 |
FWE, family wise error.
Table II.
Condition main effect according to the valence of stimuli at a whole brain level (P < 0.05, FWE‐corrected)
| Regions | mm3 | t | P FWE‐corrected | x | y | z |
|---|---|---|---|---|---|---|
| (Self > Label)Positive | ||||||
| Left superior temporal gyrus | 25 | 5.90 | <0.001 | −33 | −57 | 24 |
| Left middle frontal gyrus | 6 | 5.56 | 0.002 | −30 | 48 | 9 |
| Left middle frontal gyrus | 49 | 5.55 | 0.002 | −39 | 12 | 51 |
| Left superior frontal gyrus | 11 | 5.44 | 0.003 | −15 | 36 | 45 |
| Left middle frontal gyrus | 7 | 5.19 | 0.009 | −63 | −21 | −12 |
| Left angular gyrus | 8 | 4.92 | 0.026 | −45 | −63 | 36 |
| (Self > Label)Negative | ||||||
| Left angular gyrus | 5 | 4.98 | 0.021 | −39 | −60 | 30 |
FWE, family wise error.
The genotype × condition in the right amygdala was explained by a trend for a greater activation in S′ versus L′ subjects in self condition [t (1,164) = 2.09; P = 0.019, uncorrected], with an opposite trend in label condition [t (1,164) = 2.44; P = 0.008, uncorrected] (Fig. 1b). A whole‐brain analysis using a more liberal threshold (P < 0.001, uncorrected) identified no other cluster that displayed the same pattern of activation, showing only the same interaction within the right amygdala [108 mm3; MNI coordinates: 21, −6, −12; t (1,172) = 3.61; P < 0.001, uncorrected].
The genotype × condition × stress interaction in the right amygdala was explained by a correlation between recent life stress and amygdala activation that significantly differed between genotypes (Z = 3.626; P < 0.001). In self versus label condition, this correlation was negative in S′ subjects (r = −0.378; P = 0.047) but positive in L′ subjects (r = 0.671; P = 0.003) (Fig. 2b). This interaction was further explained by the combination of a trend for an interaction in self versus control condition (Z = 1.904; P = 0.057) that was in the same direction as in self versus label condition, whereas neither the negative correlation in S′ subjects (r = −0.254; P = 0.193) nor the positive correlation in L′ subjects (r = 0.359; P = 0.157) was significant per se, with a trend for an interaction in the opposite direction in label versus control condition (Z = 1.464; P = 0.144), whereas neither the positive correlation in S′ subjects (r = 0.101; P = 0.608) nor the negative correlation in L′ subjects (r = −0.369; P = 0.145) was significant per se.
The genotype × condition × stress interaction in the left amygdala was similar (Fig. 2b). There was a positive correlation between recent life stress and the amygdala activation in self versus label condition in L′ subjects (r = 0.575; P = 0.016) that significantly differed from a trend for a negative correlation in S′ subjects (r = −0.316; P = 0.102) (Z = 2.942; P = 0.002) (Fig. 2b). This interaction was further explained by the combination of a trend for an interaction in self versus control condition (Z = 1.855; P = 0.063) that was in the same direction as in self versus label condition, whereas neither the negative correlation in S′ subjects (r = −0.292; P = 0.132) nor the positive correlation in L′ subjects (r = 0.308; P = 0.230) was significant per se, with a trend for an interaction in the opposite direction in label versus control condition (Z = 1.464; P = 0.144), whereas neither the positive correlation in S′ subjects (r = 0.102; P = 0.607) nor the negative correlation in L′ subjects (r = −0.360; P = 0.155) was significant per se.
To summarize, the genotype × condition × stress interaction in right and left amygdala was explained by differences between S′ and L′ subjects regarding the effect of life stress on amygdala reactivity that were observed under both conditions rather than under only one given condition. A whole‐brain analysis using a more liberal threshold (P < 0.001, uncorrected) identified only few other brain regions, including right hippocampus, that displayed the same pattern of activation (Table III).
Table III.
Regions displaying a genotype × condition × stress interaction at a whole brain level (P < 0.001, uncorrected)
| Regionsa | mm3 | t | P uncorrected | x | y | z |
|---|---|---|---|---|---|---|
| Left insula | 270 | 3.88 | <0.0001 | −33 | 9 | −18 |
| Right amygdala | 486 | 3.78 | 0.0001 | 18 | −3 | −12 |
| Right hippocampus | 513 | 3.69 | 0.0002 | 24 | −18 | −15 |
| Right temporal superior gyrus | 135 | 3.63 | 0.0002 | 51 | −3 | −6 |
| Left fusiform gyrus | 108 | 3.62 | 0.0002 | −21 | −87 | −6 |
| Right thalamus | 189 | 3.61 | 0.0002 | 3 | −18 | 6 |
| Right temporal superior gyrus | 189 | 3.57 | 0.0002 | 42 | −42 | 0 |
| Left putamen | 216 | 3.57 | 0.0002 | −27 | −12 | −6 |
| Left insula | 135 | 3.52 | 0.0003 | −39 | −12 | 0 |
| Right fusiform gyrus | 216 | 3.44 | 0.0004 | 33 | −54 | −9 |
| Left amygdala | 162 | 3.37 | 0.0005 | −18 | 0 | −18 |
In all regions, activation in self versus label condition and recent life stress were negatively correlated in S′ subjects and positively correlated in L′ subjects.
Additionally, we looked for regions displaying either a genotype × valence × stress interaction or a genotype × condition × valence × stress interaction at a whole brain level using a more liberal threshold (P < 0.001, uncorrected). These exploratory results are displayed in Tables IV and V. Finally, we looked for significant main effects and interactions within our subgenual ACC ROI, using a small‐volume FWE‐corrected threshold of P < 0.05. There was a condition main effect (self > label) in two small clusters [189 mm3; MNI coordinates: −6, 36, −9; t (1,164)=3.89, P = 0.003 and 135 mm3; MNI coordinates: −6, 33, 9; t (1,164) = 3.34, P = 0.017, small volume FWE‐corrected] as well as a valence main effect (positive > negative) [1,188 mm3; MNI coordinates: 0, 27, −6; t (1,164) = 3.87, P = 0.004, small volume FWE‐corrected).
Table IV.
Regions displaying a genotype × valence × stress interaction at a whole brain level (P < 0.001, uncorrected)
| Regionsa | mm3 | t | P uncorrected | x | y | z |
|---|---|---|---|---|---|---|
| Left inferior parietal lobule | 324 | 3.86 | <0.0001 | −48 | −36 | 57 |
| White matter | 108 | 3.38 | 0.0004 | −6 | 24 | 75 |
In both regions, the activation for positive versus negative stimuli and recent life stress were positively correlated in S′ subjects and negatively correlated in L′ subjects.
Table V.
Regions displaying a genotype × condition × valence × stress interaction at a whole brain level (P < 0.001, uncorrected)
| Regions | mm3 | t | P uncorrected | x | y | z |
|---|---|---|---|---|---|---|
| Right precentral gyrusa | 351 | 4.10 | <0.0001 | 39 | −6 | 24 |
| Right precuneusa | 243 | 3.60 | 0.0002 | 21 | −42 | 45 |
| Medial frontal gyrusa | 104 | 3.52 | 0.0003 | −15 | −12 | 57 |
| Left precentral gyrusb | 270 | 4.08 | <0.0001 | −42 | −3 | 21 |
| Left middle frontal gyrusb | 104 | 3.59 | 0.0002 | −33 | 60 | 9 |
| White matterb | 208 | 3.55 | 0.0003 | −15 | −18 | −9 |
In these regions, the activation for (Self > Label)Positive > (Self > Label)Negative and recent life stress were positively correlated in S′ subjects and negatively correlated in L′ subjects.
In these regions, the activation for (Self > Label)Positive > (Self > Label)Negative and recent life stress were negatively correlated in S′ subjects and positively correlated in L′ subjects.
All analyses were repeated with gender and age as covariates and yielded similar results.
Post hoc functional connectivity analyses
The PPI between the right amygdala activity and the condition (self vs. label) differed significantly across genotype in the subgenual ACC [108 mm3; MNI coordinates: −6, 33, 0; t (1,41) = 3.52; P = 0.021, small volume FWE‐corrected] (Fig. 3a). The functional connectivity between the right amygdala and the subgenual ACC tended to decrease in self versus label condition in S′ subjects, but to increase in L′ subjects (Fig. 3b). A whole‐brain analysis using a more liberal threshold (P < 0.001, uncorrected) identified no other cluster displaying the same pattern of functional connectivity.
Figure 3.
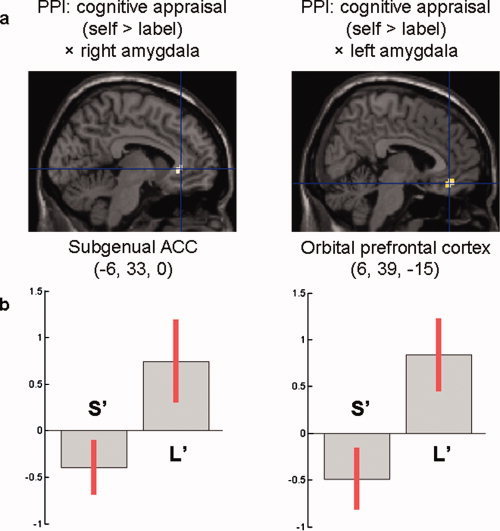
PPI between cognitive appraisal and amygdala activation. (a) Voxels whose activation in self versus label condition were inversely correlated with the activation of the amygdala across genotype: subgenual anterior cingulate cortex (ACC) for the PPI involving the right amygdala (P < 0.05, small‐volume FWE‐corrected); orbital prefrontal cortex for the PPI involving the left amygdala (P < 0.001, uncorrected). (b) Contrast estimates and 95% confidence interval at the main peaks of activation (MNI coordinates: −6, 33, 0 for the subgenual ACC; MNI coordinates: 6, 39, −15 for the orbital prefrontal cortex). Negative contrast estimates, such as observed among S allele carriers (S′), indicate decreased functional connectivity with the amygdala in self versus label condition. Positive contrast estimates, such as observed among individuals homozygous for the L allele (L′), indicate increased functional connectivity with the amygdala in self versus label condition. [Color figure can be viewed in the online issue, which is available at wileyonlinelibrary.com.]
Although the PPI between the left amygdala activity and the condition (self vs. label) did not differ significantly across genotype in our ROI, there was a similar interaction in close vicinity to the subgenual ACC within the orbital prefrontal cortex [351 mm3; MNI coordinates: 6, 39, −15; t (1,41) = 4.23; P = 0.0001, uncorrected], as revealed by a whole brain analysis using a more liberal threshold (P < 0.001, uncorrected) (see Fig. 3). This whole‐brain analysis identified only one other cluster that displayed the same pattern of functional connectivity, located within the left insula [162 mm3; MNI coordinates: −30, −36, 18; t (1,41) = 4.41; P < 0.0001, uncorrected].
DISCUSSION
This study aimed to examine the effects of cognitive appraisal and self‐reported life stress effects in moderating the influence of the 5‐HTTLPR polymorphism on amygdala reactivity to emotional stimuli. Consistent with recent findings [Gillihan et al.,2010; Schardt et al., in press], the right amygdala activation was driven by a genotype × condition interaction, S allele carriers displaying an increased activation in self‐referential processing versus emotion labeling and individuals homozygous for the L allele displaying the opposite pattern. On the basis of the earlier findings by Canli et al. [2006] showing that the association between life stress and rumination was positive in S allele carriers, but negative in individuals homozygous for the L allele, we also postulated that life stress would minimize the differences between the two conditions in S allele carriers, due to an increasing amount of unsolicited self‐referential processing during emotion labeling, whereas it would maximize these differences in individuals homozygous for the L allele, due to the opposite mechanism. Accordingly, there was a genotype × condition × stress interaction in bilateral amygdala the amygdala activation during self‐referential processing was negatively correlated with self‐reported life stress in S allele carriers and positively in individuals homozygous for the L allele, whereas an opposite pattern was observed during emotion labeling. Although many previous studies used only negative stimuli [Hariri et al.,2005; Williams et al.,2009], the absence of any interaction between genotype and valence regarding amygdala reactivity is not uncommon [Canli et al.,2006; Dannlowski et al.,2008]. Altogether, the present results suggest that the influence of the 5‐HTTLPR polymorphism on amygdala reactivity is moderated by both life stress and “top–down” processes.
The genotype × condition interaction within the right amygdala is consistent with the previously demonstrated influence of genotype [Munafò et al.,2008], cognitive appraisal [Hariri et al.,2003; Yoshimura et al.,2008], and the interaction of both [Gillihan et al.,2010; Schardt et al., in press] on amygdala reactivity. It is noteworthy that no other brain region displayed the same pattern of activation, suggesting that this effect might be specific to the right amygdala rather than a brain‐wide phenomenon. The lateralization is consistent with the study of Schardt et al. [in press] that found cognitive appraisal to moderate of the effect of genotype on right amygdala only. The 5‐HTTLPR polymorphism was previously found to affect various cognitive processes such as fear conditioning, response inhibition, or decision‐making [Clark et al.,2005; Garpenstrand et al.,2001; Roiser et al.,2006]. The demonstration that amygdala reactivity is increased in S allele carriers even for masked emotional stimuli (i.e., stimuli that are not consciously perceived) strongly suggest that genotype may influence cognition through “bottom–up” processes [Dannlowski et al.,2008]. Nevertheless, our results add to recent evidence that the influence of the 5‐HTTLPR genotype is at least partially under “top–down” control [Gillihan et al.,2010; Schardt et al., in press].
In the context of emotion regulation, “top–down” processes are likely to involve a cortical–limbic network including the amygdala and the prefrontal cortex [Ochsner and Gross,2005]. Accordingly, post hoc PPI analyses revealed that functional connectivity between the amygdala and ventral regions within the medial prefrontal cortex (MPFC) (either the subgenual ACC or the adjacent part of the orbital prefrontal cortex) increased during self‐referential processing in L′ subject, whereas it tended to decrease in S′ subjects. These results are in line with previous evidence for an influence of the 5‐HTTLPR polymorphism on the functional connectivity between the amygdala and the subgenual ACC [Pezawas et al.,2005; Schardt et al., in press]. They are especially consistent with the increased functional connectivity between the right amygdala and the subgenual ACC during emotion regulation (vs. unconstrained emotional processing) in S allele carriers [Schardt et al., in press], a condition that may share some characteristics with emotion labeling in the present study (i.e., promoting detachment and preventing self‐referential‐processing). However, because self‐referential processing may increase emotional intensity and amygdala reactivity [Ochsner and Gross,2005; Yoshimura et al.,2008], it may also warrant concurrent emotion regulation through increasing cortical–limbic connectivity. Our PPI results suggest that such concurrent emotion regulation may be observed at a brain level in L′ subjects but not in S′ subjects, possibly reflecting a better adaptation to cognitive processes that involve an increase of emotional intensity.
The ventral MPFC, including the subgenual ACC and the medial part of the orbital prefrontal cortex, plays a critical role in the pathophysiology of major depression [Drevets et al.,2008; Mayberg et al.,2005]. Interestingly, an aberrant coupling between the ventral MPFC and the amygdala is observed in depressed patients during emotion regulation [Johnstone et al., 2007]. However, the subgenual ACC and the orbital prefrontal cortex differ at a cytoarchitectonic and functional level [Drevets et al.,2008]. Therefore, although the PPI between cognitive appraisal and the left amygdala was significant in an orbital prefontal region close to the subgenual ACC and oriented in the same direction than the PPI for the right amygdala, one should not assume that these two results have the same functional meaning. Indeed, the lack of a significant PPI between cognitive appraisal and left amygdala within the subgenual ACC may explain why we did not observe a genotype × condition interaction in the left amygdala.
The influence of genotype on amygdala reactivity was not only moderated by “top–down” processes such as cognitive appraisal, but also by self‐reported life stress. Canli et al. [2006] and Williams et al. [2009] previously found the amygdala activation (at baseline and during unconscious fear processing, respectively) to be positively correlated with self‐reported life stress in S allele carriers, but negatively in individuals homozygous for the L allele. Using a well‐validated semistructured interview to measure life stress exposure [Paykel et al.,1971], we observed an additional moderation by cognitive appraisal, resulting in a genotype × condition × stress interaction. This interaction was in the same direction as in the study by Canli et al. [2006], when these investigators considered an active processing condition (i.e., gender recognition). Also consistent with this earlier study, there were only few other brain regions that displayed the same pattern of activation, including the hippocampus. Although there are differences between amygdala and hippocampus regarding stress‐induced structural changes (dendritic hypertrophy vs. atrophy), as well as in their role in regulating stress responses (upregulation vs. downregulation), both are key regions in integrating life stress at a brain level [Fossati et al.,2004; Vyas et al.,2002]. Our results are also in line with evidence for an association between the S allele and exaggerated responses of the hypothalamic‐pituitary‐adrenal axis to stress [Barr et al.,2004], which is likely to mediate stress‐induced structural changes in amygdala and hippocampus [Fossati et al.,2004].
Although the genotype × condition × stress interaction was in the expected direction, it seemed to rely on both conditions, rather than only on the label condition as predicted by our initial hypothesis of a various amount of unsolicited self‐referential processing during emotion labeling. Unfortunately, post hoc statistical tests were underpowered to disambiguate the dependence of this interaction upon one condition rather than the other or both. Our findings should therefore be interpreted with caution, taking into account both conditions in a wider perspective. Indeed, correlation coefficients suggest that both conditions contributed to the observed interaction. Therefore, a more comprehensive hypothesis is needed. Regarding the contribution of the self condition, increasing amygdala activation at baseline in S′ subjects experiencing higher levels of stress, such as previously showed by Canli et al. [2006], may have decreased the effect of emotional engagement associated with the self condition, resulting in less differential amygdala activation. Opposite effects in L′ subjects may cohere with better adaptation to stress, with an increasing activation in self condition and a decreasing activation in label condition that may reflect better cognitive control of emotion (i.e., a better ability to use cognitive appraisal to either increase or decrease the emotion elicited by a given stimulus). Further experiments are needed to understand how life stress may interact with genetically driven cortical–limbic connectivity patterns such as those highlighted by PPI results.
Finally, our results suggest that differential exposure to life stress may account for previous discrepant results in neuroimaging studies addressing these “top–down” processes [Gillihan et al.,2010; Schardt et al., in press]. For instance, splitting the present sample according to the median score of life stress, one may observe self‐referential processing (vs. emotion labeling) to be associated with a rather increased amygdala activation in S′ versus L′ subjects among less stressed individuals, but the opposite among more stressed individuals.
Some limitations should be acknowledged. First, because we only measured life stress exposure regarding the preceding 12 months, we were unable to determine whether the impact of the 5‐HTTLPR polymorphism on amygdala activation has been influenced by earlier stress exposure during development life, as suggested in animal studies [Barr et al.,2004]. Second, according to the meta‐analysis by Munafò et al. [2008], our study may have been underpowered to identify other significant effects of the 5‐HTTLPR polymorphism. However, this risk of type 2 error does not challenge the significance of our results, which were obtained through hypothesis‐driven ROI analyses using a corrected statistical threshold. Finally, the current contrasts confound the nature of the condition (self‐referential processing or emotion labeling vs. indoor/outdoor categorization) with the nature of the stimuli (emotional vs. neutral). This choice, which does not invalidate the findings reported in this study, was done to minimize the likelihood of unsolicited self‐referential processing or emotion labeling during the control condition.
In conclusion, the present results are consistent with previous studies suggesting that amygdala reactivity to emotional stimuli may depend upon both the 5‐HTTLPR polymorphism [Munafò et al.,2008], self‐reported life stress [Canli et al.,2006], and cognitive appraisal [Hariri et al.,2003] including self‐referential processing [Yoshimura et al.,2009]. However, they provide first evidence that all these factors may interact with each other rather than being purely additive. First, they confirm that the influence of the 5‐HTTLPR polymorphism on amygdala reactivity is at least partially under cognitive control. Second, they suggest that measuring life stress exposure is a critical step when imaging genetics.
Acknowledgements
We thank F. Bozec and F. Fruchard for helping in stimuli selection, E. Bardinet, E. Bertasi, K. Nigaud, and R. Valabrègue for assistance with fMRI scanning, and H. S. Mayberg for comments on the manuscript. P. Fossati is supported by a NARSAD Young Investigator Award 2003. None of the authors has conflicts of interest to report.
REFERENCES
- Barr CS, Newman TK, Shannon C, Parker C, Dvoskin RL, Becker ML, Schwandt M, Champoux M, Lesch KP, Goldman D, Suomi SJ, Higley JD ( 2004): Rearing condition and rh5‐HTTLPR interact to influence limbic‐hypothalamic‐pituitaryadrenal axis response to stress in infant macaques. Biol Psychiatry 55: 733–738. [DOI] [PubMed] [Google Scholar]
- Canli T, Qiu M, Omura K, Congdon E, Haas BW, Amin Z, Herrmann MJ, Constable RT, Lesch KP ( 2006): Neural correlates of epigenesis. Proc Natl Acad Sci USA 103: 16033–16038. [DOI] [PMC free article] [PubMed] [Google Scholar]
- Caspi A, Moffit TE ( 2006): Gene‐environment interactions in psychiatry: Joining forces with neuroscience. Nat Rev Neurosci 7: 583–590. [DOI] [PubMed] [Google Scholar]
- Caspi A, Sugden K, Moffitt TE, Taylor A, Craig IW, Harrington H, McClay J, Mill J, Martin J, Braithwaite A, Poulton R ( 2003): Influence of life stress on depression: Moderation by a polymorphism in the 5‐HTT gene. Science 301: 386–389. [DOI] [PubMed] [Google Scholar]
- Clark L, Roiser JP, Cools R, Rubinsztein DC, Sahakian BJ, Robbins TW ( 2005): Stop signal response inhibition is not modulated by tryptophan depletion or the serotonin transporter polymorphism in healthy volunteers: Implications for the 5‐HT theory of impulsivity. Psychopharmacology 182: 570–578. [DOI] [PubMed] [Google Scholar]
- Dannlowski U, Ohrmann P, Bauer J, Deckert J, Hohoff C, Kugel H, Arolt V, Heindel W, Kersting A, Baune BT, Suslow T ( 2008): 5‐HTTLPR biases amygdala activity in response to masked facial expressions in major depression. Neuropsychopharmacology 33: 418–424. [DOI] [PubMed] [Google Scholar]
- Drevets WC, Price JL, Furey ML ( 2008): Brain structural and functional abnormalities in mood disorders: Implications for neurocircuitry models of depression. Brain Struct Funct 213: 93–118. [DOI] [PMC free article] [PubMed] [Google Scholar]
- Fossati P, Radtchenko A, Boyer P ( 2004): Neuroplasticity: From MRI to depressive symptoms. Eur Neuropsychopharmacol 14 ( Suppl 5): S503–S510. [DOI] [PubMed] [Google Scholar]
- Friston KJ, Fletcher P, Josephs O, Holmes A, Rugg MD, Turner R ( 1998): Event‐related fMRI: Characterizing differential responses. NeuroImage 7: 30–40. [DOI] [PubMed] [Google Scholar]
- Garpenstrand H, Annas P, Ekblom J, Oreland L, Fredrikson M ( 2001): Human fear conditionning is related to dopaminergic and serotoninergic biological markers. Behav Neurosci 115: 358–364. [PubMed] [Google Scholar]
- Geday J, Gjedde A, Boldsen AS, Kupers R ( 2003): Emotional valence modulates activity in the posterior fusiform gyrus and inferior medial prefrontal cortex in social perception. NeuroImage 18: 675–684. [DOI] [PubMed] [Google Scholar]
- Gillihan SJ, Rao H, Wang J, Detre JA, Breland J, Sankoorikal GMV, Brodkin ES, Farah MJ ( 2010): Serotonin transporter genotype modulates amygdala activity during mood regulation. Soc Cogn Affect Neurosci 5: 1–10. [DOI] [PMC free article] [PubMed] [Google Scholar]
- Gitelman DR, Penny WD, Ashburner J, Friston KJ ( 2003): Modeling regional and psychophysiologic interactions in fMRI: The importance of hemodynamic deconvolution. NeuroImage 19: 200–207. [DOI] [PubMed] [Google Scholar]
- Hariri AR, Bookheimer SY, Mazziotta JC ( 2000): Modulating emotional responses: Effects of a neocortical network on the limbic system. Neuroreport 11: 43–48. [DOI] [PubMed] [Google Scholar]
- Hariri AR, Mattay VS, Tessitore A, Fera F, Weinberger DR ( 2003): Neocortical modulation of the amygdala response to fearful stimuli. Biol Psychiatry 53: 494–501. [DOI] [PubMed] [Google Scholar]
- Hariri AR, Drabant EM, Munoz KE, Kolachana BS, Mattay VS, Egan MF, Weinberger DR ( 2005): A susceptibility gene for affective disorders and the response of the human amygdala. Arch Gen Psychiatry 62: 146–152. [DOI] [PubMed] [Google Scholar]
- Heinz A, Braus DF, Smolka MN, Wrase J, Puls I, Hermann D, Klein S, Grüsser SM, Flor H, Schumann G, Mann K, Büchel C ( 2005): Amygdala‐prefrontal coupling depends on a genetic variation of the serotonin transporter. Nat Neurosci 8: 20–21. [DOI] [PubMed] [Google Scholar]
- Lang PJ, Bradley MM, Cuthbert BN ( 1997): International Affective Picture System (IAPS): Technical Manual and Affective Ratings, NIMH Center for the Study of Emotion and Attention, University of Florida, Gainesville, USA.
- Lemogne C, le Bastard G, Mayberg HS, Volle E, Bergouignan L, Lehéricy S, Allilaire JF, Fossati P ( 2009): In search of the depressive self: Extended medial prefrontal network during self‐referential processing in major depression. Soc Cogn Affect Neurosci 4: 305–312. [DOI] [PMC free article] [PubMed] [Google Scholar]
- Lemogne C, Mayberg H, Bergouignan L, Volle E, Delaveau P, Lehéricy S, Allilaire JF, Fossati P ( 2010): Self‐referential processing and the prefrontal cortex over the course of depression: A pilot study. J Affect Disord 124: 196–201. [DOI] [PubMed] [Google Scholar]
- Lemogne C, Gorwood P, Bergouignan L, Pélissolo A, Lehéricy S, Fossati P (2011): Negative affectivity, self‐referential processing, and the cortical midline structures. Soc Cogn Affect Neurosci 6: 426–433. [DOI] [PMC free article] [PubMed] [Google Scholar]
- Maldjian JA, Laurienti PJ, Burdette JB, Kraft RA ( 2003): An automated method for neuroanatomic and cytoarchitectonic atlas‐based interrogation of fMRI data sets. NeuroImage 19: 1233–1239. [DOI] [PubMed] [Google Scholar]
- Mayberg HS, Lozano AM, Voon V, McNeely HE, Seminowicz D, Hamani C, Schwalb JM, Kennedy SH ( 2005): Deep brain stimulation for treatment‐resistant depression. Neuron 45: 651–660. [DOI] [PubMed] [Google Scholar]
- Mor N, Winquist J ( 2002): Self‐focused attention and negative affect: A metaanalysis. Psychol Bull 128: 638–662. [DOI] [PubMed] [Google Scholar]
- Munafò MR, Brown SM, Hariri AR ( 2008): Serotonin transporter (5‐HTTLPR) genotype and amygdala activation: A meta‐analysis. Biol Psychiatry 63: 852–857. [DOI] [PMC free article] [PubMed] [Google Scholar]
- Munafò MR, Durrant C, Lewis G, Flint J ( 2009a): Gene X environment interactions at the serotonin transporter locus. Biol Psychiatry 65: 211–219. [DOI] [PubMed] [Google Scholar]
- Munafò MR, Freimer NB, Ng W, Ophoff R, Veijola J, Miettunen J, Järvelin MR, Taanila A, Flint J ( 2009b): 5‐HTTLPR genotype and anxiety‐related personality traits: A meta‐analysis and new data. Am J Med Genet B Neuropsychiatr Genet 150: 271–281. [DOI] [PMC free article] [PubMed] [Google Scholar]
- Nakamura M, Ueno S, Sano A, Tanabe H ( 2000): The human serotonin transporter gene linked polymorphism (5‐HTTLPR) shows ten novel allelic variants. Mol Psychiatry 5: 32–38. [DOI] [PubMed] [Google Scholar]
- Nolen‐Hoeksema S ( 1991): Responses to depression and their effects on the duration of depressive episodes. J Abnorm Psychol 100: 569–582. [DOI] [PubMed] [Google Scholar]
- Ochsner KN, Gross JJ ( 2005): The cognitive control of emotion. Trends Cogn Sci 9: 242–249. [DOI] [PubMed] [Google Scholar]
- Paykel ES, Prusoff B, Uhlenhuth E ( 1971): Scaling of life events. Arch Gen Psychiatry 25: 340–347. [DOI] [PubMed] [Google Scholar]
- Pezawas L, Meyer‐Lindenberg A, Drabant EM, Verchinski BA, Munoz KE, Kolachana BS, Egan MF, Mattay VS, Hariri AR, Weinberger DR ( 2005): 5‐HTTLPR polymorphism impacts human cingulate‐amygdala interactions: A genetic susceptibility mechanism for depression. Nat Neurosci 8: 828–834. [DOI] [PubMed] [Google Scholar]
- Risch N, Herrell R, Lehner T, Liang KY, Eaves L, Hoh J, Griem A, Kovacs M, Ott J, Merikangas KR ( 2009): Interaction between the serotonin transporter gene (5‐HTTLPR), stressful life events, and risk of depression: A meta‐analysis. JAMA 301: 2462–2471. [DOI] [PMC free article] [PubMed] [Google Scholar]
- Roiser JP, Rogers RD, Cook LJ, Sahakian BJ ( 2006): The effect of polymorphism at the serotonin transporter gene on decision‐making, memory and executive function in ecstasy users and controls. Psychopharmacology 188: 213–227. [DOI] [PMC free article] [PubMed] [Google Scholar]
- Sander D, Grafman J, Zalla T ( 2003): The human amygdala: An evolved system for relevance detection. Rev Neurosci 14: 303–316. [DOI] [PubMed] [Google Scholar]
- Schardt DM, Erk S, Nüsser C, Nöthen MM, Cichon S, Rietschel M, Treutlein J, Goschke T, Walter H: Volition diminishes genetically mediated amygdala hyperreactivity. NeuroImage (in press). [DOI] [PubMed] [Google Scholar]
- Sheehan DV, Lecrubier Y, Sheehan KH, Amorim P, Janavs J, Weiller E, Hergueta T, Baker R, Dunbar GC ( 1998): The Mini‐International Neuropsychiatric Interview (M.I.N.I.): The development and validation of a structured diagnostic psychiatric interview for DSM‐IV and ICD‐10. J Clin Psychiatry 59 ( Suppl 20): 22–33. [PubMed] [Google Scholar]
- Tzourio‐Mazoyer N, Landeau B, Papathanassiou D, Crivello F, Etard O, Delcroix N, Mazoyer B, Joliot M ( 2002): Automated anatomical labeling of activations in SPM using a macroscopic anatomical parcellation of the MNI MRI single‐subject brain. NeuroImage 15: 273–289. [DOI] [PubMed] [Google Scholar]
- Uher R, McGuffin P ( 2010): The moderation by the serotonin transporter gene of environmental adversity in the etiology of depression: 2009 update. Mol Psychiatry 15: 18–22. [DOI] [PubMed] [Google Scholar]
- Vyas A, Mitra R, Rao BSS, Chattarji S ( 2002): Chronic stress induces contrasting patterns of dendritic remodeling in hippocampal and amygdaloid neurons. J Neurosci 22: 6810–6818. [DOI] [PMC free article] [PubMed] [Google Scholar]
- Williams LM, Gatt JM, Schofield PR, Olivieri G Peduto A, Gordon E ( 2009): ‘Negativity bias’ in risk for depression and anxiety: Brain‐body fear circuitry correlates, 5‐HTT‐LPR and early life stress. NeuroImage 47: 804–814. [DOI] [PubMed] [Google Scholar]
- Yoshimura S, Ueda K, Suzuki S, Onoda K, Okamoto Y, Yamawaki S ( 2009): Self‐referential processing of negative stimuli within the ventral anterior cingulate gyrus and right amygdala. Brain Cogn 69: 218–225. [DOI] [PubMed] [Google Scholar]