

Abstract
Patients with post‐traumatic stress disorder (PTSD) suffer from a failure of cognitive control over emotional distracters. The physiological substrates of cognitive‐emotional interactions and their breakdown in disease are, however, unknown. Here, we studied brain activity in PTSD patients and healthy controls in response to emotion‐provoking pictures using electroencephalography and functional magnetic resonance imaging (fMRI). We demonstrate that in healthy individuals, emotion‐induced frontal theta rhythm modulates activity in the beta rhythm mainly in sensory‐motor regions. In contrast, in PTSD patients, beta activity is elevated irrespective of emotion, and is not modulated by frontal theta activity in response to negative emotion. EEG source localization and fMRI findings suggest that theta activity is localized to the prefrontal and anterior cingulate cortices while beta activity is localized to sensory‐motor regions. We further found that beta activity in sensory‐motor regions is related to the emotion‐induced slowing of the motor response in healthy controls while the excess frontal theta activity in PTSD is related to the intensity of negative emotional experience. These findings reveal for the first time the importance of brain electrical oscillations and coherence in emotional top‐down modulation and point to specific failure of these mechanisms in PTSD. Hum Brain Mapp, 2013. © 2012 Wiley Periodicals, Inc.
Keywords: post‐traumatic stress disorder, brain rhythm, electroencephalography, emotion, functional magnetic resonance imaging, theta
INTRODUCTION
Emotions are conscious mental reactions subjectively experienced as strong feelings usually directed toward a specific object and typically accompanied by physiological and behavioral changes in the body [Merriam‐Webster, 2011]. From an evolutionary perspective, emotions are modes of functioning that increase the ability to meet adaptive challenges [Nesse and Ellsworth, 2009]. Interactions between emotion and cognition are central to our ability to cope with stressful life events. Emotional stimuli modulate attention and perception [Vuilleumier, 2005] assigning extra importance to threatening situations, while attention and purposeful cognitive effort can alter emotional processing [Ochsner and Gross, 2005] allowing goal directed overcoming of emotional distracters; failure of the fine balance between cognition and emotion may contribute to psychopathology. One case of psychopathology is post‐traumatic stress disorder (PTSD); a mental condition arising subsequent to traumatic life events, characterized by re‐experiencing of the trauma, avoidance of trauma associated stimuli, and hyperarousal [DSM‐IV, 2000]. PTSD patients exhibit abnormal emotional processing with increased responsiveness and interference by stimuli of negative valence [Mueller‐Pfeiffer et al., 2010].
Although it is known that classical “cognitive brain regions” are affected by emotional stimuli and “emotional regions” by cognitive stimuli, functional magnetic resonance imaging (fMRI) experiments have shown that there are specific regions, including the prefrontal cortex (PFC) [specifically, the anterior cingulate cortex (ACC), ventromedial PFC, and dorsolateral PFC] that are activated by tasks involving interactions between emotional and cognitive aspects [Pessoa, 2008]. Indeed, in a recent fMRI study [Eldar et al., 2007], we demonstrated increased lateral PFC activation in response to emotional stimuli. However, the low time resolution of the blood oxygenation level‐dependent (BOLD) response in fMRI studies in comparison to brain electrical activity, which changes within the millisecond range, precludes inspection of interactions between these processes within these brain regions on a more detailed time‐scale.
Emotional valence has been shown to modulate event‐related potentials (ERP) measured using scalp electrodes [Olofsson et al., 2008], specifically in sensory‐related brain regions [Schupp et al., 2006]. Recent findings, however, highlight the importance of the frequency components of brain electrical activity [Hummel and Gerloff, 2006]. Initial studies of emotion induced non‐time‐locked frequency response reported a decrease in alpha band power and an increase in beta band activation. Further work demonstrated emotion induced higher frequency activity (>20 Hz) specifically in the right hemisphere in time‐locked analyses paralleling ERP studies [reviewed in Keil, 2006]. A role for theta synchronization has also been reported. For example, Aftanas et al. [ 2001] who report increased theta event related synchronization (ERS) to negative stimuli over right anterior and for positive stimuli over left anterior brain regions. Attention and higher cognitive function have been commonly associated with higher frequency synchronization (i.e., high‐beta and gamma bands) although a role for theta and specifically for theta‐gamma coherence has been reported as well [reviewed in Jensen et al., 2007; Wang, 2010]. Indeed, cross regional synchronization in general and cross low‐to‐high frequency modulation in particular have been shown to be important for facilitating functional brain connectivity [Canolty et al., 2006; Jensen and Colgin, 2007]. In affective research, Miskovic and Schmidt [ 2010] reported increased inter‐frequency coherence in the 14–30 Hz range between prefrontal and posterior scalp regions in response to emotionally arousing stimuli.
To explore the neural correlates and specifically the frequency contributions to emotional processing, we measured brain activation in response to real‐life visual emotional stimuli viewed during a choice response task; focusing on the frequency components of the electrical brain response obtained from scalp EEG. This temporal domain of emotional brain activity was further characterized for spatial localization via fMRI and for behavioral significance based on task reaction time. A nonemotional choice response task was chosen to probe emotional interference with task performance [Keil, 2006] and highlight the interactions between emotion and cognition. We tested both healthy subjects and PTSD patients to ascertain the significance of our findings for “normal” emotional processing and explore the neural basis of its breakdown in psychopathology. We predicted that known ERP components reflecting emotional processing would be reflected in the frequency domain; specifically in the theta and beta‐gamma bands that have been implicated in emotional response. We further predicted that this activity would localize to visual and prefrontal regions reflecting the reciprocal bottom‐up and top‐down processes involved in emotion‐cognition interactions. We hypothesized that cross frequency coherence is a mechanism for functional network connectivity, specifically of emotion‐cognition related networks. Finally, we predicted that in PTSD patients scalp electrical activity and BOLD signal would reflect an exaggerated emotional response, an inappropriate behavioral one and failure of network connectivity.
METHODS AND MATERIALS
Subjects
A total of 25 PTSD patients (diagnosed via clinical interview) took part in this study, from whom a subset with extremely severe PTSD (as determined by a CAPS score exceeding 80, [Weathers et al., 2001]) was selected for this analysis for the sake of homogeneity, 14 for EEG and 10 for fMRI analysis (Table I for details). Exclusion criteria included any significant head trauma, preexisting neuropsychiatric disorders, or previous use of medication or illicit drugs affecting the central nervous system. We recruited 14 healthy subjects (mean age: 26.1 ± 3.3, education years: 15.6 ± 2.1, 9 males) for EEG recordings and 10 (30.6 ± 2.4 mean age, 18 ± 0.6 yr education, 6 males) for fMRI. All procedures were approved by the Soroka University Medical Center institutional review board. Written informed consent was obtained from all participants.
Table I.
PTSD population characteristics
| Subject | Age (years) | Sex | CAPS score | Trauma | Time since trauma | Pharmacotherapy | EEG | fMRI |
|---|---|---|---|---|---|---|---|---|
| 1 | 45 | M | 115 | Work accident | 8 months | Vanlafaxine, Carbamazepine | √ | √ |
| 2 | 24 | M | 110 | Fall from height | 2 months | – | √ | √ |
| 3 | 24 | M | 127 | MVA | 3 months | – | √ | √ |
| 4 | 27 | M | 92 | Combat‐related | 1 year | – | √ | √ |
| 5 | 37 | M | 82 | Assault | 45 months | – | √ | √ |
| 6 | 22 | F | 82 | MVA | 3.5 months | – | √ | |
| 7 | 48 | M | 97 | MVA | 13 months | Paroxetine, Oxazepam, Oxycodone | √ | √ |
| 8 | 37 | M | 98 | MVA | 4 months | Brotizolam | √ | |
| 9 | 51 | M | 102 | Fall from height | 13 years | Vanlafaxine, Diazepam, Valproic acid | √ | |
| 10 | 30 | F | 85 | MVA | 12 months | – | √ | |
| 11 | 23 | M | 102 | MVA | 16 months | Paroxetine | √ | √ |
| 12 | 25 | M | 84 | Combat‐related | 31 months | – | √ | √ |
| 13 | 40 | F | 90 | MVA | 8 months | – | √ | |
| 14 | 18 | F | 86 | MVA | 8 months | – | √ | |
| 15 | 44 | M | 94 | Assault | 25 months | Escitalopram | √ | |
| 16 | 27 | F | 103 | MVA | 1 month | Brotizolam | √ |
CAPS = Clinician‐ Administered PTSD Scale; MVA = motor vehicle accident.
Emotion Paradigm
Pictures from the international affective picture system (IAPS [Lang et al., 2001]) ranked on a valence scale [from one (positive) to nine (negative)] were sorted into three groups: positive, negative, or neutral emotional content (Supporting Information Table I for a list of pictures). These pictures are widely employed in affective behavioral and neurophysiological studies. Two sets of pictures were created (version A: valence scores of 7.32 ± 0.08, 2.84 ± 0.12, and 4.98 ± 0.05; version B: 7.31 ± 0.11, 2.78 ± 0.12, and 4.97 ± 0.08 for negative, positive, and neutral groups, respectively). For subjects examined with both fMRI and EEG, versions were alternated. The experiment consisted of four runs, each consisting of three blocks, one for each emotional valence [negative, positive, and neutral]. Within blocks, eight pictures were presented for 1.5 s each followed by 0.5 s of a black screen. Each emotional block was preceded by a fixation block in which a cross was presented eight times, again for 1.5 s each, with a 0.5 s interval (Fig. 1A). Block order was randomized within runs. A block design was chosen to accommodate fMRI analysis but is suitable also for ERP studies as electrocortical responses to affective stimuli have been shown to be robust across wide experimental conditions [Schupp et al., 2006]. Subjects performed a choice response task in which they were instructed to press one of two buttons using their right hand depending on the presence or absence of a person or human part in the picture. Stimuli were presented and responses collected using E‐prime 1.1 software. Following EEG and/or fMRI acquisition, subjects ranked viewed pictures for valence using the self‐assessment manikin scale of one (positive) to nine (negative).
Figure 1.
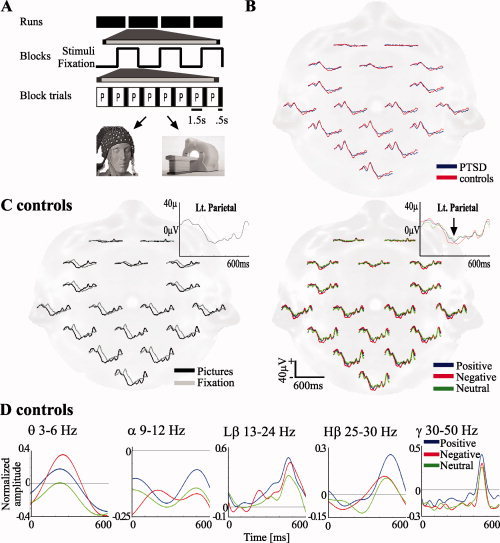
A: Experimental design. Pictures were presented in a block design comprising four runs, each containing three blocks, one of each valence (positive, negative, and neutral) in a pseudo‐randomized order. Each block was preceded by a fixation block. In each block, eight pictures or fixation crosses were presented for 1.5 s, followed by 0.5 s of a black screen each time. B: Visual ERPs in control and PTSD subjects in response to the fixation cross. C: ERPs in control subjects in response to pictures versus fixation (left) and by stimulus emotional valence (right). Insets: enlarged traces. Arrow: negative emotion associated increased negative deflection. D: Averaged (all electrodes) ERS to emotional stimuli at the different frequency bands.
EEG Acquisition
EEGs were collected on a 128‐channel digital acquisition unit (CEEGRAPH IV, Biological Systems Corp., Mundelein, IL) employing a 64‐ (58 EEG) electrode cap (Electro‐Cap, Eaton, OH), as described previously [Korn et al., 2005], sampling rate was 256 Hz, online filtering was performed between 0.1 and 100 Hz. An additional channel registered onset of stimuli via an optocoupler box built in‐house. Subjects were seated at a distance (from the eyes) of 1.5 m from a 15‐inch computer screen.
EEG Analysis
Unless otherwise stated, analysis was performed using in‐house prepared Matlab scripts ([2007b] MathWork, Natick, MA). EEG segments were inspected visually for gross artifacts and in their absence cut according to experimental blocks and sorted in to the corresponding emotional groups. Electrodes in adjacent anatomical regions were averaged to generate 17 scalp regions (for list of electrodes see Supporting Information Table II; for source localization analysis the complete set of electrodes was employed).
Time domain analysis
For conventional ERP analysis, data was band‐pass filtered at 1–30 Hz. Valence specific, stimulus time‐locked segments were averaged within subjects and resultant ERPs were subject to statistical analysis across subjects and valence.
Frequency domain analysis
EEG data was band‐pass filtered using a zero‐phase least square linear phase finite impulse response (FIR) digital filter (FIRLS command in Matlab), with a filter order of 300. Due to filter‐introduced artifacts at the extremities of the data, the first and last 2 s of each 16 s filtered segment (i.e., each experimental block) were omitted. Filtered bands were as follows: theta (θ) 3–6 Hz, alpha (α) 9–12 Hz, low‐beta (Lβ) 13–24 Hz, high‐beta (Hβ) 25–30 Hz, and gamma (γ) 31–50 Hz. Band passed data was subsequently subjected to the Hilbert transform and the result squared to produce curves of time varying instantaneous power (signal envelope power). Stimulus time‐locked segments were then averaged to yield event‐related synchronization/desynchronization (ERS/ERD [Clochon et al., 1996]) data.
Statistical analysis
To normalize data across subjects, for each subject the base 10 logarithm of the ratio between pairs of valence (i.e., the negative to neutral ratio) was computed for the ERS's for each electrode and band. One‐sample t‐tests were then performed for each time point and region to determine statistical significance of ERS differences. Such differences were deemed significant if the P value was below 0.05. To avoid error from randomly generated low P values related to multiple comparisons, results were regarded as significant only when at least five contiguous time points were statistically significant. This threshold leads to a 0.00079 probability of type I error (0.05 ∧ 5 [probability of 5 contiguous errors] × 150[number of five contiguous points in the 600 ms time window] × 17 [regions]).
Amplitude coherence analysis
Short time cross correlation (STCC) was calculated to search for coherence between the amplitudes of frequency responses based on a previously described method [Zygierewicz et al., 2006]. Briefly, STCC between ERS's in the beta and theta frequency bands was calculated in each subject for each pair of scalp regions, and in each emotional condition with a time window of ˜312 ms (80 samples) and overlap of ˜156 ms (40 samples). STCC was averaged across neighboring segments to yield a mean STCC for the 150–300, 300–450, and 450–600 ms time intervals. An R value exceeding 0.7 was taken to indicate a significant correlation and designated as such in binary terms. STCC was computed for 50 positive and 50 negative lags (lag = one sample point); subsequently each 10 lags were averaged. Finally, to test for emotion‐induced alterations in STCC, a nonparametric Monte Carlo based test was employed comparing STCC between emotional conditions [Durka et al., 2004; Nichols and Holmes, 2002].
Source localization
Source estimation was performed using sLORETA software [Pascual‐Marqui, 2002] as described previously [Browne et al., 2006]. Briefly, subject frequency and valence specific mean ERS/ERDs were transformed into the sLORETA domain, than averaged across subjects within each experimental group. Localization of power was then determined for time windows determined to differ significantly between conditions in the temporal statistical analysis.
Functional MRI Acquisition
A 1.5‐tesla MRI instrument was employed (Intera, Philips Medical Systems, Best, The Netherlands). BOLD signals were collected employing a gradient echo EPI sequence (21 axial slices covering the whole cerebrum; TR = 2,000 ms; TE = 40–50 ms; FA = 90°; FOV = 220 mm, voxel size: 1.72/3.6 × 1.72/3.6 × 5 mm2). Stimuli were presented employing the Integrated Functional Imaging System (MRI Devices Corporation, Waukesha, WI).
Functional MRI Analysis
The Statistical Parametric Mapping software package, SPM2 (Wellcome Department of Imaging Neuroscience, London, UK) with Matlab 7.0.4 was employed. Functional images were superimposed onto the 3D data sets through trilinear interpolation and transformed into MNI space with a voxel size of 3 × 3 × 3 mm. Preprocessing included high‐pass filtering and assessment for head movement. To allow for T2* equilibration effects, the first six images of each scan were rejected. Data was spatially smoothed (FWHM: 6 mm) and a hemodynamic lag of 6 s was assumed and verified for each subject. Whole brain statistical analysis was based on the general linear model (GLM) in which voxels showing sensitivity to stimuli as compared to fixation, were included. Based on the separate calculation for each subject, a 3D statistical parametric map was created using multi‐study GLM statistics.
RESULTS
Negative Emotional Stimuli Lead to Specific Temporal and Spatial Brain Responses That Are Altered In PTSD Patients
In accordance with others [e.g., Odom et al., 2004] The ERPs to presentation of a “fixation condition” were comprised of two positive deflections peaked at ˜90 and 200 ms and two negative ones at ˜140 and ˜360 ms post‐stimulus onset (Fig. 1B). No significant differences were found between healthy controls and PTSD patients in these responses.
To identify regional and temporal aspects of electrical responses specifically related to the processing of pictures, we compared ERPs from healthy controls in response to picture presentations with ERPs in response to the fixation condition. Most prominent in occipital electrodes, pictures induced an increased positivity at ˜90 ms after stimulus presentation, and an earlier and larger negative voltage deflection between 170 and 390 ms, peaking at ˜300 ms, compared to 360 ms in the fixation condition. The large negative potential was followed by two positive deflections between ˜400 and 600 ms not present in the fixation condition (Fig. 1C). Within picture groups, we found that negative emotional pictures generated ERPs with excess negativity in the early 200–400 ms post‐stimulus interval as compared to neutral and positive emotional stimuli (Fig. 1C). These findings, correspond to early posterior negativity peaking at ˜250–300 ms as reflecting emotional processing [Olofsson et al., 2008; Schupp et al., 2006].
To determine the frequency contributions to the observed ERP differences, we performed a time‐frequency analysis in discrete frequency bands on electrode‐averaged data (Fig. 1D). In the θ band (3–6 Hz), maximal stimulus (event)‐related synchronization (ERS) was observed at ˜200–300 ms after picture presentation. This activation showed selectivity to valence, with negative emotional stimuli resulting in the greatest synchronization, followed by positive and then neutral stimuli (see below detailed statistical analysis). This ERS coincides with the early (200–400 ms) ERP event differentiating negative emotional stimuli from positive and neutral ones, and suggests that θ band activity is responsible for the ERP dissimilarity (compare with arrow in Fig. 1C). In the α band (9–12Hz), there was a continuous desynchronization across all stimuli; this is considered to reflect a cessation of brain “idling” rather than a manifestation of a specific stimulus‐related response [Neuper and Pfurtscheller, 2001]. Therefore, we did not pursue alterations in this frequency band. In the Lβ band (13–24 Hz), a prominent late ERS was observed at ˜300–600 ms; here, the ERS elicited by both negative and positive stimuli was significantly larger than that induced by neutral stimuli (positive > neutral at ˜450–480 ms, negative > neutral at ˜460‐onward), suggesting a valence independent emotional effect. In the Hβ band (25–30 Hz) negative stimuli induced an earlier rise in ERS (˜120 vs. ˜265 ms for neutral; see detailed statistical analysis below). In the γ band (30–50 Hz), a narrow ERS peaking at ˜470 ms appeared, with no significant valence selectivity. Thus, in the scalp‐averaged data, emotion‐selective frequency responses consisted mainly of an early response (200–300 ms) in the θ band and a late component (400–600 ms) in the β bands. Our further analyses focused on θ and Hβ bands those showing a clear differentiation of the negative from all other stimuli.
To obtain an indication of the location and progression of the observed frequency patterns, we performed region‐ and time‐wise statistical analysis, with emphasis on the difference between negative and neutral emotional conditions for which both early θ and late Hβ ERS scalp‐averaged differences were observed (See Supporting Information Fig. 1 for example of an individual region‐wise frequency response). In the θ band, there was initially a significant increase in synchronization over the anterior midline scalp region, occurring at ˜260–400 ms; this difference was then observed in parietooccipital regions, where it remained significant through ˜400–535 ms (Fig. 2A). To identify the brain structures involved, we employed the source localization method, sLORETA [Browne et al., 2006; Pascual‐Marqui, 2002], on subject‐averaged ERSs in response to negative stimuli. The early component of the ERS at the θ band was localized bilaterally to the orbitofrontal cortex, Brodmann area [(BA 11), Fig. 2B] corresponding to the increased θ activity in frontal electrodes, as well as to visual association occipital lobe areas (BA 7). The late component localized to BA 7, 19 (precuneus), particularly on the left (Fig. 2B).
Figure 2.

Emotional valence is reflected in spatiotemporal‐frequency alterations. A, C, F, and H: Statistical analysis of the ERSs in the negative versus neutral emotion contrast in the θ (A controls; C PTSD) and Hβ bands (F controls; H PTSD). Statistical significance at a P‐value threshold of 0.05 is plotted for each region and time point. Below are scalp maps of regional statistical significance for representative time windows in which a significant difference was found in the frequency response; red indicates a significant increase, blue a significant decrease at a threshold of P < 0.05. D: Regional statistical significance for comparison of the negative/neutral θ ERS ratio from PTSD to that of controls at 420–480 ms. B, E, and G: Source localization (employing sLORETA) of the signals in response to negative stimuli in the θ (B controls; E PTSD) and Hβ bands (G controls). Lt.: left (for all axial sections), A: anterior (sagittal).
Our findings in healthy controls indicate a distinct temporal pattern of brain activity in response to emotional stimuli. If this activation pattern is involved in normal emotion‐driven behavior, we expect it to be affected in patients suffering from PTSD, which is characterized by disturbed responsiveness to negative emotional content [Vythilingam et al., 2007]. To test this hypothesis, we analyzed the frequency response to the same stimulus paradigm in subjects suffering from extremely severe PTSD as determined by their CAPS score (see Methods). Similar to controls, we found a significant increase in the averaged θ ERS in response to negative stimuli (not shown). However, θ activity in patients appeared earlier (140 vs. 260 ms in controls) and lasted longer compared with controls. Furthermore, while increased θ activity was widespread in PTSD patients, it failed to reach the parietooccipital regions, which were the main site of late θ response in control subjects (Fig. 2C). This observation was confirmed by a statistical comparison of the θ negative/neutral ratio between PTSD subjects and controls demonstrating a significant decrease in amplitude over occipital regions at 420–480 ms in PTSD patients (Fig. 2D). sLORETA source localization of the θ response to negative stimuli in PTSD patients demonstrated a lack of occipital activation and a wide frontal activation, maximal in left frontal regions (BA 10, 11; Fig. 2E).
In the Hβ frequency range, in healthy controls, two responses were evident. Early Hβ synchronization for negative stimuli appeared in occipital regions and subsequently in mid frontal areas and right frontal areas (180–270 ms). This component coincides with the initiation of the negative emotion‐induced ERS ascent. A late component, coinciding with the peak amplitude of the scalp‐averaged ERS, began at ∼300 ms and lasted until 500 ms post‐stimulus. This response comprised negative emotion‐induced synchronization at temporoparietal scalp electrodes (Fig. 2F). Upon sLORETA analysis, Hβ early activity localized to the right inferior frontal gyri (BA 45‐6). The late component localized to the right inferior and middle temporal gyri (BA 20‐21, Fig. 2G).
In the PTSD group, in contrast to the overall increased emotion‐driven θ activity, emotion driven Hβ activity was absent (Fig. 2H). Comparison between PTSD subjects and controls at the time of peak ERS (˜470 ms) demonstrated statistically significant increase in Hβ activity in PTSD subjects compared to controls for both negative and neutral stimuli. Importantly, in contrast to the control subjects, the increased Hβ activity in PTSD patients did not seem to be associated with stimuli valence (Fig. 2H).
To confirm that stimuli produced the intended emotional perception in both experimental groups, we analyzed behavioral data obtained from subject ranking of picture valence using the self‐assessment manikin scale of one (positive) to nine (negative). Mean valence ranking between negative, neutral, and positive stimuli were significantly different within groups (controls: 6.82 ± 0.19, 4.87 ± 0.11, and 3.39 ± 0.16, ANOVA, F = 114.9, P = 3.12e‐22; PTSDs: 6.04 ± 0.33, 4.37 ± 0.33, and 3.43 ± 0.26, ANOVA, P = 9.56e‐07, F = 18.1, respectively). A comparison of valence ranking between PTSD and controls across emotional groups did not reveal significant differences (ANOVA, F = 2.07, P = 0.13). Thus, our behavioral data confirm that stimuli generated similar differential emotional perceptions according to their designated valence in both control and PTSD subjects.
Emotional and Behavioral Associations of the Frequency Response and the Relationship Between Theta and Beta in Healthy Controls and PTSD
Next, we set out to determine the association between frequency‐specific activity, perception, and resulting behavior. Individual valence ranking for negative stimuli was chosen as a measure of perception and was correlated with the amplitudes of brain activity in the different frequency bands. In healthy controls, we found a slight negative correlation between individual negative/neutral θ amplitude and valence ranking in midline skull regions only in the 400‐ to 500‐ms time window (e.g., posterior midline, r = −0.66, P = 0.009, Fig. 3A) while no correlation was found with Hβ (data not shown; correlation was examined at 100‐ms intervals between 0 and 600 ms). Interestingly, in PTSD patients, significant correlation was found between individual negative/neutral θ amplitudes and valence of the negative stimuli; this was found throughout the 100–600 ms post‐stimulus peaking at 300–400 ms, in which all regions showed significant correlation (Fig. 3A).
Figure 3.
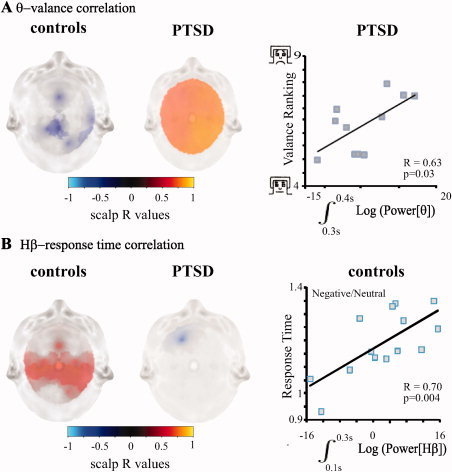
Behavioral correlates of the frequency response. A: Scalp maps of correlation between θ (negative to neutral ratio) and valence ranking of negative stimuli; R values with a P‐value < 0.05 are presented. Time windows with maximal correlation are presented for controls (left, the 400–500 ms post‐stimulus interval) and PTSD (center, the 300–400 ms interval). An example of correlation in the 300–400 ms interval in the right parietal region is shown for PTSD (right; one extreme value was removed from figure, correlation with this value was higher: R = 0.84; P = 0.0006). B: Scalp maps of correlation between the negative to neutral ratios of Hβ activity in the 100–300 ms interval and RTs; R values with a P‐value < 0.05 are presented for controls (left) and PTSD (center). An example of correlation in the 100–300 ms interval in the left central scalp region for controls is shown (right).
We chose influence of negative emotional content on the motor response time (RT) as a simple behavioral measure [Blair et al., 2007]. Our results showed a delayed response to negative versus neutral stimuli in both control and PTSD groups (mean RT 894.3 ± 28.4 vs. 758.6 ± 33.5 ms, P = 0.00004 and 1005.2 ± 35.2 vs. 850.3 ± 41.0 ms, P = 0.0006, respectively). Although PTSD patients showed a slower response to both neutral and negative stimuli, differences reached statistical significance only for negative stimuli (P = 0.02, for neutral stimuli P = 0.09). Interestingly, in control subjects a linear correlation between Hβ negative/neutral amplitude ratio and RT was found in electrodes positioned over central and midfrontal regions in the 100–300 ms after stimulation (e.g., the left central region P = 0.004, r = 0.70, Fig. 3B). Conversely, there was no correlation between Hβ activity and RT for other time windows or between θ activity and RT in any time window (e.g., the left central region P = 0.20, r = 0.36, for the 100–300 ms interval). In contrast, in PTSD patients a negative correlation was found between negative/neutral Hβ activity and motor RT only in one region (left frontal) in the 100–300 ms time window (Fig. 3B).
Cross‐Frequency Correlation
In vivo coupling between low‐ and high‐frequency brain rhythms has been reported in rodents [Hyman et al., 2005] and humans [Canolty et al., 2006]. We thus tested the hypothesis that the negative emotion‐induced early frontal θ leads to the subsequent Hβ activation. To test for such an association, we performed a cross‐correlation analysis between θ and Hβ activity in each pair of regions for negative and neutral emotions, followed by a statistical comparison across emotions. A significant correlation pointing to a θ ‐ Hβ association was found for control subjects only in an early (150–300 ms) time window. In this window, negative valence induced high correlation between θ and Hβ activities was found most abundantly for a negative shift of the Hβ signal in relation to θ, indicating that θ activity precedes Hβ (Fig. 4A). Furthermore, significant correlation was only found between θ activity in frontal scalp regions and widespread centroparietal Hβ activity. Thus, the data suggest that emotional stimuli induce θ rhythms in frontal association cortical regions, which in turn modulate electrical activity within more posteriorly located sensory‐motor regions (through increased Hβ). In PTSD patients, only a negligible increase in cross‐correlation between emotional‐driven θ and Hβ activity was found as compared to healthy control subjects (Fig. 4B). Thus, our data show that in PTSD patients, while emotional stimuli induce early and diffuse θ activity, it fails to increase Hβ response in sensory‐motor cortical regions.
Figure 4.
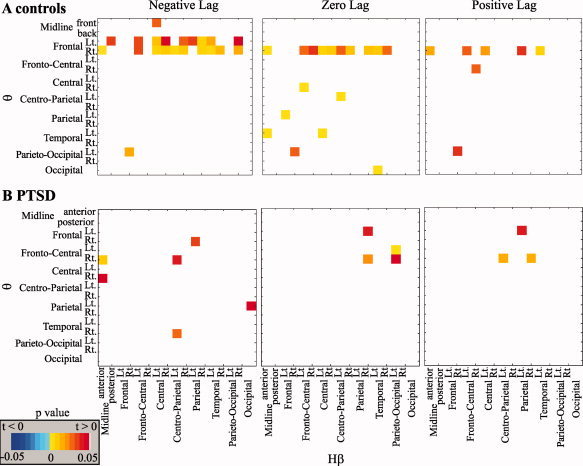
Emotion‐induced frontal θ activity leads to widespread Hβ activity in control but not PTSD subjects. A and B: Cross‐correlation analysis between θ and Hβ activity across scalp regions; P‐values for the statistical comparison of response to negative versus neutral emotion for negative, zero, or positive lags of the θ signal in relation to Hβ are shown for controls (A) and PTSD (B).
FMRI Emotional Activation and Its Behavioral Correlates Lend Support to Electrophysiological Data
To confirm our EEG results (obtained with low spatial resolution) and identify anatomical structures involved in emotional processing, we examined the BOLD fMRI response to the negative versus neutral emotional contrast. Importantly, the fMRI activation pattern was consistent with EEG source localization, suggesting that brain regions identified as the source for scalp activity also produce a vascular (i.e., BOLD) response. In controls, statistically significant increase in the BOLD response was found in the association and primary visual regions of the occipital lobes, mainly in the left hemisphere (BA 17, 19; Fig. 5A, see Supporting Information Table III for a full list of activation), the right ACC and the dorsolateral prefrontal cortices (BA 32, 46). In PTSD, the BOLD response showed significant activation in the left ventrolateral frontal region (BA 47), right ACC, motor regions and a lack of significant activation in visual areas (Fig. 5A, see Supporting Information Table IV for full list of activation). This data is in line with EEG data from the θ band showing a shift of activation to left frontal regions and lack of occipital activation. Of special interest is the finding that a direct comparison of the BOLD negative‐neutral contrast from PTSD and control subjects revealed increased activation in the amygdala in the patient group (Fig. 5A, see Supporting Information Table V for full list of activation).
Figure 5.
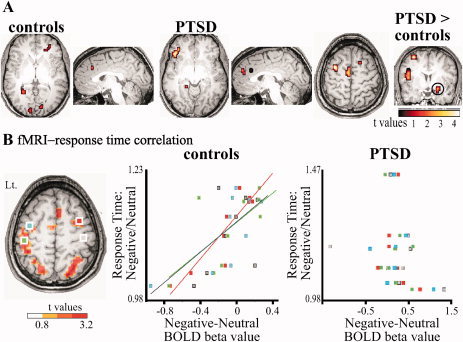
fMRI analysis points to anatomical regions of emotion‐related activity. A: MRI BOLD signal analysis for the contrast negative‐neutral in control, PTSD and for the contrast PTSD negative‐neutral versus controls negative‐neutral. Encircled is the amygdala. B: Correlation between the difference in individual negative versus neutral mean BOLD activation and ratio of negative/neutral RT in left premotor (blue), left motor (green), right premotor (red), and right motor (gray) regions (left, regions for analysis were extracted from the contrast: all pictures vs. fixation,) presented for controls (center) and PTSD (right). For all fMRI analysis shown in this figure, P < 0.01 uncorrected, cluster size > 5 voxels.
Increased Hβ activity in motor‐related regions of the cerebral cortex during emotional processing was correlated with a slower RT in healthy individuals but not in PTSD patients (Fig. 3). Similarly, the delayed RT to negative stimuli (found in 9 of 10 control subjects) was associated with increased BOLD signal difference between negative and neutral stimuli (Fig. 5B) in the left motor (P = 0.04; r = 0.68), left (P = 0.02; r = 0.72), and right (P = 0.001; r = 0.89) premotor areas but not in the right motor area (P = 0.12; r = −0.54; Fig. 5B). Conversely, in the PTSD group, no significant correlation was found between negative‐neutral BOLD activation and ratio of negative to neutral RT [left motor (P = 0.45; r = −0.31), left premotor (P = 0.53; r = −0.25) right premotor (P = 0.52; r = −0.26), right motor area (P = 0.47; r = −0.29; Fig. 5B]. Our data thus support the conclusion that the emotion‐related, θ‐driven Hβ activity in motor‐related cortical regions underlies the altered motor response (delayed RT) to negative emotional visual stimuli in healthy subjects.
DISCUSSION
Our results demonstrated frequency‐specific electrical brain activity in healthy subjects in response to negative emotion. We showed early prefrontal θ synchronization and later frontal and temporooccipital Hβ synchronization in response to negative stimuli. Complementary fMRI experiments suggest that emotional response is localized at the dorsal anterior cingulate and dorsolateral PFC. Early emotion‐driven θ activity correlated with increased Hβ activity in more posterior sensory‐motor brain regions and a slower RT to negative pictures. In PTSD patients, negative‐valence‐induced θ activity was evident earlier and was more widespread than in controls. However, θ activity failed to modulate Hβ activity in sensory‐motor regions and, in accordance with this failure, was not associated with increased motor RT. In PTSD patients, but not in control subjects, negative valence ranking was associated with the amplitude of the θ response.
The Functional Significance of Theta Synchronization
Electrical activity in the θ band has been associated with emotional processing in both limbic and cortical regions in animal and human studies [Mitchell et al., 2008]. In keeping with these studies, our combined EEG and BOLD signal data point to negative‐valence‐induced activity in discrete frontal cortical regions (e.g., dorsolateral frontal lobe) known to be instrumental for emotional and cognitive‐emotion interactions. Conversely, we found Hβ activity to be largely confined to more posteriorly located areas associated with sensory‐motor processing, consistent with previous studies showing β activity to be associated with motor response [Neuper and Pfurtscheller, 2001]. Indeed, emotional‐driven Hβ activity correlated with motor RT suggesting that it is closely related to an adequate behavioral response to emotional stimuli. In addition, the finding that the enhanced frontal θ activity in PTSD patients is correlated with degree of negativity perception, suggests that it represents emotional processing (Fig. 3A). Furthermore, the early and robust increased emotional‐driven θ in PTSD patients was accompanied by increased BOLD response in the amygdala as well as in several frontal brain regions (e.g., left middle and orbitofrontal) supporting the hypothesis that early frontal activity in the θ range is related to amygdala‐mediated emotional activation. This is also supported by a recent magnetoencephalography study demonstrating θ activity in the amygdala and frontal regions in response to fearful faces [Maratos et al., 2009].
Interfrequency Interaction Underlies Top‐Down Regulation During Emotional Processing
Visual processing of emotional stimuli is amenable to competitive modulation from the amygdala, supporting processing of fear‐related (i.e., negative emotion) stimuli, while the PFC supports task‐related processing. Within the PFC, the ACC is thought to detect attentional conflict between the tasks and fear cues, while the lateral PFC was suggested to carry out task‐related attentional control [Bishop, 2008]. In anxiety (in both healthy and psychiatric populations), amygdala activity, as demonstrated by fMRI, is amplified, while PFC activity is diminished, tilting the balance in favor of fear attention [Bishop, 2007]. The physiological substrates underlying cortical processing of visual emotional stimuli are not fully known; though evidence for reentrant anterior to early visual modulation has been provided from Granger causality analysis of visual evoked potentials [Keil et al., 2009]. Based on the current findings, we propose that frequency‐specific alterations and coherence underlie this modulation and a failure of these changes leads to disturbed emotional processing, as observed in PTSD. A theoretical model [Siegel et al., 2000] predicts that top‐down modulation of visual processing in general depends on synchronous low frequency (e.g., θ) activity. Bottom‐up or failure of top‐down modulation, however, results in high frequency synchrony. Our results lend empirical support to this proposition. We observed early posterior Hβ synchrony in healthy controls that seems likely to reflect bottom‐up visual information transfer. In healthy individuals, right PFC regions (dorsolateral‐PFC and ACC), probably responding to direct input from cortical visual regions and/or subcortical regions, possibly the amygdala, demonstrate increased θ synchrony in response to emotional stimuli, which in turn modulates activity (i.e., enhances synchronicity in the Hβ range) in cortical regions associated with the processing of sensory information. We posit that this θ modulation of Hβ constitutes the physiological basis for PFC top‐down modulation. In PTSD, behavioral data suggest failure of top‐down modulation, resulting in significant emotional distraction from the primary task (e.g., employing the affective Stroop task [Vythilingam et al., 2007]). Indeed, in PTSD patients, we observed widespread valence‐induced PFC response that failed to modulate Hβ activity.
Differences in stimulus physical characteristics and eye movement artifacts could be confounding factors in this study. Analysis of luminance, however, revealed no significant differences between negative and neutral pictures. To rule out eye movements as underlying our results, EEG segments with gross eye movement artifacts were excluded from further analysis. In addition, analysis of recordings from EOG channels failed to reproduce statistical significant differences across emotional conditions as those observed in the EEG data excluding eye‐movement as underlying our results.
A further factor to be considered regarding the current study is the choice of frequency bands vis‐à‐vis the use of the Hilbert transform. A prerequisite for a correct estimation of the signal amplitude by the Hilbert transform is a narrowly filtered signal [Boashash, 1992]. There is no consensus regarding the definition of “narrow”; choice of bandwidth for this type of analysis in the literature varies; for example, 2 Hz [Graimann and Pfurtscheller, 2006], 3 Hz [Cohen, 2008], 4 Hz [Koskinen et al., 2001], and up to 30 Hz [Park et al., 2011; Tort et al., 2010]. Our choice of the bands investigated here (i.e., theta, alpha, low‐, and high‐beta) falls well within the range employed in the literature.
CONCLUSION
Based on EEG‐fMRI analysis we suggest specific interactions between brain region and frequencies as the basis for top‐down modulation during visual emotional stimulation. The differences found between healthy controls and PTSD patients may offer novel avenues for the understanding, diagnosis and follow‐up of affective brain pathologies.
Supporting information
Additional Supporting Information may be found in the online version of this article.
Supporting Information
Acknowledgements
The authors thank Dorit Ben‐Shalom for critical review and Sigal Alyagon and Rotem Saar for technical assistance.
REFERENCES
- Aftanas LI, Varlamov AA, Pavlov SV, Makhnev VP, Reva NV ( 2001): Affective picture processing: Event‐related synchronization within individually defined human theta band is modulated by valence dimension. Neurosci Lett 303: 115–118. [DOI] [PubMed] [Google Scholar]
- Bishop SJ ( 2007): Neurocognitive mechanisms of anxiety: An integrative account. Trends Cogn Sci 11: 307–316. [DOI] [PubMed] [Google Scholar]
- Bishop SJ ( 2008): Neural mechanisms underlying selective attention to threat. Ann N Y Acad Sci 1129: 141–152. [DOI] [PubMed] [Google Scholar]
- Blair KS, Smith BW, Mitchell DG, Morton J, Vythilingam M, Pessoa L, Fridberg D, Zametkin A, Sturman D, Nelson EE, Drevets WC, Pine DS, Martin A, Blair RJ ( 2007): Modulation of emotion by cognition and cognition by emotion. Neuroimage 35: 430–440. [DOI] [PMC free article] [PubMed] [Google Scholar]
- Boashash B ( 1992): Estimating and Interpreting the Instantaneous Frequency of a Signal .1. Fundamentals. Proc IEEE 80: 520–538. [Google Scholar]
- Browne RO, Moyal‐Segal LB, Zumsteg D, David Y, Kofman O, Berger A, Soreq H, Friedman A ( 2006): Coding region paraoxonase polymorphisms dictate accentuated neuronal reactions in chronic, sub‐threshold pesticide exposure. FASEB J 20: 1733–1735. [DOI] [PubMed] [Google Scholar]
- Canolty RT, Edwards E, Dalal SS, Soltani M, Nagarajan SS, Kirsch HE, Berger MS, Barbaro NM, Knight RT ( 2006): High gamma power is phase‐locked to theta oscillations in human neocortex. Science 313: 1626–1628. [DOI] [PMC free article] [PubMed] [Google Scholar]
- Clochon P, Fontbonne J, Lebrun N, Etevenon P ( 1996): A new method for quantifying EEG event‐related desynchronization: Amplitude envelope analysis. Electroencephalogr Clin Neurophysiol 98: 126–129. [DOI] [PubMed] [Google Scholar]
- Cohen MX ( 2008): Assessing transient cross‐frequency coupling in EEG data. J Neurosci Methods 168: 494–499. [DOI] [PubMed] [Google Scholar]
- DSM‐IV TFo ( 2000): Diagnostic and Statistical Manual of Mental Disorders. Washington, DC: American Psychiatric Association; pp 943. [Google Scholar]
- Durka PJ, Zygierewicz J, Klekowicz H, Ginter J, Blinowska KJ ( 2004): On the statistical significance of event‐related EEG desynchronization and synchronization in the time‐frequency plane. IEEE Trans Biomed Eng 51: 1167–1175. [DOI] [PubMed] [Google Scholar]
- Eldar E, Ganor O, Admon R, Bleich A, Hendler T ( 2007): Feeling the real world: Limbic response to music depends on related content. Cereb Cortex 17: 2828–2840. [DOI] [PubMed] [Google Scholar]
- Graimann B, Pfurtscheller G ( 2006): Quantification and visualization of event‐related changes in oscillatory brain activity in the time‐frequency domain. Prog Brain Res 159: 79–97. [DOI] [PubMed] [Google Scholar]
- Hummel FC, Gerloff C ( 2006): Interregional long‐range and short‐range synchrony: A basis for complex sensorimotor processing. Prog Brain Res 159: 223–236. [DOI] [PubMed] [Google Scholar]
- Hyman JM, Zilli EA, Paley AM, Hasselmo ME ( 2005): Medial prefrontal cortex cells show dynamic modulation with the hippocampal theta rhythm dependent on behavior. Hippocampus 15: 739–749. [DOI] [PubMed] [Google Scholar]
- Jensen O, Colgin LL ( 2007): Cross‐frequency coupling between neuronal oscillations. Trends Cogn Sci 11: 267–269. [DOI] [PubMed] [Google Scholar]
- Jensen O, Kaiser J, Lachaux JP ( 2007): Human gamma‐frequency oscillations associated with attention and memory. Trends Neurosci 30: 317–324. [DOI] [PubMed] [Google Scholar]
- Keil A ( 2006): Macroscopic brain dynamics during verbal and pictorial processing of affective stimuli. Prog Brain Res 156: 217–232. [DOI] [PubMed] [Google Scholar]
- Keil A, Sabatinelli D, Ding M, Lang PJ, Ihssen N, Heim S ( 2009): Re‐entrant projections modulate visual cortex in affective perception: Evidence from Granger causality analysis. Hum Brain Mapp 30: 532–540. [DOI] [PMC free article] [PubMed] [Google Scholar]
- Korn A, Golan H, Melamed I, Pascual‐Marqui R, Friedman A ( 2005): Focal cortical dysfunction and blood‐brain barrier disruption in patients with Postconcussion syndrome. J Clin Neurophysiol 22: 1–9. [DOI] [PubMed] [Google Scholar]
- Koskinen M, Seppanen T, Tuukkanen J, Yli‐Hankala A, Jantti V ( 2001): Propofol anesthesia induces phase synchronization changes in EEG. Clin Neurophysiol 112: 386–392. [DOI] [PubMed] [Google Scholar]
- Lang PJ, Bradley MM, Cuthbert BN ( 2001): International affective picture system (IAPS): Instruction manual and affective ratings. Technical report A‐5. Gainesville, FL: The Center for Research in Psychphysiology, University of Florida. [Google Scholar]
- Maratos FA, Mogg K, Bradley BP, Rippon G, Senior C ( 2009): Coarse threat images reveal theta oscillations in the amygdala: A magnetoencephalography study. Cogn Affect Behav Neurosci 9: 133–143. [DOI] [PubMed] [Google Scholar]
- Merriam‐Webster ( 2011): Emotion. http://Merriam-Webster.com.
- Miskovic V, Schmidt LA ( 2010): Cross‐regional cortical synchronization during affective image viewing. Brain Res 1362: 102–111. [DOI] [PubMed] [Google Scholar]
- Mitchell DJ, McNaughton N, Flanagan D, Kirk IJ ( 2008): A review of frontal‐midline theta from the perspective of hippocampal "THETA". Prog Neurobiol 86: 156–185. [DOI] [PubMed] [Google Scholar]
- Mueller‐Pfeiffer C, Martin‐Soelch C, Blair JR, Carnier A, Kaiser N, Rufer M, Schnyder U, Hasler G ( 2010): Impact of emotion on cognition in trauma survivors: What is the role of posttraumatic stress disorder? J Affect Disord 126: 287–292. [DOI] [PubMed] [Google Scholar]
- Nesse RM, Ellsworth PC ( 2009): Evolution, emotions, and emotional disorders. Am Psychol 64: 129–139. [DOI] [PubMed] [Google Scholar]
- Neuper C, Pfurtscheller G ( 2001): Event‐related dynamics of cortical rhythms: Frequency‐specific features and functional correlates. Int J Psychophysiol 43: 41–58. [DOI] [PubMed] [Google Scholar]
- Nichols TE, Holmes AP ( 2002): Nonparametric permutation tests for functional neuroimaging: A primer with examples. Hum Brain Mapp 15: 1–25. [DOI] [PMC free article] [PubMed] [Google Scholar]
- Ochsner KN, Gross JJ ( 2005): The cognitive control of emotion. Trends Cogn Sci 9: 242–249. [DOI] [PubMed] [Google Scholar]
- Olofsson JK, Nordin S, Sequeira H, Polich J ( 2008): Affective picture processing: An integrative review of ERP findings. Biol Psychol 77: 247–265. [DOI] [PMC free article] [PubMed] [Google Scholar]
- Park JY, Lee Y‐R, Lee J ( 2011): The relationship between theta‐gamma coupling and spatial memory ability in older adults. Neurosci Lett 498: 37–41. [DOI] [PubMed] [Google Scholar]
- Pascual‐Marqui RD ( 2002): Standardized low‐resolution brain electromagnetic tomography (sLORETA): Technical details. Methods Find Exp Clin Pharmacol 24 Suppl D: 5–12. [PubMed] [Google Scholar]
- Pessoa L ( 2008): On the relationship between emotion and cognition. Nat Rev Neurosci 9: 148–158. [DOI] [PubMed] [Google Scholar]
- Schupp HT, Flaisch T, Stockburger J, Junghofer M ( 2006): Emotion and attention: Event‐related brain potential studies. Prog Brain Res 156: 31–51. [DOI] [PubMed] [Google Scholar]
- Siegel M, Kording KP, Konig P ( 2000): Integrating top‐down and bottom‐up sensory processing by somato‐dendritic interactions. J Comput Neurosci 8: 161–173. [DOI] [PubMed] [Google Scholar]
- Tort AB, Komorowski R, Eichenbaum H, Kopell N ( 2010): Measuring phase‐amplitude coupling between neuronal oscillations of different frequencies. J Neurophysiol 104: 1195–1210. [DOI] [PMC free article] [PubMed] [Google Scholar]
- Vuilleumier P ( 2005): How brains beware: Neural mechanisms of emotional attention. Trends Cogn Sci 9: 585–594. [DOI] [PubMed] [Google Scholar]
- Vythilingam M, Blair KS, McCaffrey D, Scaramozza M, Jones M, Nakic M, Mondillo K, Hadd K, Bonne O, Mitchell DG, Pine DS, Charney DS, Blair RJ ( 2007): Biased emotional attention in post‐traumatic stress disorder: A help as well as a hindrance? Psychol Med 37: 1445–1455. [DOI] [PubMed] [Google Scholar]
- Wang X‐J ( 2010): Neurophysiological and Computational Principles of Cortical Rhythms in Cognition. Physiol Rev 90: 1195–1268. [DOI] [PMC free article] [PubMed] [Google Scholar]
- Weathers FW, Keane TM, Davidson JR ( 2001): Clinician‐administered PTSD scale: A review of the first ten years of research. Depress Anxiety 13: 132–156. [DOI] [PubMed] [Google Scholar]
- Zygierewicz J, Mazurkiewicz J, Durka PJ, Franaszczuk PJ, Crone NE ( 2006): Estimation of short‐time cross‐correlation between frequency bands of event related EEG. J Neurosci Methods 157: 294–302. [DOI] [PubMed] [Google Scholar]
Associated Data
This section collects any data citations, data availability statements, or supplementary materials included in this article.
Supplementary Materials
Additional Supporting Information may be found in the online version of this article.
Supporting Information