

Abstract
It has been shown in adults that individual differences in intelligence are related to the integrity of the interaction between parietal and frontal brain regions. Since connectivity between distant brain regions strengthens during childhood, it is unclear when in the course of development this relationship emerges. Thus, the goal of this study was to determine whether parietal‐frontal functional connectivity is associated with intelligence in young children. We performed independent component analyses on resting‐state fMRI data of 115 children (6–8 years old) to select seed and target regions for a seed/target region correlation analysis. We found that higher nonverbal intelligence was associated with increased functional connectivity between right parietal and right frontal regions, and between right parietal and dorsal anterior cingulate regions. The association between intelligence and functional connectivity between certain brain regions was stronger in girls than boys. In conclusion, we found that connectivity between the parietal and frontal lobes is critically involved in intelligence in young children. Hum Brain Mapp 34:3299–3307, 2013. © 2012 Wiley Periodicals, Inc.
Keywords: resting‐state fMRI, IQ, development, anterior cingulate cortex, prefrontal
INTRODUCTION
Intelligence involves “the ability to reason, plan, solve problems, think abstractly, comprehend complex ideas, learn quickly and learn from experience (…)” [Deary et al., 2010, p 202]. Whether young or old, someone's intelligence level determines to a great extent how well he/she is capable of managing the challenges of everyday life. According to the parieto‐frontal integration theory (P‐FIT) [Jung and Haier, 2007], individual differences in a distributed brain network, including primary sensory, anterior cingulate, parietal and frontal cortices, predict individual differences in intelligence. Critically, the P‐FIT postulates that higher intelligence is associated with faster and more accurate information transfer between parietal and frontal brain regions. Because connections between these distant brain regions tend to strengthen with development from early childhood into adulthood [Power et al., 2010], the question rises as to whether these parietal‐frontal connections are already associated with intelligence in young children.
Evidence for the P‐FIT comes primarily from adult neuroimaging studies. Structural neuroimaging techniques have revealed that intelligence is correlated with gray matter density and white matter integrity within parietal and frontal brain regions [Colom et al., 2006; Haier et al., 2004; Jung et al., 2005; Pfleiderer et al., 2004]. Task‐based functional magnetic resonance imaging (fMRI) techniques have demonstrated that cognitive tasks that tap abilities that depend on intelligence consistently coactivate parietal and frontal brain regions [e.g., Fangmeier et al., 2006; Geake and Hansen, 2005; Noveck et al., 2004]. However, these studies do not provide direct evidence that intelligence depends on how the parietal and frontal lobes interact. Analysis of functional connectivity, which is defined as the temporal coherence between neuronal activation patterns in anatomically separated brain regions [Biswal et al., 1995], does allow identification of functional interaction between brain regions. Functional connectivity can be assessed during task‐based or during resting‐state fMRI (rs‐fMRI), the former of which would yield the functional architecture of the brain while performing a particular task. Because intelligence comprises a wide range of mental abilities [Deary et al., 2010], functional connectivity during task performance may not be representative of the association between functional connectivity and intelligence in general. Functional connectivity analysis of rs‐fMRI data, in contrast, does provide insight into the functional architecture of the brain unrelated to any one particular task [Smith et al., 2009].
To date, there have been three published studies that have utilized rs‐fMRI to study intelligence in adults. Wang et al. (2011) have found that intelligence is correlated with functional connectivity among neighboring voxels in multiple brain regions, including parietal and frontal regions. Using graph analysis, Van den Heuvel et al. (2009) have shown that higher intelligence is associated with increased global communication efficiency of the brain, as indicated by shorter individual normalized path length of voxels. This effect occurred especially in voxels within the parietal and frontal regions. Where the former study supports the notion that frontal and parietal regions are involved in intelligence, the latter study suggests that intelligence is associated with functional connectivity of both the parietal and frontal lobes with the rest of the brain. Unfortunately, neither of these studies provides information about the relationship between intelligence and functional connectivity between parietal and frontal regions.
Song and colleagues (2008), in contrast, have examined the association between parietal‐frontal functional connectivity and intelligence. The correlations between fluctuations in the blood oxygen level dependent (BOLD) response from seed regions in the dorsolateral prefrontal cortices and fluctuations in the BOLD response from every other voxel in the brain were correlated with intelligence. Interestingly, the functional connectivity between frontal and parietal regions was particularly associated with intelligence. This study thus provides evidence for the association between intelligence and the interaction between parietal and frontal regions in adults, as suggested by the P‐FIT [Jung and Haier, 2007].
Both mental abilities and the brain undergo protracted development into early adulthood [Casey et al., 2005]. The structural and functional maturation of the sensorimotor cortices happens within the first years of life, followed by maturation of the temporal and parietal association cortices in childhood. The maturation of the prefrontal cortex and its associated cognitive functions persists into early adulthood [Best and Miller, 2010; Casey et al., 2005; Giedd et al., 2008, 2010; Huttenlocher, 1990; Yurgelun‐Todd, 2007]. Notably, the strength of functional connectivity between brain regions also changes during development, presumably through progressive (e.g., myelination, axon terminal arborization, synapse formation and elaboration) and regressive events (e.g., synaptic pruning) at the neuronal level [Batista‐Brito and Fishell, 2009; Luo and O'Leary, 2005]. With increasing age, functional connectivity changes from being predominantly local, linking brain regions that are anatomically near, to being more global, linking brain regions that are anatomically distant, yet functionally related [Power et al., 2010; Uddin et al., 2010; Vogel et al., 2010].
Because the parietal and frontal brain regions and their functional interaction endure such major developmental changes in childhood, they might not yet be associated with intelligence in children. However, a number of structural neuroimaging and task‐based fMRI studies have shown that the parietal and frontal regions are implicated in intelligence in children from 5 years of age and older [e.g., Frangou et al., 2004; Karama et al., 2011; Lee et al., 2006; Schmithorst and Holland, 2006; Schmithorst et al., 2005; Shaw et al., 2006; Wilke et al., 2003]. In addition, it has been found that structural connectivity between parietal and frontal regions is related to brain activation during working memory performance in children between the ages of 8 and 18 years [Olesen et al., 2003], which is relevant here because working memory is highly related to intelligence [Conway et al., 2003]. To our knowledge, there are no studies that have tested whether functional connectivity between parietal and frontal regions is already implicated in intelligence in young children. In this study, we used rs‐fMRI to examine the association of functional connectivity between parietal and frontal regions with intelligence in children of 6 to 8 years old.
MATERIALS AND METHODS
Participants
This study was embedded within the Generation R Study, a population‐based study from fetal life until young adulthood in Rotterdam, The Netherlands [Jaddoe et al., 2008, 2010]. This study is based on the 115 children (56 boys) from whom both the intelligence quotient (IQ) and good quality rs‐fMRI data were available. These children were part of studies evaluating the effect of prenatal factors on later neural development (to be reported on elsewhere). From a total of 184 children scanned, 12 children had not completed the intelligence test and 57 children were excluded due to excessive head motion, see below. Of the 115 included children, 6 were prenatally exposed to cannabis, 19 to nicotine, 5 to selective serotonin reuptake inhibitors (SSRIs), and 18 to low folic acid levels, with some overlap between the groups. The remaining 75 children were controls from the same population. Written informed consent was obtained from the parents. The study was approved by the Medical Ethical Committee of the Erasmus Medical Center, Rotterdam.
Intelligence Testing
Mean age during intelligence testing was 6.2 years (range = 5.4–7.0 years). Intelligence was assessed by having the children complete two subtests of the Snijders‐Oomen Niet‐verbale intelligentie Test – Revisie (SON‐R 2½–7), which is a nonverbal intelligence test suited for children of 2.5–7 years of age [Tellegen et al., 2005]. The two subtests were Mosaics, which taps into visuospatial abilities, and Categories, which taps into abstract reasoning. In an unrelated sample of 626 children (mean age = 6.0 years, SD = 0.85, range = 4.5–7.5), the correlation between the sum of these two subtests and the full SON‐R IQ battery was very high, r = 0.86 (Tellegen, personal communication). The raw test scores were converted into nonverbal IQ using norms tailored to exact age [Tellegen et al., 2005], making the obtained IQ score independent of age at time of intelligence testing. That is, of two children of different ages that have similar raw scores, the older child has the lower IQ score. Likewise, of two children of different ages with similar IQ scores, the older child has the higher raw score. Mean IQ was 102.4 (SD = 13.7, range = 66–138), which corresponds to the general population, with a mean and standard deviation of 100 and 15, respectively [Winkel and Tellegen, 2001]. There were no gender differences in IQ, t(113) = 0.3, P = 0.75. The broad IQ range sampled, from mild mental retardation to superior intelligence, ensures proper estimation of the association between IQ and functional connectivity.
Imaging Protocol
Mean age during imaging was 7.2 years (range = 6.1–8.6 years). The children were first familiarized with the MRI scanning environment during a mock scanning session. The MRI scans were obtained using a GE Discovery MR750 3‐T scanner (General Electric, Milwaukee). A whole‐brain rs‐fMRI scan of 5:20 min was obtained using a gradient‐echo BOLD sequence. The scan parameters were: TR = 2000 ms, TE = 30 ms, flip angle = 85°, number of slices = 37, slice thickness = 4 mm with 1 mm gap, in plane resolution = 3.5 × 3.5 mm, and number of volumes = 160. The children were instructed to keep still with their eyes closed and to think about nothing in particular during the scan. For anatomical reference, a whole‐brain high‐resolution T1 inversion recovery fast spoiled gradient recalled (IR‐FSPGR) sequence was obtained. The scan parameters were: TR = 10.3 ms, TE = 4.2 ms, flip angle = 16°, number of slices = 186, slice thickness = 0.9 mm, and in plane resolution = 0.9 × 0.9 mm.
Preprocessing
The functional images were preprocessed using a combination of Analysis of Functional NeuroImages (AFNI, http://afni.nimh.nih.gov/) [Cox, 1996] and FSL's FMRIB's Software Library (FSL, FMRIB Software Library; FMRIB, Functional Magnetic Resonance Imaging of the Brain; http://www.fmrib.ox.ac.uk/fsl/) [Smith et al., 2004]. Slice timing correction and motion correction were performed using AFNI. Participants who had greater than 3 mm of motion in the x, y, or z directions or more than 3° rotation in the x, y, or z plane were excluded from the analyses. To reduce low‐frequency drift and high‐frequency noise, the data were temporally band‐pass filtered (0.01–0.1 Hz) with AFNI. Functional images were coregistered to the structural image and both the functional and structural images were normalized using the Montreal Neurological Institute T1 template (MNI152, voxel size = 2 × 2 × 2 mm) using FSL's FLIRT [Jenkinson et al., 2002; Jenkinson and Smith, 2001]. Various studies have shown that developmental differences, which are relatively small compared to the resolution of functional imaging, do not limit the comparisons between children and adults, and between children of different ages (4–11 yrs), using a common template [Burgund et al., 2002; Ghosh et al., 2010; Kang et al., 2003]. In the final preprocessing step, the data were spatially smoothed using AFNI with an 8‐mm full width at half‐maximum Gaussian kernel [White et al., 2001].
Independent Component Analysis
The first four volumes of the rs‐fMRI scan of each participant were discarded to allow for T1‐equilibration effects. On the remaining volumes, ICA [Calhoun et al., 2001] was performed using the group independent component analysis of fMRI toolbox (GIFT) version 1.3 h (http://icatb.sourceforge.net). Probabilistic group ICA was repeated 10 times using ICASSO repeatability software implemented in GIFT. The dimensionality was set to define 16 components. The 16 components included left and right parietal‐frontal networks, an insular‐temporal/ACC network, an attention network, a bilateral temporal network, a default mode network that was decomposed into two separate components, a sensory‐motor network, an occipito‐parietal network, a visual network, a cerebellar network, and five noise‐ or movement‐related networks. Three of these resting‐state networks were selected for further analysis, see Figure 1a–c. The left and right parietal‐frontal networks were selected because they comprise functional connectivity between parietal and frontal regions and were thus expected to be related to intelligence. The insular‐temporal/anterior cingulate cortex (ACC) network was selected as a control network, because it does not comprise functional connectivity between parietal and frontal regions and should therefore not be associated with intelligence. In order to reduce the problems associated with multiple testing, we tested the association between functional connectivity and intelligence in the two networks for which we had specific hypotheses, and in one control network only. The ICA analysis yields a series of component images in which each voxel has a z‐score that reflects the degree to which the time series of that voxel is associated with the mean BOLD response time series of that specific resting‐state network.
Figure 1.
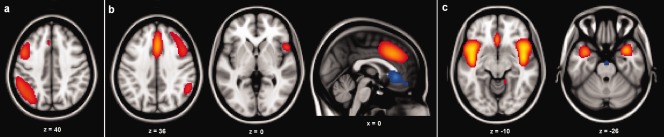
Overview of the three resting‐state networks used in the seed/target regions analysis. Left is displayed on the left. (a) Left parietal‐frontal network (b) Right parietal‐frontal network (c) Insular‐temporal/ACC network. [Color figure can be viewed in the online issue, which is available at http://wileyonlinelibrary.com.]
Seed/Target Regions Correlation Analysis
Seed/target regions correlation analyses were performed using an in‐house program created with Matlab (The Mathworks, Natick, MA). Masks of each of the networks were created by applying a threshold of z = ±2.3, which is based on BOLD fluctuations during rest as mentioned above. This yielded three separate regions within the left parietal‐frontal network, five separate regions within the right parietal‐frontal network, and five separate regions within the insular‐temporal/ACC network. To evaluate the functional connectivity between individual regions within a network, Pearson's correlation coefficients were computed between the mean BOLD response time series of each possible pair of regions (three pairs in the left parietal‐frontal network, and 10 pairs in the right parietal‐frontal and the insular‐temporal/ACC networks). The resulting correlations coefficients were transformed to an approximate Gaussian distribution using Fisher's r‐to‐Z transformation (Fisher, 1915). A higher Fisher's Z indicates greater functional connectivity between a pair of regions.
IQ and Functional Connectivity Regression Analyses
Hierarchical regression analyses were performed to investigate to what extent IQ is predicted by the strength of the functional connectivity between each pair of regions (expressed in Fisher's Z) within each network while controlling for the covariates. These covariates included the delay between the intelligence test and the imaging session (mean delay = 1.0 years, SD = 0.5, range = 0.1‐2.8), and prenatal exposure to cannabis, nicotine, SSRIs, or low folate levels. Note that we did not control for age at time of the intelligence test because the IQ score is age‐normed, as outlined above. The covariates were entered in the first step of the regression equation and functional connectivity was entered in the second step. The β, and the associated P of this functional connectivity term are reported.
To control for multiple testing, the false discovery rate (FDR) and family wise error rate (FWER) within each network were controlled at 0.05 by adjusting the significance level α for each test separately using Hochberg's procedure. This procedure entails sorting the comparisons from smallest to largest P value. Then, the adjusted α level for each comparison is computed in this order, by (i/(m + 1 – i))*α, where i is the rank of the test, m is the number of tests within a network, and α is 0.05. The P values are evaluated for significance against this adjusted α in rank order, and the procedure is terminated as soon as a nonsignificant comparison is encountered [Benjamini and Hochberg, 1995].
Similar analyses in the children who were not prenatally exposed to cannabis, nicotine, SSRIs, or low folic acid levels, as well as for some of the other networks obtained in the ICA, are reported as Supporting Information. In addition, in all participants several control analyses were conducted for pairs of regions for which the association between IQ and functional connectivity was (nearly) significant. It was examined whether the observed association was moderated by age at time of imaging, or gender. In these analyses, covariates were entered in the first step, functional connectivity in the second step, the moderator (i.e., age at time of imaging or gender) was entered in the third step, and an interaction term (moderator * functional connectivity) was entered in the fourth step of the regression analyses. Interaction terms were computed after standardization of the constituent variables. Moderation is said to occur when addition of the interaction term to the model significantly increases the R 2. In addition, because head motion has been shown to spuriously decrease the strength of long‐range connections, and increase the strength of short‐range connections [Power et al., 2012; Van Dijk et al., 2012], we conducted analyses to determine whether our findings could be explained by intelligence‐differences in head motion during scanning (e.g., if higher intelligence would be associated with less head motion, that would result in a spurious increase of the strength of long‐range connections with higher intelligence). We computed total displacement during the rs‐fMRI scan in mm, as well as the mean head motion between consecutive volumes (movement between volume x+1 and volume x averaged over all TRs), and computed Pearson's correlation coefficients between these measures of head motion and IQ.
Brodmann Areas
The PickAtlas software toolbox [Maldjian et al., 2004, 2003] was used to determine whether the regions involved in (near) significant associations between IQ and functional connectivity overlapped with the parietal and frontal Brodmann areas (BAs) previously defined as being involved in intelligence, namely BAs 6, 7, 9, 10, 32, 39, 40, 45, 46, 47 [Jung and Haier, 2007].
RESULTS
Association Between IQ and Functional Connectivity
The βs and the associated Ps of the association between functional connectivity between each pair of regions within each network while controlling for the covariates are reported in Tables 1, 2, 3.
Table 1.
Prediction of IQ by functional connectivity between each pair of regions within the left parietal‐frontal network, controlling for the covariates delay between the intelligence test and the imaging session, and prenatal exposure to cannabis, nicotine, SSRIs, or low folate levels
| Dorsal ACC | Left parietal | |
|---|---|---|
| Left frontal | β = 0.17 | β = 0.18 |
| p = 0.09 | p = 0.06 | |
| Dorsal ACC | β = 0.04 | |
| p = 0.68 |
Table 2.
Prediction of IQ by functional connectivity between each pair of regions within the right parietal‐frontal network, controlling for the covariates delay between the intelligence test and the imaging session, and prenatal exposure to cannabis, nicotine, SSRIs, or low folate levels
| Right frontal operculum | Right frontal | Dorsal ACC | Right parietal | |
|---|---|---|---|---|
| Ventral ACC | β = 0.09 | β = 0.13 | β = 0.12 | β = 0.16 |
| p = 0.38 | p = 0.18 | p = 0.22 | p = 0.10 | |
| Right frontal operculum | β = 0.08 | β = 0.05 | β = 0.20 | |
| P = 0.42 | p = 0.58 | p = 0.04 | ||
| Right frontal | β = 0.16 | β = 0.27a | ||
| p = 0.10 | p = 0.006 | |||
| Dorsal ACC | β = 0.31a | |||
| p = 0.002 |
Note.
= significant
Table 3.
Prediction of IQ by functional connectivity between each pair of regions within the insular‐temporal/ACC network, controlling for the covariates delay between the intelligence test and the imaging session, and prenatal exposure to cannabis, nicotine, SSRIs, or low folate levels
| Right insula | Left insula | Ventral ACC | Cerebellum | |
|---|---|---|---|---|
| Pons | β = 0.02 | β = 0.06 | β = 0.20 | β = −0.01 |
| p = 0.85 | p = 0.56 | p = 0.05 | p = 0.94 | |
| Right insula | β = 0.09 | β = 0.12 | β = 0.09 | |
| p = 0.34 | p = 0.21 | p = 0.39 | ||
| Left insula | β = 0.14 | β = 0.14 | ||
| p = 0.15 | p = 0.17 | |||
| Ventral ACC | β = 0.12 | |||
| p = 0.22 |
Left parietal‐frontal network
No significant correlations were observed. The positive association between IQ and functional connectivity between the left parietal region (overlapping BAs 7, 39, 40) and the left frontal region (overlapping BAs 6, 9, 10, 45, 46, 47), β = 0.18, P = 0.06 (adjusted α = 0.017), was not significant.
Right parietal‐frontal network
A significant, positive association was observed between IQ and functional connectivity between the right parietal region (overlapping BA 40) and the right frontal region (overlapping BAs 9, 10, 46), β = 0.27, P = 0.006 (adjusted α = 0.011). A significant, positive correlation was also observed between IQ and functional connectivity between the right parietal region and the dorsal ACC (overlapping BA 32), β = 0.31, P = 0.002 (adjusted α = 0.005). The positive association between IQ and functional connectivity between the right parietal region and the right frontal operculum (overlapping BA 47), β = 0.20, P = 0.04 (adjusted α = 0.019), was not significant when controlling for multiple testing.
Insular‐temporal/ACC network
No significant associations were observed. The positive association between IQ and functional connectivity between the ventral ACC and pons, β = 0.20, P = 0.05 (adjusted α = 0.005), was not significant.
Control Analyses
Moderation by age at time of imaging session
None of the associations between IQ and functional connectivity discussed above were moderated by age at time of imaging session, all R 2 change <0.01, all Ps > 0.39.
Moderation by gender
The association between IQ and functional connectivity between the right parietal and frontal regions was significantly moderated by gender, β = 0.20, R 2 change = 0.04, P = 0.04. Also the association between IQ and functional connectivity between the right parietal region and the right frontal operculum was significantly moderated by gender, β = 0.27, R 2 change = 0.05, P = 0.02. The other associations between IQ and functional connectivity discussed above were not moderated by age gender, all R 2 change <0.02, all Ps > 0.24. Thus, the association between IQ and functional connectivity was stronger in girls than in boys in some instances.
Effect of motion
Neither maximum displacement during the rs‐fMRI scan (M = 1.6, SD = 1.1), nor mean movement between two consecutive volumes (M = 0.06, SD = 0.05) was correlated with IQ, both rs < 0.08, both Ps > 0.44. This implies that the association between functional connectivity and IQ is not mediated by motion during imaging.
DISCUSSION
The goal of this study was to examine the association between intelligence and functional connectivity between parietal and frontal regions in young children. Song et al. (2008) have shown that functional connectivity between parietal and frontal regions is associated with intelligence in adults, which is in line with the parieto‐frontal integration theory (P‐FIT) [Jung and Haier, 2007]. This study shows that a similar association exists in young children. We found that higher intelligence in children of 6–8 years old was associated with increased covariance of the resting‐state fluctuations in BOLD response in the right parietal region with the right frontal region. Thus, even though the long‐range connections between parietal and frontal brain regions in young children are still developing [Power et al., 2010; Uddin et al., 2010; Vogel et al., 2010], they are already associated with intelligence.
A major strength of this study is the approach combining independent component analysis (ICA) and seed/target regions correlation analysis. The typical seed region correlation approach, as used in the Song et al. study (2008) study, has the disadvantage that the selection of the size and location of the seed and target regions is rather subjective. To resolve this issue, we first decomposed the rs‐fMRI data into resting‐state networks using ICA, which is a model‐free, objective analysis method [Calhoun et al., 2001; Van den Heuvel and Hulshoff Pol, 2010]. The left and right parietal‐frontal networks [Van den Heuvel and Hulshoff Pol, 2010] were selected for further analysis, because they comprise functional connectivity between parietal and frontal regions. The left frontal, right frontal, medial frontal, left parietal, and right parietal clusters of voxels that made up these networks nicely overlapped with the Brodmann areas (BAs) that have previously been implicated in intelligence [Jung and Haier, 2007]. The separate, yet functionally connected clusters of voxels that constitute the resting‐state networks were subsequently used as seed and target regions. We propose that this approach is highly suitable for future rs‐fMRI studies on the relation between functional connectivity and cognitive function.
The number of derived regions was larger in the right than in the left parietal‐frontal network. One speculative explanation is that functional connectivity in children may be higher in the right than in the left hemisphere. This explanation is in line with a recent EEG study in which children (newborns to 10 years of age), but not adults, showed stronger functional connectivity in the right hemisphere compared to the left [Zhu et al., 2011].
We found that both the left and right parietal‐frontal networks observed included ACC regions, and the right parietal‐frontal network comprised both dorsal and ventral ACC regions. Functional connectivity involving this latter region was not associated with intelligence, which is in line with the notion that it is involved in affective rather than cognitive processing [Bush et al., 2000]. Functional connectivity between the right parietal and dorsal ACC regions, in contrast, was positively correlated with intelligence. The dorsal ACC has been implicated in cognitive processing including, for example, response selection, error detection, working memory, and anticipation of cognitively demanding tasks [Bush et al., 2000]. The P‐FIT specifically postulates that the ACC plays an important role in intelligence‐dependent tasks [Jung and Haier, 2007]. This data suggest that higher intelligence in young children is associated with increased functional connectivity between parietal and dorsal ACC regions.
It is important to note that increased intelligence was not associated with increased functional connectivity within the insular‐temporal/ACC network [Van den Heuvel and Hulshoff Pol, 2010] that does not comprise parietal‐frontal connectivity. Likewise, in the other networks analyzed (reported as Supporting Information) none of the associations between functional connectivity and intelligence reached significance. Even though intelligence is certainly dependent on the orchestration of multiple distributed brain networks, the obtained dissociation of positive correlations between intelligence and functional connectivity between certain brain regions, while not between other brain regions, shows that higher intelligence in children is not associated with increased functional connectivity in general, but with parietal‐frontal connectivity in particular. Also, it has recently been shown that head motion results in spurious decreases in the strength of long‐range connections, and increases in the strength of short‐range connections [Power et al., 2012; Van Dijk et al., 2012]. Our control analyses showed that the observed association between intelligence and long‐range parietal‐frontal functional connectivity was not caused by higher intelligent children moving less during scanning than less intelligent children. Thus, the parietal‐frontal connectivity appears to be a ‘bottleneck’ in the processing of general cognitive information in children as well as in adults.
It should be noted that the association between intelligence and parietal‐frontal functional connectivity was predominantly observed in the right hemisphere. The association between intelligence and parietal‐frontal functional connectivity was present, yet nonsignificant, in the left hemisphere. It is widely acknowledged that nonverbal intelligence depends more on the right hemisphere, while verbal intelligence depends more on the left hemisphere [Bornstein and Matarazzo, 1982; Warrington et al., 1986]. Our findings can thus be explained by the fact that we probed nonverbal intelligence, which is a limitation of this study. Future studies will need to establish whether verbal intelligence in children is associated with parietal‐frontal functional connectivity within the left hemisphere, as may be expected.
A second limitation of the study is that we estimated IQ with two subtests of a standardized intelligence test. As described in the methods section, the sum of the scores on these two subtests correlated highly with the score of the complete intelligence test in a separate sample. Thus, the two subtests yielded a good proxy for intelligence. Also, there was a delay (1 year on average) between the intelligence testing and the imaging session. It has been argued that intelligence is a stable trait, not changing in rank order throughout the life span [Deary et al., 2010]. Recently, however, it has been shown that during the teenage years (i.e., 12–20 yrs), an individual's intelligence level may change relative to that of his or her peers [Ramsden et al., 2011]. In this study, we controlled for the effect of the time between intelligence testing and the imaging session.
Another limitation is that some of the children were prenatally exposed to cannabis, nicotine, SSRI or low folic acid levels. We had no hypothesis about whether and how these prenatal exposures would influence the association between intelligence and parietal‐frontal functional connectivity and we partialled out any variance associated with these factors in the analyses. It is important to note that the children who were not prenatally exposed to any of these factors were recruited from the same population. Furthermore, our analyses in nonexposed children only (reported as Supporting Information) yielded the same pattern of results. Thus, the inclusion of children that were prenatally exposed to cannabis, nicotine, SSRI or low folic acid levels did not affect our conclusions and broadens the generalizability of the findings.
Several previous studies have revealed that gender differences exist in the neurobiology of intelligence [Haier et al., 2005; Schmithorst and Holland, 2006]. Our moderation analyses suggested that the association between intelligence and functional connectivity within the right parietal‐frontal network was stronger in girls than in boys. More research is needed to examine gender differences in the association between intelligence and functional connectivity. Given the well‐known gender differences in verbal and spatial cognitive abilities [Berenbaum and Beltz, 2011], it would be appropriate to consider both verbal and nonverbal IQ when investigating gender differences in the neurobiology of intelligence.
It is thought that rs‐fMRI functional connectivity reflects a history of coactivation between brain regions [Dosenbach et al., 2007; Fair et al., 2007; Power et al., 2010; Van den Heuvel and Hulshoff Pol, 2010]. The P‐FIT postulates that primary sensory cortices initially process information entering the brain, upon which the parietal cortex processes the information on a more elaborate and abstract level. Subsequently, the frontal cortex would test several solutions to the problem at hand, and the ACC would finally select the appropriate response [Jung and Haier, 2007]. Our findings imply that intelligent children are better capable of confronting the many different challenges of everyday life because they have increased interaction between their parietal and frontal lobes.
We probed parietal‐frontal connectivity at one time point only. However, individual differences in intelligence in childhood are presumably mediated by individual differences in the maturation of this parietal‐frontal connection. It may be that the maturation begins earlier or progresses at a faster rate in highly intelligent children. Alternatively, parietal‐frontal functional connectivity maturation might show an entirely different developmental trajectory in high compared to low intelligent children. Longitudinal, developmental studies are needed to determine how the maturation of the parietal‐frontal connection differs between children with different intelligence levels.
CONCLUSION
To conclude, we present results from an rs‐fMRI study exploring the neurobiology of intelligence in children. We show that the functional interaction between parietal and frontal regions, and between parietal and dorsal ACC regions is already associated with intelligence in young children. Longitudinal studies are needed to examine how the maturation of these parietal‐frontal connections differs between children with different intelligence levels.
Supporting information
Supporting Information
ACKNOWLEDGMENTS
The authors thank Christian Röder, MD, for his helpful comments. The Generation R Study is conducted by the Erasmus Medical Center in close collaboration with the School of Law and Faculty of Social Sciences of the Erasmus University Rotterdam, the Municipal Health Service Rotterdam area, Rotterdam, The Rotterdam Homecare Foundation, Rotterdam and The Stichting Trombosedienst & Artsenlaboratorium Rijnmond (STAR‐MDC), Rotterdam. The authors gratefully acknowledge the contribution of children and parents, general practitioners, hospitals, midwives, and pharmacies in Rotterdam. The general design of Generation R Study is made possible by financial support from the Erasmus Medical Center, Rotterdam, The Erasmus University Rotterdam, The Netherlands Organization for Health Research and Development (ZonMw), The Netherlands Organisation for Scientific Research (NWO), The Ministry of Health, Welfare and Sport and the Ministry of Youth and Families.
REFERENCES
- Batista‐Brito R, Fishell G (2009): The developmental integration of cortical interneurons into a functional network. Curr Top Dev Biol 87:81–118. [DOI] [PMC free article] [PubMed] [Google Scholar]
- Benjamini Y, Hochberg Y (1995): Controlling the false discocery rate: a practical and powerful approach to multiple testing. J R Stat Soc: Ser B 57:289–300. [Google Scholar]
- Berenbaum SA, Beltz AM (2011): Sexual differentiation of human behavior: effects of prenatal and pubertal organizational hormones. Front Neuroendocrinol 32:183–200. [DOI] [PubMed] [Google Scholar]
- Best JR, Miller PH (2010): A developmental perspective on executive function. Child Dev 81:1641–1660. [DOI] [PMC free article] [PubMed] [Google Scholar]
- Biswal B, Yetkin FZ, Haughton VM, Hyde JS (1995): Functional connectivity in the motor cortex of resting human brain using echo‐planar MRI. Magn Reson Med 34:537–541. [DOI] [PubMed] [Google Scholar]
- Bornstein RA, Matarazzo JD (1982): Wechsler VIQ versus PIQ differences in cerebral dysfunction: a literature review with emphasis on sex differences. J Clin Neuropsychol 4:319–334. [DOI] [PubMed] [Google Scholar]
- Burgund ED, Kang HC, Kelly JE, Buckner RL, Snyder AZ, Petersen SE, Schlaggar BL (2002): The feasibility of a common stereotactic space for children and adults in fMRI studies of development. NeuroImage 17:184–200. [DOI] [PubMed] [Google Scholar]
- Bush G, Luu P, Posner MI (2000): Cognitive and emotional influences in anterior cingulate cortex. Trends Cognit Sci 4:215–222. [DOI] [PubMed] [Google Scholar]
- Calhoun VD, Adali T, Pearlson GD, Pekar JJ (2001): A method for making group inferences from functional MRI data using independent component analysis. Hum Brain Mapp 14:140–151. [DOI] [PMC free article] [PubMed] [Google Scholar]
- Casey BJ, Tottenham N, Liston C, Durston S (2005): Imaging the developing brain: what have we learned about cognitive development? Trends Cognit Sci 9:104–110. [DOI] [PubMed] [Google Scholar]
- Colom R, Jung RE, Haier RJ (2006): Distributed brain sites for the g‐factor of intelligence. NeuroImage 31:1359–1365. [DOI] [PubMed] [Google Scholar]
- Conway AR, Kane MJ, Engle RW (2003): Working memory capacity and its relation to general intelligence. Trends Cognit Sci 7:547–552. [DOI] [PubMed] [Google Scholar]
- Cox RW (1996): AFNI: Software for analysis and visualization of functional magnetic resonance neuroimages. Comput Biomed Res 29:162–173. [DOI] [PubMed] [Google Scholar]
- Deary IJ, Penke L, Johnson W (2010): The neuroscience of human intelligence differences. Nat Rev Neurosci 11:201–211. [DOI] [PubMed] [Google Scholar]
- Dosenbach NU, Fair DA, Miezin FM, Cohen AL, Wenger KK, Dosenbach RA, Fox MD, Snyder AZ, Vincent JL, Raichle ME, Schlaggar BL, Petersen SE (2007): Distinct brain networks for adaptive and stable task control in humans. Proc Natl Acad Sci USA 104:11073–11078. [DOI] [PMC free article] [PubMed] [Google Scholar]
- Fair DA, Dosenbach NU, Church JA, Cohen AL, Brahmbhatt S, Miezin FM, Barch DM, Raichle ME, Petersen SE, Schlaggar BL (2007): Development of distinct control networks through segregation and integration. Proc Natl Acad Sci USA 104:13507–13512.17679691 [Google Scholar]
- Fangmeier T, Knauff M, Ruff CC, Sloutsky V (2006): FMRI evidence for a three‐stage model of deductive reasoning. J Cognit Neurosci 18:320–334. [DOI] [PubMed] [Google Scholar]
- Fisher RA (1915): Frequency distribution of the values of the correlation coefficient in samples from an indefinitely large population. Biometrika 10:507–521. [Google Scholar]
- Frangou S, Chitins X, Williams SC (2004): Mapping IQ and gray matter density in healthy young people. NeuroImage 23:800–805. [DOI] [PubMed] [Google Scholar]
- Geake JG, Hansen PC (2005): Neural correlates of intelligence as revealed by fMRI of fluid analogies. NeuroImage 26:555–564. [DOI] [PubMed] [Google Scholar]
- Ghosh SS, Kakunoori S, Augustinack J, Nieto‐Castanon A, Kovelman I, Gaab N, Christodoulou JA, Triantafyllou C, Gabrieli JD, Fischl B (2010): Evaluating the validity of volume‐based and surface‐based brain image registration for developmental cognitive neuroscience studies in children 4 to 11 years of age. NeuroImage 53:85–93. [DOI] [PMC free article] [PubMed] [Google Scholar]
- Giedd JN, Lenroot RK, Shaw P, Lalonde F, Celano M, White S, Tossell J, Addington A, Gogtay N (2008): Trajectories of anatomic brain development as a phenotype. Novartis Found Symp 289:101–112; discussion 112–118, 193–195. [DOI] [PMC free article] [PubMed] [Google Scholar]
- Giedd JN, Stockman M, Weddle C, Liverpool M, Alexander‐Bloch A, Wallace GL, Lee NR, Lalonde F, Lenroot RK (2010): Anatomic magnetic resonance imaging of the developing child and adolescent brain and effects of genetic variation. Neuropsychol Rev 20:349–361. [DOI] [PMC free article] [PubMed] [Google Scholar]
- Haier RJ, Jung RE, Yeo RA, Head K, Alkire MT (2004): Structural brain variation and general intelligence. NeuroImage 23:425–433. [DOI] [PubMed] [Google Scholar]
- Haier RJ, Jung RE, Yeo RA, Head K, Alkire MT (2005): The neuroanatomy of general intelligence: Sex matters. NeuroImage 25:320–327. [DOI] [PubMed] [Google Scholar]
- Huttenlocher PR (1990): Morphometric study of human cerebral cortex development. Neuropsychologia 28:517–527. [DOI] [PubMed] [Google Scholar]
- Jaddoe VW, van Duijn CM, van der Heijden AJ, Mackenbach JP, Moll HA, Steegers EA, Tiemeier H, Uitterlinden AG, Verhulst FC, Hofman A (2008): The Generation R Study: design and cohort update until the age of 4 years. Eur J Epidemiol 23:801–811. [DOI] [PubMed] [Google Scholar]
- Jaddoe VW, van Duijn CM, van der Heijden AJ, Mackenbach JP, Moll HA, Steegers EA, Tiemeier H, Uitterlinden AG, Verhulst FC, Hofman A (2010): The Generation R Study: design and cohort update 2010. Eur J Epidemiol 25:823–841. [DOI] [PMC free article] [PubMed] [Google Scholar]
- Jenkinson M, Bannister P, Brady M, Smith S (2002): Improved optimization for the robust and accurate linear registration and motion correction of brain images. NeuroImage 17:825–841. [DOI] [PubMed] [Google Scholar]
- Jenkinson M, Smith S (2001): A global optimisation method for robust affine registration of brain images. Med Image Anal 5:143–156. [DOI] [PubMed] [Google Scholar]
- Jung RE, Haier RJ (2007): The parieto‐frontal integration theory (P‐FIT) of intelligence: converging neuroimaging evidence. Behav Brain Sci 30:135–154. [DOI] [PubMed] [Google Scholar]
- Jung RE, Haier RJ, Yeo RA, Rowland LM, Petropoulos H, Levine AS, Sibbitt WL, Brooks WM (2005): Sex differences in N‐acetylaspartate correlates of general intelligence: an 1H‐MRS study of normal human brain. NeuroImage 26:965–972. [DOI] [PubMed] [Google Scholar]
- Kang HC, Burgund ED, Lugar HM, Petersen SE, Schlaggar BL. (2003): Comparison of functional activation foci in children and adults using a common stereotactic space. NeuroImage 19:16–28. [DOI] [PubMed] [Google Scholar]
- Karama S, Colom R, Johnson W, Deary IJ, Haier R, Waber DP, Lepage C, Ganjavi H, Jung R, Evans AC (2011): Cortical thickness correlates of specific cognitive performance accounted for by the general factor of intelligence in healthy children aged 6 to 18. NeuroImage 55:1443–1453. [DOI] [PMC free article] [PubMed] [Google Scholar]
- Lee KH, Choi YY, Gray JR, Cho SH, Chae JH, Lee S, Kim K (2006): Neural correlates of superior intelligence: stronger recruitment of posterior parietal cortex. NeuroImage 29:578–586. [DOI] [PubMed] [Google Scholar]
- Luo L, O'Leary DD (2005): Axon retraction and degeneration in development and disease. Ann Rev Neurosci 28:127–156. [DOI] [PubMed] [Google Scholar]
- Maldjian JA, Laurienti PJ, Burdette JH (2004): Precentral gyrus discrepancy in electronic versions of the Talairach atlas. NeuroImage 21:450–455. [DOI] [PubMed] [Google Scholar]
- Maldjian JA, Laurienti PJ, Kraft RA, Burdette JH (2003): An automated method for neuroanatomic and cytoarchitectonic atlas‐based interrogation of fMRI data sets. NeuroImage 19:1233–1239. [DOI] [PubMed] [Google Scholar]
- Noveck IA, Goel V, Smith KW (2004): The neural basis of conditional reasoning with arbitrary content. Cortex 40:613–622. [DOI] [PubMed] [Google Scholar]
- Olesen PJ, Nagy Z, Westerberg H, Klingberg T (2003): Combined analysis of DTI and fMRI data reveals a joint maturation of white and grey matter in a fronto‐parietal network. Cognit Brain Res 18:48–57. [DOI] [PubMed] [Google Scholar]
- Pfleiderer B, Ohrmann P, Suslow T, Wolgast M, Gerlach AL, Heindel W, Michael N (2004): N‐acetylaspartate levels of left frontal cortex are associated with verbal intelligence in women but not in men: a proton magnetic resonance spectroscopy study. Neuroscience 123:1053–1058. [DOI] [PubMed] [Google Scholar]
- Power JD, Barnes KA, Snyder AZ, Schlaggar BL, Petersen SE (2012): Spurious but systematic correlations in functional connectivity MRI networks arise from subject motion. NeuroImage 59:2142–2151. [DOI] [PMC free article] [PubMed] [Google Scholar]
- Power JD, Fair DA, Schlaggar BL, Petersen SE (2010): The development of human functional brain networks. Neuron 67:735–748. [DOI] [PMC free article] [PubMed] [Google Scholar]
- Ramsden S, Richardson FM, Josse G, Thomas MS, Ellis C, Shakeshaft C, Seghier ML, Price CJ (2011): Verbal and non‐verbal intelligence changes in the teenage brain. Nature 479:113–116. [DOI] [PMC free article] [PubMed] [Google Scholar]
- Schmithorst VJ, Holland SK (2006): Functional MRI evidence for disparate developmental processes underlying intelligence in boys and girls. NeuroImage 31:1366–1379. [DOI] [PubMed] [Google Scholar]
- Schmithorst VJ, Wilke M, Dardzinski BJ, Holland SK (2005): Cognitive functions correlate with white matter architecture in a normal pediatric population: A diffusion tensor MRI study. Hum Brain Mapp 26:139–147. [DOI] [PMC free article] [PubMed] [Google Scholar]
- Shaw P, Greenstein D, Lerch J, Clasen L, Lenroot R, Gogtay N, Evans A, Rapoport J, Giedd J (2006): Intellectual ability and cortical development in children and adolescents. Nature 440:676–679. [DOI] [PubMed] [Google Scholar]
- Smith SM, Fox PT, Miller KL, Glahn DC, Fox PM, Mackay CE, Filippini N, Watkins KE, Toro R, Laird AR, Beckmann CF (2009): Correspondence of the brain's functional architecture during activation and rest. Proc Natl Acad Sci 106:13040–13045. [DOI] [PMC free article] [PubMed] [Google Scholar]
- Smith SM, Jenkinson M, Woolrich MW, Beckmann CF, Behrens TE, Johansen‐Berg H, Bannister PR, De Luca M, Drobnjak I, Flitney DE, Niazy RK, Saunders J, Vickers J, Zhang Y, De Stefano N, Brady JM, Matthews PM (2004): Advances in functional and structural MR image analysis and implementation as FSL. NeuroImage 23 ( Suppl 1):S208–S219. [DOI] [PubMed] [Google Scholar]
- Song M, Zhou Y, Li J, Liu Y, Tian L, Yu C, Jiang T (2008): Brain spontaneous functional connectivity and intelligence. NeuroImage 41:1168–1176. [DOI] [PubMed] [Google Scholar]
- Tellegen PJ, Winkel M, Wijnberg‐Williams B, Laros JA (2005):Snijders‐Oomen Niet‐Verbale Intelligentietest: SON‐R 2 ½ ‐7.Amsterdam:Boom Testuitgevers. [Google Scholar]
- Uddin LQ, Supekar K, Menon V (2010): Typical and atypical development of functional human brain networks: insights from resting‐state FMRI. Front Syst Neurosci 4:21. [DOI] [PMC free article] [PubMed] [Google Scholar]
- Van den Heuvel MP, Hulshoff Pol HE (2010): Exploring the brain network: a review on resting‐state fMRI functional connectivity. Eur Neuropsychopharmacol 20:519–534. [DOI] [PubMed] [Google Scholar]
- Van den Heuvel MP, Stam CJ, Kahn RS, Hulshoff Pol HE (2009): Efficiency of functional brain networks and intellectual performance. J Neurosci 29:7619–7624. [DOI] [PMC free article] [PubMed] [Google Scholar]
- Van Dijk KR, Sabuncu MR, Buckner RL (2012): The influence of head motion on intrinsic functional connectivity MRI. NeuroImage 59:431–438. [DOI] [PMC free article] [PubMed] [Google Scholar]
- Vogel AC, Power JD, Petersen SE, Schlaggar BL (2010): Development of the brain's functional network architecture. Neuropsychol Rev 20:362–375. [DOI] [PMC free article] [PubMed] [Google Scholar]
- Wang L, Song M, Jiang T, Zhang Y, Yu C (2011): Regional homogeneity of the resting‐state brain activity correlates with individual intelligence. Neurosci Lett 488:275–278. [DOI] [PubMed] [Google Scholar]
- Warrington EK, James M, Maciejewski C (1986): The WAIS as a lateralizing and localizing diagnostic instrument: A study of 656 patients with unilateral cerebral lesions. Neuropsychologia 24:223–239. [DOI] [PubMed] [Google Scholar]
- White T, O'Leary D, Magnotta V, Arndt S, Flaum M, Andreasen NC (2001): Anatomic and functional variability: The effects of filter size in group fMRI data analysis. NeuroImage 13:577–588. [DOI] [PubMed] [Google Scholar]
- Wilke M, Sohn JH, Byars AW, Holland SK (2003): Bright spots: correlations of gray matter volume with IQ in a normal pediatric population. NeuroImage 20:202–215. [DOI] [PubMed] [Google Scholar]
- Winkel M, Tellegen A (2001): Intelligentietests voor jonge kinderen: de SON‐R 2.5–7 en andere intelligentietests [Intelligence tests for young children: de SON‐R 2.5–7 and other intelligence tests]. Kind Adolescent 22:141–151. [Google Scholar]
- Yurgelun‐Todd D (2007): Emotional and cognitive changes during adolescence. Curr Opin Neurobiol 17:251–257. [DOI] [PubMed] [Google Scholar]
- Zhu C, Guo X, Jin Z, Sun J, Qiu Y, Zhu Y, Tong S (2011): Influences of brain development and ageing on cortical interactive networks. Clin Neurophysiol 122:278–283. [DOI] [PubMed] [Google Scholar]
Associated Data
This section collects any data citations, data availability statements, or supplementary materials included in this article.
Supplementary Materials
Supporting Information