

Abstract
The past decade has seen significant developments in the concurrent use of transcranial magnetic stimulation (TMS) and electroencephalography (EEG) to directly assess cortical network properties such as excitability and connectivity in humans. New hardware solutions, improved EEG amplifier technology, and advanced data processing techniques have allowed substantial reduction of the TMS‐induced artifact, which had previously rendered concurrent TMS–EEG impossible. Various physiological artifacts resulting from TMS have also been identified, and methods are being developed to either minimize or remove these sources of artifact. With these developments, TMS–EEG has unlocked regions of the cortex to researchers that were previously inaccessible to TMS. By recording the TMS‐evoked response directly from the cortex, TMS–EEG provides information on the excitability, effective connectivity, and oscillatory tuning of a given cortical area, removing the need to infer such measurements from indirect measures. In the following review, we investigate the different online and offline methods for reducing artifacts in TMS–EEG recordings and the physiological information contained within the TMS‐evoked cortical response. We then address the use of TMS–EEG to assess different cortical mechanisms such as cortical inhibition and neural plasticity, before briefly reviewing studies that have utilized TMS–EEG to explore cortical network properties at rest and during different functional brain states. Hum Brain Mapp, 2013. © 2012 Wiley Periodicals, Inc.
Keywords: transcranial magnetic stimulation, electroencephalography, cortical inhibition, neural plasticity
INTRODUCTION
Transcranial magnetic stimulation (TMS) is a noninvasive method of stimulating cortical neurons in humans. Following the induction of TMS by Barker and colleagues [1985], the technique has been extensively used across a range of fields including motor [Reis et al., 2008] and visual physiology [Merabet et al., 2003], cognitive neuroscience [Pascual‐Leone et al., 2000], and more recently as a clinical treatment for psychiatric disorders such as depression [Daskalakis et al., 2008c]. TMS utilizes the properties of electromagnetism to stimulate cortical tissue while minimizing stimulation of other peripheral structures. A strong, brief electrical current is passed through shielded circular copper coils, resulting in a perpendicular magnetic field. When placed over the head, this rapidly changing magnetic field passes through the skull and elicits small eddy currents in the underlying cortical tissue [Rothwell, 1997].
TMS depolarizes both pyramidal neurons and interneurons in the cortex depending on the orientation and strength of the TMS‐induced current flow within the cortical tissue. When applied to the motor cortex, the effect of TMS on the cortex can be indirectly measured by recording the motor output of peripheral muscles controlled by the stimulated region of cortex using surface electromyography (EMG). The compound motor‐evoked potential (MEP) in the muscle resulting from motor cortex TMS results from a series of waves or volleys descending the corticospinal tract, which can be measured either from single motor units using needle electrodes in peripheral muscles [Amassian et al., 1989; Day et al., 1989] or directly from the corticospinal tract using epidural electrodes in the spinal cord [Di Lazzaro et al., 1998a; Nakamura et al., 1996]. The earliest of these waves is termed a direct or D‐wave and is thought to result from direct depolarization of pyramidal corticospinal neurons in the cortex by TMS. The D‐wave is followed by a series of indirect or I‐waves, which occur at intervals of ∼1.5 ms reflecting periods of synaptic discharge delay. Whereas D‐waves are generally activated at higher TMS intensities, I‐waves occur at lower TMS intensities and most likely result from the preferential stimulation of interneurons or cortico‐cortical axons orientated horizontally to the scalp which depolarize pyramidal cells trans‐synaptically [Amassian et al., 1992b]. In addition, the latter I‐waves are reduced following a sub‐threshold conditioning TMS pulse [Di Lazzaro et al., 1998b] and administration of γ‐aminobutyric acid (GABA) agonists [Di Lazzaro et al., 2000] suggesting TMS also activates inhibitory interneurons. The ability of TMS to preferentially stimulate these different sub‐populations of neurons has allowed the study of facilitatory and inhibitory interactions within the motor cortex of humans.
Despite these and other indirect measures for quantifying the effect of TMS, such as changes in task performance or interruptions in sensory processing (i.e., visual phosphenes), the ability to measure the direct effects of TMS on the cortex has been limited. The electromagnetic interference resulting from the TMS‐evoked magnetic field gradient creates large recording artifacts in other neuroimaging techniques such as electroencephalography (EEG). However, the last decade has seen the combination of TMS with several neuroimaging modalities including functional magnetic resonance imaging (fMRI) [Bohning et al., 1998, 1999], positron emission tomography (PET) [Fox et al., 1997; Paus et al., 1997], single‐photon emission computed tomography [Nahas et al., 2001], and near‐infrared spectroscopy [Noguchi et al., 2003], each providing a new insight into the direct neural effects of TMS. In addition, various hardware solutions, recent advances in EEG amplifier technology, and the continued development of EEG data analysis techniques have enabled concurrent recording of EEG during TMS [Ilmoniemi et al., 1997]. The main advantages of concurrent TMS–EEG over other combined TMS neuroimaging techniques is the excellent temporal resolution of EEG, allowing measurement of the cortical TMS‐evoked response in the millisecond time range.
The achievement of concurrent TMS–EEG recordings has generated two main streams of research. The first is concerned with measuring the cortical activity evoked by TMS. Electrical activity recorded at the scalp via EEG is thought to represent the summated postsynaptic potentials of the underlying pyramidal neurons [Kirschstein and Kohling, 2009], and hence provides a way of directly measuring TMS‐evoked cortical potentials in humans. TMS‐evoked potentials provide information on the excitability, oscillatory properties, and the connectivity of cortical networks [Casali et al., 2010; Casarotto et al., 2010]. Combined with TMS paradigms designed to assess different cortical mechanisms, the measurement of TMS‐evoked potentials provides a powerful tool to assess cortical dynamics both at rest and during functional tasks [Massimini et al., 2005; Morishima et al., 2009].
The second stream of research uses TMS–EEG to directly determine the effect of TMS on brain function. In this approach, researchers measure the effect of TMS on event‐related potentials using EEG. Such experiments have revealed causal interactions between brain regions involved in cognitive and sensory processing [Fuggetta et al., 2006; Taylor et al., 2007a, b; Thut et al., 2003, 2005].
In the current review, we focus on the TMS‐evoked brain response measured using EEG. We begin by describing the recording and physiological artifact sources that can confound TMS–EEG recordings. We then describe the TMS‐evoked cortical potential and explore the physiological information contained within this response. We finish by reviewing paradigms designed to investigate cortical mechanisms such as inhibition and neural plasticity using TMS–EEG. In addition, we briefly review studies utilizing TMS–EEG to compare properties of resting cortical regions and to investigate functional modulation of cortical networks.
ARTIFACT SOURCES IN TMS–EEG
A major obstacle to successfully recording EEG during TMS is the various recording and physiological artifacts associated with the technique. Artifacts induced in the recording equipment resulting from the strong (albeit brief), magnetic field gradient created by TMS have presented the major technological hurdle, while separating physiological artifacts such as sensory evoked potentials from the TMS‐evoked potential remains a continuing and salient challenge.
Amplifier Artifact
The main difficulty in recording EEG during TMS is the effect of the strong magnetic field gradient produced by TMS on the EEG amplifiers. To record the weak potentials across the scalp, EEG amplifiers are necessarily very sensitive. Time‐varying magnetic fields of strong magnitude (up to 3 T) result in magnetic field gradients that cause large artifacts in the input stage of standard EEG amplifiers, resulting in immediate saturation. Following saturation, the amplifier can take several hundred milliseconds to recover to a linear recording range, and later, artifacts can also result from voltages stored in the filter stages [Virtanen et al., 1999]. Early studies using concurrent TMS–EEG positioned small numbers of EEG electrode pairs away from the TMS coil [Cracco et al., 1989]. This approach minimized the artifact and allowed for recording of connectivity between brain regions. However, these experiments were severely limited in scope as only a small number of electrode pairs could be used and electrodes needed to be positioned away from the site of stimulation. As a result, only a limited number of studies ensued using this arrangement [Amassian et al., 1992a; Meyer and Roricht, 1995], whereas other approaches continued to suffer the long‐saturation artifact [Dhuna et al., 1991; Hufnagel et al., 1990; Izumi et al., 1997].
Because these early attempts, several approaches have been implemented to prevent amplifier saturation and allow higher resolution EEG recording. Ilmoniemi and colleagues [1997] introduced a technique which utilized a sample‐and‐hold circuit to pin the amplifier for several milliseconds during the TMS pulse, hence protecting the amplifier from saturation [Ilmoniemi et al., 1997; Virtanen et al., 1999]. This sample‐and‐hold method allows artifact‐free EEG recording following several (>3) milliseconds post‐TMS in most electrodes across the scalp [Ilmoniemi et al., 1997]. However, electrodes near the stimulating coil still suffer from residual artifacts (<30 ms), particularly at higher stimulation intensities [Komssi et al., 2004; Paus et al., 2001; Virtanen et al., 1999], and analyses of events occurring immediately after TMS are still precluded.
In a separate approach, Thut and colleagues [2003] used a low slew rate preamplifier to prevent saturation of the EEG amplifier, hence allowing recording of the TMS artifact. In addition, the TMS pulse was synchronized to the sampling rate of the EEG device to reduce the variability of the artifact, preventing random scatter of the TMS voltages in relation to the sampling cycle. As the authors were primarily interested in the effect of TMS on sensory‐evoked potentials [Thut et al., 2003, 2005], EEG traces obtained following TMS were subtracted from those obtained following TMS administered during a sensory task. This subtraction technique accounts for both mechanical and physiological artifacts resulting from TMS; however, it also eliminates TMS‐evoked cortical events [Thut et al., 2005].
A limitation of both above approaches is that dedicated hardware systems are required in addition to EEG systems. Improvements in amplifier technology such as increased analog‐to‐digital converter (ADC) resolution and DC‐coupling permit some modern EEG amplifiers to recover fast enough following TMS to record relevant EEG data. One such amplifier allows adjustment of ADC resolution and operational range to accommodate the TMS pulse [Bonato et al., 2006; Sekiguchi et al., 2011]. Amplifier recovery time following the TMS pulse is reported at less than 6 ms, is independent of stimulus intensity, and is unaffected in length by high‐frequency stimulation (<20 Hz) in phantom head models [Veniero et al., 2009]. Similarly, another commercially available EEG amplifier utilizes high acquisition rates (>10 kHz), wide operational range, and DC‐coupling to avoid saturation and record the TMS artifact [Daskalakis et al., 2008a; Fitzgerald et al., 2008]. Despite the fast recovery of these EEG systems following TMS, electrodes at the site of stimulation still suffer from similar residual artifacts to those reported in commercial TMS–EEG systems. An example of a TMS‐evoked EEG response recorded using a DC‐coupled amplifier is provided in Figure 1.
Figure 1.
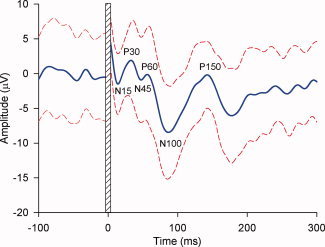
TMS‐evoked EEG response to single pulse stimulation over the motor cortex in an individual participant. The thick line represents the mean EEG trace, whereas the dashed lines represent the standard deviations. The peaks and troughs represented in this figure have been widely reported following stimulation of the motor cortex, although some variation in peak latency and size has been reported between individuals and between different recording arrangements [Bonato et al., 2006; Ilmoniemi and Kicic, 2010; Komssi et al., 2002, 2004; Lioumis et al., 2009; Paus et al., 2001; Van Der Werf and Paus, 2006]. Data are the mean of 40 trials from C3 sampled at 10,000 Hz (DC—2,000 Hz), downsampled to 1,000 Hz offline, epoched, baseline corrected and filtered (1–50 Hz). To prevent ringing artifacts resulting from filtering, the large, high‐frequency TMS artifact was removed before filtering. [Color figure can be viewed in the online issue, which is available at wileyonlinelibrary.com.]
Residual Artifacts at the Electrode
Electrodes close to the sight of stimulation often suffer from a large positive shift that recovers to a linear recording range within 50 ms. This artifact is not related to amplifier saturation and is likely to reflect a combination of the buildup of eddy‐currents at the electrodes [Veniero et al., 2009], other additional charges stored at the electrode‐skin interface [Litvak et al., 2007; Virtanen et al., 1999] and electromotive forces induced in the electrode lead wires [Sekiguchi et al., 2011]. The buildup of eddy‐currents can result in both movement and heating of the electrodes during TMS, both of which are potential sources of artifact [Veniero et al., 2009; Virtanen et al., 1999]. Heating of electrodes also poses a potential burn risk to underlying tissue [Roth et al., 1992] and is, therefore, an important safety consideration. Standard Ag/AgCl electrodes with a 3 mm slit to interrupt eddy‐current generation adequately prevent heating and reduce the electrode artifact [Virtanen et al., 1999]. Alternatively, Ives and colleagues [2006] have developed a conductive plastic electrode coated with a layer of Ag/AgCl, which is compatible with TMS and reduces artifact. Smaller Ag/AgCl sintered TMS‐compatible pellet electrodes are also widely used and sufficiently reduce TMS artifact and heating [Veniero et al., 2009; Virtanen et al., 1999].
Additional charges stored at the electrode‐skin interface are also likely to significantly contribute to the residual TMS–EEG artifact [Ilmoniemi and Kicic, 2010; Litvak et al., 2007; Paus et al., 2001; Thut et al., 2005], although the contribution of such an artifact remains to be systematically evaluated. Careful preparation of the skin underlying the electrodes, and some additional measures such as short‐circuiting the epithelial layer by creating small punctures in the skin, can significantly reduce both the artifact amplitude and duration [Julkunen et al., 2008]; however, further work addressing this source of artifact is required.
In addition to charges at the sensor‐scalp interface, Sekiguchi and colleagues proposed that the residual artifact may reflect electromotive interference in the recording/reference electrode circuit [Sekiguchi et al., 2011]. The authors reasoned that the electromotive force could be cancelled out with appropriate arrangement of the TMS coil in relation to the recording and reference leads. By positioning the lead wires perpendicular to the coil handle, the residual artifact was significantly reduced in both a model study of the TMS–EEG system and during human recordings. Importantly, the artifact remained minimal even with stimulation intensity at 88% of maximum stimulator output [Sekiguchi et al., 2011].
Several offline artifact removal techniques have been proposed to complement online minimization of artifact sources. The simplest involves discarding affected data, which is far from ideal [Komssi et al., 2004]. In a similar approach to that taken by Thut and colleagues [2003], Bender and colleagues proposed subtracting a template artifact (built on a phantom head model) from the trace collected from human recordings. This approach proved problematic, however, as the phantom head artifact did not completely represent that recorded from the human scalp [Bender et al., 2005]. More advanced subtraction techniques using artifact templates built following principal component analysis (PCA) [Levit‐Binnun et al., 2010; Litvak et al., 2007] and independent component analysis (ICA) [Hamidi et al., 2010] have also been proposed. In this approach, either PCA or ICA is used to identify and remove artifact components from the TMS‐evoked potential based on each individual's data. Although results using this technique appear promising, interpretation is somewhat limited as there is currently no way of verifying that brain activity is not being removed along with the artifact components (see below). The use of filters to eliminate the artifact has also been proposed, but requires further verification [Morbidi et al., 2007].
Sensory‐Evoked Potentials, Muscle Activity, and Eye Movement
In addition to artifacts in the recording equipment, TMS also activates various sensory systems, resulting in sensory‐evoked potentials in the EEG, which can contaminate the TMS‐evoked potential. Discharge of the TMS coil results in a loud clicking noise (<120 dB), which causes an auditory‐evoked potential consisting of both an air [Nikouline et al., 1999; Tiitinen et al., 1999] and bone [Nikouline et al., 1999] conducted component. The latency of this auditory‐evoked potential coincides with peaks in EEG following TMS (the N100/P190 complex). Wearing sound‐protective headphones [Nikulin et al., 2003] or playing white noise through earphones [Massimini et al., 2005; Paus et al., 2001; Veniero et al., 2010] sufficiently masks the air‐conducted component of the coil click and reduces auditory‐evoked potentials. Alternatively, the auditory‐evoked potential can be effectively removed from the TMS‐evoked potential by subtracting EEG traces measured during sham stimulation from EEG traces measured during real stimulation [Daskalakis et al., 2008a].
Discharge of the TMS coil also activates sensory afferents in the underlying scalp resulting in somatosensory input. Trigeminal nerve afferents are activated both mechanically by brief coil vibration (often reported as a tapping sensation) and directly by depolarization of the afferents themselves [Ilmoniemi and Kicic, 2010]. This stimulation of the scalp following TMS is sufficient to elicit somatosensory‐evoked potentials; however, such evoked potentials occur primarily in the contralateral hemisphere to the site of stimulation and do not match the TMS‐elicited response [Paus et al., 2001]. In addition, some studies have placed a thin layer of foam between the scalp and coil to minimize the somatic sensation of the coil vibration [Massimini et al., 2005].
TMS can also directly depolarize scalp or facial muscle fibers. This evoked muscle activation is likely to contaminate the early EEG components (<30 ms post TMS), particularly over lateral and prefrontal areas [Kahkonen et al., 2003; Veniero et al., 2010]; however, such activation is dependent on coil position and is either not present or minimal following motor cortex stimulation [Kahkonen et al., 2001; Veniero et al., 2010]. At sites where muscle activity cannot be avoided, muscle artifact may be removed using similar PCA and ICA removal techniques to that used for the residual artifact [Korhonen et al., 2011; Maki and Ilmoniemi, 2010a]. It should be noted that both PCA and ICA are limited to the extent in which artifact sources can be separated from neural activity. Large muscle artifacts such as those generated by TMS and other large artifacts such as those resulting from electrode movement can span many of the available components leaving few to represent neural activity [Onton et al., 2006]. In addition, muscle artifacts with similar amplitudes to highly fluctuating EEG signals (such as weak tonic muscle contractions) or artifacts temporally locked to neural activity (such as evoked muscle, ocular, and neural activity following a TMS pulse) can result in poor source separation and subsequent “leaking” of neural activity in to artifactual components [Castellanos and Makarov, 2006; Lagerlund et al., 1997; McMenamin et al., 2010]. As a result, removal of artifacts with these techniques can result in degradation of the neural signal, particularly in electrodes close to the artifact source [Korhonen et al., 2011; Maki and Ilmoniemi, 2010a].
Somatosensory input to the cortex can be further generated by the activation of peripheral muscles following TMS over motor cortex. Suprathreshold TMS over the motor cortex results in a MEP in the muscle controlled by the targeted cortical area (often a small hand muscle). This MEP produces muscle contraction and, consequently, joint movement resulting in additional somatosensory‐evoked potentials occurring at the stimulated motor cortex [Komssi et al., 2002; Nikulin et al., 2003; Paus et al., 2001; Schurmann et al., 2001]. The early components of the TMS‐evoked potential (<40 ms) are unlikely to be affected by this somatosensory‐evoked potential due to the conduction time from the cortex to the muscle and back again [Komssi et al., 2002; Paus et al., 2001]. Later, components also appear unaffected, as amplitude peaks such as N45 and N100 are independent of MEP amplitude and occur at sub‐threshold intensities [Komssi et al., 2004, 2007; Nikulin et al., 2003; Paus et al., 2001].
Eye movements such as blinking have a profound effect on EEG recordings, particularly in frontal electrodes. In some individuals, TMS evokes a blinking response either as a startle reflex or via activation of the ocular muscles (particularly when given over prefrontal cortex). This blink response results in considerable contamination of the TMS‐evoked potential. The blink artifact has been managed by either discarding the affected data [Komssi et al., 2004] or by implementing an eye correction algorithm [Daskalakis et al., 2008a; Fitzgerald et al., 2008].
PHYSIOLOGICAL INFORMATION CONTAINED IN TMS‐EVOKED POTENTIALS
When artifact sources are appropriately controlled for, TMS–EEG can provide a wealth of information on stimulated cortical networks. TMS evokes simultaneous activity in a large population of both excitatory and inhibitory neurons in the underlying cortex. The ensuing cortical response is dependent on both the intrinsic properties of the stimulated neurons and the nature of their synaptic connections with other cortical and sub‐cortical regions. EEG provides a method for directly measuring both the local cortical response to TMS and the resultant activation of connected cortical regions, providing information on the excitability, oscillatory tuning, and connectivity of the underlying cortical network.
TMS‐Evoked Potentials
TMS results in a highly reproducible evoked potential in EEG recordings [Casarotto et al., 2010; Lioumis et al., 2009], which is sensitive to change in stimulation parameters such as intensity [Casarotto et al., 2010; Kahkonen et al., 2005b; Komssi et al., 2004], coil angle [Bonato et al., 2006; Casarotto et al., 2010], and site of stimulation [Casarotto et al., 2010; Fitzgerald et al., 2008; Kahkonen et al., 2004, 2005a; Komssi et al., 2002; Rosanova et al., 2009]. The TMS‐evoked potential contains a series of peaks and troughs lasting up to 300 ms, which is greatest at the site of stimulation [Bonato et al., 2006; Komssi et al., 2004] (Fig. 1, Fig. 2). The electrophysiological nature of these fluctuations is difficult to interpret directly, as EEG represents the summation of both excitatory postsynaptic potentials (EPSPs) and inhibitory postsynaptic potentials (IPSPs) over a large population of neurons [Kirschstein and Kohling, 2009]. However, the amplitude of this TMS‐evoked response appears to relay information on the excitability and reactivity of the underlying cortical networks, as the amplitude of the peaks and troughs are sensitive to both functional [Massimini et al., 2005; Morishima et al., 2009] and experimental [Esser et al., 2006; Ferrarelli et al., 2010] changes in cortical excitability. The TMS‐evoked potential is also sensitive to sub‐threshold TMS intensities, revealing previously undescribed effects of TMS at low intensities [Komssi et al., 2004, 2007]. In addition to activating neurons directly beneath the coil, neuroimaging studies [Bohning et al., 1999; Fox et al., 1997; Paus et al., 1997; Strafella et al., 2001] and studies directly measuring the activity of sub‐cortical structures [Strafella et al., 2004] have revealed that TMS also results in activation of remote brain regions connected to the site of stimulation via cortico‐cortical and cortico‐subcortical connections. This remote activation is likely to contaminate EEG recordings at the site of stimulation due to volume conductance. However, analyses of current density plots and source modeling techniques allow for estimations on the regions contributing to each component of the TMS‐evoked potential, hence providing information on the spatiotemporal spread of activation following TMS [Ilmoniemi et al., 1997; Massimini et al., 2005] (see source localization and cortical connectivity below).
Figure 2.
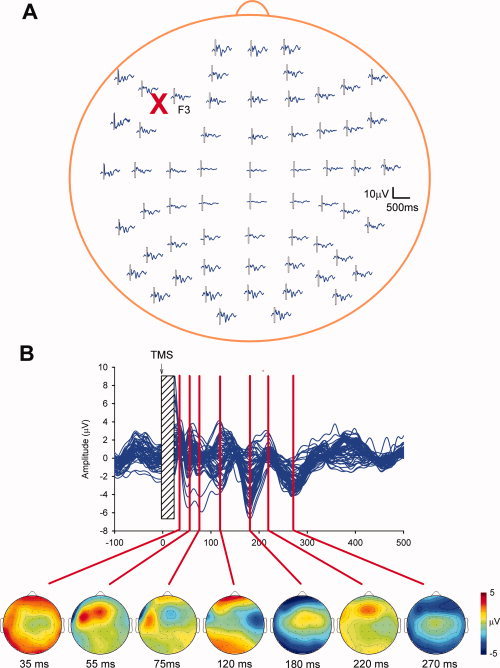
The spread of activation following single pulse TMS over the prefrontal cortex of an individual participant. A: Typical 62‐channel electrode layout displaying the mean EEG responses to prefrontal cortex TMS at each electrode (FC3 was removed due to artifact). B: Butterfly plot (upper) displaying the response of 61 channels following TMS over the prefrontal cortex. Topographic head maps showing the voltage distribution at various time points following TMS are also included (lower). Notice how the voltage density moves from beneath the coil (35 ms) both posteriorly (55 and 120 ms) and toward the midline and contralateral hemisphere. See Kahkonen et al. [2005b] and Rosanova et al. [2009] for further descriptions of the TMS–EEG response over prefrontal cortex. Present data are the mean of 75 trials sampled at 20,000 Hz (DC—3,500 Hz), downsampled to 1,000 Hz offline, epoched, baseline corrected and filtered (1–50 Hz). The TMS artifact and the early response (−3 to 25 ms) were removed before filtering. Topographic head maps were obtained using EEGLAB toolbox in MATLAB [Delorme and Makeig, 2004]. [Color figure can be viewed in the online issue, which is available at wileyonlinelibrary.com.]
To some degree, the early TMS‐evoked response at the site of stimulation is likely to represent the fluctuation between EPSPs and IPSPs mediated by α‐amino‐3‐hydroxy‐5‐methyl‐4‐isoxazolepropionic acid, N‐methyl‐d‐aspartic acid (NMDA), and GABA receptors in the stimulated cortical network, similar to those observed following both animal [Connors et al., 1988; Moliadze et al., 2003; Stern et al., 1992; Sutor and Hablitz, 1989a, b] and modeling [Esser et al., 2005] studies of cortical stimulation. Much of the information in EEG regarding the immediate synaptic potential responses following the TMS pulse is lost due to TMS artifact, however later activity (10–30 ms) appears to represent both EPSPs and IPSPs [Komssi et al., 2004]. For instance, the amplitude of the MEP following motor cortex stimulation correlates with the amplitude of the N15/P30 complex [Maki and Ilmoniemi, 2010b] and altering coil angle attenuates the amplitude of both the MEP and the N15/P30 waveform [Bonato et al., 2006]. Given that MEP generation is dependent on the predominance of EPSPs in corticospinal pyramidal neurons, these early peaks appear to relay some information on cortical EPSPs. Conversely, the administration of GABAA agonists such as the benzodiazepine midazolam greatly increases the amplitude of these early peaks [Ferrarelli et al., 2010], inferring that IPSPs are also represented in these early traces. The later components of the EEG response to TMS (50–200 ms) are likely to, in part, represent slower GABAB‐mediated IPSPs. For example, the N100 component over motor electrodes is increased in participants who actively attempt to inhibit the amplitude of the TMS‐evoked MEP [Bonnard et al., 2009] (for further discussion see “Cortical Inhibition” section below).
Cortical Oscillations
Neural oscillations in cortical networks are the result of the synchronous firing of neuronal populations and are important in the functional coordination of brain activity [Uhlhaas et al., 2009]. Oscillatory activity occurs across a wide spectrum of frequencies (0.05–500 Hz), which are often grouped into specific bandwidths. High‐frequency oscillations such as beta (13–30 Hz) and gamma band oscillations (30–200 Hz) coordinate local network activity, whereas lower frequency oscillations such as those in the theta (4–7 Hz) and alpha (8–12 Hz) bands tend to mediate synchronization over longer distances [von Stein et al., 2000]. The frequency of oscillations within and across cortical networks is dependent on several factors including the membrane properties and synaptic connections of the neurons within a network and the state of the neural system (for a review see Buzsaki and Draguhn [2004]). For instance, gamma oscillations arise from networks consisting of fast‐spiking inhibitory interneurons with membrane properties optimized for firing at high frequencies (∼40 Hz). Projections on to adjacent pyramidal cells and close coupling with other fast‐spiking interneurons both synaptically and via gap‐junctions allow these inhibitory networks to effectively entrain local neural populations to fire at gamma frequencies [Bartos et al., 2007; Cardin et al., 2009; Sohal et al., 2009]. Different frequency oscillations appear to subserve specific and overlapping functional roles. For example, theta and gamma frequencies are associated with memory processes such as short‐term plasticity and working memory [Duzel et al., 2010]. Alternatively, alpha and beta frequencies are associated with aspects of motor functioning [Neuper et al., 2006].
Following the synchronized discharge of neurons after TMS, a brief period of oscillatory firing also occurs within the stimulated cortical network. For example, TMS over motor cortex results in synchronous alpha [Brignani et al., 2008; Fuggetta et al., 2005] and beta range [Brignani et al., 2008; Fuggetta et al., 2005; Paus et al., 2001; Van Der Werf and Paus, 2006] oscillations for up to 300 ms following stimulation. Alternatively, TMS over frontal regions results in synchronous firing in upper beta and gamma range frequencies [Ferrarelli et al., 2008; Rosanova et al., 2009]. The discrete dominant oscillatory frequencies observed following TMS to different cortical regions may represent functionally distinct organization of these regions (for discussion see “Comparing Resting Cortical Network Properties” section). TMS‐evoked oscillations are highly phase‐locked to the TMS pulse across trials [Ferrarelli et al., 2008; Paus et al., 2001], and the frequencies are independent of the stimulus amplitude [Fuggetta et al., 2005; Rosanova et al., 2009]. This evidence, along with the differing frequencies observed across cortical regions, suggests that TMS‐evoked oscillations result from the resetting of ongoing oscillatory activity in the region stimulated, as opposed to being actively induced by TMS itself [Fuggetta et al., 2005; Paus et al., 2001; Rosanova et al., 2009].
Subcortical structures such as the thalamus appear to play an important role in the generation and amplification of the TMS‐evoked cortical oscillations. For instance, in patients suffering from Parkinson's disease who had undergone unilateral lesioning of the thalamus, the amplitudes of TMS‐evoked beta oscillations over motor cortex were markedly reduced in the lesioned hemisphere compared with the unlesioned hemisphere [Van Der Werf et al., 2006]. Additionally, TMS given during non‐rapid eye movement (REM) sleep revealed a 12–15 Hz component superimposed over the latter stages of a slow‐wave TMS response [Massimini et al., 2007]. Studies in animals and humans indicate that cortical oscillations within this frequency range during non‐REM sleep result from cortico‐thalamic interactions [Steriade, 2006].
Source Localization and Cortical Connectivity
In addition to cortico‐subcortical activation, TMS also activates wider cortical networks. Studies using a variety of neuroimaging modalities including fMRI [Baudewig et al., 2001; Bohning et al., 1999] and PET [Fox et al., 1997; Paus et al., 1997; Strafella et al., 2001] have revealed that TMS activates a range of cortical and subcortical regions connected to the site of stimulation. However, as these techniques measure metabolic activity, they suffer from poor temporal resolution, making it impossible to determine the sequence of regions activated following TMS. The excellent temporal resolution of EEG provides an alternative method to map the spread of cortical potentials following TMS, and hence, estimate the effective connectivity of a given stimulated brain region.
Various source localization modeling techniques have been used to estimate the cortical generators responsible for each component of the TMS‐evoked response. The motor cortex has been the most widely studied region to date [Bonato et al., 2006; Komssi et al., 2002, 2004; Litvak et al., 2007; Paus et al., 2001]; however, other regions such as the prefrontal cortex [Kahkonen et al., 2005b], premotor cortex [Ferrarelli et al., 2008; Massimini et al., 2005, 2010], sensorimotor cortex [Massimini et al., 2007], parietal cortex [Zanon et al., 2010], and occipital cortex [Casali et al., 2010; Ilmoniemi et al., 1997] have also been mapped. The current spread following TMS is likely to reflect a combination of cortico‐cortical and cortico‐subcortical connectivity. A recent study by Voineskos and colleagues [2010] compared TMS–EEG signal propagation with white matter tract integrity estimated using diffusion tensor imaging. Interhemispheric signal propagation following stimulation of the motor cortex and prefrontal cortex correlated with the fractional anisotropy of the motor fibers and the genu of the corpus callosum, respectively. This multimodal approach confirms that the spread of cortical potentials measured using TMS–EEG is mediated, at least in part, by these anatomical structures [Voineskos et al., 2010].
Despite some disparities, the cortical networks detected using single‐pulse TMS–EEG over motor cortex share similarities with those measured using other multimodal TMS techniques. In addition to early activation of the stimulated and contralateral motor cortex [Komssi et al., 2002, 2004], several TMS–EEG studies have reported subsequent activation at an anterior site likely to coincide with ipsilateral supplementary/premotor areas [Bonato et al., 2006; Komssi et al., 2004; Litvak et al., 2007; Paus et al., 2001]. Studies using single‐pulse TMS‐fMRI and repetitive TMS (rTMS)‐PET over motor cortex have also reported activation over both ipsi‐ and contra‐lateral motor cortex [Bohning et al., 1999; Denslow et al., 2005; Fox et al., 1997; Hanakawa et al., 2009], as well as premotor and supplementary motor areas [Denslow et al., 2005; Fox et al., 1997; Hanakawa et al., 2009]. Activation in other cortical regions less frequently reported following TMS–EEG over motor cortex, such as the temporoparietal junction and cerebellum [Litvak et al., 2007], have also been reported following motor cortex TMS‐fMRI [Denslow et al., 2005; Hanakawa et al., 2009]. Despite these similarities, TMS–EEG appears less sensitive to detecting activation of subcortical regions such as the thalamus and striatum, structures detected in both single‐pulse, and rTMS‐fMRI studies over motor cortex [Denslow et al., 2005; Hanakawa et al., 2009].
There are several other limitations which should be noted when using EEG to localize current sources. First, although EEG benefits from high temporal resolution, it suffers from poor spatial resolution. Higher density electrode arrays (>64) are increasingly being used to minimize this limitation [Ilmoniemi et al., 1997; Massimini et al., 2005]. Second, it is difficult to verify the modeling techniques used to solve the inverse problem of EEG source analysis [Grech et al., 2008]. Although progress is being made in this area, interpreting source localization data from TMS–EEG requires caution.
ASSESSING NEURAL MECHANISMS WITH TMS–EEG
Neural mechanisms, such as cortical inhibition and neural plasticity, are fundamental for brain function. Various paradigms have been designed to test these mechanisms in humans using TMS. However, the application of these paradigms has been largely limited to the motor cortex due to the easily measurable peripheral motor responses evoked from this region. TMS–EEG provides a method to measure these mechanisms directly from the cortex, hence allowing measurement of inhibition and plasticity from cortical regions previously inaccessible to TMS.
Cortical Inhibition
Cortical inhibition refers to the suppression of cortical activity by GABAergic inhibitory interneurons. Activation of inhibitory interneurons results in a biphasic (“fast” and “slow”) hyperpolarization of target pyramidal cells, which is evident following direct stimulation of rat [Connors et al., 1988; Davies et al., 1990; Deisz, 1999], cat [Connors et al., 1988], and human [Deisz, 1999] cortical tissue in vitro. The fast IPSP component (<20 ms poststimulus) is due to activation of iontropic GABAA receptors, which increase Cl− conductance, whereas the slow IPSP (50–300 ms poststimulus) results from opening of K+ channels linked to metabotropic GABAB receptors [Connors et al., 1988; Davies et al., 1990]. GABAB receptors are also located presynaptically on the interneurons themselves, enabling GABA‐mediated autoinhibition of inhibitory activity [Davies et al., 1990].
Several studies have suggested that the later cortical responses measured with TMS–EEG reflect similar inhibitory phases within the cortex. The N100 component is the most replicated TMS–EEG response over motor cortex and is considered inhibitory in nature based on a growing body of evidence. First, the timing of the N100 coincides with slow, GABAB‐mediated IPSPs observed following stimulation of cortical tissue [Connors et al., 1988; Davies et al., 1990; Deisz, 1999]. Studies assessing various functional paradigms appear consistent with N100, reflecting inhibitory processes. The amplitude of N100 decreases over contralateral motor cortex when participants prepare to make a movement, a state which is associated with decreased inhibition and increased cortical excitability [Bender et al., 2005; Nikulin et al., 2003]. Importantly, the N100 amplitude decreases to a lesser extent during the same period over ipsilateral motor cortex where activity is more likely to be inhibited to prevent motor overflow [Kicic et al., 2008]. Conversely, the N100 increases in amplitude when participants actively prepare to resist the TMS pulse, a period associated with increased inhibition [Bonnard et al., 2009]. Similarly, when participants are required to resist a perturbation to the wrist, the N100 amplitude is greater than when participants are instructed to allow the perturbation [Spieser et al., 2010]. Results from these functional studies imply that increased cortical inhibition is directly reflected in the amplitude of the N100. However, under certain circumstances, increased cortical inhibition may reduce the ability of TMS to evoke the N100 response. For instance, cutaneous stimulation results in a period of reduced motor cortical excitability, known as short‐latency afferent inhibition (SAI) [Tokimura et al., 2000]. During this period, both the MEP and N100 amplitude are reduced in amplitude [Bikmullina et al., 2009]. Bikmullina and colleagues [2009] proposed that the hyperpolarized state of the corticospinal pyramidal neurons resulting from SAI prevented further IPSP generation following TMS, hence reducing N100 amplitude. In another example, the N100 response is nearly abolished following acute ethanol consumption [Kahkonen and Wilenius, 2007]. Ethanol has been shown to both directly and indirectly facilitate GABAergic inhibition in both animals [Kumar et al., 2009] and humans [Ziemann et al., 1995]. Presumably this increase in tonic inhibition would result in a similar negative shift in the membrane potential of pyramidal neurons to that following SAI, thus reducing the ability of TMS to evoke IPSPs and, therefore, the N100 response.
In addition to single‐pulse TMS, paired‐pulse TMS–EMG studies over motor cortex have revealed a biphasic pattern of inhibitory activity in humans in vivo. By measuring the inhibitory effect of conditioning TMS pulses on test peripheral MEP amplitudes, two separate periods of inhibition have been identified [Reis et al., 2008]. Short‐interval intracortical inhibition (SICI) is GABAA‐mediated [Ziemann et al., 1996] and occurs following subthreshold conditioning pulses delivered at interstimulus intervals between 1 and 6 ms [Kujirai et al., 1993]. Conversely, long‐interval inhibition (LICI) is GABAB‐mediated [McDonnell et al., 2006], occurring following suprathreshold conditioning pulses delivered at interstimulus intervals between 50 and 200 ms [Valls‐Sole et al., 1992]. Evidence from animal studies [Benardo, 1994; Tamas et al., 2003] and TMS studies [Florian et al., 2008; Sanger et al., 2001] suggests that the two forms of inhibition may be mediated by separate populations of inhibitory interneurons. Facilitation can also be measured using paired‐pulse paradigms. Short‐interval cortical facilitation or I‐wave facilitation occurs following a suprathreshold conditioning pulse and near threshold test pulse at specific interstimulus intervals between 1 and 5 ms [Ziemann et al., 1998b]. A second phase deemed intracortical facilitation (ICF) occurs following a subthreshold conditioning pulse at interstimulus intervals between 10 and 15 ms [Kujirai et al., 1993] and is NMDA‐dependent [Ziemann et al., 1998a]. The overlap in time‐course of these paired‐pulse paradigms highlights that the early response to TMS results in both excitatory and inhibitory phases which interact with each other, resulting in a net effect on pyramidal neurons.
Several studies have assessed motor cortex SICI and ICF using TMS–EEG. Paus and colleagues [2001] tested SICI at a 3 ms interstimulus interval and ICF at 12 ms interstimulus interval. Although SICI inhibited MEPs and ICF tended to facilitate MEPs, the two paradigms had different effects on the TMS‐evoked potential. SICI had no significant effect on the P30, N45, or N100 peaks, whereas ICF decreased the amplitude of the P30 and N45 peaks and the amplitude of TMS‐phase locked beta oscillations. Conversely, Ferreri and colleagues [2011] reported a decrease in P30 and N100 following SICI, and differential effects on N45 across the scalp. For ICF, the authors reported an increase in P30, a decrease in N100 and differential effects on the N45 similar to SICI. Additionally, the authors reported a prolonged peak latency following SICI and a shortened latency following ICF. The disparity between these findings may reflect differences in how inhibition and facilitation was measured in each study. Despite both studies stimulating motor cortex, in the former study, inhibition and facilitation were measured either from the vertex or parietal cortex, whereas the latter study incorporated the entire cortex. This suggests that inhibition and facilitation evoked using paired‐pulse TMS may have differential effects at different cortical regions.
LICI has also been investigated using paired‐pulse TMS–EEG in both motor and nonmotor regions (Fig. 3). A suprathreshold conditioning TMS pulse at an interstimulus interval of 100 ms significantly inhibits a test cortical response over several cortical areas including motor cortex, dorsolateral prefrontal cortex (DLPFC), and parietal cortex [Daskalakis et al., 2008a; Fitzgerald et al., 2008]. LICI measured with TMS–EEG is strongest over the stimulated region and decreases linearly to surrounding areas [Daskalakis et al., 2008a]. Importantly, inhibition remains significant when cortical responses to sham stimulation (auditory clicks alone) are subtracted from the data [Daskalakis et al., 2008a] and when participants are played 95 Hz white noise through earphones [Fitzgerald et al., 2008], confirming that the results were not affected by the audible TMS click. Several lines of evidence suggest that LICI measured with TMS–EEG also reflects GABAB‐mediated inhibition. First, LICI measured with TMS–EEG over motor cortex strongly correlates with LICI measured with EMG in peripheral hand muscles and with the cortical silent period, both considered markers of GABAB inhibition [Farzan et al., 2010]. Second, inhibition following LICI lasts up to 250 ms post‐test stimulus and is strongest around 100–150 ms [Fitzgerald et al., 2009]. Such timing of inhibition is consistent with the slow GABAB‐mediated IPSPs measured in animal studies. However, when considering this finding, it remains unclear whether TMS–EEG LICI reflects postsynaptic inhibition of pyramidal cells, presynaptic inhibition of interneurons, or both. In rat hippocampal slice experiments, Davies and colleagues [1990] suggested that inhibition of the slow GABAB IPSP following paired‐pulse stimulation was a result of prolonged GABAB‐mediated autoinhibition of the inhibitory interneurons themselves. In humans, the inhibitory effects of SICI are abolished by LICI, suggesting a period of presynaptic inhibition of inhibitory interneurons following stimulation [Florian et al., 2008; Sanger et al., 2001]. Given that the amplitude of the N100 response is likely to represent GABA‐mediated inhibition, the maximal decrease in activity around this peak reported by Fitzgerald and colleagues [2009] may indeed reflect autoinhibition of the inhibitory interneurons. Following this reasoning, it may be that earlier inhibition (<50 ms) following the test pulse reflects postsynaptic inhibition of the pyramidal cells, given that EPSPs are likely to contribute to the earlier TMS–EEG response. Further studies utilizing pharmacological interventions will aid in clarifying this point.
Figure 3.
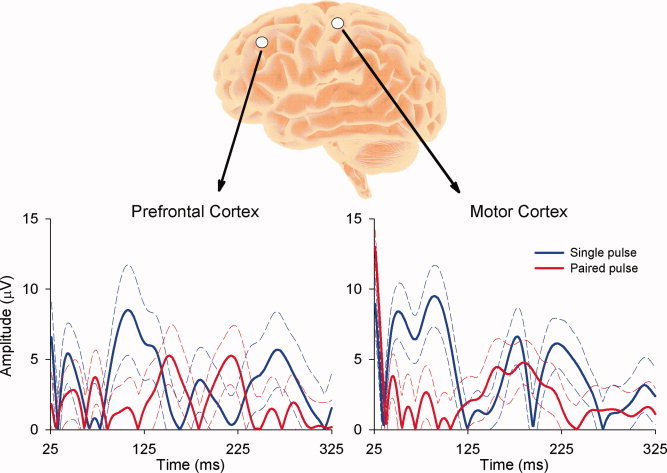
Rectified EEG responses following single and paired TMS pulses over prefrontal (F3) and motor cortex (C3) of an individual participant. The interstimulus interval of the paired‐pulse TMS was 100 ms. The thick lines represent mean EEG traces, whereas the dashed lines represent 95% confidence intervals. The horizontal axis refers to time post‐test TMS pulse. Notice the inhibition of the paired‐pulse test response compared with the single‐pulse alone at both sites. Data are the mean of 40 trials sampled at 10,000 Hz (DC—2,000 Hz), downsampled to 1,000 Hz offline, epoched, baseline corrected and filtered (1–40 Hz). The TMS artifact and the early response (<25 ms) were removed before filtering. See also Daskalakis et al. [2008a] and Fitzgerald et al. [2009]. [Color figure can be viewed in the online issue, which is available at wileyonlinelibrary.com.]
Although the inhibitory connections of interneurons are mostly local, excitatory long‐range connections also synapse on to these inhibitory networks, allowing brain regions to have inhibitory influences on remote areas. For example, the motor cortex has both excitatory and inhibitory connections with the contralateral motor cortex, via the corpus callosum [Daskalakis et al., 2002]. In a recent study using TMS–EEG, evidence for both interhemispheric facilitation and inhibition was observed [Voineskos et al., 2010]. Following subthreshold TMS over left motor cortex, TMS‐evoked responses of identical size were recorded over both left and right motor cortex (allowing for signal propagation time). Conversely, following suprathreshold stimulation, the left TMS‐evoked response was significantly larger than the right TMS‐evoked response, suggesting activation of inhibitory transcallosal fibers with higher intensity TMS [Voineskos et al., 2010]. The propagation of signal to the contralateral hemisphere reported in this study complements source localization studies that have reported similar results following TMS over motor cortex [Komssi et al., 2002]. However, the approach by Voineskos and colleagues [2010] has the added advantage of proposing the mechanistic effect of the interhemispheric connectivity.
Neural Plasticity
Cortical inhibition interacts heavily with other cortical mechanisms such as neural plasticity. In a broad sense, neural plasticity refers to the ability of the brain to functionally reorganize its molecular and anatomical structure. In the cortex, this reorganization can occur in various forms, one of which is the transient alterations in the efficacy of existing synapses [Bliss and Lomo, 1973]. Based on classical plasticity studies in animals, several TMS paradigms have been designed to assess neural plasticity in humans [for a review see Cooke and Bliss, 2006]. Amongst others, these include rTMS and paired associative stimulation (PAS). Although the exact mechanism of action remains unclear for these techniques, both are thought to assess long‐term potentiation and depression‐like mechanisms [Hoogendam et al., 2010; Ziemann et al., 2008].
rTMS involves delivering trains of stimulation to a given cortical region. The modulatory effects of rTMS are dependent on stimulation parameters such as frequency, intensity, and pulse train configuration. In general, higher rTMS frequencies (>5 Hz) tend to facilitate and lower rTMS frequencies (1 Hz) tend to inhibit cortical excitability measured from peripheral MEPs for up to an hour following stimulation [Fitzgerald et al., 2006]. Very high frequency stimulation, such as theta burst stimulation (50 Hz), is less dependent on pulse frequency, however, and more dependent on pulse‐train configuration [Huang et al., 2005]. Several studies have utilized TMS–EEG to directly assess the effect of rTMS on cortical excitability. Van der Werf and Paus [2006] applied 1 Hz rTMS to motor cortex and reported a decrease in the N45 component of the TMS‐evoked response measured following TMS. Modulation in excitability measured with TMS–EEG was site‐specific, with no effect of premotor rTMS on motor cortex excitability. In addition, the N45 depression occurred despite 1 Hz rTMS having no effect on MEP amplitude, suggesting that EEG measures may be more sensitive to rTMS‐induced changes in excitability than peripheral measures [Van Der Werf and Paus, 2006]. Esser and colleagues [2006] measured the cortical response following 5 Hz rTMS using TMS–EEG. The authors found that the TMS‐evoked responses measured with TMS–EEG were significantly potentiated following rTMS compared with sham. Interestingly, the TMS‐evoked response potentiation was largely localized to electrodes anterior to the site of stimulation coinciding with bilateral premotor cortex, suggesting a remote effect of high‐frequency rTMS [Esser et al., 2006].
The same group used TMS–EEG to assess cortical excitability following a second TMS‐based plasticity paradigm, PAS. PAS is based on the principles of spike‐timing dependent plasticity, a form of plasticity in which firing of a presynaptic neuron immediately before firing of a postsynaptic neuron enhances synaptic efficacy between the neurons. Conversely, firing of the postsynaptic cell before firing of the presynaptic cell results in a reduction in synaptic efficacy. In humans, this is achieved by pairing peripheral nerve stimulation with TMS pulses to the motor cortex [Stefan et al., 2000]. The interstimulus interval between the two stimulations is set so that the afferent volley from the nerve stimulation either coincides with or precedes the TMS pulse. The resultant modulation of cortical excitability following PAS is NMDA‐dependent [Stefan et al., 2002] and interacts with motor learning [Stefan et al., 2006]. Importantly, Huber and colleagues [2008] demonstrated that both potentiation and depression of the TMS‐evoked potential was evident following the two forms of PAS using TMS–EEG. The authors did, however, note variability in the individual responses to PAS, with some participants displaying changes in cortical excitability in the opposite direction to that expected. Despite the variability, the results confirmed that the observed modulation in excitability following PAS is cortical in nature, and the topography was suggestive of both local and contralateral changes in sensorimotor excitability following the paradigm [Huber et al., 2008].
In addition to using offline analysis to quantify plastic changes following rTMS, TMS–EEG allows investigation of the online changes during rTMS. Hamidi and colleagues [2010] measured the modulation of TMS‐evoked responses during a 30‐pulse train of 10 Hz rTMS over both precentral gyrus and superior parietal lobule. The authors removed the stimulation artifact using ICA, revealing a 5 peak response during rTMS. For peaks 2–5, the TMS‐evoked response decreased in amplitude over the first half of stimulation during a train and increased during the second half at both sites, with no effect on peak 1 [Hamidi et al., 2010]. In contrast, Veniero and colleagues [2010] measured the TMS‐evoked response following 10‐pulse trains of 20 Hz rTMS over motor cortex. Using this paradigm, the authors reported an increase in early TMS‐evoked response peak amplitudes (peaks 1–2) over the first few stimulations of a train, with no change in latter TMS‐evoked response peak amplitudes. The difference in online modulation of TMS‐evoked responses between the two high‐frequency paradigms is of interest, as both are associated with cumulative, offline increases in cortical excitability. The divergence in online modulation between paradigms suggests that different frequencies of rTMS may mediate their effect on cortical excitability either through separate neuronal populations or via different cortical mechanisms. Further studies directly comparing the online effects of rTMS paradigms on cortical excitability will aid in clarifying this observation.
The online effects of 1 Hz rTMS have also been investigated. Brignani and colleagues [2008] assessed alpha and beta band synchronization during a 600‐pulse train of 1 Hz stimulation over motor cortex. Synchronization of both bands increased over the period of stimulation, with alpha band changes negatively correlating with MEP amplitude changes. The authors speculated that the change in alpha band activity represented potentiation of inhibitory mechanisms at the site of stimulation [Brignani et al., 2008]. In their study on the effects of high‐frequency rTMS on TMS‐evoked response amplitude, Venerio and colleagues [2010] also reanalyzed data from a previous 1 Hz rTMS experiment. Consistent with the results of Brignani and colleagues, the authors reported a decrease in the online amplitude of early TMS‐evoked responses, albeit in a small population. Such a modulation is suggestive of enhanced inhibition of the TMS‐evoked response following 1 Hz rTMS, although the exact mechanism cannot be directly determined.
ASSESSING RESTING AND ACTIVE CORTICAL NETWORKS WITH TMS–EEG
Lesion and functional imaging studies have revealed that the cortex is organized into functionally specific regions. Although this concept has existed for a substantial period of time, the network properties and mechanisms that subserve this functional specificity is less well understood, particularly in humans. A method for testing network properties across the cortex is to activate the network in question and record the resultant output. TMS–EEG provides an excellent tool to implement this method, both to compare resting cortical network properties and to assess the functional modulation of a given cortical network during different brain states.
Comparing Resting Cortical Network Properties
Several studies have utilized TMS–EEG to directly compare the resting properties of different cortical regions. Kahkonen and colleagues [2004, 2005a] compared cortical reactivity between the motor and prefrontal cortex. TMS was applied over a range of intensities to both sites, and the response amplitude was compared. The TMS‐evoked potential increased with increasing TMS intensity at both sites. However, the evoked responses were generally larger over the motor cortex, and the pattern of modulation differed between the sites. The authors speculated that these findings may represent differences in cortical excitability between these regions; however, other potential contributing factors were also considered, including scalp‐to‐cortex distance, anatomical differences, and connectivity of the stimulated regions.
In a separate approach, Van der Werf and Paus [2006] compared TMS‐evoked waveforms and oscillations between the primary motor cortex and dorsal premotor cortex. Stimulation of the primary motor cortex resulted in both a larger N45 component and stronger oscillations in the beta frequency compared with dorsal premotor stimulation. Rosanova and colleagues [2009] recorded the TMS–EEG response following stimulation of the left frontal, parietal, and occipital cortex. The authors also reported distinct differences in the oscillatory tuning between each brain region, with prefrontal regions oscillating at higher gamma frequencies compared with lower alpha frequencies in the occipital cortex. Importantly, the spread of oscillatory activity to other cortical regions following TMS also occurred in a region specific manner. In a second study, Casorato and colleagues [2010] replicated this finding in similar brain regions, noting that similarities between regions increased with proximity. A recent study used a neural mass model to try and reproduce the cortical rhythms observed following TMS such as in the study by Rosanova and colleagues [Cona et al., 2011]. The model demonstrated that individual differences in frequencies between regions and between subjects could be achieved by altering the strength of connections between neural populations at the site of stimulation (i.e., between excitatory, fast inhibitory, and slow inhibitory neuronal populations). Importantly, the spread of oscillatory activity following TMS could also be replicated by altering connection strength between regions, demonstrating that reciprocal cortical connectivity plays an important role in the regions specific propagation of oscillatory activity [Cona et al., 2011]. The finding of distinct frequency regulation in and between different cortical regions suggests that specialized neuronal organization may underlie differing functional roles across the cortex. In agreement with this notion, a recent study reported distinct patterns of neural oscillatory propagation following TMS over functionally defined subregions of the visual cortex [Garcia et al., 2011].
Comparisons of inhibitory characteristics between functionally distinct regions of the cortex using the LICI TMS–EEG paradigm have also revealed differences in cortical properties. For instance, LICI in the motor cortex inhibits cortical oscillations in the delta (1–3 Hz), theta (4–7 Hz), and alpha bands (8–12 Hz) [Farzan et al., 2009], the latter of which is associated with motor control [Gross et al., 2002; Pollok et al., 2005]. In contrast, LICI in DLPFC inhibits cortical oscillations across all bands, particularly the beta (12.5–28 Hz) and gamma bands (30–50 Hz) [Farzan et al., 2009]. Gamma oscillations are associated with high‐order executive cognitive functions, such as attention [Fries et al., 2001] and working memory [Howard et al., 2003; Mainy et al., 2007; Tallon‐Baudry et al., 1998], and are generated by networks of inhibitory interneurons via the GABAA receptor [Bartos et al., 2007; Cobb et al., 1995; Whittington et al., 1995]. In contrast, GABAB‐mediated inhibition, such as that putatively measured by LICI, is thought to modulate these gamma oscillations [Brown et al., 2007; Whittington et al., 1995], providing a level of inhibitory control. As the prefrontal cortex is a key cortical region in the coordination of executive functions, which utilize gamma oscillations, tight spatial and temporal control of activity within this region would serve a strong functional purpose [Constantinidis et al., 2002; Oswald et al., 2009]. In support of this interpretation, Daskalakis and colleagues [2008b] found a positive correlation between resting LICI strength in DLPFC and performance in a verbal working memory task.
Functional Changes in Cortical Networks
An exciting prospect for TMS–EEG is the ability to measure functional changes in effective cortical dynamics with altering brain states. Massimini and colleagues have conducted a series of TMS–EEG studies on cortical connectivity during altered states of consciousness, such as during sleep. The spread of current density following TMS decreases as participants pass from wakefulness through the various stages of non‐REM sleep. This is accompanied by decreases in the oscillatory activity evoked following TMS from higher frequencies (12–30 Hz) to low frequencies. In Stage 4 sleep, the response to TMS is reduced to a single large amplitude peak, which is largely confined to the site of stimulation [Massimini et al., 2005] and mimics spontaneous slow waves observed during non‐REM sleep [Massimini et al., 2007]. The TMS‐evoked response during sleep also differed between brain regions with the largest response being elicited from the somatosensory cortex, the same region thought to generate the spontaneous slow‐wave activity [Massimini et al., 2007]. The authors proposed that the decrease in cortical connectivity with loss of consciousness results from either increased inhibition of cortico‐cortical connections or inhibitory gating of cortico‐thalamic networks and may reflect the neural substrate of consciousness [Massimini et al., 2005, 2007]. This inhibition hypothesis was supported in a recent study utilizing the GABAA agonist midazolam. As participants lost consciousness with administration of midazolam, the TMS–EEG response changed in a similar fashion to that observed during non‐REM sleep [Ferrarelli et al., 2010]. Interestingly, if participants passed into REM sleep (a stage of sleep which more closely resembles consciousness), cortical connectivity increased toward levels similar to wakefulness [Massimini et al., 2010].
TMS–EEG has also been used to link cortical plasticity with certain oscillatory patterns during non‐REM sleep. Huber and colleagues [2007] compared the cortical potentiation following 5 Hz rTMS with slow‐wave activity during sleep. Sleep immediately following a session of rTMS was characterized by increased slow‐wave activity at the site of stimulation, the extent of which was predicted by the degree of cortical potentiation following rTMS during wakefulness. In a second study, Huber and colleagues [2008] confirmed their findings by comparing potentiation and depression of cortical excitability with slow‐wave activity using the PAS paradigm. In agreement with their rTMS study, the authors showed that potentiation of the TMS‐evoked response following PAS was linked with increased slow‐wave activity during sleep. In addition, slow‐wave activity during sleep decreased if depression of the TMS‐evoked potential was observed following PAS. This series of studies provided strong direct evidence for a link between cortical plasticity and sleep intensity, a hypothesis which had been indirectly formulated based on learning and sleep studies.
In addition to investigating consciousness and sleep, TMS–EEG also provides an avenue to assess changes in functional connectivity during cognitive tasks. For example, Morishima and colleagues [2009] used TMS–EEG to map the functional connectivity of the frontal eye field (FEF) during a visual task requiring selective attention. In this task, participants were cued to attend to either the gender of a presented face or to the direction of movement of grated lines superimposed over the face. When attending to the face, the TMS‐evoked response transmitted from the FEF to the fusiform face area, whereas when attending to motion the response transmitted to the visual motion sensitive area. In this study, the authors not only demonstrated a causal top–down role of FEF in selective visual attention but also clearly demonstrated functional modulation of neural networks using TMS–EEG.
CONCLUSIONS AND FUTURE DIRECTIONS
TMS–EEG is developing into a powerful research tool for investigating cortical properties and mechanisms, both at rest and during different functional states. Importantly, TMS–EEG allows measurement of TMS‐evoked cortical potentials, removing the need for inferences of cortical excitability from indirect measures. The development of improved online and offline artifact reduction is allowing examination of cortical activity closer to the time of stimulation, whereas advanced EEG analysis techniques such as source localization allow estimates of signal propagation and cortical connectivity following TMS. TMS–EEG is also increasingly being used with TMS paradigms designed to assess cortical mechanisms such as inhibition and neural plasticity. This approach has validated the cortical nature of these paradigms, while offering new information on network properties across a range of cortical regions previously inaccessible to TMS.
Despite recent advancements, substantial work is still required to characterize the sources contributing to the TMS‐evoked response. For instance, pharmacological interventions will help clarify the contribution and nature of excitatory and inhibitory potentials during the early and late components of the TMS‐evoked response. Further studies utilizing a multimodal approach are necessary to verify the anatomical pathways mediating the signal propagation following TMS. Finally, a continued effort in reducing both recording and physiological artifacts is required to maximize the information gained from TMS–EEG recordings. As recording methods and understanding of the TMS‐evoked cortical response improve, TMS–EEG will continue to provide a deeper insight into the organization and functional modulation of cortical networks.
Acknowledgements
The authors thank Sara Arnold for her comments on the manuscript. This manuscript will contribute to the doctoral thesis of N.C.R. P.B.F. is supported by a National Health and Medical Research Council of Australia (NHMRC) Practitioner Fellowship.
REFERENCES
- Amassian VE, Cracco RQ, Maccabee PJ ( 1989): Focal stimulation of human cerebral cortex with the magnetic coil: A comparison with electrical stimulation. Electroencephalogr Clin Neurophysiol 74: 401–416. [DOI] [PubMed] [Google Scholar]
- Amassian VE, Cracco RQ, Maccabee PJ, Cracco JB ( 1992a): Cerebello‐frontal cortical projections in humans studied with the magnetic coil. Electroencephalogr Clin Neurophysiol 85: 265–272. [DOI] [PubMed] [Google Scholar]
- Amassian VE, Eberle L, Maccabee PJ, Cracco RQ ( 1992b): Modelling magnetic coil excitation of human cerebral cortex with a peripheral nerve immersed in a brain‐shaped volume conductor: The significance of fiber bending in excitation. Electroencephalogr Clin Neurophysiol 85: 291–301. [DOI] [PubMed] [Google Scholar]
- Barker AT, Jalinous R, Freeston IL ( 1985): Non‐invasive magnetic stimulation of human motor cortex. Lancet 1: 1106–1107. [DOI] [PubMed] [Google Scholar]
- Bartos M, Vida I, Jonas P ( 2007): Synaptic mechanisms of synchronized gamma oscillations in inhibitory interneuron networks. Nat Rev Neurosci 8: 45–56. [DOI] [PubMed] [Google Scholar]
- Baudewig J, Siebner HR, Bestmann S, Tergau F, Tings T, Paulus W, Frahm J ( 2001): Functional MRI of cortical activations induced by transcranial magnetic stimulation (TMS). Neuroreport 12: 3543–3548. [DOI] [PubMed] [Google Scholar]
- Benardo LS ( 1994): Separate activation of fast and slow inhibitory postsynaptic potentials in rat neocortex in vitro. J Physiol 476: 203–215. [DOI] [PMC free article] [PubMed] [Google Scholar]
- Bender S, Basseler K, Sebastian I, Resch F, Kammer T, Oelkers‐Ax R, Weisbrod M ( 2005): Electroencephalographic response to transcranial magnetic stimulation in children: Evidence for giant inhibitory potentials. Ann Neurol 58: 58–67. [DOI] [PubMed] [Google Scholar]
- Bikmullina R, Kicic D, Carlson S, Nikulin VV ( 2009): Electrophysiological correlates of short‐latency afferent inhibition: A combined EEG and TMS study. Exp Brain Res 194: 517–526. [DOI] [PubMed] [Google Scholar]
- Bliss TV, Lomo T ( 1973): Long‐lasting potentiation of synaptic transmission in the dentate area of the anaesthetized rabbit following stimulation of the perforant path. J Physiol 232: 331–356. [DOI] [PMC free article] [PubMed] [Google Scholar]
- Bohning DE, Shastri A, Nahas Z, Lorberbaum JP, Andersen SW, Dannels WR, Haxthausen EU, Vincent DJ, George MS ( 1998): Echoplanar BOLD fMRI of brain activation induced by concurrent transcranial magnetic stimulation. Invest Radiol 33: 336–340. [DOI] [PubMed] [Google Scholar]
- Bohning DE, Shastri A, McConnell KA, Nahas Z, Lorberbaum JP, Roberts DR, Teneback C, Vincent DJ, George MS ( 1999): A combined TMS/fMRI study of intensity‐dependent TMS over motor cortex. Biol Psychiatry 45: 385–394. [DOI] [PubMed] [Google Scholar]
- Bonato C, Miniussi C, Rossini PM ( 2006): Transcranial magnetic stimulation and cortical evoked potentials: A TMS/EEG co‐registration study. Clin Neurophysiol 117: 1699–1707. [DOI] [PubMed] [Google Scholar]
- Bonnard M, Spieser L, Meziane HB, de Graaf JB, Pailhous J ( 2009): Prior intention can locally tune inhibitory processes in the primary motor cortex: Direct evidence from combined TMS‐EEG. Eur J Neurosci 30: 913–923. [DOI] [PubMed] [Google Scholar]
- Brignani D, Manganotti P, Rossini PM, Miniussi C ( 2008): Modulation of cortical oscillatory activity during transcranial magnetic stimulation. Hum Brain Mapp 29: 603–612. [DOI] [PMC free article] [PubMed] [Google Scholar]
- Brown JT, Davies CH, Randall AD ( 2007): Synaptic activation of GABA(B) receptors regulates neuronal network activity and entrainment. Eur J Neurosci 25: 2982–2990. [DOI] [PubMed] [Google Scholar]
- Buzsaki G, Draguhn A ( 2004): Neuronal oscillations in cortical networks. Science 304: 1926–1929. [DOI] [PubMed] [Google Scholar]
- Cardin JA, Carlen M, Meletis K, Knoblich U, Zhang F, Deisseroth K, Tsai LH, Moore CI ( 2009): Driving fast‐spiking cells induces gamma rhythm and controls sensory responses. Nature 459: 663–667. [DOI] [PMC free article] [PubMed] [Google Scholar]
- Casali AG, Casarotto S, Rosanova M, Mariotti M, Massimini M ( 2010): General indices to characterize the electrical response of the cerebral cortex to TMS. Neuroimage 49: 1459–1468. [DOI] [PubMed] [Google Scholar]
- Casarotto S, Romero Lauro LJ, Bellina V, Casali AG, Rosanova M, Pigorini A, Defendi S, Mariotti M, Massimini M ( 2010): EEG responses to TMS are sensitive to changes in the perturbation parameters and repeatable over time. PLoS One 5: e10281. [DOI] [PMC free article] [PubMed] [Google Scholar]
- Castellanos NP, Makarov VA. ( 2006): Recovering EEG brain signals: Artifact suppression with wavelet enhanced independent component analysis. J Neurosci Methods 158: 300–312. [DOI] [PubMed] [Google Scholar]
- Cobb SR, Buhl EH, Halasy K, Paulsen O, Somogyi P ( 1995): Synchronization of neuronal activity in hippocampus by individual GABAergic interneurons. Nature 378: 75–78. [DOI] [PubMed] [Google Scholar]
- Cona F, Zavaglia M, Massimini M, Rosanova M, Ursino M ( 2011): A neural mass model of interconnected regions simulates rhythm propagation observed via TMS‐EEG. Neuroimage 57: 1045–1058. [DOI] [PubMed] [Google Scholar]
- Connors BW, Malenka RC, Silva LR ( 1988): Two inhibitory postsynaptic potentials, and GABAA and GABAB receptor‐mediated responses in neocortex of rat and cat. J Physiol 406: 443–468. [DOI] [PMC free article] [PubMed] [Google Scholar]
- Constantinidis C, Williams GV, Goldman‐Rakic PS ( 2002): A role for inhibition in shaping the temporal flow of information in prefrontal cortex. Nat Neurosci 5: 175–180. [DOI] [PubMed] [Google Scholar]
- Cooke SF, Bliss TV ( 2006): Plasticity in the human central nervous system. Brain 129 ( Part 7): 1659–1673. [DOI] [PubMed] [Google Scholar]
- Cracco RQ, Amassian VE, Maccabee PJ, Cracco JB ( 1989): Comparison of human transcallosal responses evoked by magnetic coil and electrical stimulation. Electroencephalogr Clin Neurophysiol 74: 417–424. [DOI] [PubMed] [Google Scholar]
- Daskalakis ZJ, Christensen BK, Fitzgerald PB, Roshan L, Chen R ( 2002): The mechanisms of interhemispheric inhibition in the human motor cortex. J Physiol 543 ( Part 1): 317–326. [DOI] [PMC free article] [PubMed] [Google Scholar]
- Daskalakis ZJ, Farzan F, Barr MS, Maller JJ, Chen R, Fitzgerald PB ( 2008a): Long‐interval cortical inhibition from the dorsolateral prefrontal cortex: A TMS‐EEG study. Neuropsychopharmacology 33: 2860–2869. [DOI] [PubMed] [Google Scholar]
- Daskalakis ZJ, Farzan F, Barr MS, Rusjan PM, Favalli G, Levinson AJ, Fitzgerald PB ( 2008b): Evaluating the relationship between long interval cortical inhibition, working memory and gamma band activity in the dorsolateral prefrontal cortex. Clin EEG Neurosci 39: 150–155. [DOI] [PubMed] [Google Scholar]
- Daskalakis ZJ, Levinson AJ, Fitzgerald PB ( 2008c): Repetitive transcranial magnetic stimulation for major depressive disorder: A review. Can J Psychiatry 53: 555–566. [DOI] [PubMed] [Google Scholar]
- Davies CH, Davies SN, Collingridge GL ( 1990): Paired‐pulse depression of monosynaptic GABA‐mediated inhibitory postsynaptic responses in rat hippocampus. J Physiol 424: 513–531. [DOI] [PMC free article] [PubMed] [Google Scholar]
- Day BL, Dressler D, Maertens de Noordhout A, Marsden CD, Nakashima K, Rothwell JC, Thompson PD ( 1989): Electric and magnetic stimulation of human motor cortex: Surface EMG and single motor unit responses. J Physiol 412: 449–473. [DOI] [PMC free article] [PubMed] [Google Scholar]
- Deisz RA ( 1999): GABA(B) receptor‐mediated effects in human and rat neocortical neurones in vitro. Neuropharmacology 38: 1755–1766. [DOI] [PubMed] [Google Scholar]
- Delorme A, Makeig S ( 2004): EEGLAB: An open source toolbox for analysis of single‐trial EEG dynamics including independent component analysis. J Neurosci Methods 134: 9–21. [DOI] [PubMed] [Google Scholar]
- Denslow S, Lomarev M, George MS, Bohning DE ( 2005): Cortical and subcortical brain effects of transcranial magnetic stimulation (TMS)‐induced movement: An interleaved TMS/functional magnetic resonance imaging study. Biol Psychiatry 57: 752–760. [DOI] [PubMed] [Google Scholar]
- Dhuna A, Gates J, Pascual‐Leone A ( 1991): Transcranial magnetic stimulation in patients with epilepsy. Neurology 41: 1067–1071. [DOI] [PubMed] [Google Scholar]
- Di Lazzaro V, Restuccia D, Oliviero A, Profice P, Ferrara L, Insola A, Mazzone P, Tonali P, Rothwell JC ( 1998a): Effects of voluntary contraction on descending volleys evoked by transcranial stimulation in conscious humans. J Physiol 508 ( Part 2): 625–633. [DOI] [PMC free article] [PubMed] [Google Scholar]
- Di Lazzaro V, Restuccia D, Oliviero A, Profice P, Ferrara L, Insola A, Mazzone P, Tonali P, Rothwell JC ( 1998b): Magnetic transcranial stimulation at intensities below active motor threshold activates intracortical inhibitory circuits. Exp Brain Res 119: 265–268. [DOI] [PubMed] [Google Scholar]
- Di Lazzaro V, Oliviero A, Meglio M, Cioni B, Tamburrini G, Tonali P, Rothwell JC ( 2000): Direct demonstration of the effect of lorazepam on the excitability of the human motor cortex. Clin Neurophysiol 111: 794–799. [DOI] [PubMed] [Google Scholar]
- Duzel E, Penny WD, Burgess N ( 2010): Brain oscillations and memory. Curr Opin Neurobiol 20: 143–149. [DOI] [PubMed] [Google Scholar]
- Esser SK, Hill SL, Tononi G ( 2005): Modeling the effects of transcranial magnetic stimulation on cortical circuits. J Neurophysiol 94: 622–639. [DOI] [PubMed] [Google Scholar]
- Esser SK, Huber R, Massimini M, Peterson MJ, Ferrarelli F, Tononi G ( 2006): A direct demonstration of cortical LTP in humans: A combined TMS/EEG study. Brain Res Bull 69: 86–94. [DOI] [PubMed] [Google Scholar]
- Farzan F, Barr MS, Wong W, Chen R, Fitzgerald PB, Daskalakis ZJ ( 2009): Suppression of gamma‐oscillations in the dorsolateral prefrontal cortex following long interval cortical inhibition: A TMS‐EEG study. Neuropsychopharmacology 34: 1543–1551. [DOI] [PubMed] [Google Scholar]
- Farzan F, Barr MS, Levinson AJ, Chen R, Wong W, Fitzgerald PB, Daskalakis ZJ ( 2010): Reliability of long‐interval cortical inhibition in healthy human subjects: A TMS‐EEG study. J Neurophysiol 104: 1339–1346. [DOI] [PubMed] [Google Scholar]
- Ferrarelli F, Massimini M, Peterson MJ, Riedner BA, Lazar M, Murphy MJ, Huber R, Rosanova M, Alexander AL, Kalin N, Tononi G ( 2008): Reduced evoked gamma oscillations in the frontal cortex in schizophrenia patients: A TMS/EEG study. Am J Psychiatry 165: 996–1005. [DOI] [PubMed] [Google Scholar]
- Ferrarelli F, Massimini M, Sarasso S, Casali A, Riedner BA, Angelini G, Tononi G, Pearce RA ( 2010): Breakdown in cortical effective connectivity during midazolam‐induced loss of consciousness. Proc Natl Acad Sci USA 107: 2681–2686. [DOI] [PMC free article] [PubMed] [Google Scholar]
- Ferreri F, Pasqualetti P, Maatta S, Ponzo D, Ferrarelli F, Tononi G, Mervaala E, Miniussi C, Rossini PM ( 2011): Human brain connectivity during single and paired pulse transcranial magnetic stimulation. Neuroimage 54: 90–102. [DOI] [PubMed] [Google Scholar]
- Fitzgerald PB, Fountain S, Daskalakis ZJ ( 2006): A comprehensive review of the effects of rTMS on motor cortical excitability and inhibition. Clin Neurophysiol 117: 2584–2596. [DOI] [PubMed] [Google Scholar]
- Fitzgerald PB, Daskalakis ZJ, Hoy K, Farzan F, Upton DJ, Cooper NR, Maller JJ ( 2008): Cortical inhibition in motor and non‐motor regions: A combined TMS‐EEG study. Clin EEG Neurosci 39: 112–117. [DOI] [PubMed] [Google Scholar]
- Fitzgerald PB, Maller JJ, Hoy K, Farzan F, Daskalakis ZJ ( 2009): GABA and cortical inhibition in motor and non‐motor regions using combined TMS‐EEG: A time analysis. Clin Neurophysiol 120: 1706–1710. [DOI] [PubMed] [Google Scholar]
- Florian J, Muller‐Dahlhaus M, Liu Y, Ziemann U ( 2008): Inhibitory circuits and the nature of their interactions in the human motor cortex a pharmacological TMS study. J Physiol 586: 495–514. [DOI] [PMC free article] [PubMed] [Google Scholar]
- Fox P, Ingham R, George MS, Mayberg H, Ingham J, Roby J, Martin C, Jerabek P ( 1997): Imaging human intra‐cerebral connectivity by PET during TMS. Neuroreport 8: 2787–2791. [DOI] [PubMed] [Google Scholar]
- Fries P, Reynolds JH, Rorie AE, Desimone R ( 2001): Modulation of oscillatory neuronal synchronization by selective visual attention. Science 291: 1560–1563. [DOI] [PubMed] [Google Scholar]
- Fuggetta G, Fiaschi A, Manganotti P ( 2005): Modulation of cortical oscillatory activities induced by varying single‐pulse transcranial magnetic stimulation intensity over the left primary motor area: A combined EEG and TMS study. Neuroimage 27: 896–908. [DOI] [PubMed] [Google Scholar]
- Fuggetta G, Pavone EF, Walsh V, Kiss M, Eimer M ( 2006): Cortico‐cortical interactions in spatial attention: A combined ERP/TMS study. J Neurophysiol 95: 3277–3280. [DOI] [PMC free article] [PubMed] [Google Scholar]
- Garcia JO, Grossman ED, Srinivasan R ( 2011): Evoked potentials in large‐scale cortical networks elicited by TMS of the visual cortex. J Neurophysiol 106: 1734–1746. [DOI] [PMC free article] [PubMed] [Google Scholar]
- Grech R, Cassar T, Muscat J, Camilleri KP, Fabri SG, Zervakis M, Xanthopoulos P, Sakkalis V, Vanrumste B ( 2008): Review on solving the inverse problem in EEG source analysis. J Neuroeng Rehabil 5: 25. [DOI] [PMC free article] [PubMed] [Google Scholar]
- Gross J, Timmermann L, Kujala J, Dirks M, Schmitz F, Salmelin R, Schnitzler A ( 2002): The neural basis of intermittent motor control in humans. Proc Natl Acad Sci USA 99: 2299–2302. [DOI] [PMC free article] [PubMed] [Google Scholar]
- Hamidi M, Slagter HA, Tononi G, Postle BR ( 2010): Brain responses evoked by high‐frequency repetitive transcranial magnetic stimulation: An event‐related potential study. Brain Stimul 3: 2–14. [DOI] [PMC free article] [PubMed] [Google Scholar]
- Hanakawa T, Mima T, Matsumoto R, Abe M, Inouchi M, Urayama S, Anami K, Honda M, Fukuyama H ( 2009): Stimulus‐response profile during single‐pulse transcranial magnetic stimulation to the primary motor cortex. Cereb Cortex 19: 2605–2615. [DOI] [PubMed] [Google Scholar]
- Hoogendam JM, Ramakers GM, Di Lazzaro V ( 2010): Physiology of repetitive transcranial magnetic stimulation of the human brain. Brain Stimul 3: 95–118. [DOI] [PubMed] [Google Scholar]
- Howard MW, Rizzuto DS, Caplan JB, Madsen JR, Lisman J, Aschenbrenner‐Scheibe R, Schulze‐Bonhage A, Kahana MJ ( 2003): Gamma oscillations correlate with working memory load in humans. Cereb Cortex 13: 1369–1374. [DOI] [PubMed] [Google Scholar]
- Huang YZ, Edwards MJ, Rounis E, Bhatia KP, Rothwell JC ( 2005): Theta burst stimulation of the human motor cortex. Neuron 45: 201–206. [DOI] [PubMed] [Google Scholar]
- Huber R, Esser SK, Ferrarelli F, Massimini M, Peterson MJ, Tononi G ( 2007): TMS‐induced cortical potentiation during wakefulness locally increases slow wave activity during sleep. PLoS One 2: e276. [DOI] [PMC free article] [PubMed] [Google Scholar]
- Huber R, Maatta S, Esser SK, Sarasso S, Ferrarelli F, Watson A, Ferreri F, Peterson MJ, Tononi G ( 2008): Measures of cortical plasticity after transcranial paired associative stimulation predict changes in electroencephalogram slow‐wave activity during subsequent sleep. J Neurosci 28: 7911–7918. [DOI] [PMC free article] [PubMed] [Google Scholar]
- Hufnagel A, Elger CE, Durwen HF, Boker DK, Entzian W ( 1990): Activation of the epileptic focus by transcranial magnetic stimulation of the human brain. Ann Neurol 27: 49–60. [DOI] [PubMed] [Google Scholar]
- Ilmoniemi RJ, Kicic D ( 2010): Methodology for combined TMS and EEG. Brain Topogr 22: 233–248. [DOI] [PMC free article] [PubMed] [Google Scholar]
- Ilmoniemi RJ, Virtanen J, Ruohonen J, Karhu J, Aronen HJ, Naatanen R, Katila T ( 1997): Neuronal responses to magnetic stimulation reveal cortical reactivity and connectivity. Neuroreport 8: 3537–3540. [DOI] [PubMed] [Google Scholar]
- Ives JR, Rotenberg A, Poma R, Thut G, Pascual‐Leone A ( 2006): Electroencephalographic recording during transcranial magnetic stimulation in humans and animals. Clin Neurophysiol 117: 1870–1875. [DOI] [PubMed] [Google Scholar]
- Izumi S, Takase M, Arita M, Masakado Y, Kimura A, Chino N ( 1997): Transcranial magnetic stimulation‐induced changes in EEG and responses recorded from the scalp of healthy humans. Electroencephalogr Clin Neurophysiol 103: 319–322. [DOI] [PubMed] [Google Scholar]
- Julkunen P, Paakkonen A, Hukkanen T, Kononen M, Tiihonen P, Vanhatalo S, Karhu J ( 2008): Efficient reduction of stimulus artefact in TMS‐EEG by epithelial short‐circuiting by mini‐punctures. Clin Neurophysiol 119: 475–481. [DOI] [PubMed] [Google Scholar]
- Kahkonen S, Wilenius J ( 2007): Effects of alcohol on TMS‐evoked N100 responses. J Neurosci Methods 166: 104–108. [DOI] [PubMed] [Google Scholar]
- Kahkonen S, Kesaniemi M, Nikouline VV, Karhu J, Ollikainen M, Holi M, Ilmoniemi RJ ( 2001): Ethanol modulates cortical activity: Direct evidence with combined TMS and EEG. Neuroimage 14: 322–328. [DOI] [PubMed] [Google Scholar]
- Kahkonen S, Wilenius J, Nikulin VV, Ollikainen M, Ilmoniemi RJ ( 2003): Alcohol reduces prefrontal cortical excitability in humans: A combined TMS and EEG study. Neuropsychopharmacology 28: 747–754. [DOI] [PubMed] [Google Scholar]
- Kahkonen S, Wilenius J, Komssi S, Ilmoniemi RJ ( 2004): Distinct differences in cortical reactivity of motor and prefrontal cortices to magnetic stimulation. Clin Neurophysiol 115: 583–588. [DOI] [PubMed] [Google Scholar]
- Kahkonen S, Komssi S, Wilenius J, Ilmoniemi RJ ( 2005a): Prefrontal TMS produces smaller EEG responses than motor‐cortex TMS: Implications for rTMS treatment in depression. Psychopharmacology (Berl) 181: 16–20. [DOI] [PubMed] [Google Scholar]
- Kahkonen S, Komssi S, Wilenius J, Ilmoniemi RJ ( 2005b): Prefrontal transcranial magnetic stimulation produces intensity‐dependent EEG responses in humans. Neuroimage 24: 955–960. [DOI] [PubMed] [Google Scholar]
- Kicic D, Lioumis P, Ilmoniemi RJ, Nikulin VV ( 2008): Bilateral changes in excitability of sensorimotor cortices during unilateral movement: Combined electroencephalographic and transcranial magnetic stimulation study. Neuroscience 152: 1119–1129. [DOI] [PubMed] [Google Scholar]
- Kirschstein T, Kohling R ( 2009): What is the source of the EEG? Clin EEG Neurosci 40: 146–149. [DOI] [PubMed] [Google Scholar]
- Komssi S, Aronen HJ, Huttunen J, Kesäniemi M, Soinne L, Nikouline VV, Ollikainen M, Roine RO, Karhu J, Savolainen S, Ilmoniemi RJ ( 2002): Ipsi‐ and contralateral EEG reactions to transcranial magnetic stimulation. Clin Neurophysiol 113: 175–184. [DOI] [PubMed] [Google Scholar]
- Komssi S, Kahkonen S, Ilmoniemi RJ ( 2004): The effect of stimulus intensity on brain responses evoked by transcranial magnetic stimulation. Hum Brain Mapp 21: 154–164. [DOI] [PMC free article] [PubMed] [Google Scholar]
- Komssi S, Savolainen P, Heiskala J, Kahkonen S ( 2007): Excitation threshold of the motor cortex estimated with transcranial magnetic stimulation electroencephalography. Neuroreport 18: 13–16. [DOI] [PubMed] [Google Scholar]
- Korhonen RJ, Hernandez‐Pavon JC, Metsomaa J, Maki H, Ilmoniemi RJ, Sarvas J ( 2011): Removal of large muscle artifacts from transcranial magnetic stimulation‐evoked EEG by independent component analysis. Med Biol Eng Comput 49: 397–407. [DOI] [PubMed] [Google Scholar]
- Kujirai T, Caramia MD, Rothwell JC, Day BL, Thompson PD, Ferbert A, Wroe S, Asselman P, Marsden CD ( 1993): Corticocortical inhibition in human motor cortex. J Physiol 471: 501–519. [DOI] [PMC free article] [PubMed] [Google Scholar]
- Kumar S, Porcu P, Werner DF, Matthews DB, Diaz‐Granados JL, Helfand RS, Morrow AL ( 2009): The role of GABA(A) receptors in the acute and chronic effects of ethanol: A decade of progress. Psychopharmacology (Berl) 205: 529–564. [DOI] [PMC free article] [PubMed] [Google Scholar]
- Lagerlund TD, Sharbrough FW, Busacker NE ( 1997): Spatial filtering of multichannel electroencephalographic recordings through principal component analysis by singular value decomposition. J Clin Neurophysiol 14: 73–82. [DOI] [PubMed] [Google Scholar]
- Levit‐Binnun N, Litvak V, Pratt H, Moses E, Zaroor M, Peled A ( 2010): Differences in TMS‐evoked responses between schizophrenia patients and healthy controls can be observed without a dedicated EEG system. Clin Neurophysiol 121: 332–339. [DOI] [PubMed] [Google Scholar]
- Lioumis P, Kicic D, Savolainen P, Makela JP, Kahkonen S ( 2009): Reproducibility of TMS‐Evoked EEG responses. Hum Brain Mapp 30: 1387–1396. [DOI] [PMC free article] [PubMed] [Google Scholar]
- Litvak V, Komssi S, Scherg M, Hoechstetter K, Classen J, Zaaroor M, Pratt H, Kahkonen S ( 2007): Artifact correction and source analysis of early electroencephalographic responses evoked by transcranial magnetic stimulation over primary motor cortex. Neuroimage 37: 56–70. [DOI] [PubMed] [Google Scholar]
- Mainy N, Kahane P, Minotti L, Hoffmann D, Bertrand O, Lachaux JP ( 2007): Neural correlates of consolidation in working memory. Hum Brain Mapp 28: 183–193. [DOI] [PMC free article] [PubMed] [Google Scholar]
- Maki H, Ilmoniemi RJ ( 2010a): Projecting out muscle artifacts from TMS‐evoked EEG. Neuroimage 54: 2706–2710. [DOI] [PubMed] [Google Scholar]
- Maki H, Ilmoniemi RJ ( 2010b): The relationship between peripheral and early cortical activation induced by transcranial magnetic stimulation. Neurosci Lett 478: 24–28. [DOI] [PubMed] [Google Scholar]
- Massimini M, Ferrarelli F, Huber R, Esser SK, Singh H, Tononi G ( 2005): Breakdown of cortical effective connectivity during sleep. Science 309: 2228–2232. [DOI] [PubMed] [Google Scholar]
- Massimini M, Ferrarelli F, Esser SK, Riedner BA, Huber R, Murphy M, Peterson MJ, Tononi G ( 2007): Triggering sleep slow waves by transcranial magnetic stimulation. Proc Natl Acad Sci USA 104: 8496–8501. [DOI] [PMC free article] [PubMed] [Google Scholar]
- Massimini M, Ferrarelli F, Murphy M, Huber R, Riedner B, Casarotto S, Tononi G ( 2010): Cortical reactivity and effective connectivity during REM sleep in humans. Cogn Neurosci 1: 176–183. [DOI] [PMC free article] [PubMed] [Google Scholar]
- McDonnell MN, Orekhov Y, Ziemann U ( 2006): The role of GABA(B) receptors in intracortical inhibition in the human motor cortex. Exp Brain Res 173: 86–93. [DOI] [PubMed] [Google Scholar]
- McMenamin BW, Shackman AJ, Maxwell JS, Bachhuber DR, Koppenhaver AM, Greischar LL, Davidson RJ ( 2010): Validation of ICA‐based myogenic artifact correction for scalp and source‐localized EEG. Neuroimage 49: 2416–2432. [DOI] [PMC free article] [PubMed] [Google Scholar]
- Merabet LB, Theoret H, Pascual‐Leone A ( 2003): Transcranial magnetic stimulation as an investigative tool in the study of visual function. Optom Vis Sci 80: 356–368. [DOI] [PubMed] [Google Scholar]
- Meyer BU, Roricht S ( 1995): Scalp potentials recorded over the sensorimotor region following magnetic stimulation over the cerebellum in man: Considerations about the activated structures and their potential diagnostic use. J Neurol 242: 109–112. [DOI] [PubMed] [Google Scholar]
- Moliadze V, Zhao Y, Eysel U, Funke K ( 2003): Effect of transcranial magnetic stimulation on single‐unit activity in the cat primary visual cortex. J Physiol 553 ( Part 2): 665–679. [DOI] [PMC free article] [PubMed] [Google Scholar]
- Morbidi F, Garulli A, Prattichizzo D, Rizzo C, Manganotti P, Rossi S ( 2007): Off‐line removal of TMS‐induced artifacts on human electroencephalography by Kalman filter. J Neurosci Methods 162: 293–302. [DOI] [PubMed] [Google Scholar]
- Morishima Y, Akaishi R, Yamada Y, Okuda J, Toma K, Sakai K ( 2009): Task‐specific signal transmission from prefrontal cortex in visual selective attention. Nat Neurosci 12: 85–91. [DOI] [PubMed] [Google Scholar]
- Nahas Z, Teneback CC, Kozel A, Speer AM, DeBrux C, Molloy M, Stallings L, Spicer KM, Arana G, Bohning DE, Risch SC, George MS ( 2001): Brain effects of TMS delivered over prefrontal cortex in depressed adults: Role of stimulation frequency and coil‐cortex distance. J Neuropsychiatry Clin Neurosci 13: 459–470. [DOI] [PubMed] [Google Scholar]
- Nakamura H, Kitagawa H, Kawaguchi Y, Tsuji H ( 1996): Direct and indirect activation of human corticospinal neurons by transcranial magnetic and electrical stimulation. Neurosci Lett 210: 45–48. [DOI] [PubMed] [Google Scholar]
- Neuper C, Wortz M, Pfurtscheller G ( 2006): ERD/ERS patterns reflecting sensorimotor activation and deactivation. Prog Brain Res 159: 211–222. [DOI] [PubMed] [Google Scholar]
- Nikouline V, Ruohonen J, Ilmoniemi RJ ( 1999): The role of the coil click in TMS assessed with simultaneous EEG. Clin Neurophysiol 110: 1325–1328. [DOI] [PubMed] [Google Scholar]
- Nikulin VV, Kicic D, Kahkonen S, Ilmoniemi RJ ( 2003): Modulation of electroencephalographic responses to transcranial magnetic stimulation: Evidence for changes in cortical excitability related to movement. Eur J Neurosci 18: 1206–1212. [DOI] [PubMed] [Google Scholar]
- Noguchi Y, Watanabe E, Sakai KL ( 2003): An event‐related optical topography study of cortical activation induced by single‐pulse transcranial magnetic stimulation. Neuroimage 19: 156–162. [DOI] [PubMed] [Google Scholar]
- Onton J, Westerfield M, Townsend J, Makeig S ( 2006): Imaging human EEG dynamics using independent component analysis. Neurosci Biobehav Rev 30: 808–822. [DOI] [PubMed] [Google Scholar]
- Oswald AM, Doiron B, Rinzel J, Reyes AD ( 2009): Spatial profile and differential recruitment of GABAB modulate oscillatory activity in auditory cortex. J Neurosci 29: 10321–10334. [DOI] [PMC free article] [PubMed] [Google Scholar]
- Pascual‐Leone A, Walsh V, Rothwell J ( 2000): Transcranial magnetic stimulation in cognitive neuroscience—Virtual lesion, chronometry, and functional connectivity. Curr Opin Neurobiol 10: 232–237. [DOI] [PubMed] [Google Scholar]
- Paus T, Jech R, Thompson CJ, Comeau R, Peters T, Evans AC ( 1997): Transcranial magnetic stimulation during positron emission tomography: A new method for studying connectivity of the human cerebral cortex. J Neurosci 17: 3178–3184. [DOI] [PMC free article] [PubMed] [Google Scholar]
- Paus T, Sipila PK, Strafella AP ( 2001): Synchronization of neuronal activity in the human primary motor cortex by transcranial magnetic stimulation: An EEG study. J Neurophysiol 86: 1983–1990. [DOI] [PubMed] [Google Scholar]
- Pollok B, Gross J, Muller K, Aschersleben G, Schnitzler A ( 2005): The cerebral oscillatory network associated with auditorily paced finger movements. Neuroimage 24: 646–655. [DOI] [PubMed] [Google Scholar]
- Reis J, Swayne OB, Vandermeeren Y, Camus M, Dimyan MA, Harris‐Love M, Perez MA, Ragert P, Rothwell JC, Cohen LG ( 2008): Contribution of transcranial magnetic stimulation to the understanding of cortical mechanisms involved in motor control. J Physiol 586: 325–351. [DOI] [PMC free article] [PubMed] [Google Scholar]
- Rosanova M, Casali A, Bellina V, Resta F, Mariotti M, Massimini M ( 2009): Natural frequencies of human corticothalamic circuits. J Neurosci 29: 7679–7685. [DOI] [PMC free article] [PubMed] [Google Scholar]
- Roth BJ, Pascual‐Leone A, Cohen LG, Hallett M ( 1992): The heating of metal electrodes during rapid‐rate magnetic stimulation: A possible safety hazard. Electroencephalogr Clin Neurophysiol 85: 116–123. [DOI] [PubMed] [Google Scholar]
- Rothwell JC ( 1997): Techniques and mechanisms of action of transcranial stimulation of the human motor cortex. J Neurosci Methods 74: 113–122. [DOI] [PubMed] [Google Scholar]
- Sanger TD, Garg RR, Chen R ( 2001): Interactions between two different inhibitory systems in the human motor cortex. J Physiol 530 ( Part 2): 307–317. [DOI] [PMC free article] [PubMed] [Google Scholar]
- Schurmann M, Nikouline VV, Soljanlahti S, Ollikainen M, Basar E, Ilmoniemi RJ ( 2001): EEG responses to combined somatosensory and transcranial magnetic stimulation. Clin Neurophysiol 112: 19–24. [DOI] [PubMed] [Google Scholar]
- Sekiguchi H, Takeuchi S, Kadota H, Kohno Y, Nakajima Y ( 2011): TMS‐induced artifacts on EEG can be reduced by rearrangement of the electrode's lead wire before recording. Clin Neurophysiol 122:984–990. [DOI] [PubMed] [Google Scholar]
- Sohal VS, Zhang F, Yizhar O, Deisseroth K ( 2009): Parvalbumin neurons and gamma rhythms enhance cortical circuit performance. Nature 459: 698–702. [DOI] [PMC free article] [PubMed] [Google Scholar]
- Spieser L, Meziane HB, Bonnard M ( 2010): Cortical mechanisms underlying stretch reflex adaptation to intention: A combined EEG‐TMS study. Neuroimage 52: 316–325. [DOI] [PubMed] [Google Scholar]
- Stefan K, Kunesch E, Cohen LG, Benecke R, Classen J ( 2000): Induction of plasticity in the human motor cortex by paired associative stimulation. Brain 123 ( Part 3): 572–584. [DOI] [PubMed] [Google Scholar]
- Stefan K, Kunesch E, Benecke R, Cohen LG, Classen J ( 2002): Mechanisms of enhancement of human motor cortex excitability induced by interventional paired associative stimulation. J Physiol 543 ( Part 2): 699–708. [DOI] [PMC free article] [PubMed] [Google Scholar]
- Stefan K, Wycislo M, Gentner R, Schramm A, Naumann M, Reiners K, Classen J ( 2006): Temporary occlusion of associative motor cortical plasticity by prior dynamic motor training. Cereb Cortex 16: 376–385. [DOI] [PubMed] [Google Scholar]
- Steriade M ( 2006): Grouping of brain rhythms in corticothalamic systems. Neuroscience 137: 1087–1106. [DOI] [PubMed] [Google Scholar]
- Stern P, Edwards FA, Sakmann B ( 1992): Fast and slow components of unitary EPSCs on stellate cells elicited by focal stimulation in slices of rat visual cortex. J Physiol 449: 247–278. [DOI] [PMC free article] [PubMed] [Google Scholar]
- Strafella AP, Paus T, Barrett J, Dagher A ( 2001): Repetitive transcranial magnetic stimulation of the human prefrontal cortex induces dopamine release in the caudate nucleus. J Neurosci 21: RC157. [DOI] [PMC free article] [PubMed] [Google Scholar]
- Strafella AP, Vanderwerf Y, Sadikot AF ( 2004): Transcranial magnetic stimulation of the human motor cortex influences the neuronal activity of subthalamic nucleus. Eur J Neurosci 20: 2245–2249. [DOI] [PubMed] [Google Scholar]
- Sutor B, Hablitz JJ ( 1989a): EPSPs in rat neocortical neurons in vitro. I. Electrophysiological evidence for two distinct EPSPs. J Neurophysiol 61: 607–620. [DOI] [PubMed] [Google Scholar]
- Sutor B, Hablitz JJ ( 1989b): EPSPs in rat neocortical neurons in vitro. II. Involvement of N‐methyl‐d‐aspartate receptors in the generation of EPSPs. J Neurophysiol 61: 621–634. [DOI] [PubMed] [Google Scholar]
- Tallon‐Baudry C, Bertrand O, Peronnet F, Pernier J ( 1998): Induced gamma‐band activity during the delay of a visual short‐term memory task in humans. J Neurosci 18: 4244–4254. [DOI] [PMC free article] [PubMed] [Google Scholar]
- Tamas G, Lorincz A, Simon A, Szabadics J ( 2003): Identified sources and targets of slow inhibition in the neocortex. Science 299: 1902–1905. [DOI] [PubMed] [Google Scholar]
- Taylor PC, Nobre AC, Rushworth MF ( 2007a): FEF TMS affects visual cortical activity. Cereb Cortex 17: 391–399. [DOI] [PubMed] [Google Scholar]
- Taylor PC, Nobre AC, Rushworth MF ( 2007b): Subsecond changes in top down control exerted by human medial frontal cortex during conflict and action selection: A combined transcranial magnetic stimulation electroencephalography study. J Neurosci 27: 11343–11353. [DOI] [PMC free article] [PubMed] [Google Scholar]
- Thut G, Northoff G, Ives JR, Kamitani Y, Pfennig A, Kampmann F, Schomer DL, Pascual‐Leone A ( 2003): Effects of single‐pulse transcranial magnetic stimulation (TMS) on functional brain activity: A combined event‐related TMS and evoked potential study. Clin Neurophysiol 114: 2071–2080. [DOI] [PubMed] [Google Scholar]
- Thut G, Ives JR, Kampmann F, Pastor MA, Pascual‐Leone A ( 2005): A new device and protocol for combining TMS and online recordings of EEG and evoked potentials. J Neurosci Methods 141: 207–217. [DOI] [PubMed] [Google Scholar]
- Tiitinen H, Virtanen J, Ilmoniemi RJ, Kamppuri J, Ollikainen M, Ruohonen J, Naatanen R ( 1999): Separation of contamination caused by coil clicks from responses elicited by transcranial magnetic stimulation. Clin Neurophysiol 110: 982–985. [DOI] [PubMed] [Google Scholar]
- Tokimura H, Di Lazzaro V, Tokimura Y, Oliviero A, Profice P, Insola A, Mazzone P, Tonali P, Rothwell JC ( 2000): Short latency inhibition of human hand motor cortex by somatosensory input from the hand. J Physiol 523 ( Part 2): 503–513. [DOI] [PMC free article] [PubMed] [Google Scholar]
- Uhlhaas PJ, Pipa G, Lima B, Melloni L, Neuenschwander S, Nikolic D, Singer W ( 2009): Neural synchrony in cortical networks: History, concept and current status. Front Integr Neurosci 3: 17. [DOI] [PMC free article] [PubMed] [Google Scholar]
- Valls‐Sole J, Pascual‐Leone A, Wassermann EM, Hallett M ( 1992): Human motor evoked responses to paired transcranial magnetic stimuli. Electroencephalogr Clin Neurophysiol 85: 355–364. [DOI] [PubMed] [Google Scholar]
- Van Der Werf YD, Paus T ( 2006): The neural response to transcranial magnetic stimulation of the human motor cortex. I. Intracortical and cortico‐cortical contributions. Exp Brain Res 175: 231–245. [DOI] [PubMed] [Google Scholar]
- Van Der Werf YD, Sadikot AF, Strafella AP, Paus T ( 2006): The neural response to transcranial magnetic stimulation of the human motor cortex. II. Thalamocortical contributions. Exp Brain Res 175: 246–255. [DOI] [PubMed] [Google Scholar]
- Veniero D, Bortoletto M, Miniussi C ( 2009): TMS‐EEG co‐registration: On TMS‐induced artifact. Clin Neurophysiol 120: 1392–1399. [DOI] [PubMed] [Google Scholar]
- Veniero D, Maioli C, Miniussi C ( 2010): Potentiation of short‐latency cortical responses by high‐frequency repetitive transcranial magnetic stimulation. J Neurophysiol 104: 1578–1588. [DOI] [PubMed] [Google Scholar]
- Virtanen J, Ruohonen J, Naatanen R, Ilmoniemi RJ ( 1999): Instrumentation for the measurement of electric brain responses to transcranial magnetic stimulation. Med Biol Eng Comput 37: 322–326. [DOI] [PubMed] [Google Scholar]
- Voineskos AN, Farzan F, Barr MS, Lobaugh NJ, Mulsant BH, Chen R, Fitzgerald PB, Daskalakis ZJ ( 2010): The role of the corpus callosum in transcranial magnetic stimulation induced interhemispheric signal propagation. Biol Psychiatry 68: 825–831. [DOI] [PubMed] [Google Scholar]
- von Stein A, Chiang C, Konig P ( 2000): Top‐down processing mediated by interareal synchronization. Proc Natl Acad Sci USA 97: 14748–14753. [DOI] [PMC free article] [PubMed] [Google Scholar]
- Whittington MA, Traub RD, Jefferys JG ( 1995): Synchronized oscillations in interneuron networks driven by metabotropic glutamate receptor activation. Nature 373: 612–615. [DOI] [PubMed] [Google Scholar]
- Zanon M, Busan P, Monti F, Pizzolato G, Battaglini PP ( 2010): Cortical connections between dorsal and ventral visual streams in humans: Evidence by TMS/EEG co‐registration. Brain Topogr 22: 307–317. [DOI] [PubMed] [Google Scholar]
- Ziemann U, Lonnecker S, Paulus W ( 1995): Inhibition of human motor cortex by ethanol. A transcranial magnetic stimulation study. Brain 118 ( Part 6): 1437–1446. [DOI] [PubMed] [Google Scholar]
- Ziemann U, Lonnecker S, Steinhoff BJ, Paulus W ( 1996): The effect of lorazepam on the motor cortical excitability in man. Exp Brain Res 109: 127–135. [DOI] [PubMed] [Google Scholar]
- Ziemann U, Chen R, Cohen LG, Hallett M ( 1998a): Dextromethorphan decreases the excitability of the human motor cortex. Neurology 51: 1320–1324. [DOI] [PubMed] [Google Scholar]
- Ziemann U, Tergau F, Wassermann EM, Wischer S, Hildebrandt J, Paulus W ( 1998b): Demonstration of facilitatory I wave interaction in the human motor cortex by paired transcranial magnetic stimulation. J Physiol 511 ( Part 1): 181–190. [DOI] [PMC free article] [PubMed] [Google Scholar]
- Ziemann U, Paulus W, Nitsche MA, Pascual‐Leone A, Byblow WD, Berardelli A, Siebner HR, Classen J, Cohen LG, Rothwell JC ( 2008): Consensus: Motor cortex plasticity protocols. Brain Stimul 1: 164–182. [DOI] [PubMed] [Google Scholar]