

Abstract
Studies of in mesial temporal lobe epilepsy (mTLE) patients with hippocampal sclerosis (HS) have reported reductions in both functional and structural connectivity between hippocampal structures and adjacent brain regions. However, little is known about the connectivity among the default mode network (DMN) in mTLE. Here, we hypothesized that both functional and structural connectivity within the DMN were disturbed in mTLE. To test this hypothesis, functional magnetic resonance imaging (fMRI) and diffusion tensor imaging (DTI) were applied to examine the DMN connectivity of 20 mTLE patients, and 20 gender‐ and age‐matched healthy controls. Combining these two techniques, we explored the changes in functional (temporal correlation coefficient derived from fMRI) and structural (path length and connection density derived from DTI tractography) connectivity of the DMN. Compared to the controls, we found that both functional and structural connectivity were significantly decreased between the posterior cingulate cortex (PCC)/precuneus (PCUN) and bilateral mesial temporal lobes (mTLs) in patients. No significant between‐group difference was found between the PCC/PCUN and medial prefrontal cortex (mPFC). In addition, functional connectivity was found to be correlated with structural connectivity in two pairwise regions, namely between the PCC/PCUN and bilateral mTLs, respectively. Our results suggest that the decreased functional connectivity within the DMN in mTLE may be a consequence of the decreased connection density underpinning the degeneration of structural connectivity. Hum Brain Mapp, 2011. © 2010 Wiley‐Liss, Inc.
Keywords: mesial temporal lobe epilepsy, hippocampal sclerosis, default mode network, functional connectivity, fiber tractography
INTRODUCTION
Mesial temporal lobe epilepsy (mTLE) is characterized by the epileptiogenic focus and neuropathological changes in the mesial temporal regions, i.e., the usually pathologic substrate of hippocampal sclerosis (HS) [Engel, 2001]. Moreover, evidence from neuroimaging studies has suggested that the damage can extend to other brain structures far from the mesial temporal lobe, such as the thalamus, subcortical nuclei, and a few of neo‐cortices, which are generally included in a mesial temporal epilepsy network [Spencer, 2002]. Functional magnetic resonance imaging (fMRI) [Bettus et al., 2009; Frings et al., 2009; Laufs et al., 2007; Waites et al., 2006] based on blood oxygenation level‐dependent (BOLD) contrast and diffusion tensor imaging (DTI) [Focke et al., 2008], have been extensively used for the investigation of mTLE.
Recently, fMRI studies have focused on the default‐mode function of mTLE patients. Laufs and colleagues have shown that the interictal epileptiform discharges (IEDs) related deactivation is associated with the default mode network (DMN), which suggests that the epileptic activity may spread from the temporal lobe into functionally interconnected DMN regions in TLE [Laufs et al., 2007]. Subsequently, functional connectivity abnormality within the DMN was found in mTLE patients who performed an object‐location memory task [Frings et al., 2009]. A group of left mTLE patients showed reduced connectivity between the precuneus (PCUN) and hippocampus compared to controls [Frings et al., 2009]. Moreover, a study of Waites et al. [Waites et al., 2006] and a recent work of us [Liao et al., 2010] both concerned the altered functional connectivity of the DMN in mTLE patients by using resting state fMRI data. An independent component analysis‐based functional connectivity has further indicated that differently sided mTLE patients have different functional impairments in the DMN [Zhang et al., 2010]. Whereas the DMN is engaged in maintaining the baseline brain activities associated with cognitions of self‐awareness, episodic memory, and environmental monitoring [Buckner et al., 2008], the impairment of the DMN in epilepsy may underlie the pathophysiological mechanism of impaired cognitions in the patients [Gotman et al., 2005; Zhang et al., 2010].
Functional connectivity‐fMRI addresses on the temporal coherence of spontaneous BOLD fluctuations within brain network that are anatomically connected or not [Honey et al., 2009]. On the other hand, DTI fiber tractography is a direct way to depict the structural connectivity of brain network. This approach can be used to estimate the routes taken by fiber pathways connecting different brain regions of the human brain [Catani et al., 2002; Johansen‐Berg and Rushworth, 2009]. It was demonstrated that the structural connectivity overlaps with the functional connectivity among the DMN [Greicius et al., 2009; van den Heuvel et al., 2008, 2009]. This finding provides an anatomical evidence in support of the notion that memory is processed in the DMN [Greicius et al., 2009]. Interestingly, not only the regions within the DMN been found to be structurally connected with the cingulum tract but also the microstructural organization of this interconnecting cingulum has been found to be directly related to the level of functional synchronization in the DMN [van den Heuvel et al., 2008, 2009]. It is widely accepted that the functional connectivity reflects the structural connectivity architecture, which can enrich our understanding of brain networks [Greicius et al., 2009; Honey et al., 2009; Rykhlevskaia et al., 2008; van den Heuvel et al., 2008, 2009]. Therefore, it is important to improve our understanding on the neural underpinnings of the mTLE via studying the changes in functional and structural connectivity within the DMN.
A DTI tractography study of mTLE has demonstrated the altered white matter pathways linking the medial temporal lobe and the parahippocampal gyri in the patients [Yogarajah et al., 2008]. Widespread fractional anisotropy (FA) reduction was also found in the ipsilateral temporal lobe of the unilateral mTLE patients [Focke et al., 2008]. More recently, a combination of BOLD functional connectivity and DTI structural connectivity has been used to observe the memory network changes in mTLE patients [Voets et al., 2009]. Hence, the DMN disruption in mTLE, reflected in functional and structural connectivity properties, may be worthy of consideration. In the present study, we investigated changes in functional (temporal correlation coefficient derived from fMRI) and structural (path length and connection density derived from DTI tractography) connectivity of the DMN in the mTLE. We aimed at providing novel imaging indices to further investigate the neuro‐pathophysiological mechanisms of mTLE.
MATERIALS AND METHODS
Participants
Twenty mTLE patients (all right‐handed, 10 females, age range: 17–51 years, mean age: 25.9) participated in this study. These patients were partially selected from those included in our previous studies [Zhang et al., 2009a, b], and successfully underwent both DTI and fMRI scans. General patient information is summarized in Table SI. All patients underwent a comprehensive clinical evaluation according to the epilepsy classifications of the International League Against Epilepsy (ILAE). Recruitment was based on the following three inclusion criteria: (1) Symptoms of mTLE were present: Patients had suffered from complex partial seizures; parts of them were accompanied by the secondarily generalized or simple partial seizures. (2) MRI evidence of bilateral HS: Hippocampal atrophy—the hippocampal volume is smaller than the Chinese normal hippocampus volume (2.62 cm3 on the right and 2.48 cm3 on the left; these criteria were set as the two standard deviations below the mean hippocampal volume of the healthy Chinese adults) [Wu et al., 1998a, b] measured in coronal T1 images, and increase in T2 fluid‐attenuated inverted recovery (FLAIR) signal in the hippocampus were used as the diagnostic criteria. There was no other MRI abnormality rather than the HS. (3) Specific pattern of electrophysiological activity measured by EEG: The patients' interictal/ictal scalp and sphenoidal EEGs showed epileptic spikes in the bilateral frontotemporal or temporal lobes. The exclusive criteria included (1) Structural abnormality other than HS, such as cortical dysplasia, vascular malformation, or brain tumor. (2) Unilateral HS or MRI negative in the conventional MRI. More patients details can be found in our previous studies [Zhang et al., 2009a, b].
Twenty healthy volunteers were recruited as controls (all right‐handed, 11 females, age range: 20–38 years, mean age: 26.2), matched to the patients in age (P = 0.9332, two‐sample two‐tailed t‐test) and gender (P = 0.7546, Kruskal‐Wallis test). None of the controls had neurological or psychiatric disorders. All examinations were carried out according to the Declaration of Helsinki [1975]. Written informed consents were obtained from all participants. The research protocol was approved by the local Medical Ethics Committee in Jinling Hospital, Nanjing University School of Medicine.
Data Acquisition
MRI data were collected using a 1.5‐Tesla scanner (GE‐Signa, Milwaukee). Participants were instructed to rest with their eyes closed and keep their heads still. First, anatomic images were acquired for clinical diagnosis, including axial T1 weighted images (TR/TE = 2,200 ms/24 ms, matrix = 512 × 512, FOV = 24 × 24 cm2, slice thickness/gap = 4.0 mm/0.5 mm, 23 slices covered the whole brain), coronal T1 and T2 FLAIR images (4 mm thickness without gap and 14 slices) used for measuring hippocampal volume and detecting hippocampal lesions.
Functional imaging covering the whole brain was acquired axially using a T2*‐weighted single‐shot echo planar imaging sequence: (TR = 2,000 ms, TE = 40 ms, flip angle = 80°, matrix = 64 × 64, FOV = 24 × 24 cm; 4 mm thickness and 0.5 mm gap, 23 slices; voxel size = 3.75 × 3.75 × 4 mm3). For each subject, fMRI scanning lasted 7 min, with 210 volumes recorded in total. The DTI acquisition used a single‐shot spin‐echo planar imaging sequence in contiguous axial planes covering the whole brain (TR = 9,000 ms, TE = 79.7 ms, NEX = 2, matrix size = 256 × 256, FOV = 24 × 24 cm2, slice thickness = 3 mm without inter‐slice gaps, 32 slices covered the whole brain). At each slice position, except for S0 (b = 0 s/mm2), a single b‐value (b = 1,000 s/mm2) was applied to 15 non‐collinear gradient directions.
Data Pre‐Processing
For fMRI images, the first 10 images were excluded to avoid instability in the magnetic field. The remaining 200 consecutive volumes were used for data analysis. Data preprocessing were performed using SPM2 software [http://www.fil.ion.ucl.ac.uk/spm]. After slice‐timing adjustment and realignment for head motion correction, any data affected by head motion of over 1 mm or rotation of more than 1° was excluded. We also evaluated group differences in translation and rotation of head motion according to the following formula [Liu et al., 2008]:
 |
where L is the length of the time series (L = 200 in this study), x i, y i, and z i are translations/rotations at the ith time point in the x, y, and z directions, respectively. The results showed that there were no significant differences between patients and healthy groups in head motion and rotation (two sample two‐tailed t‐test, T = 0.8263, P = 0.4138 for translational motion and T = 1.0168, P = 0.3157 for rotational motion). The data were then coregistered to the individual's unweighted B0 image (b = 0 s/mm2) using a linear transformation [Hagmann et al., 2008], resulting in a coregistered functional images in DTI space. The coregistered functional images were then spatially normalized to the echo‐planar imaging (EPI) template in Montreal Neurological Institute (MNI) space (Resampling voxel size into standard stereotaxic space at 3 × 3 × 3 mm3) using a nonlinear transformation, resulting in a nonlinear transformation (T). Finally, all the images were spatially smoothed by convolution with an isotropic Gaussian kernel (FWHM = 8 mm).
To extract the time series for cerebrospinal fluid (CSF) and white matter (WM), subject‐specific CSF and WM templates were created. For individual's T1 weighted anatomical image acquired with the same prescription as the fMRI data were also coregistered to the individual's unweighted B0 image (b = 0 s/mm2) using a linear transformation. The coregistered T1 weighted anatomical image was then spatially normalized to T1 template in MNI space (Resampling voxel size into standard stereotaxic space at 3 × 3 × 3 mm3). The image was then segmented using SPM2, and thresholded the segmented probability images at 80%. Finally, once the CSF and WM masks were coregistered to functional images, the subject‐specific CSF and WM masks were, respectively, generated.
For DTI images, head motion was removed by aligning 15 diffusion‐weighted scans to the unweighted B0 image (b = 0 s/mm2). Eddy current distortions existing in the single‐shot spin‐echo planar imaging sequence were corrected by affine registration to the reference B0 image.
ROI Extraction
To examine the DMN in both groups, spatial independent component analysis (ICA) was first conducted to decompose the data of each individual in both group into 30 independent components (ICs) with the Infomax algorithm using the GIFT software (http://icatb.sourceforge.net/, version 1.3e) [Calhoun et al., 2001]. The number (i.e., 30) of ICs was determined by a dimension estimation using the minimum description length (MDL) criterion [Li et al., 2007]. For each IC, the waveform corresponds to the time course of a specific pattern of brain networks, and the intensity with which this connectivity is found across the voxels is expressed in the associated spatial map [Mantini et al., 2007]. To display the voxels that contributed most strongly to a particular IC, the intensity values in each spatial map were converted to Z‐values (standard deviation of image) map [Calhoun et al., 2001; Mantini et al., 2007]. As ICA on fMRI data intrinsically extracts patterns of coherent neuronal activity (i.e., networks), it is commonly accepted that Z‐values can provide an indirect measure of functional connectivity within the network [Bartels and Zeki, 2005].
The DMN IC was identified by spatially correlating all ICs with a DMN template. This template was extracted using the MarsBaR toolbox (http://marsbar.sourceforge.net). It covered the bilateral posterior parietal cortex, temporoparietal, and the mPFC, as well as the posterior cingulate cortex (PCC)/PCUN [Greicius et al., 2004]. More specifically, our selected default mode component matched the cerebral ICs with the largest spatial correlation coefficient with the DMN template [van de Ven et al., 2004, 2008]. The IC corresponding to the DMN was extracted from all the subjects. For each group, the IC maps of the DMN were then subjected to a random‐effect analysis by using a one sample t‐test. Thresholds were set at P < 0.05, false discovery rate (FDR) corrected. Regions of interest (ROIs) for the PCC/PCUN, mPFC, bilateral inferior parietal lobule (IPL), mTLs, and the inferior temporal gyrus (ITG) were selected from the DMN map of the control group using the xjView toolbox (see Table I for ROIs size). These eight ROIs were used for the subsequent analyses in both the patient and the control groups.
Table I.
Details on the brain regions in the DMN map (P < 0.05, FDR corrected) from the controls
| Anatomical region | Hemisphere | MNI coordinates (x, y, z) | Brodmann's area | Cluster size (Voxels) | T value |
|---|---|---|---|---|---|
| PCC/PCUN | L/R | −6, −54, 36 | 23, 26, 27, 30 | 1,942 | 16.41 |
| IPL | L | −42, −66, 33 | 39, 40 | 306 | 10.10 |
| R | 54, −63, 36 | 39, 40 | 266 | 6.12 | |
| mTLs | L | −21, −15, −27 | 20, 30, 35, 36 | 60 | 3.59 |
| R | 24, −9, −21 | 20, 30, 35, 36 | 86 | 4.28 | |
| ITG | L | −60, −12, −21 | 20, 21, 22, 38 | 635 | 8.42 |
| R | 60, −3, −27 | 20, 21, 22, 38 | 699 | 8.69 | |
| mPFC | L/R | 0, 54, −6 | 8, 9, 10, 11, 32 | 3,514 | 12.56 |
The cluster size corresponds to the ROI size in subsequent connectivity analyses.
PCC/PCUN, posterior cingulate cortex/precuneus; IPL, inferior parietal lobule; mTLs, mesial temporal lobe; ITG, inferior temporal gyrus; mPFC, medial prefrontal cortex.
Subsequently, the IC maps for the DMN in the patient group were compared to those in the control group by using two sample t‐tests (|T|> 1.69, P < 0.05, clustering extent threshold, 15 voxels). The group comparison was restricted (masked) to the voxels within the DMN maps of either patients or controls. Accordingly, the mask was created as the union of the DMN maps from the two groups, thresholded at P < 0.05, FDR corrected.
Functional Connectivity Within DMN
To quantify the functional connectivity between each pair of ROIs within the DMN, temporal correlation coefficients between each pair of regions were calculated using the Pearson correlation. The time series of each ROI was preprocessed as follows: first, averaged time series were extracted from each ROI. Each time series was further corrected for the effect of six head motion parameters by linear regression to reduce the influence of head motion [Fox et al., 2005, 2009; Murphy et al., 2009; Weissenbacher et al., 2009]. Second, the averaged signals from the subject‐specific CSF and WM masks were regressed according to the method reported in previous resting state fMRI studies [Bettus et al., 2009; Fair et al., 2008; Fox et al., 2005; Honey et al., 2009] to remove possible spurious fluctuations, of physiological origin, but unrelated to neuronal activity [Fox et al., 2009; Murphy et al., 2009; Weissenbacher et al., 2009]. Finally, the time series were band filtered (0.01–0.08 Hz) to reduce the effects of low‐frequency drift and high‐frequency noise [Fox et al., 2005]. The residuals signal after regression and filtering constituted the regional time series used for further analyses.
Structural Connectivity Within the DMN
Fiber tracking
Whole brain fiber tracking was performed in the DTI native space for each subject using interactive software Trackvis [Schmahmann et al., 2007], which used an interpolated streamline propagation algorithm [Chao et al., 2008]. Path tracing proceeded until either the FA was lower than 0.15, or the angle between the current and the previous path segment was higher than 35°. After whole fiber tracking, short fibers lower than 20 mm, and obvious false paths were discarded. The remaining tracts were highly congruent with the DTI tractography atlas [Catani and Thiebaut de Schotten, 2008; Wakana et al., 2004].
Fiber extraction
As eight ROIs were derived from the normalized MNI space, the inverse transformation of the spatial normalization were applied to acquire the ROIs in the native space of DTI [Gong et al., 2009; Greicius et al., 2009]. More specifically, the inverse transformation (T −1) was applied to the eight ROIs in the normalized MNI, resulting in the subject‐specific ROIs in the native space of DTI.
The ROIs were dilated 2–3 mm into the white matter to ensure that they were in contact with the fibers. Fiber bundles connecting each pair of ROIs were then extracted from the total collection of brain fibers. This was done by a three‐step procedure (Fig. S1) [van den Heuvel et al., 2008, 2009]. First, an initial ROI was selected, and the tracts that reached the first ROI were chosen from all fibers. A second ROI was then retrieved from the rest of the ROIs. Only those tracts that reached the second ROI were picked from the resulting tracts of the previous step. Finally, fibers that did not really connect the two ROIs were deleted by visual inspection. The remaining fiber tracks connecting each pair of ROIs were prepared for the subsequent analyses.
Path length and connection density
Path length and connection density are two basic measures characterizing two connective nodes. Previous research in macaques used connection strength or density as an estimate of the white matter volume [Klyachko and Stevens, 2003]. The white matter volume was found to be highly correlated with the anatomical strength of connections, as derived from track‐tracing experiments [Hagmann et al., 2007]. The weighted edge that captures connection density and the path length between two nodes was been defined as the combination of fiber tracks connecting them [Hagmann et al., 2008], as described in the following.
Two ROIs ROI(u) and ROI(v) were considered to be connected through an edge e(u,v), in case at least one fiber f was present between them [Hagmann et al., 2008]. If F e is the set of all fibers connecting the two ROIs, the length l(e) of e(u,v) can be calculated by averaging the lengths of all the fibers in F e [Hagmann et al., 2008], according to:
| (1) |
where |F e| denotes the number of all fibers in set of F e and l(f) is the length of fiber f along its trajectory [Hagmann et al., 2008].
In addition, the connection density (number of connections per unit surface) between the end‐nodes of the edge e(u,v), can be expressed as [Hagmann et al., 2008]:
| (2) |
where, S u and S v are two‐dimensional intersected surfaces between the individual's white matter, and ROI(u) and ROI(v), respectively. In the measure of w(e), a correction term l(f) in the denominator is needed to eliminate the length bias towards longer fibers introduced by the tractography algorithm. The sum S u + S v corrects for the slightly variable size of intersected surfaces [Hagmann et al., 2008]. In this regard, a “de facto fiber tracking algorithm” can be free of length bias [Zalesky and Fornito, 2009].
In our study, the two indices l(e) and w(e) were introduced into the connection assessment during the tractography analyses to determine whether there were any abnormalities in patients while compared to the controls. Some information about the fiber bundles connecting each pair of regions, including length of each fiber path, mean and maximum FA values on the same tract, and count of all the tracks between each pair of ROIs, was extracted using the TrackVis software.
Statistical Analysis
Statistical analysis of functional and structural connectivity for each pair of ROIs was performed, comparing the patient and control groups. Specifically, temporal correlation coefficient (r), path length l(e), connection density w(e), and mean and maximum FA values were investigated. A one‐way repeated‐measure analysis of variance (ANOVA) was used to assess the presence of significant difference (P < 0.05) across all the selected connections between the two groups. Furthermore, post hoc analysis on each connection was performed by a two sample t‐tests (P < 0.05, Bonferroni corrected).
Relationship Between Functional and Structural Connectivity
The relationship between functional and structural connectivity was detected using a regression analysis for pairwise ROIs within the DMN. Next, linear regression analysis between the functional and each of the anatomical indices (P < 0.05) was performed for each pair of ROIs and for each group separately. On the basis of regression analysis, the anatomical connectivity index which mostly reflected the functional connectivity index was selected.
RESULTS
Spatial Pattern of DMN in Each Group
The random‐effect analysis of the single‐subject IC maps revealed a typical spatial pattern of the DMN in both groups (P < 0.05, FDR corrected) (see Fig. 1). The DMN pattern in the controls showed functional connectivity among the PCC/PCUN, the mPFC, the bilateral IPL, mTLs, and ITG (Fig. 1A and Table I). The DMN pattern of the patients largely included the same brain areas, but with specific difference in the connectivity strength with respect to that of controls (Fig. 1B and Table SII). Particularly, the patient group showed decreased DMN connectivity in the mPFC, the bilateral mTLs, and the left ITG. In addition, an increased functional connectivity was detected in the PCC/PCUN (Fig. 1C and Table SIII).
Figure 1.

Group‐level analyses of the DMN. A: DMN in the controls (T > 2.49, P < 0.05, FDR corrected). B: DMN in the mTLE patients (T > 2.74, P < 0.05, FDR corrected). C: Contrast between the DMN in mTLE patients and controls (|T| > 1.69, P < 0.05, clustering extent threshold, 15 voxels).
Structural Connectivity Within DMN
Two examples of fiber tracts connecting the PCC/PCUN to the mPFC, and to the bilateral mTLs were shown in Figure 2. The cingulum tracts connecting the PCC/PCUN to mPFC were detected in all controls (more details are shown in Fig. S2 and Table SIV) and all patients (Fig. S3 and Table SV). The tracts connecting the PCC/PCUN to bilateral mTLs (both left and right mTLs ROIs) were detected in all participants in both groups. The left and right superior frontal‐occipital fasciculus connecting the left and right IPL to the mPFC, respectively, were detected in 4/4 (left/right) out of 20 mTLE patients and 6/4 (left/right) out of 20 controls. The tracts that connected the PCC/PCUN to the left and right ITG, respectively, were detected in 0/2 (left/right) of 20 mTLE patients and in 0/5 (left/right) of 20 controls (Fig. S4). Furthermore, other white matter fibers as for example the arcuate fasciculus and the corpus callosum were observed (Fig. S5).
Figure 2.
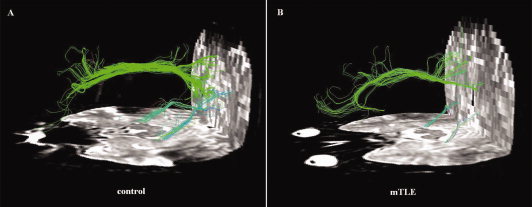
Example of DTI fiber tractography on one control and one patient. Only three fiber bunches located between the PCC/PCUN and mPFC, bilateral mTLs, were detected in both subjects. The color‐coding of the obtained fibers is based on the standard RGB code applied to the vector at every segment of each fiber. Red indicates the medio‐lateral plane. Green indicates the dorso‐ventral orientation. Blue indicates the rostro‐caudal direction.
Functional Connectivity Within DMN
According to the results from the structural connectivity analysis, we examined only three pairwise functional connectivities between the PCC/PCUN to the mPFC, to the left mTLs and to the right mTLs (see Fig. 3). The left and right superior frontal‐occipital fasciculus, connecting the left and right IPL, respectively, were only detected in a subset of both groups (Fig. S4). The same was found for the tracts connecting the PCC/PCUN to the left and right ITG (Fig. S4). Accordingly, other functional connections found in the present study (Fig. S6), such as the IPL to the mPFC and ITG [Buckner et al., 2008] were not considered in further analyses.
Figure 3.
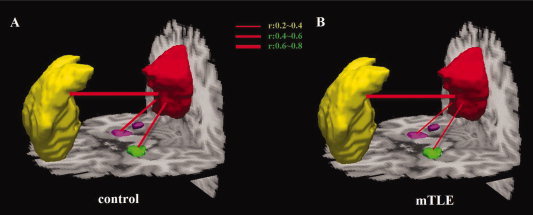
Functional connectivity within the DMN in patients and controls. Averaged temporal correlation coefficient r across all subjects in the control group (A) and in the mTLE group (B).
Differences Between Patients and Controls
Comparisons between mTLE patients and controls were performed on both structural and functional indices for the connections from the PCC/PCUN to the mPFC, left mTLs, and right mTLs. The ANOVA on mean connection density, mean temporal correlation coefficient, mean and maximum FA values on the same tract, showed significant differences between the two groups at P < 0.05. Conversely, no significant difference was revealed by ANOVA on mean path length. Connection density and temporal correlation coefficient between the PCC/PCUN and bilateral mTLs were significantly decreased (P < 0.05, Bonferroni corrected) in the mTLE group compared to the controls (Fig. 4B,C). Nonetheless, decreases in mTLE were found in both mean and maximum FA values on the same tracts, but with reduced significance with respect to connection density (Fig. 4D,E). No significant differences in temporal correlation and connection density between the PCC/PCUN and mPFC were found between groups. Furthermore, the path length showed no significant difference in all three pairwise connections.
Figure 4.

Comparison of functional and structural connectivity from PCC/PCUN to the mPFC, left mTLs, and right mTLs between mTLE patients and controls. The ANOVA on mean path length (A), mean connection density (B), mean temporal correlation coefficient (C), mean (D), and maximum (E) FA values on the tracts showed significant differences between the two groups at P = 0.051, P < 0.004, P < 0.001, P < 0.001, and P < 0.001, respectively. For each connection, differences at the significant level of P < 0.05 Bonferroni corrected and P < 0.01 Bonferroni corrected were marked with * and **, respectively.
Relationship Between Functional and Structural Connectivity
The regression analyses between functional and structural connectivity measures showed the presence of significant relationship (P < 0.05) between mean temporal correlation and connection density in both the patient and control groups (see Fig. 5). In this case, the statistical analysis revealed a significant positive correlation between the PCC/PCUN and bilateral mTLs, in both the patient and control groups. Conversely, no significant relationship with mean temporal correlation has been consistently found, for both connections and in both the patient and control groups, among mean path length, mean FA, and maximum FA (Fig. S7).
Figure 5.

The relation between functional connectivity (y axis) and structural connectivity (x axis) within DMN. The mTLE and controls groups were considered separately. A: Correlation coefficient r = 0.465 in patients and r = 0.536 in controls on the connected PCC/PCUN and the left mTLs. B: Correlation coefficient r = 0.547 in patients and r = 0.590 in controls on the connected PCC/PCUN and the right mTLs. In all these cases, correlations were significant at P < 0.05, uncorrected.
DISCUSSION
In the present study, we investigated functional (temporal correlation coefficients derived from fMRI) and structural (connection density derived from DTI tractography) connectivity of the DMN in mTLE.
Functional Connectivity Analysis at the Network Level
Independent component analysis, a data‐driven method, can extract the DMN and look for the functional connectivity with respect to the entire network [Greicius et al., 2004]. Our ICA results showed that several brain regions including the bilateral mPFC, mTLs, and the left ITG within the DMN had significantly decreased functional connectivity in mTLE patients (see Fig. 1C and Table SIII). These abnormalities of functional connectivity may reflect the cognitive impairments of the corresponding DMN regions [Zhang et al., 2010]. Importantly, the ICA approach used in the current study enabled us to extract brain regions in the DMN as ROIs without the need of prior anatomical hypotheses to test the functional and structural connectivity across those ROIs.
Structural Connectivity Decrease of the DMN in mTLE
The current study mainly focused on the important role of the cingulum and the tracts connecting the PCC/PCUN to bilateral mTLs interconnecting the brain regions of the DMN, which were found consistently across all subjects (Figs. S2 and S3). In addition, some other well‐known white matter fibers [Catani and Thiebaut de Schotten, 2008; Wakana et al., 2004], such as the arcuate fasciculus and the corpus callosum were also clearly showed in the data (Fig. S5).
The cingulum tract forms a direct neuroanatomical link between the PCC/PCUN and mPFC in the human brain [Catani and Thiebaut de Schotten, 2008; Lawes et al., 2008; Schmahmann et al., 2007; Wakana et al., 2004], as well as in the macaque brain [Parvizi et al., 2006]. Our results are further coherent with a number of resting state fMRI study [Greicius et al., 2009; van den Heuvel et al., 2008, 2009], which suggested a key role of the cingulum tract between the PCC/PCUN and mPFC of the DMN. When the mTLE patients were compared to the controls, no significant differences were found in the functional connectivity (r), connection density (w(e)), and path length (l(e)) between the PCC/PCUN and mPFC (see Fig. 4). However, significant decreases were found in both mean and maximum FA values on the PCC/PCUN to mPFC tract (Fig. 4D,E). It is widely believed that the major contribution to the direction‐dependent diffusion signal is attributable to axonal membranes hindering the diffusion process of water molecules [Beaulieu, 2002; van den Heuvel et al., 2008]. The decreased FA values of the PCC/PCUN and mPFC tracts may be explained by the less dense packing of axonal fibers in mTLE. It has been demonstrated by Kaiser and Hilgetag [Kaiser and Hilgetag, 2006] that a long‐distance connection may be important for complex neural systems, since they are not exclusively optimized for minimal global wiring length, but rather for a variety of factors including the minimization of processing steps. This may also explain partially the inconsistent results between connection density and FA value on the PCC/PCUN and mPFC tract. In this regard, the combination of FA and the quantitative property, such as connection density, would provide a better insight into mTLE.
The fiber tracts connecting the PCC/PCUN to the bilateral mTLs were also coherent with a recent resting state study combining fMRI and DTI on the DMN [Greicius et al., 2009]. Previous studies have demonstrated that the pre‐existing HS is a cause of the TLE, rather than a consequence of repeated seizures [Locharernkul, 2004]. This suggests that HS may be responsible for subsequent pathological changes and clinical manifestations in epilepsy patients. Generally, the pathological substrate of the impairments in mTLE is thought to be neuronal loss [Lencz et al., 1992] and the damage of microstructure [Keller et al., 2002]. These impairments are likely to result in decreased FA in the white matter. For example, Focke et al. found a widespread FA reduction in the ipsilateral temporal regions in mTLE patients with HS [Focke et al., 2008]. A recent DTI tractography study suggested an alteration of white matter pathways of the mTLs connections linking with the parahippocampal gyri in patients with unilateral TLE [Yogarajah et al., 2008]. Moreover, other studies have found a relationship between reduced FA and degeneration of pathways connecting to the hippocampus [Concha et al., 2005]. These findings indicate that the impairments in the hippocampal formation may ultimately induce degeneration of the fiber path from the mTLs to the PCC. However, the disadvantage of these studies was the lack of analysis in quantitative structural connectivity, such as the path length and connection density derived from DTI tractography. In the current work, reduced connection density found in mTLE patients indicated an abnormality in white matter involving the degeneration of structural connectivity. Interestingly, although connection density (Fig. 4B) on tracts between the PCC/PCUN and bilateral mTLs showed significant decreases, no significant difference was found in the path length (Fig. 4A). This result may suggest that reduced number of fibers per unit surface has an important impact on degeneration of the structural connection between the PCC/PCUN to mTLs in the DMN on mTLE patients. This finding is consistent with a recent DTI tractography study that described loss of axonal integrity in parts of the temporo‐limbic network [Concha et al., 2005]. Moreover, it is likely that the reduction of FA in degenerated tracts results from axonal membrane breakdown (i.e., fiber loss) [Beaulieu, 2002]. Structural connectivity abnormalities of the present study would postulate downstream degeneration from mTLs structures a potential neuro‐pathophysiological mechanism underlying disruptions in connectivity in mTLE patients.
Functional Connectivity Decrease of the DMN in mTLE
Functional connectivity is typically interpreted as the temporal synchronization of low‐frequency fluctuations arising from spontaneous neuronal activities in distant brain regions [Fox et al., 2005]. Importantly, functional connectivity between the PCC/PCUN and bilateral mTLs has been observed in healthy subjects [Fox et al., 2005; Vincent et al., 2006]. In the present study, this connectivity has been found significantly functional decrease in mTLE patients (Fig. 4C). The function of the DMN can be disturbed by pathological nervous system changes, and ictal discharges and IEDs can both induce functional connectivity abnormality within these brain regions [Laufs et al., 2007]. In a previous study involving an object‐location memory task, group comparisons within the DMN revealed reduced connectivity to the PCUN in ipsilesional middle temporal gyrus and hippocampus in left HS patients compared to controls [Frings et al., 2009]. In addition, in a resting state fMRI study, the intensity of functional connectivity in a local region of mTLs has been found to be associated with residual memory function in mTLE [Bettus et al., 2009]. The hippocampus/parahippocampal gyrus, comprised within the mTLs, is an important DMN node. In healthy humans, it is specifically involved in memory processes [Buckner et al., 2008; Raichle et al., 2001]. On the one hand, the hippocampus is the well‐known epileptogenic focus, and the most damaged structures in mTLE [Engel, 2001]. On the other hand, the PCC/PCUN, as a core hub showed strong correlation with each other brain regions in the DMN, putatively plays a pivotal role for the DMN [Buckner et al., 2008; Fransson and Marrelec, 2008; Hagmann et al., 2008]. Disrupted connections between the PCC/PCUN and mTLs may ultimately cause the abnormalities of the DMN.
Relationship Between Functional and Structural Connectivity
Neuronal activity is transmitted via neuronal fibers. White matter tracts are bundles of huge numbers of axons that connect large neuronal population over long distances [Catani and Thiebaut de Schotten, 2008; Schmahmann et al., 2007; Wakana et al., 2004]. Within the DMN, direct monosynaptic connections between the PCC and mTLs [Kobayashi and Amaral, 2003; Lavenex et al., 2002] have been demonstrated. This indicates that there is a flow of information between these two brain regions [Greicius et al., 2009] and the structural connectivity is the material substrate of functional connectivity [Honey et al., 2009; van den Heuvel et al., 2009]. In the present study, we found decreases in both functional and structural connectivity in patients compared with controls. Furthermore, high correlation between functional and structural connectivity was detected on two pairwised brain regions associated with the bilateral mTLs (see Fig. 5). We hypothesized that an impairment in structural connectivity might contribute to an impairment in functional connectivity. It is widely assumed that structural connectivity provides a neural substrate for functional connectivity [Johansen‐Berg and Rushworth, 2009; Rykhlevskaia et al., 2008]. Previous studies also suggested that resting state functional connectivity reflects the underlying structural connectivity architecture [Greicius et al., 2009; Honey et al., 2009; van den Heuvel et al., 2008, 2009]. It still remains unclear whether structural damage in patients directly induces abnormalities in functional connectivity. Further work, however, will be needed to explore this matter, which at present is speculative.
Study Limitations
The first limitation in our study is that ROI were selected on the DMN map from the controls. Nonetheless, possible differences between controls and patients in network topology should be considered. In this regard, our choice was due to the possibility that reduced connectivity in patients would potentially result in a worse estimation of the ROI locations. The selection of the seed nodes in the network, as well as the seed size, is still matter of debate in functional connectivity studies [Li et al., 2009; Ma et al., 2007]. It is important to consider that large ROIs could blur the results of functional connectivity analysis. In our study, we defined ROIs even comprising more than one brain area, just based on the ICA results, and without using anatomical information or prior seed coordinates from the literature [Fair et al., 2008]. Moreover, a limitation in the study could be that DTI analyses were restricted to the three pairs of connections which were found to exist in previous studies [Kobayashi and Amaral, 2003; Lavenex et al., 2002; Morris et al., 1999; Suzuki and Amaral, 1994]. As a matter of fact, few fibers were found connecting other pair of areas, even in the controls. Moreover, it was demonstrated that robust functional connectivity can be found between regions not linked by cortico‐cortical projections, and that functional networks continually reconfigure around the underlying anatomical skeleton [Honey et al., 2009]. We, therefore, infer that the structural connectivity may not exist in all pairs of regions among the DMN. Obviously, neural connectivity may still exist between some other pairs of regions, but more advanced fiber tracking techniques (i.e., probabilistic framework tractography) and instruments (i.e., higher field strengths) are required to further examine such connections. A further limitation is that, the current study did not include clinical variables to allow the examination of any correlation with the functional and structural connectivity. Such an investigation might potentially improve our understanding of the pathophysiological mechanisms of mTLE. Finally, as an explorative study of the correlation between the functional and structural connectivity in mTLE, we did not use multiple comparison correction.
CONCLUSIONS
In conclusion, the current study revealed abnormalities of both functional and structural connectivity in mTLE patients. We propose that structural abnormalities in the DMN are induced by HS, which causes a structural decline in the fiber tracts connecting the corresponding areas in mTLE. Moreover, we speculate that this structural change contributes to the functional defects exhibited by patients suffering from this condition.
Supporting information
Additional Supporting Information may be found in the online version of this article.
Supporting Information
Acknowledgements
The authors thank their patients and volunteers for participating in this study and also thank Martijn P. van den Heuvel, University Medical Center, Utrecht, for his assistance.
Contributor Information
Guangming Lu, Email: cjr.luguangming@vip.163.com.
Huafu Chen, Email: chenhf@uestc.edu.cn.
REFERENCES
- Bartels A, Zeki S ( 2005): Brain dynamics during natural viewing conditions—A new guide for mapping connectivity in vivo. Neuroimage 24: 339–349. [DOI] [PubMed] [Google Scholar]
- Beaulieu C ( 2002): The basis of anisotropic water diffusion in the nervous system—A technical review. NMR Biomed 15: 435–455. [DOI] [PubMed] [Google Scholar]
- Bettus G, Guedj E, Joyeux F, Confort‐Gouny S, Soulier E, Laguitton V, Cozzone PJ, Chauvel P, Ranjeva JP, Bartolomei F, Guye M ( 2009): Decreased basal fMRI functional connectivity in epileptogenic networks and contralateral compensatory mechanisms. Hum Brain Mapp 30: 1580–1591. [DOI] [PMC free article] [PubMed] [Google Scholar]
- Buckner RL, Andrews‐Hanna JR, Schacter DL ( 2008): The brain's default network: Anatomy, function, and relevance to disease. Ann N Y Acad Sci 1124: 1–38. [DOI] [PubMed] [Google Scholar]
- Calhoun VD, Adali T, Pearlson GD, Pekar JJ ( 2001): A method for making group inferences from functional MRI data using independent component analysis. Hum Brain Mapp 14: 140–151. [DOI] [PMC free article] [PubMed] [Google Scholar]
- Catani M, Howard RJ, Pajevic S, Jones DK ( 2002): Virtual in vivo interactive dissection of white matter fasciculi in the human brain. Neuroimage 17: 77–94. [DOI] [PubMed] [Google Scholar]
- Catani M, Thiebaut de Schotten M ( 2008): A diffusion tensor imaging tractography atlas for virtual in vivo dissections. Cortex 44: 1105–1132. [DOI] [PubMed] [Google Scholar]
- Chao YP, Chen JH, Cho KH, Yeh CH, Chou KH, Lin CP ( 2008): A multiple streamline approach to high angular resolution diffusion tractography. Med Eng Phys 30: 989–996. [DOI] [PubMed] [Google Scholar]
- Concha L, Beaulieu C, Gross DW ( 2005): Bilateral limbic diffusion abnormalities in unilateral temporal lobe epilepsy. Ann Neurol 57: 188–196. [DOI] [PubMed] [Google Scholar]
- Engel J Jr. ( 2001): Mesial temporal lobe epilepsy: What have we learned? Neuroscientist 7: 340–352. [DOI] [PubMed] [Google Scholar]
- Fair DA, Cohen AL, Dosenbach NU, Church JA, Miezin FM, Barch DM, Raichle ME, Petersen SE, Schlaggar BL ( 2008): The maturing architecture of the brain's default network. Proc Natl Acad Sci USA 105: 4028–4032. [DOI] [PMC free article] [PubMed] [Google Scholar]
- Focke NK, Yogarajah M, Bonelli SB, Bartlett PA, Symms MR, Duncan JS ( 2008): Voxel‐based diffusion tensor imaging in patients with mesial temporal lobe epilepsy and hippocampal sclerosis. Neuroimage 40: 728–737. [DOI] [PubMed] [Google Scholar]
- Fox MD, Snyder AZ, Vincent JL, Corbetta M, Van Essen DC, Raichle ME ( 2005): The human brain is intrinsically organized into dynamic, anticorrelated functional networks. Proc Natl Acad Sci USA 102: 9673–9678. [DOI] [PMC free article] [PubMed] [Google Scholar]
- Fox MD, Zhang D, Snyder AZ, Raichle ME ( 2009): The global signal and observed anticorrelated resting state brain networks. J Neurophysiol 101: 3270–3283. [DOI] [PMC free article] [PubMed] [Google Scholar]
- Fransson P, Marrelec G ( 2008): The precuneus/posterior cingulate cortex plays a pivotal role in the default mode network: Evidence from a partial correlation network analysis. Neuroimage 42: 1178–1184. [DOI] [PubMed] [Google Scholar]
- Frings L, Schulze‐Bonhage A, Spreer J, Wagner K ( 2009): Remote effects of hippocampal damage on default network connectivity in the human brain. J Neurol 256: 2021–2029. [DOI] [PubMed] [Google Scholar]
- Gong G, He Y, Concha L, Lebel C, Gross DW, Evans AC, Beaulieu C ( 2009): Mapping anatomical connectivity patterns of human cerebral cortex using in vivo diffusion tensor imaging tractography. Cereb Cortex 19: 524–536. [DOI] [PMC free article] [PubMed] [Google Scholar]
- Gotman J, Grova C, Bagshaw A, Kobayashi E, Aghakhani Y, Dubeau F ( 2005): Generalized epileptic discharges show thalamocortical activation and suspension of the default state of the brain. Proc Natl Acad Sci USA 102: 15236–15240. [DOI] [PMC free article] [PubMed] [Google Scholar]
- Greicius MD, Srivastava G, Reiss AL, Menon V ( 2004): Default‐mode network activity distinguishes Alzheimer's disease from healthy aging: Evidence from functional MRI. Proc Natl Acad Sci USA 101: 4637–4642. [DOI] [PMC free article] [PubMed] [Google Scholar]
- Greicius MD, Supekar K, Menon V, Dougherty RF ( 2009): Resting‐state functional connectivity reflects structural connectivity in the default mode network. Cereb Cortex 19: 72–78. [DOI] [PMC free article] [PubMed] [Google Scholar]
- Hagmann P, Kurant M, Gigandet X, Thiran P, Wedeen VJ, Meuli R, Thiran JP ( 2007): Mapping human whole‐brain structural networks with diffusion MRI. PLoS One 2: e597. [DOI] [PMC free article] [PubMed] [Google Scholar]
- Hagmann P, Cammoun L, Gigandet X, Meuli R, Honey CJ, Wedeen VJ, Sporns O ( 2008): Mapping the structural core of human cerebral cortex. PLoS Biol 6: e159. [DOI] [PMC free article] [PubMed] [Google Scholar]
- Honey CJ, Sporns O, Cammoun L, Gigandet X, Thiran JP, Meuli R, Hagmann P ( 2009): Predicting human resting‐state functional connectivity from structural connectivity. Proc Natl Acad Sci USA 106: 2035–2040. [DOI] [PMC free article] [PubMed] [Google Scholar]
- Johansen‐Berg H, Rushworth MF ( 2009): Using diffusion imaging to study human connectional anatomy. Annu Rev Neurosci 32: 75–94. [DOI] [PubMed] [Google Scholar]
- Kaiser M, Hilgetag CC ( 2006): Nonoptimal component placement, but short processing paths, due to long‐distance projections in neural systems. PLoS Comput Biol 2: e95. [DOI] [PMC free article] [PubMed] [Google Scholar]
- Keller SS, Mackay CE, Barrick TR, Wieshmann UC, Howard MA, Roberts N ( 2002): Voxel‐based morphometric comparison of hippocampal and extrahippocampal abnormalities in patients with left and right hippocampal atrophy. Neuroimage 16: 23–31. [DOI] [PubMed] [Google Scholar]
- Klyachko VA, Stevens CF ( 2003): Connectivity optimization and the positioning of cortical areas. Proc Natl Acad Sci USA 100: 7937–7941. [DOI] [PMC free article] [PubMed] [Google Scholar]
- Kobayashi Y, Amaral DG ( 2003): Macaque monkey retrosplenial cortex: II. Cortical afferents. J Comp Neurol 466: 48–79. [DOI] [PubMed] [Google Scholar]
- Laufs H, Hamandi K, Salek‐Haddadi A, Kleinschmidt AK, Duncan JS, Lemieux L ( 2007): Temporal lobe interictal epileptic discharges affect cerebral activity in "default mode" brain regions. Hum Brain Mapp 28: 1023–1032. [DOI] [PMC free article] [PubMed] [Google Scholar]
- Lavenex P, Suzuki WA, Amaral DG ( 2002): Perirhinal and parahippocampal cortices of the macaque monkey: Projections to the neocortex. J Comp Neurol 447: 394–420. [DOI] [PubMed] [Google Scholar]
- Lawes IN, Barrick TR, Murugam V, Spierings N, Evans DR, Song M, Clark CA ( 2008): Atlas‐based segmentation of white matter tracts of the human brain using diffusion tensor tractography and comparison with classical dissection. Neuroimage 39: 62–79. [DOI] [PubMed] [Google Scholar]
- Lencz T, McCarthy G, Bronen RA, Scott TM, Inserni JA, Sass KJ, Novelly RA, Kim JH, Spencer DD ( 1992): Quantitative magnetic resonance imaging in temporal lobe epilepsy: Relationship to neuropathology and neuropsychological function. Ann Neurol 31: 629–637. [DOI] [PubMed] [Google Scholar]
- Li K, Guo L, Nie J, Li G, Liu T ( 2009): Review of methods for functional brain connectivity detection using fMRI. Comput Med Imaging Graph 33: 131–139. [DOI] [PMC free article] [PubMed] [Google Scholar]
- Li YO, Adali T, Calhoun VD ( 2007): Estimating the number of independent components for functional magnetic resonance imaging data. Hum Brain Mapp 28: 1251–1266. [DOI] [PMC free article] [PubMed] [Google Scholar]
- Liao W, Zhang Z, Pan Z, Mantini D, Ding J, Duan X, Luo C, Lu G, Chen H ( 2010): Altered functional connectivity and small‐world in mesial temporal lobe epilepsy. PLoS One 5: e8525. [DOI] [PMC free article] [PubMed] [Google Scholar]
- Liu Y, Liang M, Zhou Y, He Y, Hao Y, Song M, Yu C, Liu H, Liu Z, Jiang T ( 2008): Disrupted small‐world networks in schizophrenia. Brain 131: 945–961. [DOI] [PubMed] [Google Scholar]
- Locharernkul C ( 2004): Temporal lobe epilepsy with hippocampal sclerosis—An insight into the disease entity. Neurology Asia 9 ( Suppl 1): 77–79. [Google Scholar]
- Ma L, Wang B, Chen X, Xiong J ( 2007): Detecting functional connectivity in the resting brain: A comparison between ICA and CCA. Magn Reson Imaging 25: 47–56. [DOI] [PubMed] [Google Scholar]
- Mantini D, Perrucci MG, Del Gratta C, Romani GL, Corbetta M ( 2007): Electrophysiological signatures of resting state networks in the human brain. Proc Natl Acad Sci USA 104: 13170–13175. [DOI] [PMC free article] [PubMed] [Google Scholar]
- Morris R, Petrides M, Pandya DN ( 1999): Architecture and connections of retrosplenial area 30 in the rhesus monkey (Macaca mulatta). Eur J Neurosci 11: 2506–2518. [DOI] [PubMed] [Google Scholar]
- Murphy K, Birn RM, Handwerker DA, Jones TB, Bandettini PA ( 2009): The impact of global signal regression on resting state correlations: Are anti‐correlated networks introduced? Neuroimage 44: 893–905. [DOI] [PMC free article] [PubMed] [Google Scholar]
- Parvizi J, Van Hoesen GW, Buckwalter J, Damasio A ( 2006): Neural connections of the posteromedial cortex in the macaque. Proc Natl Acad Sci USA 103: 1563–1568. [DOI] [PMC free article] [PubMed] [Google Scholar]
- Raichle ME, MacLeod AM, Snyder AZ, Powers WJ, Gusnard DA, Shulman GL ( 2001): A default mode of brain function. Proc Natl Acad Sci USA 98: 676–682. [DOI] [PMC free article] [PubMed] [Google Scholar]
- Rykhlevskaia E, Gratton G, Fabiani M ( 2008): Combining structural and functional neuroimaging data for studying brain connectivity: A review. Psychophysiology 45: 173–187. [DOI] [PubMed] [Google Scholar]
- Schmahmann JD, Pandya DN, Wang R, Dai G, D'Arceuil HE, de Crespigny AJ, Wedeen VJ ( 2007): Association fiber pathways of the brain: Parallel observations from diffusion spectrum imaging and autoradiography. Brain 130: 630–653. [DOI] [PubMed] [Google Scholar]
- Spencer SS ( 2002): Neural networks in human epilepsy: Evidence of and implications for treatment. Epilepsia 43: 219–227. [DOI] [PubMed] [Google Scholar]
- Suzuki WA, Amaral DG ( 1994): Perirhinal and parahippocampal cortices of the macaque monkey: Cortical afferents. J Comp Neurol 350: 497–533. [DOI] [PubMed] [Google Scholar]
- van de Ven V, Formisano E, Prvulovic D, Roeder CH, Linden DE ( 2004): Functional connectivity as revealed by spatial independent component analysis of fMRI measurements during rest. Hum Brain Mapp 22: 165–178. [DOI] [PMC free article] [PubMed] [Google Scholar]
- van de Ven V, Bledowski C, Prvulovic D, Goebel R, Formisano E, Di Salle F, Linden DE, Esposito F ( 2008): Visual target modulation of functional connectivity networks revealed by self‐organizing group ICA. Hum Brain Mapp 29: 1450–1461. [DOI] [PMC free article] [PubMed] [Google Scholar]
- van den Heuvel M, Mandl R, Luigjes J, Hulshoff Pol H ( 2008): Microstructural organization of the cingulum tract and the level of default mode functional connectivity. J Neurosci 28: 10844–10851. [DOI] [PMC free article] [PubMed] [Google Scholar]
- van den Heuvel MP, Mandl RC, Kahn RS, Hulshoff Pol HE ( 2009): Functionally linked resting‐state networks reflect the underlying structural connectivity architecture of the human brain. Hum Brain Mapp 30: 3127–3141. [DOI] [PMC free article] [PubMed] [Google Scholar]
- Vincent JL, Snyder AZ, Fox MD, Shannon BJ, Andrews JR, Raichle ME, Buckner RL ( 2006): Coherent spontaneous activity identifies a hippocampal‐parietal memory network. J Neurophysiol 96: 3517–3531. [DOI] [PubMed] [Google Scholar]
- Voets NL, Adcock JE, Stacey R, Hart Y, Carpenter K, Matthews PM, Beckmann CF ( 2009): Functional and structural changes in the memory network associated with left temporal lobe epilepsy. Hum Brain Mapp 30: 4070–4081. [DOI] [PMC free article] [PubMed] [Google Scholar]
- Waites AB, Briellmann RS, Saling MM, Abbott DF, Jackson GD ( 2006): Functional connectivity networks are disrupted in left temporal lobe epilepsy. Ann Neurol 59: 335–343. [DOI] [PubMed] [Google Scholar]
- Wakana S, Jiang H, Nagae‐Poetscher LM, van Zijl PC, Mori S ( 2004): Fiber tract‐based atlas of human white matter anatomy. Radiology 230: 77–87. [DOI] [PubMed] [Google Scholar]
- Weissenbacher A, Kasess C, Gerstl F, Lanzenberger R, Moser E, Windischberger C ( 2009): Correlations and anticorrelations in resting‐state functional connectivity MRI: A quantitative comparison of preprocessing strategies. Neuroimage 47: 1408–1416. [DOI] [PubMed] [Google Scholar]
- Wu J, Song Z, Chen J, Tian Q, Li S, Lu G, Zhang Z, Liu Y ( 1998a): Volumetric measurement of hippocampal formation using MRI in patients with epilepsy. Chin J Radiol 224–227. [Google Scholar]
- Wu J, Song Z, Chen J, Tian Q, Li S, Lu G, Zhang Z, Liu Y ( 1998b): Volumetric measurement of hippocampal formation using MRI in the normal Chinese adults. Chin J Radiol 32: 220–223. [Google Scholar]
- Yogarajah M, Powell HW, Parker GJ, Alexander DC, Thompson PJ, Symms MR, Boulby P, Wheeler‐Kingshott CA, Barker GJ, Koepp MJ, Duncan JS ( 2008): Tractography of the parahippocampal gyrus and material specific memory impairment in unilateral temporal lobe epilepsy. Neuroimage 40: 1755–1764. [DOI] [PMC free article] [PubMed] [Google Scholar]
- Zalesky A, Fornito A ( 2009): A DTI‐derived measure of cortico‐cortical connectivity. IEEE Trans Med Imaging 28: 1023–1036. [DOI] [PubMed] [Google Scholar]
- Zhang Z, Lu G, Zhong Y, Tan Q, Liao W, Chen Z, Shi J, Liu Y ( 2009a): Impaired perceptual networks in temporal lobe epilepsy revealed by resting fMRI. J Neurol 256: 1705–1713. [DOI] [PubMed] [Google Scholar]
- Zhang Z, Lu G, Zhong Y, Tan Q, Yang Z, Liao W, Chen Z, Shi J, Liu Y ( 2009b): Impaired attention network in temporal lobe epilepsy: A resting FMRI study. Neurosci Lett 458: 97–101. [DOI] [PubMed] [Google Scholar]
- Zhang Z, Lu G, Zhong Y, Tan Q, Liao W, Wang Z, Wang Z, LI K, Chen H, Liu Y ( 2010): Altered spontaneous neuronal activity of the default‐mode network in mesial temporal lobe epilepsy. Brain Res. Doi:10.1016/j.brainres.2010.1001.1042. [DOI] [PubMed] [Google Scholar]
Associated Data
This section collects any data citations, data availability statements, or supplementary materials included in this article.
Supplementary Materials
Additional Supporting Information may be found in the online version of this article.
Supporting Information