

Abstract
Investigation of the brain's white matter fiber tracts in social anxiety disorder (SAD) may provide insight into the underlying pathophysiology. Because models of pathological anxiety posit altered frontolimbic interactions, the uncinate fasciculus (UF) connecting (orbito‐) frontal and temporal areas including the amygdala is of particular interest. Microstructural alterations in parts of the UF have been reported previously, whereas examination of the UF as discrete fiber tract with regard to more large‐scale properties is still lacking. Diffusion tensor imaging was applied in 25 patients with generalized SAD and 25 healthy control subjects matched by age and gender. By means of fiber tractography, the UF was reconstructed for each participant. The inferior fronto‐occipital fasciculus (IFOF), originating from the frontal cortex similarly to the UF, was additionally included as control tract. Volume and fractional anisotropy (FA) were compared between the groups for both tracts. Volume of left and right UF was reduced in patients with SAD, reaching statistical significance for the left UF. Bilateral IFOF volume was not different between groups. A similar pattern was observed for FA. Reduced volume of the left UF in SAD fits well into pathophysiological models of anxiety, as it suggests deficient structural connectivity between higher‐level control areas in the orbitofrontal cortex and more basal limbic areas like the amygdala. The results point to a specific role of the left UF with regard to altered white matter volume in SAD. However, results should be replicated and functional correlates of altered UF volume be determined in future studies. Hum Brain Mapp, 2013. © 2011 Wiley Periodicals, Inc.
Keywords: social anxiety disorder, diffusion tensor imaging, quantitative fiber tractography, white matter connectivity, uncinate fasciculus, volume
INTRODUCTION
Social anxiety disorder (SAD) involves intense fear and avoidance of social situations, e.g. being in focus of attention of others, with about one of ten in the general population meeting criteria for SAD during life‐time [Kessler et al.,1994]. Hyperactive limbic and paralimbic areas like the amygdala and insula are central to the pathophysiology across a range of anxiety disorders including SAD, post‐traumatic stress disorder and specific phobia [Etkin and Wager,2007]. The amygdala has a pivotal role in salience processing with a particular relatedness to social cues [Adolphs,2003b] and is, therefore, of special importance regarding social anxiety [Cannistraro and Rauch,2003]. Beyond hyperactivity of basal affective systems, alterations in SAD have also been shown in frontal cortical activity relevant for cognitive control processes [Goldin et al.,2009], for example in the orbitofrontal cortex (OFC). Models of pathological anxiety posit impaired functional dialogue between basal affective and higher‐order control systems [Akirav and Maroun,2007; Bishop,2007; Cannistraro and Rauch,2003], which may underlie the observed functional alterations in limbic and frontal areas in SAD.
The specific features of white matter (WM) architecture in SAD, especially with regard to important fiber bundles, have not been studied extensively so far. However, a more detailed examination of these anatomical features could help understand the neural underpinnings of SAD. The uncinate fasciculus (UF) connects the OFC with limbic/paralimbic regions including amygdala and the anterior temporal lobe [Ebeling and von Cramon,1992; Petrides and Pandya,2007]. Hereby, the UF may provide the anatomical connection underlying the functional dialogue between higher‐order control and basal affective brain systems. Given also the particular relatedness of amygdala and OFC function to social processes [Adolphs,2003a] and, thus, social anxiety, the UF is a main fiber tract of interest for the investigation of SAD pathophysiology. Initial evidence points to local microstructural alterations in parts of the right UF in patients with SAD [Phan et al.,2009], underlining our focus on the UF in the present investigation. Examination of the UF as discrete fiber tract with regard to more large‐scale properties such as volume is still lacking in the literature.
There are different approaches to study the WM architecture in SAD. Previously [Baur et al., in press], we focused on fractional anisotropy (FA), a measure modulated by fiber directedness. Assessing FA, it is possible to estimate fiber disorganization and demyelination in SAD on a micro‐/mesoscopic level. Here, we used an alternative approach in the same subjects: Diffusion tensor imaging (DTI) quantitative fiber tractography allows for the reconstruction and quantification of whole fiber bundles within the individual brain's WM [Mori and van Zijl,2002]. Because the prominent, well‐known WM fiber tracts facilitate functional interactions between distant brain regions, they may also support integration of different modalities (e.g., sensory, cognitive, and emotional processes). For instance, the UF might facilitate cognitive‐emotional interactions by enabling communication between the OFC and the amygdala, that is, between higher‐level control and basal affective areas. Implications from UF tractography may therefore refer to a more large‐scale level regarding the pathophysiology of SAD. Here, we focused on large‐scale aspects of the UF and hypothesized reduced UF volume in SAD, corresponding to deficient frontolimbic interactions. To examine whether possible volume differences in the UF could be attributed to unspecific or global effects, we included the inferior fronto‐occipital fasciculus (IFOF) interconnecting frontal and occipital lobes as control tract for fiber tracking and statistical analysis. The UF and the IFOF share a common trajectory in the frontal lobe [Catani et al.,2002] (see also Fig. 1) and separate in more posterior regions to follow their own trajectories terminating in the temporal and occipital lobe, respectively. For the IFOF, we did not expect any group differences since there is no direct evidence that this tract is involved in the pathophysiology of SAD. In addition to volume, we assessed mean FA of each reconstructed tract. Analogously, we expected reduced FA of the UF, but not of the IFOF, in SAD.
Figure 1.
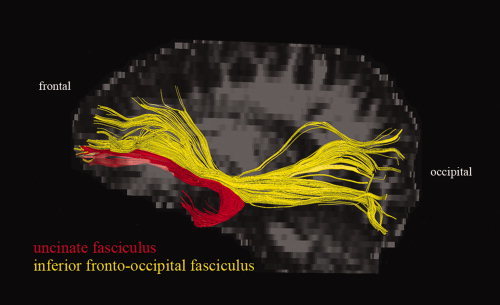
The uncinate fasciculus (red) and the inferior fronto‐occipital fasciculus (yellow): Example of their relative locations, shown for one subject, lateral view onto the left hemisphere. [Color figure can be viewed in the online issue, which is available at wileyonlinelibrary.com.]
MATERIALS AND METHODS
Subjects
For the study, 27 outpatients with current diagnosis of generalized SAD were recruited from the outpatient clinic at the Department of Psychiatry and Psychotherapy of the University Hospital Zurich, Switzerland. Due to severe artifacts in DTI images, two patients with SAD had to be excluded from further analyses. In addition to the remaining 25 patients, 25 healthy control subjects were recruited via direct address and email‐advertisement. Patient and control groups were matched by age and gender (see Table I). All subjects were consistently right‐handed according to the procedure provided by Annett [1970]. Diagnosis of generalized SAD and current and previous comorbid Axis‐I diagnoses were established in the patients group using the Mini‐International Neuropsychiatric Interview for DSM‐IV [Sheehan et al.,1998] (German version [Ackenheil et al.,1999]). SAD was the primary diagnosis in all patients, five fulfilled criteria for comorbidities (former depressive episode (remitted) in one patient, current depressive episode/major depressive disorder in three patients, alcohol dependency (remitted) in one patient). Nine patients were taking antidepressant medication due to reactive depressive symptoms (selective serotonin reuptake inhibitors in five patients, selective serotonin/norepinephrine reuptake inhibitors in two patients, mirtazapine in one patient, and clomipramine/zolpidem in another patient). Two of these patients were additionally taking lithium, one quetiapin. Dose of drugs had been stable for more than one month in all nine patients when participating in the study. Healthy control subjects were free of current or past psychiatric disorders and of medication (except for oral contraceptives in females), as determined in a semistructured clinical interview according to DSM‐IV. Neurological disorders, head trauma, pregnancy, excessive consummation of drugs (alcohol, nicotine, caffeine), and further contraindications against magnetic resonance imaging served as exclusion criteria for the study. For assessment of general anxiety, all participants completed the trait version of the Spielberger State‐Trait Anxiety Inventory (STAI [Spielberger et al.,1970], German version [Laux et al.,1981]). Social anxiety was assessed in patients with the self‐rating version of the Liebowitz Social Anxiety Scale (LSAS [Liebowitz,1987], German version [Stangier and Heidenreich,2005]). Degree of depression in patients with SAD was assessed with Beck's Depression Inventory (BDI; [Beck et al.,1961], German version [Hautzinger et al.,1994]). In addition, patients were asked to retrospectively state the onset of their symptoms. The majority of patients (88.9%) reported a positive family history of psychiatric disorders (mostly SAD and depression, information available in only 18 patients). After complete description of the study to the subjects, written informed consent was obtained. The study was approved by the local ethics committee.
Table I.
Demographic, psychometric, and clinical measures
| SAD | HC | t a | P | |||
|---|---|---|---|---|---|---|
| Mean | SD | Mean | SD | |||
| Age (yrs) | 31.6 | 10.4 | 32.3 | 10.1 | 0.24 | 0.82 |
| STAI | 50.2b | 11.1 | 33.2c | 7.4 | 6.38 | <0.001 |
| LSAS | 66.0 | 23.0 | ||||
| BDI | 15.2 | 11.0 | ||||
| Age of onset (yrs)d | 15.1 | 6.0 | ||||
| Duration of symptoms (yrs)d | 15.5 | 10.9 | ||||
| Sex | Male, 18 | Female, 7 | Male, 18 | Female, 7 | ||
SAD vs. HC, according to an independent t‐test.
Corresponds to increased values [Laux et al.,1981].
Corresponds to normal values [Laux et al.,1981].
Available in 20 patients. SAD: patients with social anxiety disorder, HC: healthy controls, SD: standard deviation, STAI: Spielberger State‐Trait Anxiety Inventory (trait version), LSAS: Liebowitz Social Anxiety Scale, BDI: Beck's Depression Inventory.
DTI Data Acquisition
DTI scans were acquired on a 3.0 T whole‐body scanner (GE Medical Systems, Milwaukee) equipped with a standard 8‐channel head coil. One diffusion‐weighted spin‐echo echo‐planar imaging (EPI) scan was obtained from all participants. Slices were acquired sequentially in transversal orientation (matrix 256 × 256 pixels, 39 slices, slice thickness 3.2 mm, field of view (FOV) = 240 × 240 mm2, in‐plane spatial resolution 0.94 × 0.94 mm2). Further imaging parameters were: echo time (TE) = 87.8 ms, repetition time (TR) = 12,000 ms. Diffusion sensitization was achieved with two balanced diffusion gradients centered on the 180° radio‐frequency pulse. Diffusion was measured in 21 noncollinear directions with a b‐value of b = 1,000 s/mm2. Five additional interleaved nondiffusion‐weighted volumes (b = 0 s/mm2) served as reference volumes. Scan time was about 6 min. In addition to DTI, T1‐, and T2‐weighted images were acquired to exclude possible T1‐/T2‐sensitive abnormalities.
Data Preprocessing and Fiber Tractography
Preprocessing was done with FMRIB Software Library (FSL) Version 4.1.6 [Smith et al.,2004] (available at: http://www.fmrib.ox.ac.uk/fsl) and comprised the following steps: (1) segregation of brain tissue from non‐brain tissue using the Brain Extraction Tool [Smith,2002]; (2) Eddy current and head movement correction using EDDYCORRECT from FMRIB's Diffusion Toolbox [Smith et al.,2004]; (3) rotation of the gradients according to the corrected parameters from step (2); (4) local fitting of diffusion tensors and construction of individual FA maps using DTIFIT from FMRIB's Diffusion Toolbox [Smith et al.,2004].
For fiber tracking, Diffusion Toolkit 0.5 and TrackVis 0.5.1 were used [Wang et al.,2007] (available at: http://www.trackvis.org). The preprocessed data from FSL were further processed with Diffusion Toolkit. For each subject, the diffusion tensors were estimated according to the corrected gradients. Deterministic fiber tracking was performed with the “brute‐force” approach [Huang et al.,2004], an automatic procedure commonly used to reconstruct fibers across the whole WM by tracking fibers from each voxel in the brain. The fiber assignment continuous tracking (FACT) algorithm [Mori et al.,1999] was used. Accordingly, fibers were reconstructed by TrackVis along the principal eigenvector of each voxel's diffusion tensor. Tracking termination criteria were angle > 45° and FA < 0.2 [Mori and van Zijl,2002] (individual FA map derived from FSL's DTIFIT was used as mask image in Diffusion Toolkit). Fiber tracking was performed successively in each subject's native space. Color‐coded FA maps derived from the principal eigenvector of the diffusion tensor in each voxel were used for region‐of‐interest (ROI) drawing in TrackVis. ROIs were drawn large‐sized to include the entirety of the tract of interest and avoid false‐negative fibers [Yasmin et al.,2009] (see also Fig. 2). All fiber tracts were obtained through a two‐ROI approach (seed ROI and target ROI) with logical AND concatenation [Catani et al.,2002; Wakana et al.,2007] of the two ROIs, such that only fibers that passed both ROIs were included in the reconstructed tract. Obviously spurious fibers were removed from the fiber tract by using an additional avoidance ROI (logical NOT operation) [Wakana et al.,2007]. For the UF, both the seed and the target ROI was placed in the same coronal slice where the anterior‐posterior fibers (coded in green) of the frontal and the temporal lobe were visible at the most posterior point (see Fig. 2A for illustration of the ROI placement and tractography examples for the UF, see also [Wakana et al.,2007]). For the IFOF, the seed ROI was placed in the occipital lobe according to Wakana et al. [2007]. The target ROI was placed at the densest portion of the fiber bundle projecting anteriorly (coded in green, anterior floor of the external capsule [Catani et al.,2002]), typically located in the coronal slice that dissects the middle of the corpus callosum body (see Fig. 2B for illustration of the ROI placement and tractography examples for the IFOF). Each tract was reconstructed in both hemispheres, and tracking was randomly performed either first in the left or in the right hemisphere in each subject. After tractography, each individual tract was visually inspected for plausibility with regard to its structure based on general anatomical knowledge and previously published tractography studies [Catani et al.,2002; Mori et al.,2002; Wakana et al.,2007]. For each tract, any voxel touched by a fiber was counted by TrackVis. As such, volume values were obtained by accumulating all voxels belonging to the respective tract.
Figure 2.

Tracking procedure and examples. A. Tracking of the uncinate fasciculus (UF): Placement of ROIs within one coronal slice (left) and localization of this slice in a lateral view (right) are shown. For illustration purposes, six examples of the left UF are shown in red. B. Tracking of the inferior fronto‐occipital fasciculus (IFOF): Placement of ROIs within two different coronal slices (left) and respective localization of these slices in a lateral view (right) are shown. For illustration purposes, three examples of the left IFOF are shown in yellow. [Color figure can be viewed in the online issue, which is available at wileyonlinelibrary.com.]
Tractography was performed by two investigators (VB and TE) blinded to group affiliation of the subjects. Both investigators did exactly the same steps (ROI placement etc.) of the tracking procedure as described above. Tracking results from the first investigator were used for statistical analysis. The second investigator reconstructed all tracts for 16 randomly chosen subjects (eight belonging to the patients group and eight to the control group). The values obtained for these tracts were used to determine inter‐rater reliability.
Statistical Analysis
For each subject and each reconstructed fiber tract (left UF, right UF, left IFOF, right IFOF), the following variables were extracted from TrackVis: volume (in ml), mean FA, mean fiber length (in mm), and fiber count (artificial unit for number of fibers). In addition, global (whole‐brain) values according to the “brute‐force” tracking approach delivered by TrackVis were obtained for each of these measures. Statistical analysis was done with IBM SPSS Statistics (Version 19, SPSS Inc, an IBM company, Armonk, NY).
Demographic and psychometric group differences were examined using independent two‐tailed t‐tests (P < 0.05). Inter‐rater reliability was assessed by calculating the intraclass correlation coefficient on absolute volume and absolute FA values for the tracts of 16 subjects measured by both raters. For examination of normal distribution, Kolmogorov‐Smirnov test was used.
Group differences of the UF and IFOF with regard to volume and FA were assessed with independent t‐tests contrasting the relative tract measures (tract volume divided by global WM volume; tract mean FA divided by global mean FA). Our focus was on UF volume, for which we had a directional hypothesis of reduced volume in patients with SAD compared with healthy subjects. Because we tested both left and right UF, cumulation of alpha error was controlled for by applying Bonferroni correction resulting in a corrected α = 0.025 for the left and right UF, respectively. Significance tests related to the IFOF were performed thereafter under the hypothesis not to see group differences. Thus, Bonferroni correction was applied solely for tests related to the UF. Analysis of FA was done accordingly. To assess possible medication‐related effects of volume and FA, post‐hoc, univariate analysis of covariance (ANCOVA) was used with status of medication as between‐subjects factor (n = 9 vs. n = 16) and with the respective global measure, trait anxiety (difference between SAD subgroups at P < 0.05), and age (difference between SAD subgroups at P = 0.11) as covariates of no interest. To assess possible comorbidity‐related effects of volume and FA, post‐hoc, ANCOVA comprised status of comorbidity as between‐subjects factor (n = 5 vs. n = 20) with respective global measures as covariates of no interest. Further post‐hoc analysis related to volume was done investigating relative mean fiber length and relative number of fibers (independent t‐tests and Pearson correlation). Dimensional associations of relative tract volume as well as relative tract mean FA with trait anxiety (STAI) and social anxiety (LSAS) were examined with Pearson's correlation. P‐values related to UF volume and FA were one‐tailed (corrected for multiple comparisons), whereas all other P‐values were two‐tailed (uncorrected). Additionally, effect sizes (Cohen's d) were determined.
RESULTS
General Measures, Inter‐Rater Reliability, and Normal Distribution
Demographic, psychometric and clinical measures are summarized in Table I. Intra‐class correlation coefficients were > 0.92 for absolute volume and > 0.95 for absolute mean FA, indicating excellent reproducibility for the main measures of interest for each reconstructed fiber tract. Kolmogorov‐Smirnov tests yielded normal distributions for each fiber tract, with regard to both relative volume (each P > 0.57) and relative FA (each P > 0.90).
Volume and Fractional Anisotropy Associated With Social Anxiety Disorder
Tractography was successful for all tracts and all subjects. Absolute volume and FA values for the reconstructed tracts and global WM are shown in Table II, separately for patients with SAD and for healthy subjects, including measures of the respective statistical comparisons.
Table II.
Tract‐specific and global measures of interest
| SAD | HC | t a | P | d b | |||||
|---|---|---|---|---|---|---|---|---|---|
| Mean | SD | Mean | SD | ||||||
| Volume (ml) | UF | Left | 4.51 | 2.39 | 5.77 | 2.03 | 2.03 | 0.024d | 0.61 |
| Right | 5.01 | 1.69 | 5.60 | 1.45 | 1.37 | 0.088d | 0.40 | ||
| p c | 0.25 | 0.51 | |||||||
| IFOF | Left | 8.54 | 2.27 | 9.49 | 3.63 | 0.91 | 0.37 | 0.29 | |
| Right | 8.41 | 2.37 | 8.75 | 2.23 | 0.22 | 0.82 | 0.06 | ||
| p c | 0.77 | 0.19 | |||||||
| Global WM | 730.2 | 81.7 | 739.7 | 65.0 | 0.46 | 0.65 | 0.13 | ||
| Mean FA | UF | Left | 0.445 | 0.027 | 0.464 | 0.023 | 1.68 | 0.0495d | 0.49 |
| Right | 0.452 | 0.025 | 0.455 | 0.023 | 0.81 | 0.21d | 0.23 | ||
| p c | 0.17 | <0.05 | |||||||
| IFOF | Left | 0.524 | 0.022 | 0.532 | 0.022 | 0.34 | 0.73 | 0.10 | |
| Right | 0.517 | 0.028 | 0.524 | 0.025 | 0.32 | 0.75 | 0.09 | ||
| p c | 0.07 | <0.05 | |||||||
| Global WM | 0.487 | 0.013 | 0.496 | 0.013 | 2.39 | 0.021 | 0.69 | ||
SAD vs. HC, according to an independent t‐test contrasting relative values for UF and IFOF (local tract value divided by global WM value).
Cohen's d (effect size).
Left vs. right, according to a paired t‐test.
One‐tailed, corresponding to a corrected α = 0.025 according to Bonferroni. UF: uncinate fasciculus, IFOF: inferior fronto‐occipital fasciculus, FA: fractional anisotropy, SAD: patients with social anxiety disorder, HC: healthy controls, WM: white matter.
As the main result, patients with SAD had a significantly lower relative volume of the left UF compared with healthy subjects (P Bonferroni = 0.024). Volume of the right UF was also reduced in SAD, however, without reaching a statistical significance or trend (P Bonferroni = 0.088). For the left and right IFOF and global WM, no significant differences were observed (see Table II, Fig. 3). There were no correlations of volume with psychometric and clinical measures (see Supporting Information, Table S1). Post‐hoc analysis related to left UF volume yielded no significant differences, for neither medication (F = 2.34, P = 0.14) nor comorbidity (F = 0.65, P = 0.80). Further post‐hoc examination related to left UF volume (summarized in Supporting Information, Table S2) yielded significantly reduced mean fiber length compared with healthy subjects, whereas fiber count was not significantly different between groups. However, variance in left UF volume was rather explained by fiber count (87%) as compared with fiber length (61%).
Figure 3.

Volume of the reconstructed fiber tracts in patients with social anxiety disorder and healthy subjects. Mean (bars) and standard deviation (error bars) of absolute volume values are shown for each tract and group; SAD: social anxiety disorder. bAccording to a t‐test contrasting relative volume values (ratio of tract volume and global WM volume). [Color figure can be viewed in the online issue, which is available at wileyonlinelibrary.com.]
Beyond examination of volume, patients with SAD had lower relative mean FA than healthy subjects of the left UF at a trend level (P Bonferroni = 0.0495), whereas for the other tracts, no significant differences or trends were observed (see Table II, Supporting Information, Fig. S3). Global mean FA was significantly reduced in patients with SAD. A correlation of relative FA with trait anxiety was observed for the left UF and right IFOF in SAD, but not in healthy subjects (see Supporting Information, Table S1 and Supporting Information, Fig. S4). There were no correlations with social anxiety. Post‐hoc analysis related to left UF FA yielded neither medication‐related (F = 1.82, P = 0.19) nor comorbidity‐related (F = 1.38, P = 0.25) effects.
DISCUSSION
We used quantitative fiber tractography to investigate differences of volume and FA between patients with SAD and healthy subjects in two fiber tracts originating in the frontal cortex. Our main finding was reduced volume of the left UF in SAD, which accords with our hypothesis. There were no statistically significant group differences for the right UF and bilaterally for the IFOF. WM fiber tracts in the brain provide the anatomical basis for direct functional interactions between distant brain regions, facilitating also integrative processes. The UF connects frontal cortices including OFC with anterior temporal areas and with the amygdala [Ebeling and von Cramon,1992; Petrides and Pandya,2007] and may therefore facilitate frontolimbic interactions. In anxiety disorders, activation of limbic/paralimbic areas as the amygdala and insula is increased [Cannistraro and Rauch,2003; Etkin and Wager,2007], and models of exaggerated anxiety additionally implicate deficient prefrontal control mechanisms in anxious subjects [Bishop,2007,2009; Freitas‐Ferrari et al.,2010]. Being faced with social situations, patients with SAD exhibit strong emotional responding, which may correspond to exaggerated activity of the amygdala and diminished prefrontal cognitive control. Cognitive‐emotional integration such as emotion regulation strategies may be crucial for dealing with stressors and tends to be disturbed in anxiety disorders like SAD [Salters‐Pedneault et al.,2006; Turk et al.,2005]. If control/evaluative systems (OFC) and salience/affective systems (amygdala, insula) lack exchange of information, limbic circuits will possibly develop “a life of its own” leading to exaggerated arousal states [Freitas‐Ferrari et al.,2010] which are frequent in SAD. Since the UF may be the main tract facilitating direct functional interactions between the OFC and the amygdala [Ebeling and von Cramon,1992; Petrides and Pandya,2007], which may involve top‐down inhibition [Ghashghaei and Barbas,2002], reduced volume of the left UF fits well into models of SAD pathophysiology. Reduced volume in the left UF suggests structural hypoconnectivity between grey matter areas in the frontal and anterior temporal lobe, which may yield implications for neuronal communication encompassed by these areas. For instance, functional connectivity between the OFC and the amygdala has been shown to be crucial for cognitive reappraisal of negative stimuli [Kanske et al.,2011] and capable of decreasing negative affect [Banks et al.,2007]. Both structures are implicated in evaluation of significance of stimuli, fear extinction, and decision making based on their functional dialogue [Dolan,2007]. Furthermore, they may underlie approach and avoidance behavior [Aupperle and Paulus,2010]. Recently, effective connectivity between the OFC and the amygdala has been shown to be increased in SAD bidirectionally [Liao et al.,2010]. In the light of our present results, this would point to compensatory mechanisms on a functional level due to a structural “deficit.” Evidence of compensatory mechanisms in SAD comes from another recent study assessing a relationship between reduced grey matter volume in temporal cortices and increased functional connectivity with these areas [Liao et al.,2011]. Besides hyperactivity of the amygdala [Cannistraro and Rauch,2003; Etkin and Wager,2007], under‐recruitment of the OFC associated with social anxiety has been shown in functional neuroimaging studies [Bruhl et al.,2011; Tillfors et al.,2001; Zhou et al.,2011]. The fact that we found no correlations with measures reflecting social anxiety challenges the notion whether reduced UF volume is of specific relevance for SAD. Rather, the present results might point to a pathophysiologic characteristic underlying abnormal anxiety or mood regulation in general. This is supported by studies that have identified WM alterations in the UF in mood disorders and schizophrenia [Kawashima et al.,2009; McIntosh et al.,2008], suggesting in turn a role of the UF in processes modulated by common risk factors of several psychiatric disorders, such as early‐life stress. Comparative studies across different psychiatric disorders would be necessary to address this issue.
On a morphometric level, we consider three possibilities that may explain the reported volume difference of the left UF between patients with SAD and healthy subjects. First, fiber loss and thus reduced fiber density may lead to reduced volume in SAD. This might also explain the finding of reduced FA within the left UF. Second, there are more large‐scale interconnected and/or a higher number of involved grey matter areas associated with the UF in healthy subjects, reflected by thinner and/or shorter UF tracts in SAD. Third, it is a mixture of both. Indeed, our post‐hoc analysis yielded reduced mean fiber length of the left UF in SAD and 87% explained variance of left UF volume by fiber count. This indicates that both the length and pure presence of fibers have contributed to the effect of reduced volume.
Analysis of FA yielded a similar pattern as for volume: patients with SAD had reduced mean FA of the left UF (statistical trend with moderate effect size), whereas for the other reconstructed tracts, there were no differences compared to healthy subjects. This points to micro‐/mesoscopic alterations in WM along or in distinct portions of the left UF, for example changes in fiber orientation and/or organization, and partially confirms a previous study in which reduced FA in SAD was identified in a part of the right UF [Phan et al.,2009]. Further findings of the present study were reduced global mean FA in SAD and a negative correlation of left UF FA and trait anxiety in patients with SAD, but not in healthy subjects. A detailed discussion of FA alterations in this sample of patients with SAD and a more detailed comparison with findings by Phan et al. can be found in our previous report [Baur et al., in press].
Reduced global mean FA in SAD is in contrast to global WM volume, for which we did not find group differences. Possibly, FA is reduced in a spatially more diffuse manner, whereas WM volume is reduced more specifically (e.g., in the left UF). It was not within the scope of the present study to assess associations between FA and volume for individual fiber tracts or globally for the brain's WM. Future studies have to address this question explicitly. Although our results indicate that WM alterations in SAD relate to volume in addition to FA, it may be of note that the reported volumes are related to the applied tractography preprocessing steps (see also [Wakana et al.,2007]). We used an FA threshold of 0.2 as recommended and used in other tractography studies as well [Mori and van Zijl,2002; Rodrigo et al.,2007; Wakana et al.,2007]. Thus, volume values refer to white matter in which FA is greater than 0.2. The two ROIs used for tractography of the UF were located in the same coronal slice slightly anterior to the temporal horn (see Fig. 2A). Hence, there may be more tolerance for variance in fiber length in the frontal part as compared with the temporal part of the UF. Since mean UF fiber length was reduced in SAD besides evidence of reduced FA in SAD in orbitofrontal/frontopolar WM according to previous reports [Baur et al., in press; Phan et al.,2009], we cannot completely rule out that the volume effect in the left UF is partially influenced by cases in the SAD group with some voxels in the left frontopolar area having FA smaller than 0.2 but still belonging to UF WM. This would, however, in turn suggest impaired integrity of fibers in the left UF, probably involving a lack of frontopolar links to more posterior and temporal parts (like the insula, amygdala, and temporal pole) in SAD (see Supporting Information, animated picture S5). Three issues support the present approach: First, setting the threshold more liberally (e.g., 0.1) would have resulted in including more spurious and false‐positive fibers and, thus, hampered the tractography process. Second, having identified globally reduced FA in SAD but not globally reduced volume suggests that reduced volume of the UF is not just a “covered” effect of reduced FA. Third, fiber count heavily contributed to the finding of reduced left UF volume.
It may be worth to point out that within our sample there were no downward statistical outliers for left UF volume in the SAD group. Although there was a high variation related to volume and shape in the reconstructed tracts, our UF volume mean and standard deviation values of the healthy subjects are in line with those reported by Hasan et al. [2009]. We included each tract as it was initially reconstructed after the tracking procedure (see methods), for the reason that this might reveal potential features of underlying SAD pathophysiology. However, our finding needs to be replicated. The choice of including the IFOF as control tract stems from the fact that, just like the UF, it originates in the frontopolar cortex. As in the frontal lobe the IFOFs trajectory runs at close quarters to the UF (see Fig. 1), inspection of IFOF trajectory served as a means to rule out possible biases related to data acquisition (e.g., frontal signal drop‐outs). With regard to contents, both tracts mediate intrahemispheric communication with frontal cortices, which stand for complex human processes like worrying and thus may be one source of anxiety disorders [Berkowitz et al.,2007].
Limitations
Nine of 25 patients in the present study sample were taking medication, which represents a certain limitation. We decided to include the medicated patients for three reasons. First, other DTI studies in anxiety disorders used a similar strategy [Ha et al.,2009; Phan et al.,2009], which makes the present study comparable to those studies. Second, long‐term effects of antidepressant medication on brain structure due to plasticity, however, may rather lead to adaptation towards healthy subjects' brain morphology [Castren,2005], not biasing the volume effect found in the present study. Third, medicated patients had significantly higher anxiety levels than those without medication. Since the volume effect of the left UF disappears when contrasting medication‐free patients (n = 16) versus healthy subjects, it is likely that inclusion of the medicated patients favored the detection of volume alterations in SAD that may be related to elevated anxiety. This reflects an area of conflict between the missing of real effects due to exclusion and the detection of biased effects due to inclusion of medicated patients. The latter seems unlikely according to the applied post‐hoc examination focusing on the left UF revealing neither statistical significance nor trends of possible medication‐related effects. However, the potential influence of medication on WM structure in general should be paid attention on by researchers in clinical neuroscience, even more unless there are studies that explicitly investigate dose‐dependent impact of antidepressants on WM. Because, to the best of our knowledge, this is the first tractography study in anxiety disorders, we believe that the present approach may be perceived as justified and be of importance for future studies applying this method to patients with anxiety disorders.
A methodological limitation relates to DTI data acquisition: Here, in‐plane resolution was high (< 1 mm2), whereas resolution along the z‐axis was relatively low (> 3 mm). Because isometric voxel sizes are generally recommended for DTI tractography studies, this prompts additional caution in interpreting the results of UF fiber tracking.
Implications of the present results for WM structure in SAD can only bear on, and thus are limited to, the actual reconstructed tracts, namely the UF and IFOF. Examination of further prominent fiber tracts with regard to volume would have been beyond the scope of our present study. Global WM volume not being significantly reduced in SAD (see Table II), however, is in favor of the view that volume reduction in SAD may indeed be specific to the left UF. Yet, further well‐known fiber tracts may be included in future tractography studies in SAD.
CONCLUSION
To the best of our knowledge, this is the first study reporting on fiber tract volume alterations in SAD. Quantitative fiber tractography may be a useful tool to investigate anatomical WM connectivity within well‐known fiber tracts in SAD. We were able to show smaller volume and FA values in patients with SAD for the left UF, but not for the right UF and the IFOF. This suggests particular importance of frontotemporal WM presence concerning the pathophysiology of SAD, possibly because of the facilitation of cognitive‐emotional interactions between the OFC and the amygdala through the UF. Three topics of significance beyond SAD may emerge from the present results and guide future studies: (1) identification of functional correlates of UF volume alterations, (2) characterization of the relationship between FA and WM volume, and (3) comparative investigation of the UF's role in/across different psychiatric disorders.
Supporting information
Additional Supporting Information may be found in the online version of this article.
Supporting Information
Baur Tractography Animated Figure
Acknowledgements
The authors thank Beat Werner, University Children's Hospital Zurich, for technical assistance with DTI data acquisition.
REFERENCES
- Ackenheil M, Stotz‐Ingenlath G, Dietz‐Bauer R, Vossen A ( 1999): M.I.N.I. Mini International Neuropsychiatric Interview, German Version 5.0.0 DSM‐IV. München: Psychiatrische Universitätsklinik München. [Google Scholar]
- Adolphs R ( 2003a): Cognitive neuroscience of human social behaviour. Nat Rev Neurosci 4: 165–178. [DOI] [PubMed] [Google Scholar]
- Adolphs R ( 2003b): Is the human amygdala specialized for processing social information? Ann NY Acad Sci 985: 326–340. [DOI] [PubMed] [Google Scholar]
- Akirav I, Maroun M ( 2007): The role of the medial prefrontal cortex‐amygdala circuit in stress effects on the extinction of fear. Neural Plast 2007: 30873. [DOI] [PMC free article] [PubMed] [Google Scholar]
- Annett M ( 1970): A classification of hand preference by association analysis. Br J Psychol 61: 303–321. [DOI] [PubMed] [Google Scholar]
- Aupperle RL, Paulus MP ( 2010): Neural systems underlying approach and avoidance in anxiety disorders. Dialogues Clin Neurosci 12: 517–531. [DOI] [PMC free article] [PubMed] [Google Scholar]
- Banks SJ, Eddy KT, Angstadt M, Nathan PJ, Phan KL ( 2007): Amygdala‐frontal connectivity during emotion regulation. Soc Cogn Affect Neurosci 2: 303–312. [DOI] [PMC free article] [PubMed] [Google Scholar]
- Baur V, Hänggi J, Rufer M, Delsignore A, Jäncke L, Herwig U, Brühl AB: White matter alterations in social anxiety disorder. J Psychiatr Res (in press). [DOI] [PubMed] [Google Scholar]
- Beck AT, Ward CH, Mendelson M, Mock J, Erbaugh J ( 1961): An inventory for measuring depression. Arch Gen Psychiatry 4: 561–571. [DOI] [PubMed] [Google Scholar]
- Berkowitz RL, Coplan JD, Reddy DP, Gorman JM ( 2007): The human dimension: How the prefrontal cortex modulates the subcortical fear response. Rev Neurosci 18: 191–207. [DOI] [PubMed] [Google Scholar]
- Bishop SJ ( 2007): Neurocognitive mechanisms of anxiety: An integrative account. Trends Cogn Sci 11: 307–316. [DOI] [PubMed] [Google Scholar]
- Bishop SJ ( 2009): Trait anxiety and impoverished prefrontal control of attention. Nat Neurosci 12: 92–98. [DOI] [PubMed] [Google Scholar]
- Bruhl AB, Rufer M, Delsignore A, Kaffenberger T, Jancke L, Herwig U ( 2011): Neural correlates of altered general emotion processing in social anxiety disorder. Brain Res 1378: 72–83. [DOI] [PubMed] [Google Scholar]
- Cannistraro PA, Rauch SL ( 2003): Neural circuitry of anxiety: Evidence from structural and functional neuroimaging studies. Psychopharmacol Bull 37: 8–25. [PubMed] [Google Scholar]
- Castren E ( 2005): Is mood chemistry? Nat Rev Neurosci 6: 241–246. [DOI] [PubMed] [Google Scholar]
- Catani M, Howard RJ, Pajevic S, Jones DK ( 2002): Virtual in vivo interactive dissection of white matter fasciculi in the human brain. Neuroimage 17: 77–94. [DOI] [PubMed] [Google Scholar]
- Dolan RJ ( 2007): The human amygdala and orbital prefrontal cortex in behavioural regulation. Philos Trans R Soc Lond B Biol Sci 362: 787–799. [DOI] [PMC free article] [PubMed] [Google Scholar]
- Ebeling U, von Cramon D ( 1992): Topography of the uncinate fascicle and adjacent temporal fiber tracts. Acta Neurochir (Wien) 115: 143–148. [DOI] [PubMed] [Google Scholar]
- Etkin A, Wager TD ( 2007): Functional neuroimaging of anxiety: A meta‐analysis of emotional processing in PTSD, social anxiety disorder, and specific phobia. Am J Psychiatry 164: 1476–1488. [DOI] [PMC free article] [PubMed] [Google Scholar]
- Freitas‐Ferrari MC, Hallak JE, Trzesniak C, Filho AS, Machado‐de‐Sousa JP, Chagas MH, Nardi AE, Crippa JA ( 2010): Neuroimaging in social anxiety disorder: A systematic review of the literature. Prog Neuropsychopharmacol Biol Psychiatry 34: 565–580. [DOI] [PubMed] [Google Scholar]
- Ghashghaei HT, Barbas H ( 2002): Pathways for emotion: Interactions of prefrontal and anterior temporal pathways in the amygdala of the rhesus monkey. Neuroscience 115: 1261–1279. [DOI] [PubMed] [Google Scholar]
- Goldin PR, Manber T, Hakimi S, Canli T, Gross JJ ( 2009): Neural bases of social anxiety disorder: Emotional reactivity and cognitive regulation during social and physical threat. Arch Gen Psychiatry 66: 170–180. [DOI] [PMC free article] [PubMed] [Google Scholar]
- Ha TH, Kang DH, Park JS, Jang JH, Jung WH, Choi JS, Park JY, Jung MH, Choi CH, Lee JM, Ha K, Kwon JS ( 2009): White matter alterations in male patients with obsessive‐compulsive disorder. Neuroreport 20: 735–739. [DOI] [PubMed] [Google Scholar]
- Hasan KM, Iftikhar A, Kamali A, Kramer LA, Ashtari M, Cirino PT, Papanicolaou AC, Fletcher JM, Ewing‐Cobbs L ( 2009): Development and aging of the healthy human brain uncinate fasciculus across the lifespan using diffusion tensor tractography. Brain Res 1276: 67–76. [DOI] [PMC free article] [PubMed] [Google Scholar]
- Hautzinger M, Bailer M, Worall H, Keller F. 1994. Beck‐Depressions‐Inventar (BDI). Bearbeitung der deutschen Ausgabe, Testhandbuch. Bern, Göttingen, Toronto, Seattle: Huber. [Google Scholar]
- Huang H, Zhang J, van Zijl PC, Mori S ( 2004): Analysis of noise effects on DTI‐based tractography using the brute‐force and multi‐ROI approach. Magn Reson Med 52: 559–565. [DOI] [PubMed] [Google Scholar]
- Kanske P, Heissler J, Schonfelder S, Bongers A, Wessa M ( 2011): How to regulate emotion? Neural networks for reappraisal and distraction. Cereb Cortex 21: 1379–1388. [DOI] [PubMed] [Google Scholar]
- Kawashima T, Nakamura M, Bouix S, Kubicki M, Salisbury DF, Westin CF, McCarley RW, Shenton ME ( 2009): Uncinate fasciculus abnormalities in recent onset schizophrenia and affective psychosis: A diffusion tensor imaging study. Schizophr Res 110: 119–126. [DOI] [PMC free article] [PubMed] [Google Scholar]
- Kessler RC, McGonagle KA, Zhao S, Nelson CB, Hughes M, Eshleman S, Wittchen HU, Kendler KS ( 1994): Lifetime and 12‐month prevalence of DSM‐III‐R psychiatric disorders in the United States. Results from the National Comorbidity Survey. Arch Gen Psychiatry 51: 8–19. [DOI] [PubMed] [Google Scholar]
- Laux L, Glanzmann P, Schaffner P, Spielberger CD. 1981. Das State‐Trait‐Angstinventar (Testmappe mit Handanweisung, Fragebogen STAI‐G Form X 1 und Fragebogen STAI‐G Form X 2). Weinheim: Beltz Testgesellschaft. [Google Scholar]
- Liao W, Qiu C, Gentili C, Walter M, Pan Z, Ding J, Zhang W, Gong Q, Chen H ( 2010): Altered effective connectivity network of the amygdala in social anxiety disorder: A resting‐state FMRI study. PLoS One 5: e15238. [DOI] [PMC free article] [PubMed] [Google Scholar]
- Liao W, Xu Q, Mantini D, Ding J, Machado‐de‐Sousa JP, Hallak JE, Trzesniak C, Qiu C, Zeng L, Zhang W, Crippa JA, Gong Q, Chen H ( 2011): Altered gray matter morphometry and resting‐state functional and structural connectivity in social anxiety disorder. Brain Res 1388: 167–177. [DOI] [PubMed] [Google Scholar]
- Liebowitz MR ( 1987): Social phobia. Mod Probl Pharmacopsychiatry 22: 141–173. [DOI] [PubMed] [Google Scholar]
- McIntosh AM, Munoz Maniega S, Lymer GK, McKirdy J, Hall J, Sussmann JE, Bastin ME, Clayden JD, Johnstone EC, Lawrie SM ( 2008): White matter tractography in bipolar disorder and schizophrenia. Biol Psychiatry 64: 1088–1092. [DOI] [PubMed] [Google Scholar]
- Mori S, Crain BJ, Chacko VP, van Zijl PC ( 1999): Three‐dimensional tracking of axonal projections in the brain by magnetic resonance imaging. Ann Neurol 45: 265–269. [DOI] [PubMed] [Google Scholar]
- Mori S, Kaufmann WE, Davatzikos C, Stieltjes B, Amodei L, Fredericksen K, Pearlson GD, Melhem ER, Solaiyappan M, Raymond GV, Moser HW, van Zijl PC ( 2002): Imaging cortical association tracts in the human brain using diffusion‐tensor‐based axonal tracking. Magn Reson Med 47: 215–223. [DOI] [PubMed] [Google Scholar]
- Mori S, van Zijl PC ( 2002): Fiber tracking: principles and strategies—A technical review. NMR Biomed 15: 468–480. [DOI] [PubMed] [Google Scholar]
- Petrides M, Pandya DN ( 2007): Efferent association pathways from the rostral prefrontal cortex in the macaque monkey. J Neurosci 27: 11573–11586. [DOI] [PMC free article] [PubMed] [Google Scholar]
- Phan KL, Orlichenko A, Boyd E, Angstadt M, Coccaro EF, Liberzon I, Arfanakis K ( 2009): Preliminary evidence of white matter abnormality in the uncinate fasciculus in generalized social anxiety disorder. Biol Psychiatry 66: 691–694. [DOI] [PMC free article] [PubMed] [Google Scholar]
- Rodrigo S, Oppenheim C, Chassoux F, Golestani N, Cointepas Y, Poupon C, Semah F, Mangin JF, Le Bihan D, Meder JF ( 2007): Uncinate fasciculus fiber tracking in mesial temporal lobe epilepsy. Initial findings. Eur Radiol 17: 1663–1668. [DOI] [PubMed] [Google Scholar]
- Salters‐Pedneault K, Roemer L, Tull MT, Rucker L, Mennin DS ( 2006): Evidence of broad deficits in emotion regulation associated with chronic worry and generalized anxiety disorder. Cogn Ther Res 30: 469–480. [Google Scholar]
- Sheehan DV, Lecrubier Y, Sheehan KH, Amorim P, Janavs J, Weiller E, Hergueta T, Baker R, Dunbar GC ( 1998): The Mini‐International Neuropsychiatric Interview (M.I.N.I.): The development and validation of a structured diagnostic psychiatric interview for DSM‐IV and ICD‐10. J Clin Psychiatry 59: 22–33. [PubMed] [Google Scholar]
- Smith SM ( 2002): Fast robust automated brain extraction. Hum Brain Mapp 17: 143–155. [DOI] [PMC free article] [PubMed] [Google Scholar]
- Smith SM, Jenkinson M, Woolrich MW, Beckmann CF, Behrens TE, Johansen‐Berg H, Bannister PR, De Luca M, Drobnjak I, Flitney DE, Niazy RK, Saunders J, Vickers J, Zhang Y, De Stefano N, Brady JM, Matthews PM ( 2004): Advances in functional and structural MR image analysis and implementation as FSL. Neuroimage 23( Suppl 1): S208–S219. [DOI] [PubMed] [Google Scholar]
- Spielberger CD, Gorsuch RL, Lushene RE. 1970. State‐Trait Anxiety Inventory, Manual for the State‐Trait Anxiety Inventory. Palo Alto, CA: Consulting Psychologist Press. [Google Scholar]
- Stangier U, Heidenreich T ( 2004): Liebowitz Soziale Angst‐Skala In: Collegium Internationale Psychiatriae Scalarum (CIPS) (eds.). Weinheim: Beltz. [Google Scholar]
- Tillfors M, Furmark T, Marteinsdottir I, Fischer H, Pissiota A, Langstrom B, Fredrikson M ( 2001): Cerebral blood flow in subjects with social phobia during stressful speaking tasks: A PET study. Am J Psychiatry 158: 1220–1226. [DOI] [PubMed] [Google Scholar]
- Turk CL, Heimberg RG, Luterek JA, Mennin DS, Fresco DM ( 2005): Emotion dysregulation in generalized anxiety disorder: A comparison with social anxiety disorder. Cogn Ther Res 29: 89–106. [Google Scholar]
- Wakana S, Caprihan A, Panzenboeck MM, Fallon JH, Perry M, Gollub RL, Hua K, Zhang J, Jiang H, Dubey P, Blitz A, van Zijl P, Mori S ( 2007): Reproducibility of quantitative tractography methods applied to cerebral white matter. Neuroimage 36: 630–644. [DOI] [PMC free article] [PubMed] [Google Scholar]
- Wang R, Benner T, Sorensen AG, Wedeen VJ ( 2007): Diffusion toolkit: A software package for diffusion imaging data processing and tractography. Proc Intl Soc Mag Reson Med 15: 3720. [Google Scholar]
- Yasmin H, Aoki S, Abe O, Nakata Y, Hayashi N, Masutani Y, Goto M, Ohtomo K ( 2009): Tract‐specific analysis of white matter pathways in healthy subjects: A pilot study using diffusion tensor MRI. Neuroradiology 51: 831–840. [DOI] [PubMed] [Google Scholar]
- Zhou W, Hou P, Zhou Y, Chen D ( 2011): Reduced recruitment of orbitofrontal cortex to human social chemosensory cues in social anxiety. Neuroimage 55: 1401–1406. [DOI] [PMC free article] [PubMed] [Google Scholar]
Associated Data
This section collects any data citations, data availability statements, or supplementary materials included in this article.
Supplementary Materials
Additional Supporting Information may be found in the online version of this article.
Supporting Information
Baur Tractography Animated Figure