

Abstract
Speech processing skills go through intensive development during mid‐childhood, providing basis also for literacy acquisition. The sequence of auditory cortical processing of speech has been characterized in adults, but very little is known about the neural representation of speech sound perception in the developing brain. We used whole‐head magnetoencephalography (MEG) to record neural responses to speech and nonspeech sounds in first‐graders (7‐8‐year‐old) and compared the activation sequence to that in adults. In children, the general location of neural activity in the superior temporal cortex was similar to that in adults, but in the time domain the sequence of activation was strikingly different. Cortical differentiation between sound types emerged in a prolonged response pattern at about 250 ms after sound onset, in both hemispheres, clearly later than the corresponding effect at about 100 ms in adults that was detected specifically in the left hemisphere. Better reading skills were linked with shorter‐lasting neural activation, speaking for interdependence of the maturing neural processes of auditory perception and developing linguistic skills. This study uniquely utilized the potential of MEG in comparing both spatial and temporal characteristics of neural activation between adults and children. Besides depicting the group‐typical features in cortical auditory processing, the results revealed marked interindividual variability in children. Hum Brain Mapp, 2011. © 2011 Wiley Periodicals, Inc.
Keywords: auditory cortex, auditory perception, development, language, magnetoencephalography
INTRODUCTION
The auditory system of the human brain is modified early in child development to optimally process incoming speech sounds of native language [Best and McRoberts, 2003; Cheour et al., 1998; Werker and Tees, 1984]. This results from more or less passive exposure to the acoustic features in spoken language during the first year of life. It is only later in childhood, at the age of 5–7 years, when more conscious insight into the structure and form of spoken language—phonological awareness—arises [Adams, 1990]. The ability to pay attention to subword level units of speech, such as phonemes, is also critical for successful reading acquisition and predicts reading skills later in life [Share, 1995; Sprenger‐Charolles et al., 2003]. The influence is bidirectional; learning to read is known to enhance development of phonological skills [Bertelson et al., 1985]. The period when children start to show phonological awareness and learn to read (typically by the age of 8 years in Finland) thus represents a particularly interesting phase in development for tracking neural representation of speech sound perception. The functional organization of the cortical auditory system, which supports the development of spoken and written language skills, is poorly understood in the child brain. In the present study, we investigated the cortical network involved in auditory speech perception, specifically in an immature nervous system. We further explored the behavioral significance of the developmentally specific neural processes by investigating the linkage between neural activation and behavioral linguistic skills in children.
The sequence of neural activation underlying speech perception in adults has been elucidated using time‐sensitive brain imaging methods (magnetoencephalography, MEG; electroencephalography, EEG). The time‐course of neural processing is evident in transient synchronous activations reflected as subsequent peaks in the averaged MEG or EEG response. The auditory evoked responses (AER's) are widely used to investigate the functional properties of (subcortical and) cortical auditory pathways involved in speech processing. The activated brain areas, i.e., the underlying neural currents, can be localized using source modeling techniques. Due to the combination of excellent temporal resolution and good localization accuracy, MEG has turned out to be a particularly powerful tool for characterizing complex activation sequences in the brain. Auditory signals, including speech, evoke a typical sequence of responses in the brain: activation at ∼30 ms and ∼50 ms [Mäkelä et al., 1994], most likely originating from the primary areas, followed by strong activation at ∼100 ms arising mainly in the area of the planum temporale [Liegeois‐Chauvel et al., 1991; Lütkenhöner and Steinsträter, 1998]. The special acoustic nature of speech is reflected in activation within the posterior superior temporal cortex [Benson et al., 2006; Vouloumanos et al., 2001] at around 100 ms [Eulitz et al., 1995; Tiitinen et al., 1999], especially in the left hemisphere [Parviainen et al., 2005]. Phonological categories seem to be available by 150–200 ms [Phillips et al., 2000; Vihla et al., 2000], after which the activation reflects higher‐level linguistic processing [Connolly and Phillips, 1994; Helenius et al., 2002].
The functional development of the auditory system has been studied mainly using EEG. The timing of auditory neural activation shows substantial changes during development [Wunderlich et al., 2006]. The most prominent response throughout childhood is a sustained activation at ∼250 ms (N2, N250), which attenuates with age. The more transient and earlier responses appear gradually. By early school years a response reminiscent of the adult 50‐ms response has been identified using EEG [Albrecht et al., 2000; Sharma et al., 1997], but with clearly longer latencies (P1, P100). An EEG response resembling the 100‐ms activation in adults (N1, N100) can be detected from about 10 years onwards [Ceponiene et al., 2002; Cunningham et al., 2000; Kraus et al., 1993] with longer latencies than in adults and with substantial variability between different studies using variable stimuli. With maturation, the N1 response increases in strength and decreases in latency toward adult values [Cunningham et al., 2000; Takeshita et al., 2002].
The age‐related changes in timing of activation reflect maturation of the underlying auditory pathways. To draw conclusions on the differences in timing of electrophysiological responses between age groups, it would be important to take into account also the spatial characteristics of the underlying neural generators. It is difficult to identify components of auditory responses that correspond to each other across different age groups, especially based on earlier EEG studies where it has not been possible to decompose the evoked potentials to the underlying neural sources and their time‐behavior. Over the past few years, the usability of MEG has been demonstrated in the study of normal [Fujioka et al., 2006; Kotecha et al., 2009] and abnormal [Oram Cardy et al., 2008; Paul et al., 2006; Wehner et al., 2007] auditory development. The scope of these experiments did not include the description of auditory activation at the source level or comparison between the sequences of activation in mature and immature brain. Thus, although it is clear that the timing of activation in children deviates from the pattern described in adults, the functional correspondence between the most prominent response components in the auditory evoked response, namely, the adult 100‐ms response and the immature 250‐ms response, has remained unsettled. Moreover, the behavioral relevance of the different timing in the two age groups is not known.
The aim of the present experiment was to characterize the sequence of auditory cortical activation in 7‐ to 8‐year‐old children using MEG, which facilitates analysis at the level of neural generators in individual subjects. First, we applied speech and complex and simple nonspeech stimuli, which had been previously used in adults, to compare auditory cortical processes between children and adults. By using the same, controlled variation in the stimulus features as for adults, we were able to identify, in children, timing and location of a neural response that showed differentiation between the sound types, functionally comparably with the sound‐type sensitive 100‐ms response in adults. Second, we tested whether strength and timing of this activation correlated with behavioral measures of the children's phonological and reading skills to clarify the possible link between neural processes and language skills. Interestingly, the timing of auditory cortical activation covaried with individual reading skills in children.
MATERIALS AND METHODS
Subjects
The subjects were ten girls and nine boys (7.2–8.0 years) attending the first grade of the elementary school. All subjects were native, right‐handed Finnish speakers (not tested for language dominance) with no history of neurological abnormalities. An informed consent was obtained from all subjects (and their parents), in agreement with the prior approval of the Helsinki and Uusimaa Ethics Committee. The children were initially screened in the classroom using the comprehension of statements test (TL3: A‐ and B‐versions) of standardized Elementary School Reading Test battery (ALLU) [Lindeman, 1998] that has been constructed to evaluate the reading status of 7‐ to 13‐year‐old Finnish‐speaking children. This test consists of three practice and 52 test trials, each composed of one statement (sentence). The child was asked to read the sentences and decide whether they were true or not (e.g., Adults eat books) with time‐limit of 5 min. The number of correct answers was measured. Only children with normal language development were included in the study.
The MEG data on children were compared with data collected from ten adult subjects, five females and five males (23–39 years) in our previous study on speech vs. nonspeech sound perception in adults [Parviainen et al., 2005].
Behavioral Tests
Each child was tested behaviorally for a set of linguistic and nonlinguistic abilities, including reading skills, phonological skills, rapid naming, auditory short‐term memory, and linguistic and nonlinguistic reasoning. Tests were administered 7–10 months after the school entrance. Detailed results of the behavioral tests are presented in Parviainen et al. [ 2006].
The reading skills were evaluated using four tests. Three of the tests were taken from the Elementary School Reading Test battery [Lindeman, 1998]. The word recognition test (TL2: A‐version) and the sentence comprehension test (TL4: A‐version) consist of 4/3 (TL2/TL4) practice trials and 80/20 testing trials. Each trial is composed of a picture that matches one of four written words/sentences. The task is to identify as many correct picture–word/sentence pairs as possible in 5/2 min. The total score is the number of correct out of 80/20 trials. The comprehension of statements test was used for initial screening as described above. In the story reading task, the child was given a narrative 55‐word story printed on paper and asked to read it aloud in the way s/he usually does in a reading situation [Kajamies et al., 2003]. The experimenter recorded the time the child spent on the story and the number of incorrectly read words. The overall reading level of the subjects was within or above the age‐normal range. Nevertheless, the speed of reading a passage of narrative text aloud varied substantially between individuals, from 0.5 to 6.6 sec/word.
The test of phonological awareness consisted of four subtests, each having ten items [Poskiparta et al., 1994] (for psychometric properties, see Silvén et al., 2004]. In syllable deletion, the examiner said aloud a word and asked the child to pronounce the word without a given syllable, the remaining part also forming a word. The deleted syllables were at the end, at the beginning, or in the middle of the original word. In phoneme blending, 2‐ to 4‐letter words were presented phoneme‐by‐phoneme and the child was asked to say aloud the resulting word. In single phoneme isolation, the child was asked to say aloud the first phoneme/letter of the word. In phoneme deletion, the child was asked to delete the initial phoneme and to say aloud the remaining part, which formed a word. In the single phoneme isolation test, all children identified all initial phonemes correctly (10/10) and, therefore, this measure was not included in the further analysis. A measure of phonological awareness was obtained as an average across syllable deletion, phoneme blending, and phoneme deletion, and the subjects' performance varied from 7 to 10, 6 to 10, and 5 to 10 respectively.
Rapid naming tests were used to measure the efficiency of phonological information retrieval from the long‐term store. We used two tasks of the Finnish version of the rapid serial naming test [Ahonen et al., 1999], which is based on the Rapid Automatized Naming test by Denckla and Rudel [Denckla and Rudel, 1976]. In the rapid naming of colors/letters, the child named as fast and correctly as possible a series of colored squares/letters, 50 items of each. The speed of naming was measured as the time in seconds to complete each task, and the speed variables were computed (total task duration/50). Naming speed of colors varied from 0.8 to 1.8 sec/item and that of letters from 0.5 to 1.0 sec/item. The results of both tests fell within normal limits.
Phonological memory/auditory short‐term memory was tested using digit span task, and general linguistic and nonlinguistic abilities using similarities and block design subtests of the Wechsler Intelligence Scale for Children, Revised [Wechsler, 1974]. All children had normal (or better) general cognitive skills (based on the average over the three subtests of WISC‐R).
Stimuli
The stimuli were synthetic speech sounds, complex nonspeech sounds, and simple sine‐wave tones (Fig. 1), all of them 150 ms in duration. They were designed to be acoustically well controlled and perceptually nonambiguous both to adults and children. The speech sounds were a Finnish vowel/a/ and a consonant–vowel syllable/pa/, created using a Klatt synthesizer [Klatt, 1979] for Macintosh (Sensimetrics, Cambridge, MA, USA). The fundamental frequency (F0) decreased steadily from 118 Hz to 90 Hz, resembling a normal male voice. For vowel/a/the formant frequencies F1, F2, and F3 were 700 Hz, 1130 Hz, and 2,500 Hz and formant bandwidths were 90 Hz for F1, 100 Hz for F2 and 60 Hz for F3. The CV syllable/pa/started with a 35‐ms period of frequency transition, where the F1, F2 and F3 frequencies changed linearly from 503 to 700 Hz, from 858 to 1130 Hz, and from 2,029 to 2,500 Hz, respectively. The initial transition was followed by a 115‐ms steady‐state period, where the formant frequencies were identical to the vowel/a/. These values were based on studies of Finnish speech sounds and formant structure [Iivonen and Laukkanen, 1993; Wiik, 1965] and on subjective evaluation of vowel and consonant quality and intelligibility. The vowel envelope had 15‐ms fade‐in and fade‐out periods. The envelope of the CV/pa/was otherwise similar, but the voicing started at 5 ms and the fade‐in period was more rapid. To obtain a natural sounding stop consonant, the CV stimuli began with a 4‐ms burst of frication. Aspiration was added from 1 ms onwards, decreasing smoothly over the 150‐ms duration of the stimuli.
Figure 1.
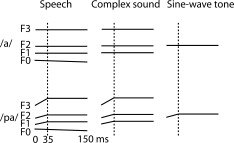
Schematic illustration of the stimuli. Frequency composition as a function of time for /a/ and /pa/ speech stimuli and their nonspeech equivalents (complex sound, sine‐wave tone). The horizontal lines represent the different frequency components (formants, F) and the vertical dashed lines the end of the transition period at 35 ms in the consonant–vowel type of stimuli.
The nonspeech stimuli were created in Sound Edit (MacroMedia, San Francisco, CA, USA). They were simple sine‐wave tones and complex sounds combined from three sine‐wave tone components of exactly the same frequency as the formants of each of the speech sounds. The sine‐wave tones were composed of the F2 frequency of each speech sound. The envelopes of the nonspeech sounds were similar to the speech sounds, including 15‐ms fade‐in and fade‐out periods and a slope fade‐in for the nonspeech equivalents of the CV/pa/stimulus. Although the simuli were acoustically carefully matched, none of the subjects reported the nonspeech sounds as speech sounds when they were asked to describe the stimuli prior to the MEG experiment.
The amplitudes of the different sounds were adjusted with elongated versions of the original sounds so that at the end of the sound delivery system, measured with an artificial ear and a spectrum analyzer calibrated to the ear sensitivity, the sound amplitudes differed by less than 2 dB (SPL).
MEG Recordings
Stimuli were controlled with the Presentation program (Neurobehavioral Systems Inc., San Fransisco, CA) running on a PC. The stimuli were delivered to the subject through plastic tubes and earpieces at 65 dB (SPL) above hearing level. All the stimuli (two speech sounds, two complex sounds, and two sine‐wave tones) were presented in a random order, separated by an interstimulus interval of 2 s, within a single session (about 20 min in total). Stimuli were presented monaurally to the right ear, similar to the earlier experiment on adults [Parviainen et al., 2005].
MEG signals were recorded using a helmet‐shaped 306‐channel whole‐head system (Vectorview™, Elekta Neuromag Oy, Helsinki, Finland) with two orthogonally oriented planar gradiometers and one magnetometer in 102 locations. Planar gradiometers detect the maximum signal directly above an active brain area. Horizontal and vertical eye movements were monitored (electro‐oculogram, EOG) as well. During the measurement, subjects watched silent cartoons and did not pay attention to the stimuli. The MEG signals were bandpass filtered at 0.03–200 Hz, sampled at 600 Hz, and averaged off‐line from −0.2 to 1 s relative to the onset of each stimulus. Epochs contaminated by blinks or saccades, as revealed by the EOG signal, were excluded from the average. In children, the heart is located fairly close to the measurement helmet, resulting in potential artifact signals from the heartbeat. To minimize the effects of such disturbances, the MEG signals were additionally off‐line averaged with respect to the heart signal that was clearly detectable in the raw MEG signal along the rim of the helmet. Principal component analysis (PCA) was performed on this average, and the magnetic field component produced by the heartbeat was removed from the data [Uusitalo and Ilmoniemi, 1997]. In addition, the data was manually inspected to exclude epochs contaminated by major artifacts. On average 60 artifact‐free epochs per subject were gathered for each of the six categories.
To localize the activated brain areas, the position of the subject's head within the MEG helmet was defined with the help of four head position indicator coils. The locations of these coils, attached to the subject's head, were determined with respect to three anatomical landmarks (nasion, preauricular reference points) and the measurement helmet. In the off‐line analysis of the data, a spherical approximation was used to describe the conductivity profile of the brain. As structural MR images were not available for the healthy children in the present study, we used an average sphere model of all children (6–11 years) who have been previously studied in our laboratory for medical diagnosis/treatment.
Data Analysis
Before further analysis, the MEG signals were low‐pass filtered at 40 Hz. To obtain an initial overview of the data, areal mean signals were calculated over ten areas of interest: left and right frontal, temporal, and occipitotemporal areas, and four regions along the brain midline, ranging from the frontal through parietal to the occipital area. We first computed vector sums of each gradiometer pair by squaring the MEG signals, summing them together, and calculating the square root of this sum. The areal mean signals were computed by averaging these vector sums for each area of interest, individually for each subject. Finally, the areal mean signals were averaged across subjects. Because of the way the sensor‐level areal mean signals are calculated (square root of sum of squared signals), they always have a positive value (>0).
The signals detected with MEG are generated by synchronous activation in the apical dendrites of pyramidal cells [Hämäläinen et al., 1993]. The activated brain areas were modeled using equivalent current dipoles (ECD) [Hämäläinen et al., 1993] that represent the mean location of an active cortical patch and the activation strength and direction of current flow in that area. The accuracy of source location is best perpendicular to the current flow and somewhat worse along the current flow [Hämäläinen et al., 1993]. The direction of current flow can be very accurately determined from the MEG data. As the electric current is oriented perpendicular to the course of the sulcus, it provides a highly sensitive measure of sulcal structure.
The magnetic field patterns were visually inspected to identify local dipolar fields, and sensors covering each of these patterns were chosen to calculate isolated ECDs, separately for each subject. A single set of dipoles accounted for the activation patterns in all six stimulus conditions. For this common set of ECDs, from among the dipoles identified in the analysis of the different stimulus categories, we selected the ones with the best fit to the data in all conditions. The locations and orientations of the ECDs were kept fixed, whereas their amplitudes were allowed to vary to best explain the signals recorded by all sensors over the entire averaging interval. This common multidipole model accounted for the MEG signals in each stimulus condition equally well as the dipole models, which had been determined separately for each stimulus condition (goodness‐of‐fit varied from 83% to 94%). The use of the common set of ECDs for all conditions in each individual subject made it possible to directly compare the time behavior of activation in these cortical areas (source waveforms) across all stimulus types.
Statistical Analysis
For the transient responses, we estimated the strength and timing of activation by measuring the maximum amplitude and the time point at which the waveform reached this peak value (peak amplitude, peak latency). For the more sustained activation, we additionally determined the time points at which the waveform reached half of the maximum amplitude in the ascending and descending slopes, and measured the mean amplitude and duration between these time points. We used a repeated‐measures mixed‐model ANOVA with sound type (speech sound, complex sound, and sine‐wave tone) and sound category (steady‐state sound and transition sound) as within‐subject factors and gender (male and female) as between‐subjects factor to evaluate systematic effects in strength and timing of cortical activation to the different stimulus types in children. The different response types, each characterized by specific timing and source location and orientation of current flow (see Results), were tested in separate ANOVAs. When functionally similar sources were found in both hemispheres, we included a within‐subject factor hemisphere (left, right) in the analysis. For testing the differences in the activation strength and timing between children and adults, we included a between‐subjects factor age group in the analysis. For correlation between cortical measures and behavioral performance, we computed Spearman's rank correlation, as most of the behavioral measures did not follow the normal distribution. Due to a fairly large number of variables included in the correlation analysis, the possibility of false positives (type I error) was reduced by decreasing the α level from 0.05 to 0.01. Furthermore, we required that the correlation coefficient of significant correlation exceeded 0.50 and that the related nonsignificant correlations (with behavioral measures reflecting the same underlying skill) paralleled the significant finding.
RESULTS
Overall Sequence of Activation
Figure 2 displays the areal mean signals averaged over all children. The strongest signals were detected over the left and right temporal regions. The enlarged views of these signals (A, B) show successive maxima at ∼100 ms, ∼250 ms, and ∼400 ms after stimulus onset (arrows). Clear effects of sound type were evident after 250 ms over both hemispheres.
Figure 2.
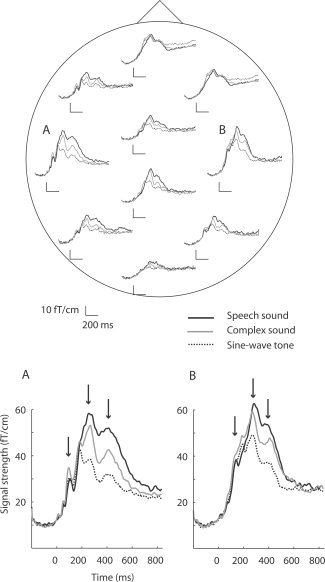
Areal mean signals averaged over all subjects. The responses to speech sounds, complex sounds, and sine‐wave tones are plotted with solid black, solid grey, and dashed black lines, respectively. The signals were averaged from −200 to +1,000 ms with respect to the stimulus onset. The MEG helmet is viewed from above and flattened onto a plane with the nose pointing upward. Each areal mean signal was calculated from 14 to 28 sensors. This MEG system (Elekta Neuromag Vectorview) detects the maximum signal directly above an active cortical area. The signals over the left and right temporal areas were strongest and are shown enlarged (A, B). The arrows point to maxima of signal strength at ∼100 ms, ∼250 ms, and ∼400 ms.
The source analysis revealed two recurrent types of activation sequences in the children. Examples of these patterns, in two individuals, are plotted in Figure 3. The simpler sequence (Type I), based on source location and orientation of current flow, indicated persistent activation of the sylvian fissure. In the left hemisphere, the current flow was directed superiorly and anteriorly at 50–150 ms poststimulus [resembling the direction of the current flow in adult P50m response, cf. Mäkelä et al., 1994] and thereafter, at about 150–600 ms in the opposite (inferior–posterior) direction [resembling the direction of the current flow in adult N100m response, cf. Parviainen et al., 2005], roughly at the same location. In the right hemisphere, most children showed current flow directed inferiorly and posteriorly, both before and after 150 ms. Henceforth, we will refer to these source types as s100 (superior–anterior direction, maximum activation at about 100 ms poststimulus), i100 (inferior–posterior direction, maximum activation at about 100 ms), and i270 (inferior–posterior direction, maximum activation at about 270 ms).
Figure 3.
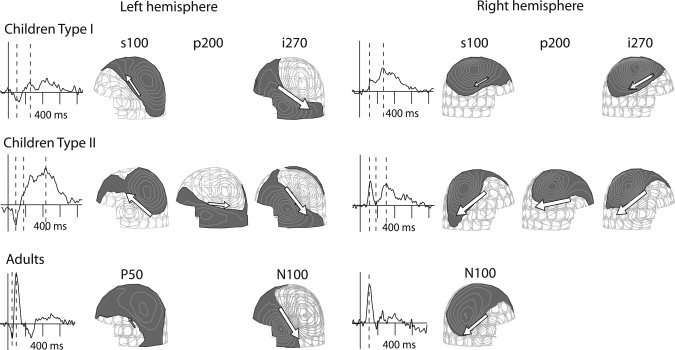
Source analysis. Signals recorded by selected MEG sensors and corresponding field patterns in the left and right hemisphere of children (above) and adults (below). In children, two types of activation sequences emerged, with vertically oriented source currents only (Type I) and with a horizontally oriented source current in between (Type II). The white arrows represent the equivalent current dipoles. The dashed lines on the MEG signals indicate the time points of the displayed field patterns.
In the more complex pattern (Type II), an additional source structure appeared between the s100/i100 and i270 activations. It was generated in close vicinity of the i270 sources (distance 22 ± 8/16 ± 4 mm in the left/right hemisphere, mean ± SD) but the electric current was directed posteriorly at an angle of about 47/30 degrees with respect to the i270 source current in the left/right hemisphere. In the following, we will refer to this source as p200 (current flow directed posteriorly, maximum activation at about 200 ms). There was no systematic relationship between the patterns in the two hemispheres—presence of a p200 source in the left hemisphere did not necessarily co‐occur with presence of a p200 source in the right hemisphere.
Figure 3 (bottom) displays, for comparison, the pattern observed in the adult brain [Parviainen et al., 2005]. The activation is dominated by a strong response at about 100 ms (N100 according to the EEG nomenclature, N100m or M100 in MEG), with the current oriented in the inferior–posterior direction in the superior temporal cortex, similarly in both hemispheres. The N100m is often preceded by a weaker response at about 50 ms, with the opposite direction of current flow (P50m).
Figure 4 compiles these different source types for the children, grouped into three time windows: 50–150 ms, 150–300 ms, and 300–600 ms. At 50–150 ms, there were clear hemispheric differences. In the left hemisphere, 15 subjects showed a superior–anterior direction of source current (s100) and two subjects had sources with the reverse direction of current flow (i100). The right hemisphere showed the opposite pattern, with an i100 source type in 11 subjects and an s100 source in only three subjects. After 150 ms, activation became more similar between the hemispheres. Horizontally oriented p200 sources were detected in 10 of 19 subjects in the left hemisphere and in 8 of 19 subjects in the right hemisphere. The most consistent source type across subjects and hemispheres was the late sustained i270 response, from about 150 ms onwards, which was found in 18 of 19 subjects in the left hemisphere and in all subjects in the right hemisphere.
Figure 4.
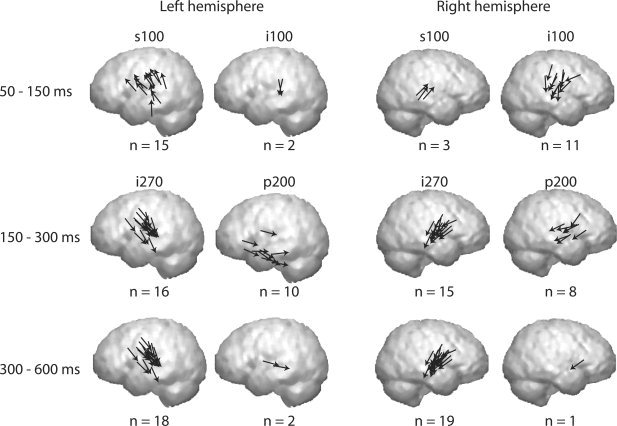
Activation sequence. Summary of the source types (s100, i100, p200, and i270) is shown in the three time windows: 50–150 ms (upper row), 150–300 ms (middle row), and 300–600 ms (lower row) in the left and right hemisphere. The s100 source type was detected in 15/3 subjects in the left/right hemisphere, and the hemispheric ratio was reversed for the i100 sources (2/11). The i270 source type was found in 18/19 subjects in the left/right hemisphere, and the p200 sources in 10/8 subjects. In most of the subjects, the i270 sources were active in both the 150–300 and in 300–600 time windows. The midpoint of each arrow corresponds to the center of an active cortical patch.
Time Course of Activation for Speech vs. Nonspeech Sounds
Figure 5 shows the average time course of activation in the i270 (Fig. 5A) and p200 (Fig. 5B) source areas for the different sound types. In the i270 source areas the response indicates stronger and longer‐lasting activation to speech than to complex and simple nonspeech sounds. Especially for nonspeech sounds, the waveform has a double‐peaked appearance, with separable maxima at around 270 ms and again at around 450 ms, whereas for speech sounds the response is more sustained. This phenomenon was conspicuous in 13/18 (8/19) subjects in the left (right) hemisphere. Due to the close similarity in direction and location of the source currents, the i100 source in the right hemisphere was fairly well accounted for by the i270 source (Fig. 5A). The s100 sources in the left hemisphere showed large variation in the orientation and/or location between subjects, and this source was not visible in all stimulus conditions within a subject. Therefore, we computed an average time course of activation over subjects and conducted statistical analysis on the i100, p200, and i270 sources, but not on s100 sources.
Figure 5.
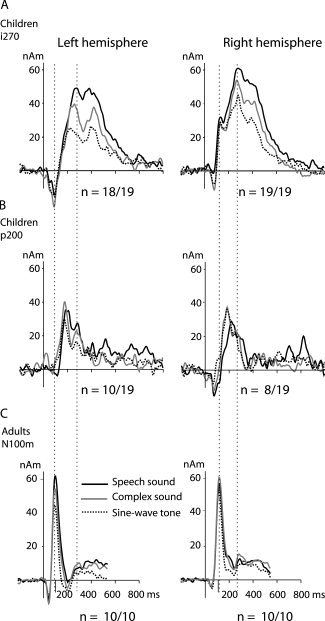
Mean time course of activation. The two upper rows show the amplitude (in nanoamperemeters, nAm) as a function of time in the i270 (A) and p200 (B) source areas in children, in the left and right hemisphere (left and right columns, respectively). For comparison, the mean time course of activation of the N100 sources in adults is plotted in (C). The responses to speech sounds, complex sounds, and sine‐wave tones are plotted with different line types. The first dashed vertical line indicates the latency of the maximum activation of the N100m source in adults and the second one that of the i270 source in children.
Table I summarizes the mean ± SD values of activation strength and timing at the peak of the response for the i100, p200, and i270 sources. For the i270 source the values are listed separately for the female and male subject groups. Significant stimulus effects appeared in the i270 time window. Speech sounds evoked stronger (both peak and mean amplitude, main effect of sound type: F(2,32) = 29.3, P < 0.001) and longer‐lasting (duration of activation, main effect of sound type: F(2,32) = 23.1, P < 0.001) activation than complex and simple nonspeech sounds in both the left and right hemisphere, similarly for both genders. However, the difference was not restricted to speech vs. nonspeech stimuli, but activation evoked by complex sounds and sine‐wave tones also differed significantly (peak activation, post hoc t‐test for speech vs. complex: t(17) = 3.1, P < 0.01, complex vs. sine‐wave: t(17) = 3.4, P < 0.01). The activation reached the maximum later for speech sounds than for complex sounds and simple tones (peak latency, main effect of sound type: F(2,32) = 10.8, P < 0.001).
Table I.
Activation strength and timing (mean ± SD) in children for speech sounds, complex sounds, and sine‐wave tones in five source areas (right‐hemisphere i100 source, left and right p200 sources, left and right i270 sources)
| Activation strength (nAm) | Activation latency (ms) | |||
|---|---|---|---|---|
| /a/ | /pa/ | /a/ | /pa/ | |
| i100 R | ||||
| Speech sound | 40 ± 16 | 42 ± 23 | 129 ± 12 | 139 ± 10 |
| Complex sound | 38 ± 19 | 29 ± 13 | 127 ± 14 | 133 ± 13 |
| Sine‐wave tone | 38 ± 17 | 31 ± 14 | 129 ± 11 | 134 ± 14 |
| p200 L | ||||
| Speech sound | 42 ± 21 | 28 ± 19 | 230 ± 53 | 207 ± 42 |
| Complex sound | 45 ± 27 | 42 ± 28 | 187 ± 20 | 204 ± 62 |
| Sine‐wave tone | 39 ± 20 | 36 ± 18 | 197 ± 41 | 296 ± 44 |
| p200 R | ||||
| Speech sound | 32 ± 29 | 37 ± 40 | 320 ± 47 | 244 ± 55 |
| Complex sound | 44 ± 25 | 54 ± 42 | 192 ± 39 | 203 ± 48 |
| Sine‐wave tone | 39 ± 18 | 31 ± 19 | 181 ± 30 | 185 ± 19 |
| i270 L, Fa | ||||
| Speech sound | 67 ± 20 | 67 ± 22 | 303 ± 75 | 311 ± 64 |
| Complex sound | 55 ± 22 | 59 ± 24 | 271 ± 8 | 258 ± 21 |
| Sine‐wave tone | 44 ± 22 | 46 ± 19 | 242 ± 40 | 246 ± 28 |
| i270 L, Ma | ||||
| Speech sound | 73 ± 28 | 71 ± 27 | 334 ± 94 | 301 ± 85 |
| Complex sound | 60 ± 21 | 64 ± 19 | 287 ± 111 | 262 ± 94 |
| Sine‐wave tone | 50 ± 21 | 51 ± 26 | 208 ± 38 | 222 ± 73 |
| i270 R, Fa | ||||
| Speech sound | 73 ± 23 | 80 ± 28 | 294 ± 19 | 291 ± 23 |
| Complex sound | 64 ± 24 | 72 ± 28 | 276 ± 11 | 273 ± 13 |
| Sine‐wave tone | 55 ± 21 | 58 ± 15 | 246 ± 45 | 255 ± 37 |
| i270 L, Ma | ||||
| Speech sound | 72 ± 32 | 77 ± 33 | 276 ± 40 | 298 ± 42 |
| Complex sound | 67 ± 36 | 71 ± 32 | 230 ± 31 | 243 ± 30 |
| Sine‐wave tone | 55 ± 24 | 59 ± 28 | 230 ± 42 | 229 ± 31 |
The i270 source values are presented separately for female (F) and male (M) subjects.
Abbreviations: L, left hemisphere; R, right hemisphere.
The p200 source strength did not vary by sound type, hemisphere, or gender. However, the p200 source activation reached the maximum slightly later for speech than nonspeech sounds (main effect of sound type: F(2,10) = 6.9, P < 0.05 in the right hemisphere, approaching significance in the left hemisphere F(2,16) = 3.4, P = 0.06). Note that a p200 was detected only in about half of the subjects (ten children had a p200 source in the left hemisphere and eight children in the right hemisphere). The early right hemisphere activation (i100 source) was not affected by sound type. There was no main effect of gender in the activation strengths or latencies.
Children vs. Adults
The MEG data on children were compared with data collected from ten adult subjects (five females, 23–39 years) [Parviainen et al., 2005]. As illustrated in Figure 3 (bottom), in adults the activation evoked by the speech and nonspeech sounds was dominated by the strong N100m response. The N100m reached the maximum earliest for sine‐wave tones and was systematically delayed to complex sounds and further to speech sounds (Fig. 5C). The activation strength displayed hemispheric specialization as systematic variation by stimulus type was observed in the left but not right hemisphere.
In children, the response was dominated by the strong i270 response. The magnetic field pattern associated with this source was very similar to that of the adult N100m response (Fig. 3). Similar to the adult N100m sources, the children's i270 sources were located more anteriorly in the right than left hemisphere (distance along the posterior–anterior axis, main effect of hemisphere: F(1,16) = 9.4, P < 0.01). These sources showed the earliest sound‐type effects in both children and adults. In both groups, the activation was significantly stronger and (consequently) reached the maximum later for speech than for complex sounds or sine‐wave tones (Fig. 5A,C). There was an important difference in hemispheric balance, however, with left‐lateralized differentiation between sound types in adults [Parviainen et al., 2005], but a bilateral effect in children. The timing differed significantly between the N100m and i270 responses (peak latency: F(1,26) = 220.5, P < 0.001).
Correlation Between Brain Measures and Behavioral Performance
We tested for correlation between the strength/timing of the i270 activation and performance in behavioral tests for reading and phonological processing (cf. Methods). Significant correlations were found only in the left hemisphere. Clear association was observed between the duration of the i270 activation and reading speed. The left‐hemisphere i270 activation lasted longer in children who were slower in reading (reading speed vs. duration for complex sounds, r = 0.70, P < 0.01) (Fig. 6). In addition, a delay in the i270 peak activation was accompanied with poorer scores in sentence comprehension (sentence comprehension vs. latency for complex sounds, r = −0.64, P < 0.01). Correlation between reading‐related skills and duration/latency of i270 activation was observed for all sound types (speech sounds, complex nonspeech sounds, and sine‐wave tones), but it reached significance only for the complex nonspeech sounds. There was no significant correlation between brain measures and phonological skills. However, the amplitude of the i270 activation tended to be smaller in subjects with better performance in phonological tasks (average over phonological awareness test scores vs. mean amplitude; r = −0.51, P = 0.03, n.s. using the conservative alpha level of 0.01).
Figure 6.
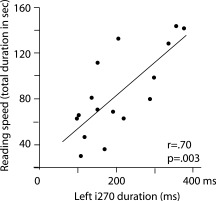
Correlation between cortical activation and behavioral scores. Duration of the i270 activation in the left hemisphere for complex sounds plotted against reading speed.
Age covaried with activation strength: older children showed weaker activation (age vs. maximum amplitude for the sine‐wave tone, r = −0.59, P < 0.01). This result must, however, be interpreted with caution as the age of the subjects varied only within 8 months. Age was not correlated with any of the behavioral scores.
DISCUSSION
Using simple speech and nonspeech sounds, we found markedly different time course of neural activation in 7‐ to 8‐year‐old children than in adults. In contrast, the underlying spatial composition of current flow in the superior temporal cortex was roughly similar in the two age groups. Sensitivity to sound type in children emerged bilaterally at about 250 ms poststimulus, as opposed to the left‐lateralized effect in adults at about 100 ms. Judging by location and direction of current flow, the neural sources of the sound‐type effect were remarkably similar in the two age groups.
The overall timing of activation in the present study agrees with earlier EEG studies of auditory perception in school‐aged children and, importantly, expands and clarifies the picture by reaching to the level of neural sources. A sustained activation at 200–500 ms is the most consistent finding both in the present study (i270) and in previous EEG and MEG reports (N2) [Albrecht et al., 2000; Ceponiene et al., 1998, 2001, 2002; Johnstone et al., 1996; Paul et al., 2006; Sharma et al., 1997; Takeshita et al., 2002]. The N2 is often preceded by a deflection of opposite polarity at about 100 ms (P1) [Albrecht et al., 2000; Ceponiene et al., 1998, 2001; Cunningham et al., 2000; Paul et al., 2006; Sharma et al., 1997], but some studies additionally report a small deflection reminiscent of the adult N100 response at 120–160 ms (N1), immediately preceding the N2 [Ceponiene et al., 1998; Cunningham et al., 2000; Sharma et al., 1997]. Our data indicate that the change of polarity from 100 to 250 ms poststimulus (P1‐N2) reflects the sequence from an s100 to an i270 source. The occasional detection of an N1 deflection in the EEG studies may reflect the influence of an i100 source on the summed effect of left‐ and right‐hemisphere activations that is detected on the EEG electrodes.
Based on the location and direction of current flow and the stimulus dependence of the activation in the present study, it is tempting to interpret the i270 response in children as a delayed and longer‐lasting variant of the N100m response in adults. However, the fact that in some individuals the right‐hemisphere (ipsilateral) i270 response was preceded by an earlier i100 response with a similar direction of current flow implies that these two response types reflect different neural processes. This observation gives support to earlier EEG studies suggesting that the neural activations at ∼100 ms and ∼250 ms reflect distinct processes, the balance between which changes with development. The N1 response in children becomes stronger and shifts to earlier latencies with age [Albrecht et al., 2000; Ponton et al., 2000; Sharma et al., 1997], reaching adult values in late adolescence, whereas the N2 response becomes weaker with age and is reported only rarely in adults [Cunningham et al., 2000; Johnstone et al., 1996; Ponton et al., 2000, 2002;). Moreover, the strength of the N100/N1 response shows strong sensitivity to the interstimulus interval, (ISI) both in adults [Hari, 1990] and in children [Paetau et al., 1995; Rojas et al., 1998], whereas the N2 response does not seem to depend on the ISI in the same way [Ceponiene et al., 1998; Takeshita et al., 2002]. But what is the functional role of the developmentally specific activation at around 250 ms in children?
The different weighting of neural activation in these two time‐windows at ∼100 ms and ∼250 ms between age groups probably reflects physiologically determined maturation of neural networks. Indeed, the process of synaptic pruning and synchronization of neuronal activation is still advancing in children at early school years [Huttenlocher and Dabholkar, 1997], most likely influencing morphology of the auditory evoked responses (see also Eggermont, 1988]. It has been suggested that during childhood auditory cortex goes through a reorganization in perceptual processing, resulting in a more effective network structure and increased automatization of information processing [Albrecht et al., 2000]. The prolonged time window of neural activation (sustained N2) may well be functionally relevant in such a process. Animal studies [Chang and Merzenich, 2003] indicate that an interaction between the biologically determined perceptual mechanisms and environmental input is crucial for our auditory and language perception [Chang and Merzenich, 2003; Peck, 1995; Stiles, 2000]. The neural system in the immature brain may thus display features that are relevant for development and adaptation to environment but are not present, at least to the same extent, nor needed in the mature system. In this framework, the N2 in school‐aged children and the N100 in adults would simply reflect functioning of the available neural substrate at a given age.
Importantly, correlation to behavioral performance suggested that the neural generators of the N2 (our i270) response in the left auditory cortex were closely interwoven with the behavioral development of cognitive capabilities, such as reading acquisition. Better reading skills were linked with faster (shorter lasting) neural activation, around 250 ms. This result is in line with earlier EEG and MEG studies of children with abnormal language development. Longer‐lasting N2 responses have been indicated in language‐impaired [Neville et al., 1993; Tonnquist‐Uhlen, 1996] and dyslexic [Paul et al., 2006] children. The link between neural processes and behavioral ability in the present study is especially interesting as it was found for individual children with normal language skills. Evidently, the large variance of both brain and behavioral measures in children enables the study of phenomena that are not necessarily accessible in adults. Thus, while the sustained sound‐type sensitive activation at around 250 ms is likely to reflect biologically determined maturation of neural structures, this process is not independent from development of meaningful behavioral abilities.
Interestingly, the reading speed was correlated with the cortical response duration to all our auditory stimuli and it is, therefore, likely to reflect ‘processing efficiency’ at a rather general level of auditory analysis. Indeed, when using stimuli that are physically (acoustically) different, as in the present study, rather than manipulating the perceptual quality of identical stimuli, it is not even feasible to uniquely identify speech‐specific neural processes.
Our data also showed marked hemispheric asymmetries. In adults, the left‐ and right‐hemisphere patterns to simple auditory stimuli are remarkably symmetric and stable, regardless of whether the stimuli are given monaurally [Parviainen et al., 2005; Salmelin et al., 1999] or binaurally [Bonte and Blomert, 2004]. In children, however, we observed major differences between the hemispheres at about 100–150 ms, with mostly s100 type of sources (resembling the adult P50m) in the left hemisphere and mostly i100 type of sources (resembling the adult N100m) in the right hemisphere. It has been suggested that, in school‐aged children, the emergence of processes underlying the N1 response diminish and shorten the P1 response [Ceponiene et al., 2002; Ponton et al., 2002]. Our results indicate that by the age of 8 years the N1 response has emerged in the right hemisphere in the majority of subjects (our i100), but not to the same extent in the left hemisphere where the signal is dominated by a P1 type of response (our s100).
In principle, as the stimuli were given monaurally to the right ear, the left–right asymmetry could reflect an effect of contra‐ vs. ipsilateral stimulation. However, such dramatic effects in source configuration or current orientation have not been reported in adults [Salmelin et al., 1999] nor suggested in children [Tonnquist‐Uhlen et al., 1995]. Instead, the asymmetric pattern in children, observed in the present study, may well reflect maturational differences between the left and right hemisphere. A developmental delay in the left hemisphere, as compared with the right hemisphere, is suggested by the results of Paetau et al. [ 1995], which showed longer P1 latencies in the left than right hemisphere, regardless of the stimulated ear. Likewise, Kotecha et al. [ 2009] reported that for the MEG responses at 50 ms (P50m) and 70 ms, the age‐related decrease in latency was slower in the left than right hemisphere in children between 6 and 17 years. Faster maturation of the right than left hemisphere would be in line with earlier postmortem [Chi et al., 1977] and recent in vivo experiments [Dubois et al., 2008], showing earlier emergence of gyral complexity in the right than left hemisphere in preterm infants. Clearly, neural processes involved in auditory processing at around 100 ms after sound onset are still in maturation at the age of 8 years.
It is tempting to speculate that the suggested hemispheric difference in cortical maturation is relevant also for language development. Although both hemispheres are involved during the entire cortical sequence evoked by spoken language processing [Uusvuori et al., 2008], and especially the early stages of speech perception are suggested to occur bilaterally [Hickok and Poeppel, 2007], there is evidence for left‐hemisphere preponderance of phonological and lexical‐semantic analysis [Ni et al., 2000; Rissman et al., 2003]. Nevertheless, because of the use of monaural stimuli in the present study, the hemispheric difference should be interpreted with caution, and further follow‐up studies are needed to better understand the development of auditory responses in the two hemispheres and its link to behavioral skills.
Children occasionally displayed a p200 response, an activation that has not been described in adults. It is likely to reflect diversity in the spatial composition of neural sources underlying general auditory processing in children, as this component did not markedly differ between the sound types. In adults, activation in comparable time‐window ∼150–200 ms has been detected, e.g., when dissociating the N1m component into two subcomponents using rapid presentation [Loveless et al., 1996] or in higher‐level linguistic processing, such as active perception of syllables and words [Bonte et al., 2006]. Emergence of this more complex sequence of activation (Type II) for simple speech and nonspeech sounds in children suggests that the developing brain tends to utilize rather extensive neuronal resources even for passive perception of sound stimuli, whereas in adults such processes are recruited only for more demanding tasks. Further studies are warranted to advance from our mere speculation to actual characterization of the functional role of the p200 component in auditory processing.
In summary, our results indicate that the sequence of neural activation evoked by auditory stimuli is strikingly immature in 8‐year‐old children. The differentiation between speech and complex and simple nonspeech sounds was detected in approximately the same cortical area but with clearly different timing in the two age groups. In contrast to the transient left‐lateralized effect at 100 ms in adults, sound‐type differentiation occurred bilaterally at around 200–400 ms in children. Interestingly, this prolonged activation that was specific to the developing brain was linked with the behavioral abilities of the children. A shorter duration of the left‐hemisphere response to auditory stimuli was linked with better reading skills, pointing to neural‐behavioral interplay in the development of auditory analysis. The present study thus demonstrates that the prolonged activation at around 250 ms in the immature auditory cortex is relevant for the cognitive development of the child. Moreover, it provides a solid basis for further investigations into the neural mechanisms underlying auditory language skills and for follow‐up experiments on the development of these processes.
Acknowledgements
The authors thank Mia Illman for the help in the MEG recordings. Most importantly, they thank all of the children, their parents, and the personnel of Revontuli, Jousenkaari, and Seppo elementary schools for pleasant collaboration.
REFERENCES
- Adams M ( 1990): Beginning to Read, Thinking and Learning About Print. London: The MIT Press. [Google Scholar]
- Ahonen T, Tuovinen S, Leppäsaari T ( 1999): Nopean sarjallisen nimeämisen testi. Jyväskylä: Haukkarannan koulu, Niilo Mäki Instituutti. [Google Scholar]
- Albrecht R, Suchodoletz W, Uwer R ( 2000): The development of auditory evoked dipole source activity from childhood to adulthood. Clin Neurophysiol 111: 2268–2276. [DOI] [PubMed] [Google Scholar]
- Benson RR, Richardson M, Whalen DH, Lai S ( 2006): Phonetic processing areas revealed by sinewave speech and acoustically similar non‐speech. Neuroimage 31: 342–353. [DOI] [PubMed] [Google Scholar]
- Bertelson P, Morais J, Alegria J, Content A ( 1985): Phonetic analysis capacity and learning to read. Nature 313: 73–74. [Google Scholar]
- Best C, McRoberts G ( 2003): Infant perception of non‐native consonant contrasts that adults assimilate in different ways. Lang Speech 46: 183–216. [DOI] [PMC free article] [PubMed] [Google Scholar]
- Bonte M, Blomert L ( 2004): Developmental changes in ERP correlates of spoken word recognition during early school years: A phonological priming study. Clin Neurophysiol 115: 409–423. [DOI] [PubMed] [Google Scholar]
- Bonte M, Parviainen T, Hytönen K, Salmelin R. (2006): Time course of top‐down and bottom‐up influences on syllable processing in the auditory cortex. Cereb Cortex 16:115–123. [DOI] [PubMed] [Google Scholar]
- Ceponiene R, Cheour M, Näätänen R ( 1998): Interstimulus interval and auditory event‐related potentials in children: Evidence for multiple generators. Electroencephalogr Clin Neurophysiol 108: 345–354. [DOI] [PubMed] [Google Scholar]
- Ceponiene R, Shestakova A, Balan P, Alku P, Yiaguchi K, Näätänen R ( 2001): Children's auditory event‐related potentials index sound complexity and “speechness”. Int J Neurosci 109: 245–260. [DOI] [PubMed] [Google Scholar]
- Ceponiene R, Rinne T, Näätänen R ( 2002): Maturation of cortical sound processing as indexed by event‐related potentials. Clin Neurophysiol 113: 870–882. [DOI] [PubMed] [Google Scholar]
- Chang EF, Merzenich MM ( 2003): Environmental noise retards auditory cortical development. Science 300: 498–502. [DOI] [PubMed] [Google Scholar]
- Cheour M, Ceponiene R, Lehtokoski A, Luuk A, Allik J, Alho K, Naatanen R ( 1998): Development of language‐specific phoneme representations in the infant brain. Nat Neurosci 1: 351–353. [DOI] [PubMed] [Google Scholar]
- Chi JG, Dooling EC, Gilles FH ( 1977): Left‐right asymmetries of the temporal speech areas of the human fetus. Arch Neurol 34: 346–348. [DOI] [PubMed] [Google Scholar]
- Connolly J, Phillips N ( 1994): Event‐related potential components reflect phonological and semantic processing of the terminal word of spoken sentences. J Cogn Neurosci 6: 256–266. [DOI] [PubMed] [Google Scholar]
- Cunningham J, Nicol T, Zecker S, Kraus N ( 2000): Speech‐evoked neurophysiologic responses in children with learning problems: Development and behavioral correlates of perception. Ear Hear 21: 554–568. [DOI] [PubMed] [Google Scholar]
- Denckla MB, Rudel RG ( 1976): Rapid “automatized” naming (R.A.N): Dyslexia differentiated from other learning disabilities. Neuropsychologia 14: 471–479. [DOI] [PubMed] [Google Scholar]
- Dubois J, Benders M, Cachia A, Lazeyras F, Ha‐Vinh Leuchter R, Sizonenko SV, Borradori‐Tolsa C, Mangin JF, Huppi PS ( 2008): Mapping the early cortical folding process in the preterm newborn brain. Cereb Cortex 18: 1444–1454. [DOI] [PubMed] [Google Scholar]
- Eggermont JJ ( 1988): On the rate of maturation of sensory evoked potentials. Electroencephalogr Clin Neurophysiol 70: 293–305. [DOI] [PubMed] [Google Scholar]
- Eulitz C, Diesch E, Pantev C, Hampson S, Elbert T ( 1995): Magnetic and electric brain activity evoked by the processing of tone and vowel stimuli. J Neurosci 15: 2748–2755. [DOI] [PMC free article] [PubMed] [Google Scholar]
- Fujioka T, Ross B, Kakigi R, Pantev C, Trainor LJ.( 2006): One year of musical training affects development of auditory cortical‐evoked fields in young children. Brain 129 ( Pt 10): 2593–2608. [DOI] [PubMed] [Google Scholar]
- Hari R. 1990. The neuromagnetic method in the study of the human auditory cortex In: Grandori F, Hoke M, Romani GL, editors. Auditory Evoked Magnetic Fields and Electric Potentials. Basel: Karger; pp 222–282. [Google Scholar]
- Helenius P, Salmelin R, Service E, Connolly JF, Leinonen S, Lyytinen H ( 2002): Cortical activation during spoken‐word segmentation in nonreading‐impaired and dyslexic adults. J Neurosci 22: 2936–2944. [DOI] [PMC free article] [PubMed] [Google Scholar]
- Hickok G, Poeppel D ( 2007): The cortical organization of speech processing. Nat Rev Neurosci 8: 393–402. [DOI] [PubMed] [Google Scholar]
- Huttenlocher PR, Dabholkar AS ( 1997): Regional differences in synaptogenesis in human cerebral cortex. J Comp Neurol 387: 167–178. [DOI] [PubMed] [Google Scholar]
- Hämäläinen M, Hari R, Ilmoniemi RJ, Knuutila L, Lounasmaa OV ( 1993): Magnetoencephalography—Theory, instrumentation, and applications to noninvasive studies of the working human brain. Rev Mod Phys 65: 413–497. [Google Scholar]
- Iivonen A, Laukkanen AM (1993): Explanations for the qualitative variation of Finnish vowels In: Studies in logopedics and phonetics 4 (Iivonen A, Lehtihalmes M, eds.), pp. 29–54. Helsinki: University of Helsinki. [Google Scholar]
- Johnstone SJ, Barry RJ, Anderson JW, Coyle SF (1996): Age‐related changes in child and adolescent event‐related potential component morphology, amplitude and latency to standard and target stimuli in an auditory oddball task. Int J Psychophysiol 24: 223–238. [DOI] [PubMed] [Google Scholar]
- Kajamies A, Poskiparta E, Annevirta T, Dufva M, Vauras M.2003. YTTE. Luetun ja kuullun ymmärtämisen ja lukemisen sujuvuuden arviointi. [Test of reading fluency and comprehension and listening comprehension]. Turku: University of Turku, Centre for Learning Research. [Google Scholar]
- Klatt DH (1979): Speech perception: A model of acoustic‐phonetic analysis and lexical access. J Phon 7: 279–312. [Google Scholar]
- Kotecha R, Pardos M, Wang Y, Wu T, Horn P, Brown D, Rose D, deGrauw T, Xiang J (2009): Modeling the developmental patterns of auditory evoked magnetic fields in children. PLoS One 4: e4811. [DOI] [PMC free article] [PubMed] [Google Scholar]
- Kraus N, McGee T, Carrell T, Sharma A, Micco A, Nicol T (1993): Speech‐evoked cortical potentials in children. J Am Acad Audiol 4: 238–248. [PubMed] [Google Scholar]
- Liegeois‐Chauvel C, Musolino A, Chauvel P (1991): Localization of the primary auditory area in man. Brain 114: 139–151. [PubMed] [Google Scholar]
- Lindeman J (1998): ALLU—Ala‐asteen Lukutesti [ALLU—Reading Test for Primary School]. University of Turku, Finland: The Center for Learning Research. [Google Scholar]
- Loveless N, Levänen S, Jousmäki V, Sams M, Hari R (1996): Temporal integration in auditory sensory memory: neuromagnetic evidence. Electroencephalogr Clin Neurophysiol 100:220–228. [DOI] [PubMed] [Google Scholar]
- Lütkenhöner B, Steinsträter O (1998): High‐precision neuromagnetic study of the functional organization of the human auditory cortex. Audiol Neurootol 3: 191–213. [DOI] [PubMed] [Google Scholar]
- Mäkelä JP, Hämäläinen M, Hari R, McEvoy L (1994): Whole‐head mapping of middle‐latency auditory evoked magnetic fields. Electroencephalogr Clin Neurophysiol 92: 414–421. [DOI] [PubMed] [Google Scholar]
- Neville H, Coffey SA, Holcomb PJ, Tallal P (1993): The neurobiology of sensory and language processing in language‐impaired children. J Cogn Neurosci 5: 235–253. [DOI] [PubMed] [Google Scholar]
- Ni W, Constable RT, Mencl WE, Pugh KR, Fulbright RK, Shaywitz SE, Shaywitz BA, Gore JC, Shankweiler D (2000): An event‐related neuroimaging study distinguishing form and content in sentence processing. J Cogn Neurosci 12: 120–133. [DOI] [PubMed] [Google Scholar]
- Oram Cardy JE, Flagg EJ, Roberts W, Roberts TP (2008): Auditory evoked fields predict language ability and impairment in children. Int J Psychophysiol 68: 170–175. [DOI] [PubMed] [Google Scholar]
- Paetau R, Ahonen A, Salonen O, Sams M (1995): Auditory evoked magnetic fields to tones and pseudowords in healthy children and adults. J Clin Neurophysiol 12: 177–185. [DOI] [PubMed] [Google Scholar]
- Parviainen T, Helenius P, Salmelin R (2005): Cortical differentiation of speech and nonspeech sounds at 100 ms: Implications for dyslexia. Cereb Cortex 15: 1054–1063. [DOI] [PubMed] [Google Scholar]
- Parviainen T, Helenius P, Poskiparta E, Niemi P, Salmelin R (2006): Cortical sequence of word perception in beginning readers. J Neurosci 26: 6052–6061. [DOI] [PMC free article] [PubMed] [Google Scholar]
- Paul I, Bott C, Heim S, Eulitz C, Elbert T (2006): Reduced hemispheric asymmetry of the auditory N260m in dyslexia. Neuropsychologia 44: 785–794. [DOI] [PubMed] [Google Scholar]
- Peck JE (1995): Development of hearing. Part III. Postnatal development. J Am Acad Audiol 6: 113–123. [PubMed] [Google Scholar]
- Phillips C, Pellathy T, Marantz A, Yellin E, Wexler K, Poeppel D, McGinnis M, Roberts T (2000): Auditory cortex accesses phonological categories: an MEG mismatch study. J Cogn Neurosci 12: 1038–1055. [DOI] [PubMed] [Google Scholar]
- Ponton C, Eggermont JJ, Khosla D, Kwong B, Don M (2002): Maturation of human central auditory system activity: Separating auditory evoked potentials by dipole source modeling. Clin Neurophysiol 113: 407–420. [DOI] [PubMed] [Google Scholar]
- Ponton CW, Eggermont JJ, Kwong B, Don M (2000): Maturation of human central auditory system activity: Evidence from multi‐channel evoked potentials. Clin Neurophysiol 111: 220–236. [DOI] [PubMed] [Google Scholar]
- Poskiparta E, Niemi P, Lepola J.1994. Diagnostiset testit 1. Lukeminen ja kirjoittaminen. [Diagnostic tests 1. Reading and spelling]. Turku: University of Turku, Centre for Learning Research. [Google Scholar]
- Rissman J, Eliassen JC, Blumstein SE (2003): An event‐related FMRI investigation of implicit semantic priming. J Cogn Neurosci 15: 1160–1175. [DOI] [PubMed] [Google Scholar]
- Rojas DC, Walker JR, Sheeder JL, Teale PD, Reite ML (1998): Developmental changes in refractoriness of the neuromagnetic M100 in children. Neuroreport 9: 1543–1547. [DOI] [PubMed] [Google Scholar]
- Salmelin R, Schnitzler A, Parkkonen L, Biermann K, Helenius P, Kiviniemi K, Kuukka K, Schmitz F, Freund H (1999): Native language, gender, and functional organization of the auditory cortex. Proc Natl Acad Sci U S A 96: 10460–10465. [DOI] [PMC free article] [PubMed] [Google Scholar]
- Share DL (1995): Phonological recoding and self‐teaching: Sine qua non of reading acquisition. Cognition 55: 151–218; discussion 219–226. [DOI] [PubMed] [Google Scholar]
- Sharma A, Kraus N, McGee TJ, Nicol TG (1997): Developmental changes in P1 and N1 central auditory responses elicited by consonant‐vowel syllables. Electroencephalogr Clin Neurophysiol 104: 540–545. [DOI] [PubMed] [Google Scholar]
- Silvén M, Poskiparta E, Niemi P (2004): The odds of becoming a precocious reader in Finnish. J Educ Psychol 96: 152–164. [Google Scholar]
- Sprenger‐Charolles L, Siegel LS, Bechennec D, Serniclaes W (2003): Development of phonological and orthographic processing in reading aloud, in silent reading, and in spelling: a four‐year longitudinal study. J Exp Child Psychol 84; 194–217. [DOI] [PubMed] [Google Scholar]
- Stiles J (2000): Neural plasticity and cognitive development. Dev Neuropsychol 18: 237–272. [DOI] [PubMed] [Google Scholar]
- Takeshita K, Nagamine T, Thuy DH, Satow T, Matsuhashi M, Yamamoto J, Takayama M, Fujiwara N, Shibasaki H (2002): Maturational change of parallel auditory processing in school‐aged children revealed by simultaneous recording of magnetic and electric cortical responses. Clin Neurophysiol 113: 1470–1484. [DOI] [PubMed] [Google Scholar]
- Tiitinen H, Sivonen P, Alku P, Virtanen J, Näätänen R (1999): Electromagnetic recordings reveal latency differences in speech and tone processing in humans. Brain Res Cogn Brain Res 8: 355–363. [DOI] [PubMed] [Google Scholar]
- Tonnquist‐Uhlen I (1996): Topography of auditory evoked long‐latency potentials in children with severe language impairment: The P2 and N2 components. Ear Hear 17: 314–326. [DOI] [PubMed] [Google Scholar]
- Tonnquist‐Uhlen I, Borg E, Spens KE (1995): Topography of auditory evoked long‐latency potentials in normal children, with particular reference to the N1 component. Electroencephalogr Clin Neurophysiol 95: 34–41. [DOI] [PubMed] [Google Scholar]
- Uusitalo MA, Ilmoniemi RJ (1997): Signal‐space projection method for separating MEG or EEG into components. Med Biol Eng Comput 35: 135–140. [DOI] [PubMed] [Google Scholar]
- Uusvuori J, Parviainen T, Inkinen M, Salmelin R (2008): Spatiotemporal interaction between sound form and meaning during spoken word perception. Cerebral Cortex 18: 456–466. [DOI] [PubMed] [Google Scholar]
- Vihla M, Lounasmaa OV, Salmelin R (2000): Cortical processing of change detection: Dissociation between natural vowels and two‐frequency complex tones. Proc Natl Acad Sci U S A 97: 10590–10594. [DOI] [PMC free article] [PubMed] [Google Scholar]
- Vouloumanos A, Kiehl KA, Werker JF, Liddle PF (2001): Detection of sounds in the auditory stream: Event‐related fMRI evidence for differential activation to speech and nonspeech. J Cogn Neurosci 13: 994–1005. [DOI] [PubMed] [Google Scholar]
- Wechsler D.1974. Wechsler Intelligence Scale for Children—Revised: Manual. New York: Psychological Corporation. [Finnish translation, Psykologien Kustannus Oy, 1984]. [Google Scholar]
- Wehner DT, Ahlfors SP, Mody M (2007): Effects of phonological contrast on auditory word discrimination in children with and without reading disability: A magnetoencephalography (MEG) study. Neuropsychologia 45: 3251–3262. [DOI] [PMC free article] [PubMed] [Google Scholar]
- Werker JF, Tees RC (1984): Cross‐language speech perception: Evidence for perceptual reorganization during the first year of life. Infant Behav Dev 7: 49–63. [Google Scholar]
- Wiik K (1965): Finnish and English vowels. Turku: University of Turku. [Google Scholar]
- Wunderlich JL, Cone‐Wesson BK, Shepherd R (2006): Maturation of the cortical auditory evoked potential in infants and young children. Hear Res 212: 185–202. [DOI] [PubMed] [Google Scholar]