

Abstract
Group identification can lead to a biased view of the world in favor of “in‐group” members. Studying the brain processes that underlie such in‐group biases is important for a wider understanding of the potential influence of social factors on basic perceptual processes. In this study, we used functional magnetic resonance imaging (fMRI) to investigate how people perceive the actions of in‐group and out‐group members, and how their biased view in favor of own team members manifests itself in the brain. We divided participants into two teams and had them judge the relative speeds of hand actions performed by an in‐group and an out‐group member in a competitive situation. Participants judged hand actions performed by in‐group members as being faster than those of out‐group members, even when the two actions were performed at physically identical speeds. In an additional fMRI experiment, we showed that, contrary to common belief, such skewed impressions arise from a subtle bias in perception and associated brain activity rather than decision‐making processes, and that this bias develops rapidly and involuntarily as a consequence of group affiliation. Our findings suggest that the neural mechanisms that underlie human perception are shaped by social context. Hum Brain Mapp 34:2055–2068, 2013. © 2012 Wiley Periodicals, Inc.
Keywords: in‐group bias, fMRI, social neuroscience, perception of action, mirror system, group processes
INTRODUCTION
People tend to evaluate the actions of their own group or team members more favorably than those of others. In a pioneering study by Hastorf and Cantril 2010, Princeton and Dartmouth students viewed a film of a contentious football game played between their two schools. The students' versions of what transpired during the game were so wildly different that it almost appeared as if they had watched different games. Social categorization can change social perception even in a minimal group setting. For example, Bernstein et al. 2010 randomly divided individuals into two groups and found that people were better at recognizing faces of in‐group members than of out‐group members, despite the fact that perceptual expertise was equivalent for in‐group and out‐group faces. Intergroup bias can occur under minimal conditions [Tajfel et al., 2000; Turner, 1986] as an automatic process without awareness [Ashburn‐Nardo et al., 2008; Otten and Wentura, 2005], implying that such a bias could manifest itself in brain regions involved in relatively nonconscious processing rather than at a later, conscious stage of selection. Traditionally, “in‐group" biases have been explained in terms of social psychological motivations [Brewer, 1979; Hewstone et al., 2008; Tajfel and Turner, 2008] but little is known about their underlying neural mechanisms.
A large part of the human brain is involved with social interactions and social cognition [Frith, 2001]. The “social brain" enables us to differentiate between ourselves and others and to recognize others' mental states, intentions, feelings, and emotions [Frith and Frith, 2001]. Uddin et al. 1971 suggested that two distinct but interconnected networks form the basis of the “social brain” and are involved in understanding others: a frontoparietal mirror neuron system that allows understanding others through motor simulation or mirroring mechanisms [e.g., Rizzolatti and Sinigaglia, 2008] and a “mentalizing” network comprised midline cortical structures important for evaluation of others' intentions, beliefs, and mental states [e.g., Frith, 1995].
The prefrontal cortex (PFC) and the anterior cingulate cortex (ACC) have been identified as primary components of the cortical midline network [Blakemore, 2007; Uddin et al., 1971]. Furthermore, the amygdala, which has been associated with emotional responses, seems to be a crucial brain region for social cognition [Blakemore, 2007; Frith, 2001]. These areas have been found to alter their activity as a function of ethnic or racial group biases. In particular, Cunningham et al. 2007 reported increased amygdala activity when White participants viewed brief, subconsciously presented photos of Black people. In contrast, when photos were consciously perceived this difference was significantly reduced, and regions of frontal cortex (ACC and PFC) associated with control and regulation showed greater activation for Black than White faces. Cunningham et al. 2007 suggested that participants attempt to control negative associations with their racial out‐group when they are aware of the stimulus. Similarly, Richeson et al. 1999 reported that activity in the right dorsolateral PFC (DLPFC) and ACC was positively correlated with racial bias, as measured by the implicit association test (IAT), whereas Rilling et al. 2003 reported higher activation in the dorsomedial PFC during in‐group interaction versus out‐group interaction for participants who were biased toward in‐group members. Rilling et al. 2003 further showed that brain activity was higher in the DLPFC during out‐group interactions for participants who did not show an in‐group bias, suggesting that those participants exerted greater cognitive effort to override their own biases. The medial PFC has also been identified as a region containing functions related to personal self [see Van Overwalle, 2008 for a meta‐analysis]. On the basis of social identity theory, Volz et al. 2004 hypothesized that because personal identity (knowledge about personal identities) is interdependent on one's social self (knowledge about shared attributes derived from our membership to certain groups), it is plausible to expect some overlap in related brain areas. Volz et al. 2004 argued that the social self is addressed during situations when evaluative group comparisons are made. In a functional magnetic resonance imaging (fMRI) study of a money‐awarding game under the minimal group paradigm, Volz et al. 2004 showed that the medial PFC (a region known to be involved in the personal self) was significantly more active in participants who acted with more bias compared with participants who predominantly showed neutral behavior during the task. This result, in line with social identity theory, suggests that the assessment of personal self and social self involves similar functions and overlapping brain areas [Volz et al., 2004]. Taken together, the findings of Cunningham et al. 2007, Richeson et al. 1999, Rilling et al. 2003, and Volz et al. 2004 provide evidence for differences in neural activity in response to in‐group and out‐group targets. It is important to note that two of the above studies [Cunningham et al., 2007; Richeson et al., 1999] used ethnic groups, which may lead participants to hide their racial biases. In turn, this cognitive effort may recruit brain areas that underlie inhibition and control functions. To conclude, these studies suggest that processing of social groups may be automatic, but executive functions can modulate automatic evaluations under certain conditions. Judgments leading to in‐group bias are therefore suggested to result from social decision making, relying on a network of brain regions including the ACC, medial PFC, and orbitofrontal cortex [Blakemore, 2007; Cunningham et al., 2007; Frith, 2001; Sanfey, 2010; Uddin et al., 1971; Van Bavel et al., 1975].
Although previous studies have tended to emphasize the role of cognitive‐emotional factors in intergroup biases, neural mechanisms exist for the direct simulation or “mirroring" of others' actions [Fabbri‐Destro and Rizzolatti, 2004; Rizzolatti and Fabbri‐Destro, 2004], and these have been shown to be influenced by racial factors [Avenanti et al., 2001; Molnar‐Szakacs et al., 2012b]. For example, Molnar‐Szakacs et al. 2012b showed in a transcranial magnetic stimulation (TMS) experiment that corticospinal excitability during observation of in‐group culture‐specific emblems (autonomous gestures that are highly social in nature) was higher when performed by an in‐group member than an out‐group member. They argue that unconscious mirror mechanisms were modulated by interacting biological and cultural factors so that when we observe the actions of an ethnic and cultural in‐group member, we show stronger motor resonance. Intergroup bias in action–perception may therefore arise from differences in neural mechanisms associated with the perception of goal‐directed actions, involving brain regions such as the superior temporal sulcus (STS), inferior parietal lobule (IPL) and pars opercularis, and adjacent ventral premotor cortex (vPM) [Blake and Schiffrar, 2007; Rizzolatti and Craighero, 2008], rather than solely from cognitive judgments or social motivations. In a previous fMRI study investigating in‐group bias using a minimal group paradigm, Van Bavel et al. 1975 found that faces of in‐group members are processed in more depth (revealed by greater fusiform gyrus activity) than faces of out‐group members, which might imply that participants process other team members in a different way than own team members. Moreover, activity in orbitofrontal cortex mediated the in‐group bias in self‐reported liking for the faces. These in‐group biases in neural activity were not moderated by whether participants explicitly attended to team membership, which suggests that they might arise automatically. In a similar way, regions involved in action–perception could be automatically modulated by team membership.
To investigate the effect of group membership on perception of action, in the current study, we arbitrarily allocated adult volunteers to one of two teams (red or blue). After consolidating group membership and testing the strength of implicit association with red or blue teams using the IAT [Greenwald et al., 2001, 1998], participants judged the speed of goal‐directed actions in pairs of video clips of in‐group and out‐group members in a competitive context. We carefully controlled the actual time difference between actions of red and blue team members in the paired videos and plotted the psychophysical function of participants' judgments of which team was faster against the actual time difference between depicted actions. We expected participants to show an in‐group bias, judging the actions of own team members as faster than identical actions of other team members. This behavioral action–judgment task was used to establish that participants showed a measurable and reliable bias toward own team actions in this group paradigm. The behavioral task alone, however, cannot reveal why such biases arise—whether they are purely due to social/cognitive, decision‐level processes or whether in‐group biases also involve differences in the neural processes underlying action–perception. To resolve this issue, we performed an fMRI experiment in which participants viewed actions of in‐group and out‐group members in a competitive situation.
On some trials, only a single video of the own team or other team member was presented, although the participant still expected a second comparison video to follow. These trials enabled us to examine neural activity associated specifically with perception of action of own team and other team members separately. If people who show in‐group bias perceive the actions of own team members differently to those of other team members, we would expect to see a difference in brain regions involved in action–perception such as the STS [Blake and Schiffrar, 2007], the IPL, and the pars opercularis and adjacent vPM (pars opercularis/vPM) [Rizzolatti and Craighero, 2008]. The STS is known to be involved in the analysis of “social” biological motion [Allison et al., 2000; Saxe et al., 2004; Wyk et al., 2009]. The other two regions are part of a frontoparietal mirror circuit important in visual‐motor transformation [Rizzolatti and Sinigaglia, 2008]. Because people imitate in‐group members more easily than out‐group members [Molnar‐Szakacs et al., 2012b; Yabar et al., 2009], and because in‐group members are processed in greater depth than out‐group members [Bernstein et al., 2010; Golby et al., 2009; Van Bavel et al., 1975], we expected these regions to be more active during the perception of in‐group members' actions in those participants who show an in‐group bias.
On other trials of the fMRI experiment, participants viewed both own team and other team actions and made judgments on who was faster, allowing us to examine neural activity associated with judgments of in‐group versus out‐group actions. If decision‐making processes are crucial for in‐group biases, we expected regions such as the ACC, the inferior frontal gyrus (IFG), and the DLPFC, which have previously been associated with decision making in general [Heekeren et al., 1954], as well as cognitive control in social perception [Cunningham et al., 2007] to be more active when participants chose their own team actions as faster compared with other team actions.
MATERIALS AND METHODS
Participants
Two independent groups of participants were recruited: 24 volunteers ranging in age from 17 to 39 years (M = 21.8 years) completed the behavioral action–judgment task, and another 24 volunteers, ranging in age from 17 to 43 years (M = 23.8 years), completed the fMRI action–perception task. To ensure that gender [Dambrun et al., 2004; Sidanius et al., 1961] and ethnicity [Vanman et al., 2007] did not interfere with group identification, the sample comprised Caucasian males only. All participants were right handed, had normal or corrected‐to‐normal visual acuity, and had no history of mental or neurological diseases. All experimental procedures were approved by the Medical Research Ethics Committee of The University of Queensland.
Team Allocation
All participants were first allocated to red and blue teams. For this allocation, participants were asked to estimate the number of dots in a randomly dispersed array of 84 black dots on a white background. Participants were seated 114 cm from a 17‐inch computer screen, and a two‐button response box was fixed to a table on the participant's right‐hand side. All aspects of experimental stimulus delivery were presented with E‐prime 2.0 (Psychology Software Tools) software. Participants were told that their team assignment would be based on their response (overestimation or underestimation of the number of dots), although allocation was in fact randomized [Tajfel et al., 2000] and no information about the performance was given to the participants. For the remainder of the study, participants then wore a red or blue jacket, as appropriate for their team.
Next, to consolidate group identification [Sherif et al., 2007] and enhance in‐group versus out‐group distinctiveness [Brewer, 2007], all participants performed a team‐competition task in which they were told that they were competing against a member of the other team. Participants reached as quickly as possible to press a response button with their right hand (50 cm from the resting hand position) after a “GO signal” was presented on the computer display. A warning cue (get ready) was always displayed at 1, 2, or 3 s before the “GO" cue. Participants were told that their response times would be compared with the prerecorded response times of an opposing team member, and to give this appearance the word “checking…” appeared immediately after the action, followed by a feedback display indicating “RED WINS" or “BLUE WINS.” Feedback was actually pseudo‐randomly selected, with each participant “winning” 50% of trials. If participants' responses took longer than 700 ms, the opposing team was shown as the winner to ensure that participants remained unaware of the randomized nature of feedback when they responded too slowly. Participants completed 18 trials of this competition task over ∼ 5 min.
Action–Judgment Task
Following the team‐competition task, the first group of 24 participants performed a novel action–judgment task. This task was critical for measuring group bias in action–judgments. Participants viewed pairs of video clips of rapid reaching actions made by red and blue team members and were asked to judge which was faster (Fig. 1A). Video clips showed a hand‐action model, in a red or blue jacket, performing a rapid reaching movement with his right hand, starting from a resting position and reaching to press a button at a distance of ∼ 50 cm in front of his body, before returning to the start position. The videos were edited with Sony Vegas Movie Studio 9 (Sony Media Software) so that the duration of the actions depicted, from the onset of movement until the model's hand reached the button, was strictly controlled by the number of video frames: either 233, 300, 367, or 433 ms duration (7, 9, 11, or 13 video frames at 30 frames per second). When paired together in all possible 32 combinations (see Supporting Information Table 1), this yielded seven experimental conditions in which the action durations differed by exactly +200, +133, +67, 0, −67, −133, or −200 ms. All video clips were exactly 1,500 ms duration, with movement onset beginning at 167 ms (frame 5). All combinations of action durations were presented equally often, randomly mixed, over two sessions of 64 trials per session.
Figure 1.
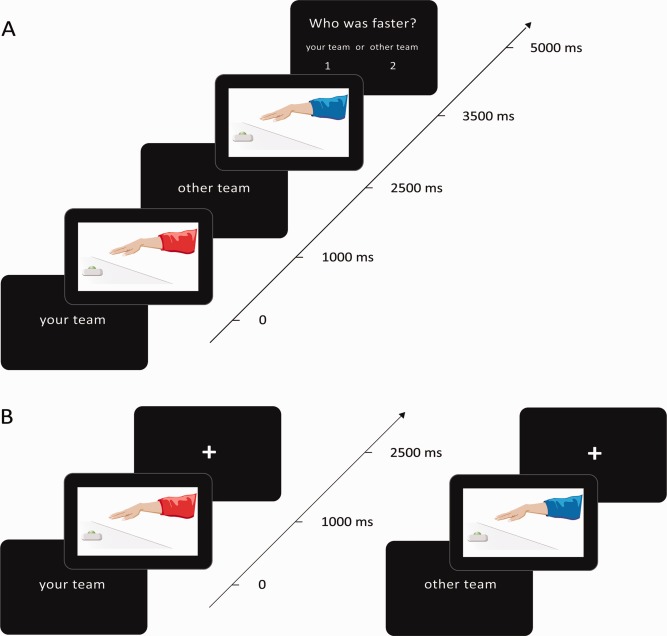
Schematic of the action–judgment task. A: Paired video trials. Half of all trials began with the text “your team,” followed by a video of an own team member performing a reaching button‐press action. The text “other team” was then presented, followed by the second video of the “other team” member's action. The order of videos was reversed for the other half of trials. Finally, the question “who was faster?” and the two possible choices, “your team” or “other team,” were presented. In the baseline press task the final stimulus screen instructed participants to “press left” or “press right,” rather than judging “who was faster?” Participants indicated their response by pressing a left or right response button. B: For the single‐video trials, only the initial “your team” or “other team” text and the relevant video clip were presented, with a fixation cross presented for the remainder of the intertrial interval (5,500 ms). Note that in the actual experiment videos of real people were used. [Color figure can be viewed in the online issue, which is available at http://wileyonlinelibrary.com.]
Crucially, identical video clips were shown to all participants, so that those representing “own team” for one group of participants were the same as those representing “other team” for the other group of participants. In this way, any differences between the judgments on own team and other team videos could not be attributed to any subtle physical differences between the videos themselves. Four different hand‐action models were depicted in the videos, and the team they represented was counterbalanced across participant groups. Participants received no feedback on the accuracy of their judgments.
To calculate the judgment bias in function of time difference between own team versus other team actions, the percentage of “own team faster” responses was calculated and plotted as a function the actual time difference between actions depicted in the videos. This psychophysical function, representing the relationship between perceived and actual speed of actions, was fitted with a three‐parameter sigmoid function y = a/(1 + exp(−(x − x0)/b)) using SigmaPlot 11.0 (Systat software). Each participant's judgment bias was calculated by finding the actual time difference between own team versus other team actions (x‐axis) at which perceptual responses of “own team faster” was equal to 50% (y‐axis) on their individual fitted sigmoid function [using the formula x = −LN((a/y)−1)*b + x0].
Functional MRI Action–Judgment Task
Following the team‐competition task, the second group of 24 participants performed a modified version of the action–judgment task during functional MRI measurement. In this modified task, only two durations of actions were depicted in the video clips (300 and 367 ms) so that paired videos showed own team and other team actions that differed by either +67, 0, or −67 ms. Each trial consisted either of a pair of video clips, as in the standard action–judgment task, or a single‐video clip showing an action performed by an own team or other team member (Fig. 1B). For the paired video trials, as in the standard action–judgment task, participants pressed a button after viewing the two actions to indicate which of the actions they judged as faster. For the single‐video trials, only the initial “your team” or “other team” text and the relevant video clip were presented, with a fixation cross presented for the remainder of the intertrial interval (5,500 ms). These single‐video trials were mixed randomly with the paired video trials so that participants were not aware of the trial type while viewing the initial video clips. In the paired video trials, the two video clips are too close in time to analyze the activity associated with watching own team and other team videos separately; therefore, we included the single‐video trials. This condition allowed us to compare brain activation associated with the visual processing of own team versus other team videos in isolation, without any possible confounding effects of seeing both team videos and making judgments about teams.
As a baseline comparison condition, a press task was also included in which the final stimulus screen instructed participants to “press left” or “press right,” rather than judging “who was faster?” When contrasted with the paired video action–judgment trials, the press task allowed us to examine neural activity associated with making explicit judgments on who was faster. As a resting control condition, 16 trials involved only a fixation cross presented for the entire 8 s trial duration. This allowed us to plot the level of activation (% signal change) during the single‐video trials compared with a passive‐fixation control condition.
The overall sequence of stimuli within trials for the paired video clips was identical to that in the standard action–judgment task (see Fig. 1A), except that a fixed 3 s intertrial interval was used to keep overall trial durations fixed. The order of in‐group and out‐group video clips and action durations was counterbalanced across participants. The entire task was conducted in four repeated fMRI runs, each of ∼ 9‐min duration and consisting of 64 trials in total. There were 16 trials for each within‐subject condition: 32 paired video trials, half requiring action–judgments and half press left/right; 16 single‐video trials, half showing own team and half other team; and 16 baseline fixation trials.
Immediately following the fMRI action–judgment task, we also conducted an additional single fMRI run in which participants passively viewed the same own team and other team action video clips in blocks alternating with rest. This control experiment allowed us to examine whether any difference existed in neural activity for own team and other team actions during purely passive observation. Videos of own team and other team actions were presented in blocks (to optimize the power of the design) of 24 s duration (12 trials of a 1,500 ms video clip followed by a 500 ms fixation interstimulus interval), alternating with 16 s baseline fixation. Each participant viewed four blocks of own team and four blocks of other team actions.
Implicit Association Test
Following the action–judgment task, all participants performed the IAT [Greenwald et al., 2001] to verify that each group identified more with their own team members than with opposing team members (see Supporting Information Fig. 1). In the critical conditions of our IAT task, participants simultaneously categorized words as pleasant or unpleasant, and photos of team members as own team or other team, by pressing left or right buttons. If participants form significant group associations, they should respond faster in a congruent condition, when own team photos and positive words are associated with one response (e.g., left button press) and other team photos and negative words are associated with the other response (e.g., right button press), than the reverse configuration in which own team photos and negative words are mapped to the same response. The modified IAT consisted of five parts: three parts for learning associations between concepts and response hands (Parts 1, 2, and 4) and two critical, combined tasks (Parts 3 and 5) during which response times were measured and compared. For the initial target‐concept discrimination, photographs of a red or blue team member were presented in the center of the display with category labels “red team” and “blue team” presented in left and right top corners of the display. Participants pressed left or right response buttons to classify photographs as red or blue team members. The photographs showed one of eight Caucasian males wearing a blue or a red jacket, with each model shown twice over 16 trials. Next, for the associated attribute discrimination, pleasant or unpleasant words were presented in the center of the display, with the category labels “unpleasant” and “pleasant” presented in left and right top corners of the display. Participants pressed the left or right response buttons to classify words as unpleasant or pleasant. Four unpleasant words (enemy, evil, rotten, and hatred) and four pleasant words (friend, honest, loyal, and happy) were each presented twice over 16 trials.
For the critical combined tasks (Parts 3 and 5), each trial involved either a pleasant/unpleasant word or a photograph of a red/blue team member presented centrally, with both sets of category labels pleasant/unpleasant and red team/blue team presented in left and right top corners of the display. Participants pressed the appropriate button to classify the words as pleasant/unpleasant and the photographs as red/blue team. This condition was either congruent, in which own team/pleasant and other team/unpleasant were associated with the same response, or incongruent in which own team/unpleasant and other team/pleasant were associated. Each of the eight words and eight photographs was presented 10 times in random order over 160 trials. Half the participants performed congruent and incongruent conditions in Parts 3 and 5, respectively, and half performed the reverse order. Participants' reaction times were recorded in these combined tasks and compared between congruent and incongruent conditions. Between the two combined tasks (Part 4), for the reversed target‐concept discrimination, words and photographs were mapped to opposite response sides from those in Parts 2 and 3. To counteract any order effect, the number of trials during the reassociation phase in Part 4 was doubled [Nosek et al., 1992] for a total of 32 trials.
Explicit Group Identification
Finally, following the IAT, a brief questionnaire was used to measure explicit group identification. Two questions were asked: “I identify myself with the people from the red team” and “I identify myself with the people from the blue team.” Participants responded on a seven‐point Likert scale ranging from 1 (I totally agree) to 7 (I totally disagree). For each participant, we calculated a difference score as follows: “identify with other team score − identify with own team score” (positive scores mean more identification with own team). One sample t‐tests were used to compare participants' scores against 0 (no bias in identification scores). Twenty participants from the behavioral experiment group and all 24 participants from the fMRI experiment completed the explicit group identification questionnaire.
fMRI Acquisition
Functional MRI data were obtained on a 1.5 T Siemens Sonata MR scanner using a gradient‐echo echo‐planar imaging (EPI) sequence with the following parameters: 42 descending horizontal slices (3.5 mm slice thickness) without gap, repetition time (TR) 2.5 s; echo time (TE) 40 ms; flip angle (FA) 90°; and 64 × 64 voxels at 3.5 mm × 3.5 mm in‐plane resolution. To reduce multicollinearity, each point in the trial occurred at a different time point within the TR cycle. The entire brain from the vertex to the cerebellum was covered in the 42 slices. The first three T R periods from each functional run were removed to allow for steady‐state tissue magnetization. Four runs of 211 brain images each were collected in the fMRI judgment task, and one run of 131 images was collected in the fMRI passive‐viewing task. A three‐dimensional, high‐resolution T 1‐weighted image covering the entire brain was also acquired for anatomical reference (TR = 1,700 ms, TE = 3.91 ms, FA = 15°, 192 cubic matrix, and voxel size = 1.2 mm3).
fMRI Analyses
Data were processed and analyzed using SPM5 (Wellcome Department of Imaging Neuroscience, Institute of Neurology, London; http://www.fil.ion.ucl.ac.uk/spm) implemented in Matlab (Mathworks, USA). Following correction for differences in timing of slice acquisition within a volume to the middle slice, EPI volumes were realigned to the middle image of each run for movement correction using a least‐squares approach and six‐parameter rigid body spatial transformations [Friston et al., 2005]. A mean EPI volume was obtained during realignment, and the structural MRI was coregistered with that mean volume. The structural scan was normalized to the Montreal Neurological Institute T1 template using nonlinear basis functions. The same deformation parameters were applied to the EPI volumes. The EPI volumes were spatially smoothed using a 7‐mm full‐width‐at‐half‐maximum isotropic Gaussian filter. The time series for each voxel was high‐pass filtered to 1/128 Hz.
In the fMRI task, event‐related responses to single‐video presentations of own team and other team actions, and to decisions in the paired video trials, were each modeled by the canonical hemodynamic response function of SPM5, together with their temporal derivatives. These event‐related regressors were time locked to the onset of trials for single‐video conditions and to the decision phase of the task for the paired video trials. Specific contrasts calculated in the first‐level analyses were then compared in second‐level random‐effects group analysis using single‐sample t‐tests [Holmes and Friston, 1990].
For the single‐video trials, we contrasted activation while watching action videos overall versus the implicit fixation baseline to identify the brain network that was involved in the perception of action. Crucially, we also contrasted activations recorded while participants watched own team versus other team actions, to determine whether group membership influences neural processes involved in action–perception. In paired video trials, we contrasted activation when participants made explicit judgments versus the press task, to identify the network involved in making action–judgments. We also contrasted activation for “own team faster" versus “other team faster" judgments to identify any differences associated with biased judgments toward in‐group members. In the passive‐viewing fMRI experiment, blocks of watching own team versus other team videos were modeled by the canonical hemodynamic response function and contrasts in first‐level analysis and then compared across the group in second‐level random‐effects analysis using a single‐sample t‐test. For all contrasts, significant activation was defined by a cluster‐level probability threshold of P FWE < 0.05 corrected for the whole‐brain search volume (with clusters defined by the voxel‐level threshold P < 0.001).
RESULTS
Implicit Association Test
Across all 48 participants, the assignment to red and blue teams and the initial team competition resulted in significantly faster response times for the congruent condition (686 ms, SD = 205) than for the incongruent condition (758 ms, SD = 213), t(47) = −3.71, P < 0.001, indicating a reliably stronger association between own team members and pleasant words, and between other team members and unpleasant words, than the reverse pairings.
Action–Judgment Task
As shown in Figure 2, we plotted the psychophysical function of participants' “own team faster" judgments versus the actual time difference between actions in paired video clips. If group affiliation has no influence on action observation, then the point at which participants judge own team actions as faster on 50% of trials (i.e., judging other team actions as faster on an equal proportion of trials) should coincide with the physical speed of actions being identical (i.e., 0 ms time difference on the x‐axis). Contrary to this null hypothesis, participants actually judged the actions of own team members as roughly 30 ms faster than identical actions performed by other team members (see Fig. 2). A one‐sample t‐test showed that this value was significantly different from zero or no bias, t(23) = 6.02, P < 0.001. Across all 24 participants, the mean R 2 fit of the sigmoid function was 96.8% (SD = 3.6%), indicating that individual curves accurately fitted the data for each participant.
Figure 2.
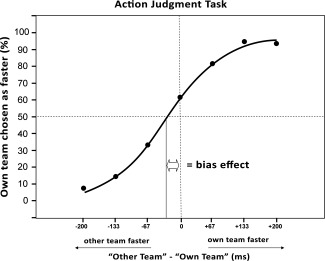
Perceptual judgments in the action–judgment task plotted as a function of the real time differences between actions in the videos. The data points are fitted by a three‐parameter sigmoid function. Y‐axis: Percentage of trials in which participants judged the action of their own team member as faster than that of the other team member. X‐axis: The real time difference (in ms) between own team and other team actions in the videos, measured from the onset of movement until the hand reached the button.
As expected, errors in accurately identifying which action was faster varied significantly across the 200, 133, and 67 ms time differences, F(2, 46) = 71.75; P < 0.001. Participants were highly accurate in judging which action was faster at the 200 ms time difference (M = 93.0%, SD = 8.5%), but were significantly less accurate at the 133 ms time difference (M = 90.0%, SD = 7.7%, t(23) = 9.29, P < 0.05), and significantly less accurate again at the 67 ms time difference (M = 74.0%, SD = 8.2%; t(23) = 10.72, P < 0.001 compared with the 133 ms condition and t(23) = 9.29, P < 0.001 compared with the 200 ms condition). Participants showed no bias in judgments toward own team members for actions with 200 ms time differences (M = 50.3% “own team faster” responses, t(23) = 0.23, P > 0.05) but showed significant biases toward own team for all other levels of time differences (i.e., >50% “own team faster" responses, P < 0.001 for all comparisons).
Functional MRI Action–Perception Task: Behavioral Results
For functional MRI, we used a modified version of the action–judgment task in which all trials showed actions differing in duration by only ±67 or 0 ms (i.e., the “easier" judgments with ±133 and ±200 ms were not included). Overall, when actions depicted were exactly equal in duration, participants judged the actions of their own team as faster significantly more often (53.9%, SD = 11.5%) than actions of the other team (46.1%, SD = 11.4%; one‐tailed, one‐sample t‐test: t(23) = 1.66, P = 0.05), indicating a significant judgment bias across the whole group. However, when looking at results of individual participants, it was apparent that this bias effect was somewhat weaker than that observed in the full action–judgment task; only 13 of the 24 participants showed a judgment bias, selecting their own team as faster on >50% of trials. Because in the fMRI study we specifically aimed to examine neural activity differences related to group bias, we only included those participants who actually showed a bias behaviorally in the fMRI action–judgment task. When the videos were equal in duration, a one‐tailed, one‐sample t‐test confirmed that these 13 participants chose their own team actions as faster significantly more often (60.8%, SD = 9.6%; t(12) = 4.04, P = 0.001). When own team videos were actually faster, participants with a bias chose their own team as faster 83.0% (SD = 8%) of the time, whereas when other team videos were actually faster, participants with a bias chose the other team as faster only 70.7% (SD = 18%) of the time; a one‐tailed, paired t‐test showed this difference to be significant, t(12) = 1.99, P = 0.035.
When reanalyzing results of the IAT task, those participants who showed no group bias on the judgment task also showed no significant difference between congruent (M = 851 ms, SD = 221) and incongruent (M = 863 ms, SD = 239) conditions of the IAT, t(10) = −0.34, P = 0.37, suggesting that they also failed to identify significantly with their own group. Conversely, those participants who did show a judgment bias behaviorally on the action–judgment task also showed a significantly greater affiliation with their own team on the IAT (response times for congruent (M = 654 ms, SD = 104) < incongruent (M = 723 ms, SD = 116), one‐tailed paired t‐test: t(12) = −2.11, P = 0.03). While it must be noted that the difference in congruent and incongruent IAT trials between the biased (M = −69 ms, SD = 118) and nonbiased group (M = −12 ms, SD = 116) failed to reach significance, one‐way two‐sample t‐test, t(22) = 1.2, P = 0.12.
Explicit Group Identification Results
During the behavioral experiment, participants identified more with their own team than with the other team (M = 2.62, SD = 1.94; t(20) = 6.20, P < 0.001), as measured by the questionnaire. Similarly, during the fMRI experiment, participants with a bias also identified more with their own team than with the other team (M = 1.85, SD = 2.19; t(12) = 3.04, P = 0.01). Participants without a bias failed to reach significant more own group identification (M = 1.82, SD = 2.82; t(10) = 2.14, P = 0.06) although the difference between the biased and nonbiased group was not significant (one‐way two‐sample t‐test, t(22) = 0.027, P = 0.49).
fMRI Results
fMRI analyses first focused on the single‐video trials. As shown in Figure 3A and Supporting Information Table 2, a network of brain areas, including the posterior temporal sulcus, IPL, and dorsal premotor cortex and vPM, was active across all participants when watching the single‐action videos alone compared with the fixation (baseline) condition. To investigate the effect of bias on action–perception, we analyzed data from participants who showed a judgment bias behaviorally during the paired video trials separate from the participants who showed no bias. We first analyzed fMRI data from the participants with a bias. When we contrasted activation during observation of own team compared with other team actions during the single‐video trials, we found a single cluster within the left IPL (−36, −57, 51, Z = 4.12, extent 37, P corrected = 0.007; see Fig. 4A) that was significantly more active when viewing own team actions. Plots of percent signal change within this cluster are shown in Figure 4. As can be seen, every participant who showed a judgment bias behaviorally also showed greater activity in this IPL cluster when viewing own team compared with other team actions (Fig. 4B,C), whereas the participants who showed no bias behaviorally also showed no difference in IPL activation (Fig. 4D). As a further test, a correlation analysis in SPSS found a positive spearman correlation (r = 0.47; P = 0.02) across the entire group of 24 participants between the behavioral judgment bias and the % signal change score difference (own team − other team) in this region. To further test directly if the left IPL showed a significantly biased response in single‐video trials between the two groups, we used the left IPL (anatomically defined by the WFU PickAtlas: http://www.fmri.wfubmc.edu/cms/software) as a region of interest analysis and specifically compared the own team versus other team contrast between the two groups using a two‐sample t‐test. This analysis showed that, in the same region of the left IPL, the activation difference for observation of own team compared with other team actions was significantly greater in people with a bias compared with those without a bias (−33, −57, 51, Z = 3.85, P corrected = 0.027). In addition, we also tested for other ROIs in the action observation network such as the right IPL, left and right STS (anatomically defined by combining middle and superior temporal gyrus), and left and right pars opercularis and PM (anatomically defined by combining Brodmann area 44 and 6). No significant differences between the biased minus nonbiased group were found in the other ROIs or outside the ROIs, and no significant additional activation was found in the people without a bias compared with the people with a bias inside or outside the ROIs. Also, no significant difference was found between watching own team single‐video clips minus other team single‐video clips for the nonbiased group inside or outside the ROIs. This further confirms that our effect was specific to the left IPL and the people with a bias.
Figure 3.
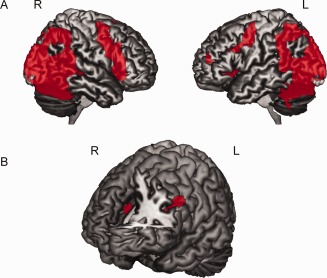
Brain activation results from the fMRI study. A: Action–perception network. Brain activation differences while watching videos of hand actions in the single‐video trials compared with a fixation baseline condition, displayed on a rendered brain in MRIcron (P uncorrected < 0.001, cluster‐size threshold > 25 voxels). B: Brain activation differences in left inferior frontal gyrus and anterior cingulate cortex during explicit judgments on own team versus other team actions in the paired video trials, compared with the press‐left/right (baseline) task, displayed on a rendered brain in MRIcron (P uncorrected < 0.001, cluster‐size threshold > 25 voxels). [Color figure can be viewed in the online issue, which is available at http://wileyonlinelibrary.com.]
Figure 4.
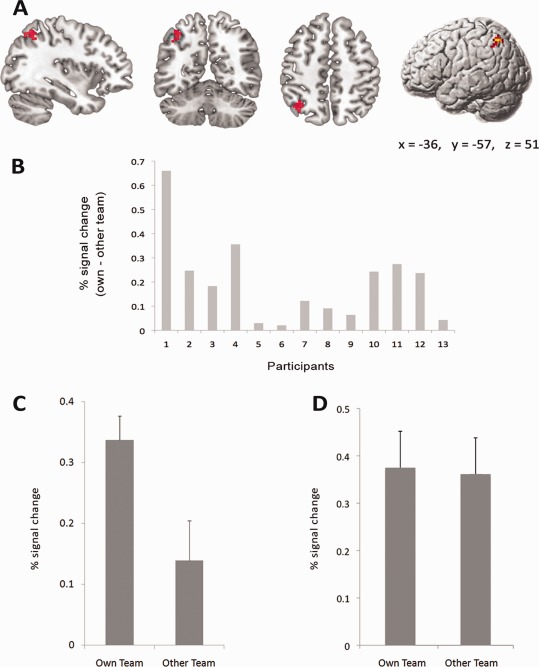
Brain activation results relating to group bias in the fMRI action–perception study. A: Brain activation differences in the single‐video trials when observing own team compared with other team actions. Left inferior parietal activation on coronal, axial, and sagittal sections, and on rendered brain, displayed at a threshold of P uncorrected < 0.001, cluster‐size threshold> 25 voxels. B: Difference in percentage signal change within the significant left IPL cluster (mean of all voxels in the whole cluster calculated with marsbar (http://marsbar.sourceforge.net/ )) when observing own team compared with other team actions, plotted for each of the participants who showed a judgment bias behaviorally in the fMRI experiment. C: Mean percentage signal change within the significant left IPL cluster for the participants who showed a judgment bias behaviorally when observing own team compared with other team actions (error bars are one standard error of the mean). D: Mean percentage signal change within the same left IPL cluster for the participants who showed no judgment bias behaviorally (error bars are one standard error of the mean).
For the paired video trials, as shown in Figure 3B, we found a network of brain regions that were significantly more active when participants made judgments on the team actions compared with the baseline press left/right task. These regions included left IFG (−42, 6, 30, Z = 4.33, extent 90, P corrected = 0.001), anterior cingulate (0, 36, 21, Z = 4.09, extent 54, P corrected = 0.02), the right inferior occipital gyrus (39, −84, −6, Z = 5.12, extent 85, P corrected = 0.002), and left middle occipital gyrus extending into the left fusiform gyrus (−36, −45, −21, Z = 4.56, extent 189, P corrected < 0.001). There were no brain regions that were significantly more active during the decision phase when participants explicitly judged their own team as faster compared with judging the other team faster.
Passive‐Viewing fMRI Experiment
fMRI analyses comparing watching videos versus baseline revealed a similar brain network to that obtained from the single‐video trials of the main experiment (see Supporting Information Fig. 2 and Supporting Information Table 2). This network included the posterior temporal sulcus, the IPL, and the dorsal premotor cortex and vPM. No significant differences in brain activation were found when participants passively observed own team and other team actions, either when examined exclusively for participants who showed a judgment bias behaviorally and when examined across the full group of 24 participants. Furthermore, there were no differences related to group bias even when we focused exclusively on the left IPL at the very lenient threshold of P < 0.05 uncorrected. A paired t‐test confirmed that the activation between own team video minus other team video showed significant (−39, −54, 42, Z = 3.71, extent 34, P corrected = 0.039) more activation in the people with a bias in the judgment experiment compared with the passive‐viewing experiment.
DISCUSSION
In our behavioral action–judgment experiment, we showed that individuals arbitrarily assigned to a team rapidly form group associations and that these associations bias subjective judgments of the speed of actions of own team and other team members. In our fMRI experiment, we found that this judgment bias is associated with increased activity in the left IPL during the observation of own team actions compared with other team actions. Because we only tested male participants our results might only be valid for this population, and further testing needs to be done to see if these findings extent to females also.
Our findings suggest that brain mechanisms underlying action–perception are influenced by group biases. Neural responses in the IPL were enhanced during the perception of own group compared with other group actions in those participants who showed a group bias behaviorally. As outlined earlier, distinct brain processes exist for the direct simulation or “mirroring" of others' actions, and these have also been shown to be influenced by social relationships [Molnar‐Szakacs et al., 2012b; Rizzolatti and Fabbri‐Destro, 2004]. The IPL is a crucial region in this “mirroring network" and is known to be involved in transforming visual representations of actions to the motor system for action–perception [Fabbri‐Destro and Rizzolatti, 2004; Molenberghs et al., 2010; Rizzolatti and Craighero, 2008]. It should be noted that, because we did not include a movement execution condition, we cannot make conclusions directly about mirror neuron involvement in this study. Even shared activity between action execution and observation conditions would not necessarily imply mirror neurons [Gazzola and Keysers, 2007]. Nonetheless, there is overwhelming evidence that the IPL has an active role in action observation. Single‐cell recordings in monkeys [Fogassi et al., 2008] and fMRI studies in humans [Molenberghs et al., 2012a] have shown that neurons in the inferior parietal cortex respond differently to the observation of actions depending on the context in which they are performed. Our results further suggest that neural responses to observed actions in the IPL are influenced by social context.
It is not clear why the in‐group effect we observed within the IPL was lateralized to the left hemisphere, and further research will be needed to clarify this issue. One possibility, however, is that the right‐handed actions our participants viewed were mapped to anatomically congruent motor representations of the contralateral hemisphere. There is increasing evidence that observed actions are mapped onto corresponding cortical regions based upon the laterality of the hand depicted in the action and the observer's perspective [Shmuelof and Zohary, 2004]. In recent work from our own lab, Bortoletto et al. 2008 showed that when people plan actions, neural activity associated with the observed action is the strongest contralateral to the observed effector (i.e., the N170 over left lateral parietal cortex for right‐hand movement). Molenberghs et al. 2009 similarly found that parietal mirror neuron activation related to observation and execution of right‐handed actions was restricted to the left hemisphere. In the current study, participants had all practiced performing the actions with their right hand while concurrently watching the video clips during the group consolidation stage. Therefore, the observed actions in the video clips would have been associated with equivalent right‐hand actions previously performed by the observers.
Our results are consistent with the idea that observation of own team actions led to a greater degree of “automatic imitation” or mapping of observed actions, by the left IPL, to equivalent motor representations for right‐hand movement. A recent EEG study [Gutsell and Inzlicht, 2009] found that participants with higher prejudice show less mu suppression (which is used as an index of mirror neuron activity during action observation) in the left parietal lobe during observation of out‐group actions compared with in‐group actions. Past research has also shown that participants are more likely to imitate a person if he or she is perceived as an in‐group rather than out‐group member [Yabar et al., 2009], and the IPL is known to play a key role in imitation [Iacoboni and Dapretto, 1998; Molenberghs et al., 2006, 2009; Mühlau et al., 2007]. Further, other regions involved in action observation, such as the pars opercularis of the IFG, seem to be less involved in imitation [Molenberghs et al., 2009], which may explain why it was only activation in the IPL that was significantly influenced by group bias. Overall, our results show that established social relationships between individuals can mediate neural activity within the IPL during action–perception.
A previous fMRI study investigating bias in artificial groups [Van Bavel et al., 1975] found greater brain activation in the fusiform gyrus, a region responsible for face perception, while watching novel in‐group faces compared with novel out‐group faces. Similarly, it is possible that in our experiment participants attended more closely to actions of own team members than to those of other team members, and that the increased IPL activation when viewing own team actions represents an attentional modulation of normal IPL activity for perception of action. Perhaps, actions of in‐group members are more salient, either for reasons of social cognition, enhancing motor‐simulation mechanisms operating via the mirror system [Uddin et al., 1971], or by virtue of our tendency to imitate in‐group compared with out‐group members and to form social bonds within groups [Yabar et al., 2009]. It must be noted, however, that activation differences for own team compared with other team actions in our study was only present in the main fMRI experiment. In the separate, “passive‐viewing" (single‐video) condition, with identical video clips, no difference was evident for neural activation associated with own team versus other team videos. Therefore, it is unlikely that the group‐bias effects simply reflected low‐level salience or feature‐based attentional selection, perhaps primed or induced by red and blue team–based instructions. Although these results suggest that the group‐bias effects we report are not simply driven by differences in visual properties or bottom‐up visual salience of the videos, results of this passive‐viewing task must be interpreted with caution. Group membership becomes more salient in a competitive context such as the action–judgment task compared with a situation in which the distinctiveness is not emphasized such as the passive‐viewing task, and a possible limitation (although common practice with functional localizer tasks) is that the passive‐viewing task was always presented after the action–judgment task.
Although participants in both the behavioral and fMRI judgment tasks showed a significant judgment bias on average across the groups, in the fMRI experiment only 13 of 24 participants (compared with 21 of 24 in the behavioral experiment) actually showed a judgment bias toward their own team. This discrepancy might arise from the difference between the two judgment experiments. Crucially, the fMRI judgment task was modified in a way that only two conditions were included related to video duration compared with the four different video‐length conditions of the behavioral experiment. This modification was carried out to remove the “obvious” trials (i.e., those with a large time difference) and increase the number of trials with equal video clip durations. It is possible, however, that by removing those conditions for which the difference between video lengths was very salient, all trials became relatively hard to judge for the participants. This might have led some of the less motivated participants to answer in a random manner on some of the trials of the fMRI judgment task. For the fMRI analyses, we therefore divided the participants in two groups based on their judgment bias score in the paired video trials because we only expected a difference in neural responses in those participants who actually showed a judgment bias behaviorally. Crucially, every participant who showed a judgment bias also showed greater activity in the left IPL cluster when viewing own team compared with other team actions. On the IAT task, although participants who showed a group bias identified significantly with their team and participants without a bias did not, the difference between the two groups was not significant. This is not surprising given the relatively small number of participants in each group and the fact that others have found no strong linear relationship between group identification and in‐group bias [Hinkle and Brown, 2002, Mullen et al., 2005]. Although group identification is a necessary condition for in‐group bias, it is not sufficient. People can identify with their group without showing a bias against the out group.
Making explicit judgments on which team was faster involved activation of the ACC and IFG. The ACC is well known to be involved in decision making [Botvinick, 2011], and the IFG is specifically involved in perceptual decision making in uncertain situations [Heekeren et al., 1954]. We found no difference in brain activity related to group bias during the decision phase, when participants selected own team actions as faster than when they selected other team actions as faster. Previously, neural activity in the ACC, amygdala, and PFC has been reported to be influenced by group membership [Cunningham et al., 2007; Richeson et al., 1999; Rilling et al., 2003; Volz et al., 2004]; however, noticeable differences between those studies and ours might explain why we did not find significant differences in brain activity in these areas. In our study, participants were allocated to purely arbitrary groups rather than into pre‐existing ethnic or racial groups as in previous studies [Cunningham et al., 2007; Richeson et al., 1999]; although other studies show that race can be ignored if it is put orthogonal to new group membership, especially when group membership is made very salient [Van Bavel et al., 1975]. Tasks in previous studies have also involved monetary rewards or games in which win‐loss situations were salient [Rilling et al., 2003; Volz et al., 2004]. In contrast, participants in our study were asked merely to observe in‐group and out‐group members' actions to judge the relative speed of hand movements, with no feedback or reward for their judgments. People are likely to apply more cognitive effort to override their own biases when tasks clearly involve racial categorization or intergroup competition, and where rewards or benefits are associated with judgments related to the in‐group [see Amodio, 2000, for a review].
To conclude, we have shown for the first time that neural responses in the inferior parietal cortex during observation of actions are modulated depending on the social context in which they are imbedded. Our results suggest that the neural mechanisms that underlie action–perception are biased by group membership and imply that group members often do not see the actions of their own team objectively.
Supporting information
Supporting Information
Pascal Molenberghs and Veronika Halász contributed equally to this work.
REFERENCES
- Allison T, Puce A, McCarthy G. (2000): Social perception from visual cues: role of the STS region. Trends Cogn Sci 4: 267–278. [DOI] [PubMed] [Google Scholar]
- Amodio DM (2008): The social neuroscience of intergroup relations. Eur Rev Soc Psychol 19:1–54. [Google Scholar]
- Ashburn‐Nardo L, Voils CI, Monteith MJ (2001): Implicit associations as the seeds of intergroup bias: How easily do they take root? J Pers Soc Psychol 81:789–799. [DOI] [PubMed] [Google Scholar]
- Avenanti A, Sirigu A, Aglioti SM (2010): Racial bias reduces empathic sensorimotor resonance with other‐race pain. Curr Biol 20:1018–1022. [DOI] [PubMed] [Google Scholar]
- Bernstein M, Young S, Hugenberg K (2007): The cross‐category effect: Mere social categorization is sufficient to elicit an own‐group bias in face recognition. Psychol Sci 18:709–712. [DOI] [PubMed] [Google Scholar]
- Blake R, Shiffrar M (2007): Perception of human motion. Annu Rev Psychol 58:47–73. [DOI] [PubMed] [Google Scholar]
- Blakemore SJ (2008): The social brain in adolescence. Nat Rev Neurosci 9:267–277. [DOI] [PubMed] [Google Scholar]
- Bortoletto M, Mattingley JB, Cunnington R (2011): Action intentions modulate visual processing during action perception. Neuropsychologia 49:2097–2104. [DOI] [PubMed] [Google Scholar]
- Botvinick MM (2007): Conflict monitoring and decision making: Reconciling two perspectives on anterior cingulate function. J Cogn Affect Behav Neurosci 7:356–366. [DOI] [PubMed] [Google Scholar]
- Brewer MB (1979): Ingroup bias in the minimal intergroup situation: A cognitive‐motivational analysis. Psychol Bull 86:307–324. [Google Scholar]
- Brewer MB (2007): The importance of being we: Human nature and intergroup relations. Am Psychol 62:728–738. [DOI] [PubMed] [Google Scholar]
- Cunningham WA, Johnson MK, Raye CL, Gatenby JC, Gore JC, Banaji MR (2004): Separable neural components in the processing of black and white faces. Psychol Sci 15:806–813. [DOI] [PubMed] [Google Scholar]
- Dambrun M, Duarte S, Guimond S (2004): Why are men more likely to support group‐based dominance than women? The mediating role of gender identification. Br J Soc Psychol 43:287–300. [DOI] [PubMed] [Google Scholar]
- Fabbri‐Destro M, Rizzolatti G (2008): Mirror neurons and mirror systems in monkeys and humans. Physiology 23:171–179. [DOI] [PubMed] [Google Scholar]
- Fogassi L, Ferrari PF, Gesierich B, Rozzi S, Chersi F, Rizzolatti G (2005): Parietal lobe: From action organization to intention understanding. Science 308:662–667. [DOI] [PubMed] [Google Scholar]
- Friston KJ, Ashburner J, Frith CD, Poline J, Heather JD, Frackowiak RSJ (1995): Spatial realignment and normalization of images. Hum Brain Mapp 2:165–189. [Google Scholar]
- Frith U (2001): Mind blindness and the brain in autism. Neuron 32:969–979. [DOI] [PubMed] [Google Scholar]
- Frith CD (2007): The social brain? Philos Trans R Soc Lond B Biol Sci 362:671–678. [DOI] [PMC free article] [PubMed] [Google Scholar]
- Frith CD, Frith U (2007): Social cognition in humans. Curr Biol 17:R724–R732. [DOI] [PubMed] [Google Scholar]
- Gazzola V, Keysers C (2009): The observation and execution of actions share motor and somatosensory voxels in all tested subjects: Single‐subject analyses of unsmoothed fMRI data. Cereb Cortex 19:1239–1255. [DOI] [PMC free article] [PubMed] [Google Scholar]
- Golby AJ, Gabrieli JDE, Chiao JY, Eberhardt JL (2001): Differential fusiform responses to same‐ and other‐race faces. Nat Neurosci 4:845–850. [DOI] [PubMed] [Google Scholar]
- Greenwald AG, McGhee DE, Schwartz JLK (1998): Measuring individual differences in implicit cognition: The implicit association test. J Pers Soc Psychol 74:1464–1480. [DOI] [PubMed] [Google Scholar]
- Greenwald AG, Poehlman TA, Uhlmann EL, Banaji MRJ (2009): Measuring individual differences in implicit cognition: The implicit association test. J Pers Soc Psychol 97:17–41. [DOI] [PubMed] [Google Scholar]
- Gutsell JN, Inzlicht M (2010): Empathy constrained: Prejudice predicts reduced mental simulation of actions during observation of outgroups. J Exp Soc Psychol 46:841–845. [Google Scholar]
- Hastorf A, Cantril H (1954): They saw a game: A case study. J Abnorm Soc Psychol 49:129–134. [DOI] [PubMed] [Google Scholar]
- Heekeren HR, Marrett S, Ungerleider LG (2008): The neural systems that mediate human perceptual decision making. Nat Rev Neurosci 9:467–479. [DOI] [PubMed] [Google Scholar]
- Hewstone M, Rubin M, Willis H (2002): Intergroup bias. Annu Rev Psychol 53:575–604. [DOI] [PubMed] [Google Scholar]
- Hinkle S, Brown R (1990): Intergroup comparisons and social identity: Some links and lacunae In: Abrams D, Hogg M, editors. Social Identity Theory: Constructive and Critical Advances. London: Harvester Wheatsheaf; pp 48–70. [Google Scholar]
- Holmes AP, Friston KJ (1998): Generalisability, random effects and population inference. Neuroimage 7:S754. [Google Scholar]
- Iacoboni M, Dapretto M (2006): The mirror neuron system and the consequences of its dysfunction. Nat Rev Neurosci 7:942–951. [DOI] [PubMed] [Google Scholar]
- Molenberghs P, Cunnington R, Mattingley JB (2009): Is the mirror neuron system involved in imitation? A short review and meta‐analysis. Neurosci Biobehav Rev 33:975–980. [DOI] [PubMed] [Google Scholar]
- Molenberghs P, Brander C, Mattingley JB, Cunnington R (2010): The role of the superior temporal sulcus and the mirror neuron system in imitation. Hum Brain Mapp 31:1316–1326. [DOI] [PMC free article] [PubMed] [Google Scholar]
- Molenberghs P, Cunnington R, Mattingley JB (2012a): Brain regions with mirror properties: A meta‐analysis of 125 human fMRI studies. Neurosci Biobehav Rev 36:341–349. [DOI] [PubMed] [Google Scholar]
- Molenberghs P, Hayward L, Mattingley JB, Cunnington R (2012b): Activation patterns during action observation are modulated by context in mirror system areas. Neuroimage 59:608–615. [DOI] [PubMed] [Google Scholar]
- Molnar‐Szakacs I, Wu AD, Robles FJ, Iacoboni M (2007): Do you see what I mean? Cortico‐spinal excitability during observation of culture‐specific gestures. PLoS ONE 2:e626. [DOI] [PMC free article] [PubMed] [Google Scholar]
- Mühlau M, Hermsdörfer J, Goldenberg G, Wohlschläger AM, Castrop F, Stahl R, Röttinger M, Erhard P, Haslinger B, Ceballos‐Baumann AO, Conrad B, Boecker H (2005): Left inferior parietal dominance in gesture imitation: An fMRI study. Neuropsychologia 43:1086–1098. [DOI] [PubMed] [Google Scholar]
- Mullen B, Brown R, Smith C (1992): Ingroup bias as a function of salience, relevance, and status: An integration. Eur J Soc Psychol 22:103–122. [Google Scholar]
- Nosek BA, Greenwald AG, Banaji MR (2005): Understanding and using the Implicit Association Test. II. Methodological issues. Method variables and construct validity. Pers Soc Psychol Bull 31:166–180. [DOI] [PubMed] [Google Scholar]
- Otten S, Wentura D (1999): About the impact of automaticity in the minimal group paradigm: Evidence from the affective priming tasks. Eur J Soc Psychol 29:1049–1071. [Google Scholar]
- Richeson JA, Baird AA, Gordon HL, Heatherton TF, Wyland CL, Trawalter S, Shelton,JN (2003): An fMRI investigation of the impact of interracial contact on executive function. Nat Neurosci 6:1323–1328. [DOI] [PubMed] [Google Scholar]
- Rilling JK, Dagenais JE, Goldsmith DR, Glenn AL, Pagnoni G (2008): Social cognitive neural networks during in‐group and out‐group interactions. Neuroimage 41:1447–1461. [DOI] [PubMed] [Google Scholar]
- Rizzolatti G, Craighero L (2004): The mirror‐neuron system. Annu Rev Neurosci 27:169–192. [DOI] [PubMed] [Google Scholar]
- Rizzolatti G, Fabbri‐Destro M (2008): The mirror system and its role in social cogntion. Curr Opin Neurobiol 18:179–184. [DOI] [PubMed] [Google Scholar]
- Rizzolatti G, Sinigaglia C (2010): The functional role of the parieto‐frontal mirror circuit: Interpretations and misinterpretations. Nat Neurosci Rev 11:264–274. [DOI] [PubMed] [Google Scholar]
- Sanfey AG (2007): Social decision‐making: Insights from game theory and neuroscience. Science 318:598–602. [DOI] [PubMed] [Google Scholar]
- Saxe R, Xiao DK, Kovacs G, Perrett DI, Kanwisher N. (2004): A region of right posterior superior temporal sulcus responds to observed intentional actions. Neuropsychologia 42: 1435–1446. [DOI] [PubMed] [Google Scholar]
- Sherif M, Harvey OJ, White BJ, Hood WR, Sherif CW (1961): Intergroup Conflict and Cooperation: The Robbers Cave Experiment. Norman: University of Oklahoma Press. [Google Scholar]
- Shmuelof L, Zohary E (2008): Mirror‐image representation of action in the anterior parietal cortex. Nat Neurosci 11:1267–1269. [DOI] [PubMed] [Google Scholar]
- Sidanius J, Levin S, Liu J, Pratto F (2000): Social dominance orientation, anti‐egalitarianism and the political psychology of gender: An extension and cross‐cultural replication. Eur J Soc Psychol 30:41–67. [Google Scholar]
- Tajfel H, Turner JC (1986): The social identity theory of group behavior In: Worchel S, Austin WC, editors. Psychology of Intergroup Relations, 2nd ed Chicago: Nelson‐Hall; pp 7–24. [Google Scholar]
- Tajfel H, Billig MG, Bundy RP, Flament C (1971): Social categorization and intergroup behaviour. Eur J Soc Psychol 1:149–178. [Google Scholar]
- Turner JC (1975): Social comparison and social identity: Some prospects for intergroup behaviour. Eur J Soc Psychol 5:5–34. [Google Scholar]
- Uddin LQ, Iacoboni M, Lange C, Keenan JP (2007): The self and social cognition: The role of cortical midline structures and mirror neurons. Trends Cogn Sci 11:153–157. [DOI] [PubMed] [Google Scholar]
- Van Bavel JJ, Packer DJ, Cunningham WA (2008): The neural substrates of in‐group bias: A functional magnetic resonance imaging investigation. Psychol Sci 19:1131–1139. [DOI] [PubMed] [Google Scholar]
- Vanman EJ, Saltz JL, Nathan LR, Warren JA (2004): Racial discrimination by low‐prejudiced Whites facial movements as implicit measures of attitudes related to behavior. Psychol Sci 15:711–714. [DOI] [PubMed] [Google Scholar]
- Van Overwalle F (2009): Social cognition and the brain: A meta‐analysis. Hum Brain Mapp 30:829–858. [DOI] [PMC free article] [PubMed] [Google Scholar]
- Volz KG, Kessler T, von Cramon DY (2009): In‐group as part of the self: In‐group favoritism is mediated by medial prefrontal cortex activation. Soc Neurosci 4:244–260. [DOI] [PubMed] [Google Scholar]
- Wyk BC, Hudac CM, Carter EJ, Sobel DM, Pelphrey KA (2009): Action understanding in the superior temporal sulcus region. Psychol Sci 20:771–777. [DOI] [PMC free article] [PubMed] [Google Scholar]
- Yabar Y, Johnston L, Miles L, Peace V (2006): Implicit behavioral mimicry: Investigating the impact of group membership. J Nonverbal Behav 30:97–113. [Google Scholar]
Associated Data
This section collects any data citations, data availability statements, or supplementary materials included in this article.
Supplementary Materials
Supporting Information