

Abstract
Characterization of large‐scale brain networks using blood‐oxygenation‐level‐dependent functional magnetic resonance imaging is typically based on the assumption of network stationarity across the duration of scan. Recent studies in humans have questioned this assumption by showing that within‐network functional connectivity fluctuates on the order of seconds to minutes. Time‐varying profiles of resting‐state networks (RSNs) may relate to spontaneously shifting, electrophysiological network states and are thus mechanistically of particular importance. However, because these studies acquired data from awake subjects, the fluctuating connectivity could reflect various forms of conscious brain processing such as passive mind wandering, active monitoring, memory formation, or changes in attention and arousal during image acquisition. Here, we characterize RSN dynamics of anesthetized macaques that control for these accounts, and compare them to awake human subjects. We find that functional connectivity among nodes comprising the “oculomotor (OCM) network” strongly fluctuated over time during awake as well as anaesthetized states. For time dependent analysis with short windows (<60 s), periods of positive functional correlations alternated with prominent anticorrelations that were missed when assessed with longer time windows. Similarly, the analysis identified network nodes that transiently link to the OCM network and did not emerge in average RSN analysis. Furthermore, time‐dependent analysis reliably revealed transient states of large‐scale synchronization that spanned all seeds. The results illustrate that resting‐state functional connectivity is not static and that RSNs can exhibit nonstationary, spontaneous relationships irrespective of conscious, cognitive processing. The findings imply that mechanistically important network information can be missed when using average functional connectivity as the single network measure. Hum Brain Mapp 34:2154–2177, 2013. © 2011 Wiley Periodicals, Inc.
Keywords: functional connectivity, macaque, resting‐state, dynamics, spontaneous activity, functional MRI (fMRI), nonstationary, fluctuations
INTRODUCTION
Since the first observation that task‐independent fluctuations of the blood‐oxygenation‐level‐dependent (BOLD) time series between different areas was correlated [Ogawa et al., 1993] and the demonstration of the first maps based on these spatiotemporal coherences [Biswal et al., 1995], resting‐state functional magnetic resonance imaging (RS‐fMRI) has become an important tool for characterizing functional brain networks. These analyses have shown that the hemodynamic signals recorded from cortical and subcortical areas are synchronized, forming characteristic resting‐state networks (RSN) in the absence of external input or stimulus‐evoked cognitive processing [Beckmann et al., 2005; Damoiseaux et al., 2006]. RSNs are shaped by structural connectivity [Greicius et al., 2009; Honey et al., 2009; Kelly et al., 2010; Margulies et al., 2009; Vincent et al., 2007], closely resemble task‐based activation networks [Biswal et al., 1995; Fox et al., 2006a; Smith et al., 2009; Vincent et al., 2007], and are believed to be of neuronal origin [Britz et al., 2010; Laufs, 2008; Mantini et al., 2007; Musso et al., 2010; Nir et al., 2008; Shmuel and Leopold, 2008], though their physiological origin remains uncertain [Buckner and Vincent, 2007; Fox and Raichle, 2007]. Coherence of the slow hemodynamic fluctuations have been shown in all mammals studied to date including both awake and anesthetized states in mice, rats, monkeys, and humans [Greicius et al., 2008; Hutchison et al., 2010, 2011; Jonckers et al., 2011; Kiviniemi et al., 2005; Vincent et al., 2007]. The conservation of this phenomenon across species suggests that it is a fundamental mammalian brain property.
RSN activity and within‐network connection properties have been previously demonstrated to be both state‐dependent [Bianciardi et al., 2009; Greicius et al., 2008; Horovitz et al., 2009] and task‐modulated [Esposito et al., 2006; Fransson, 2006; Sun et al., 2007]. Recent work has now drawn into question the stability of RSNs in the absence of altered cognitive states or overt behavioral shifts [Britz et al., 2010; Chang and Glover, 2010; Majeed et al., 2009; Musso et al., 2010; Sato et al., 2006]. Notably, Chang and Glover 2010 demonstrated that the coherence, phase, and strength of functional connections between the posterior cingulate cortex (PCC) and other areas of the default‐mode network in awake human subjects varied on the scale of seconds to minutes over the duration of a standard resting‐state scan. Resting‐state simulation [Honey et al., 2007; Sporns, 2010, p. 174] and magnetoencephalography (MEG) investigations have also shown time‐varying RSN topology. The later revealing transient formation of more complete and characteristic RSNs when taking into account the nonstationarity of the MEG signal correlations [de Pasquale et al., 2010]. Taken together, these results cast doubt on the underlying assumptions of temporal stationarity implicit in common RSN analyses.
An extensive number of electrophysiological studies have reported spontaneous (stimulus‐independent) time‐varying, network dynamics and ongoing brain activity over a wide range of temporal and spatial scales [for review see Ringach, 2009; Raichle, 2010; Sadaghiani et al., 2010; Vogels et al., 2005]. These electrophysiological signatures are possibly related to the aforementioned dynamic variations of RSN connectivity. To identify possible links, it is necessary to quantify and characterize the ongoing dynamic shifts in functional network architecture as they become apparent in RS‐fMRI. One limitation in the characterization of the dynamics of RS‐fMRI that has been pointed out by Chang and Glover 2010 and others [Britz et al., 2010; Mantini et al., 2007; Musso et al., 2010; Sato et al., 2006], is the inability to ensure an absence of conscious processes during image acquisition. When given unconstrained cognitive periods, awake human subjects engage in a diverse range of mental activities that can alter the brain's functional organization [Shirer et al., 2012]. These can include a spectrum of stimulus‐independent activities such as mind wandering [Christoff et al., 2009; Mason et al., 2007] or more active, stimulus‐oriented processing such as monitoring the internal or external environment [Gilbert et al., 2007]. Over periods of several minutes, there are also changes related to vigilance, attention, and arousal [Paus et al., 1997], in addition to memory formation [Squire and Zola‐Morgan, 1991]. Recent evidence has also shown that sub‐millimeter head motion during scanning can have significant effects on RS‐fMRI network measures [van Dijk et al., 2012]. These can occur even when preprocessing corrects for motion, because correction algorithms account for gross voxel shifting, not for the disruptions of the field homogeneity.
To examine the role of these issues in the determination of RSN connectivity maps, this study examined the resting‐state dynamics of the nonhuman primate (Macca fascicularis) under anesthesia and compared them to the same networks in awake human subjects. Isoflurane anesthesia induces a controlled state of central nervous system suppression characterized by a loss of consciousness, amnesia, analgesia, ablation of autonomic reflexes, as well as a suppression of motor responses [Brown et al., 2010; Veselis, 2001]. Therefore, anesthesia eliminates conscious processes as a complicating factor. The use of anesthesia, together with head‐post immobilization, also allows for the elimination of active subject motion as a confound. Seed regions were selected throughout the previously identified macaque [Hutchison et al., 2011, in press; Vincent et al., 2007] and human [Beckmann et al., 2005; Damoiseaux et al., 2006] frontoparietal RSNs. The potentially homologous networks [Hutchison et al., in press] are putatively responsible for attention and oculomotor (OCM) functions, encompassing many of the well‐known saccade‐related brain areas in both species [Baker et al., 2006; Brown et al., 2007; Desouza et al., 2003; Ford et al., 2009; Johnston and Everling, 2008; Koyama et al., 2004; Luna et al., 1998; Paus, 1996]. As such, it is herein referred to as the OCM network. The default‐mode network, which was examined by Chang and Glover 2010, was not chosen because network homologies between the species are currently not well established and there are known brain state dependencies [Greicius et al., 2008; Horovitz et al., 2008, 2009]. Instead, the OCM RSN represents a distributed and well‐studied network of both species and is supported by extensive electrophysiological and histological mapping [Johnston and Everling, 2008; Wurtz and Goldberg, 1989]. In addition, it will allow us to investigate the generalizability of the dynamic network characteristics.
A sliding‐window correlation procedure was employed to verify the following hypotheses: (1) that RSN connectivity is not static and that the spatial pattern of functional connectivity depends on the temporal scale that is being examined; (2) that ongoing RSN dynamics represent an evolutionarily preserved aspect of brain function, and therefore should be exhibited in the brain networks of other mammalian species; and (3) that the fluctuating relationships between brain areas represent an intrinsic and spontaneous phenomenon, independent of conscious processes, and therefore should transcend levels of consciousness.
MATERIALS AND METHODS
Macaque Monkeys
All surgical and experimental procedures were carried out in accordance with the Canadian Council of Animal Care policy on the use of laboratory animals and approved by the Animal Use Subcommittee of the University of Western Ontario Council on Animal Care. Data were collected from six macaque monkeys (M. fascicularis; four females) whose weights ranged from 3.6 to 5.3 kg (mean ± standard deviation = 4.58 ± 1.4 kg). Before the imaging experiments, an MRI‐compatible custom‐built acrylic head post was anchored to the skull with 6‐mm ceramic bone screws (Thomas Recording, Giessen, Germany) and dental acrylic that served to restrain the head during image acquisition and eliminate motion. In preparation for image acquisition, each monkey was injected with intramuscular injections of atropine (0.4 mg/kg), ipratropium (0.025 mg/kg), and ketamine hydrochloride (7.5 mg/kg), followed by intravenous administration of 3 mL propofol (10 mg/mL) via the saphenous vein. Anesthesia was then maintained using 1.5% isoflurane mixed with oxygen following oral intubation with an endotracheal tube. Animals were spontaneously ventilating throughout the duration of scanning and the eyes were closed. The monkey was then placed in a custom‐built monkey chair with its head immobilized using the head post and inserted into the magnet bore, at which time the isoflurane level was lowered to 1%. Physiological parameters were continuously monitored throughout the duration of scanning (rectal temperature via a fiber‐optic temperature probe [FISO, Quebec City, QC] = 36.5°C; respiration via bellows [Siemens Corp., Union, NJ] = 25–30 breaths/min; end‐tidal CO2 via capnometer [Covidien‐Nellcor, Boulder, CO] = 24–28 mm Hg). Animal body temperature was maintained using a heating disk (Snugglesafe, Littlehampton, West Sussex, UK) and thermal insulation.
Data Acquisition and Preprocessing of Monkey Scans
Data were acquired on an actively shielded 7‐T 68‐cm horizontal bore scanner with a DirectDrive console (Agilent, Santa Clara, CA) with a Siemens AC84 gradient subsystem (Erlangen, Germany) operating at a slew rate of 350 mT/m/s. An in‐house designed and manufactured conformal 5‐channel transceive primate‐head RF coil was used. Magnetic field optimization (B0 shimming) was performed using an automated 3D mapping procedure [Klassen and Menon, 2004] over the specific imaging volume of interest. For each monkey, two runs of 300 continuous echo‐planar imaging (EPI) functional volumes [repetition time (TR) = 2,000 ms; echo time (TE) = 16 ms; flip angle = 70°; slices = 30; matrix = 72 × 72; field of view (FOV) = 96 mm × 96 mm; acquisition voxel size = 1.3 mm × 1.3 mm × 1.5 mm] were acquired. Acquisition time of each scan was 10 min. EPI images were acquired with GRAPPA at an acceleration factor of 2. Every image was corrected for physiological fluctuations using navigator echo correction. A high‐resolution T2‐weighted anatomical reference volume was acquired along the same orientation as the functional images using a turbo spin echo acquisition scheme (TR = 5,000 ms; TE = 38.6 ms; echo train length = 5, effective echo = 3, slices = 30, matrix = 256 × 250; FOV = 96 mm × 96 mm; acquisition voxel size = 375 μm × 384 μm × 1.5 mm).
All preprocessing was implemented using the FMRIB Software Library (FSL; http://www.fmrib.ox.ac.uk.) toolbox and included motion correction (six parameter affine transformation), brain extraction, spatial smoothing (Gaussian kernel of full‐width at half‐maximum [FWHM] 3 mm applied to each volume separately), high‐pass temporal filtering (Gaussian‐weighted least‐squares straight line fitting with sigma = 100 s), low‐pass temporal filtering (half‐width at half‐maximum [HWHM] = 2.8 s, Gaussian filter), and normalization (12 degrees‐of‐freedom [DOF] linear affine transformation) to the F99 atlas template [van Essen, 2004; see http://sumsdb.wustl.edu/sums/macaquemore.do]. No lag correction for the interleaved slice order was used, as the full width at half maximum of the autocorrelation function for a time series was ∼12 s suggesting that errors in lags brought about by slice order differences in the 2 s TR period are minimal.
OCM Network Identification in Monkeys
A spherical seed (radius = 1.5 mm and volume = 14.14 mm3) was placed in the anterior bank of the arcuate sulcus of the left hemisphere in F99 atlas space [van Essen, 2004; Supporting Information Fig. 1], an area corresponding to the frontal eye fields [FEF; Area 8a, Bruce and Goldberg, 1985]. The seed location has been previously shown to reveal the resting‐state OCM network of the anesthetized macaque [Hutchison et al., in press]. A voxelwise correlation analysis was then conducted using a three‐level analysis procedure. The mean time‐course over all voxels within the FEF seed region was extracted for each animal and each scanning session and then correlated (with zero lag) with every brain voxel at the individual subject level for each corresponding scanning session. The results were then averaged across sessions after a Fisher z‐transform, and then averaged across monkeys before being converted back to correlation values. The group correlation values were projected from volume data to the F99 cortical surface using the CARET enclosed‐voxel method [van Essen et al., 2001]. Group pairwise correlations were also calculated in the same manner between all seed pair combinations to derive the group connectivity matrix.
In addition to the left hemisphere FEF seed, a corresponding contralateral FEF seed in the right hemisphere was selected. Seven other seeds of the same size as the left FEF seed (radius = 1.5 mm) were placed in each hemisphere to encompass bilaterally symmetric regions having voxels with the highest correlation from the group‐averaged correlation map (Supporting Information Fig. 1). These 14 additional seeds included the anterior prefrontal cortex (aPFC) in area 9/10 m, the supplementary motor area (SMA) in area 6, the PCC in area 23c/b, the intraparietal area (IP) in area 5/lateral intraparietal area, visual area 4 (V4), middle superior temporal cortex (MST), and the precuneus (PGM) in area 7. To serve as nongray matter controls, four seeds (radius = 1.5 mm) were placed bilaterally (eight total) throughout the white matter (WM).
Ventral Premotor Network Identification in Monkeys
To assess whether network dynamics are generalizable to other RSNs, the previously identified, bilaterally homologous “ventral premotor” (vPM) RSN [Hutchison et al., 2011] was also identified through the same correlational analysis approach used for the OCM RSN with a seed (radius = 1.5 mm) placed in the left primary ventral motor area (area 1/F1). The homologous right hemisphere seed and four additional bilateral sets of seeds (10 total seed regions) were selected from the group correlation map to encompass bilaterally symmetric regions having voxels with the highest correlation and corresponding to previously identified anatomical areas. These included seeds in the somatosensory cortex (areas 2/1), the para‐auditory cortex, the lateral secondary somatosensory cortex (S2E), and the ventral‐cadual subdivision of the arm, neck, and face/mouth area (area 6/F4) [Paxinos et al., 1999].
Human Participants
Data were obtained from twelve right‐handed volunteers (mean age = 26.2 years; four females) who were recruited from The University of Western Ontario (London, ON, Canada). Signed informed consent was obtained in accordance with procedures approved by the University of Western Ontario Health Sciences Research Ethics Board.
Data Acquisition and Preprocessing of Human Scans
Imaging was performed on a 3 T Siemens TIM MAGNETOM Trio MRI scanner. For each participant, one run of 360 continuous functional volumes was collected using a T2*‐weighted single‐shot gradient‐echo EPI acquisition sequence with interleaved slice order (TR = 2,000 ms; slice thickness = 3.5 mm; in‐plane resolution = 3 mm × 3 mm; TE = 30 ms; FOV = 240 mm × 240 mm; matrix size = 80 × 80; flip angle = 90°) with a 32‐channel receive‐only head coil. Each volume was comprised of 34 contiguous (no gap) axial‐oblique slices acquired at a ∼30° caudal tilt with respect to the plane of the anterior and posterior commissure, providing near whole brain coverage. Acquisition time of each scan was 12 min. Subjects were instructed to rest with eyes open while fixating at a central location. A T1‐weighted anatomical image was collected using an MPRAGE sequence (TR = 2,300 ms; TE = 2.98 ms; FOV = 192 mm × 240 mm × 256 mm; matrix size = 192 × 240 × 256; flip angle = 9°; acquisition voxel size = 1 mm × 1 mm × 1 mm).
Image preprocessing was implemented in a similar fashion as carried out with the monkey data using the FSL toolbox. This consisted of slice time correction for interleaved acquisitions (using Fourier‐space time‐series phase shifting), motion correction (6‐parameter affine transformation), brain extraction, spatial smoothing (using a Gaussian kernel of FWHM 6 mm applied to each volume separately), high‐pass temporal filtering (Gaussian‐weighted least‐squares straight line fitting with sigma = 100 s), low‐pass temporal filtering (HWHM = 2.8 s, Gaussian filter), and normalization (12 DOF linear affine transformation) to the standard 152‐brain MNI template (voxel size = 2 mm × 2 mm × 2 mm).
OCM Network Identification in Humans
To allow localization of the frontal eye fields in humans, a saccade task was performed during a separate imaging session with the same subjects (data not shown). Participants looked toward one of two object locations following a vision and planning phase. Using the group‐averaged task‐based map as a reference, a spherical seed (radius = 5 mm and volume = 524 mm3) was placed at the junction of the superior frontal sulcus and the anterior bank of the precentral sulcus of the left hemisphere in MNI atlas space [Amiez et al., 2006; Brown et al., 2004; Ford et al., 2005; Luna et al., 1998; Paus, 1996]. A voxelwise correlation analysis was then conducted in a similar manner used for the monkeys. The mean time‐course over all voxels within the FEF seed region was extracted for each subject and then correlated (with zero lag) with every brain voxel at the individual subject level. After a Fisher z‐transform, the results were averaged across subjects and then converted back to correlation values. The group correlation values were projected from volume data to the PALS‐B12 cortical surface [van Essen, 2005] using the CARET (http://www.nitrc.org/projects/caret) enclosed‐voxel method [van Essen et al., 2001]. Group pairwise correlations were also calculated in the same manner between all seed pair combinations to derive the group connectivity matrix.
In addition to the left hemisphere FEF seed, a corresponding contralateral FEF seed in the right hemisphere was selected. Eight other seeds of the same size as the left FEF seed (radius = 5 mm) were placed based on the generated group correlation map including seeds in the left and right hemisphere corresponding to the dorsal lateral prefrontal cortex (DLPFC), vPM area, the intraparietal sulcus (IPS), anterior intraparietal cortex (AIP), visual area 4 (V4), and the PGM and two midline seeds in the supplementary eye fields (SEF) and primary visual area (V1) (see Supporting Information Fig. 2). To examine nongray matter areas, eight seeds were placed bilaterally throughout the WM.
Sliding Window Correlation Analysis
To explore the effects of possible time‐varying dynamics, the correlational analysis of seed regions were repeated with truncated versions of the time series. The correlation between the time series derived from the left FEF seed (monkeys and humans) and left vPMs seeds (monkeys) and all brain voxels was calculated for truncation window sizes of 240 s (120 volumes), 120 s (60 volumes), 60 s (30 volumes), and 30 s (15 volumes). These window sizes were selected as it has been previously demonstrated that the average correlation values within and between RSNs stabilize at approximately 240 s [van Dijk et al., 2009]. The remaining window sizes were then selected by decreasing the original window length by a factor of two. A 15 s window and smaller was not used because the limited number of data points (volumes) did not result in significant correlations.
The window was advanced in increments of one time point along the entire time series and the correlation recalculated. This was repeated for all possible shifts of the window within the 300 and 360 images of a run for the monkey and human data, respectively. The voxelwise sliding window correlation between the left FEF seed and all individual brain voxels was calculated at the single subject, single scan level. The pairwise sliding window correlations between each of the 16 seed regions were also calculated for all animals and all scans.
Graph Analysis
To graphically represent the OCM RSN at different time points, a Kamada–Kawai algorithm [Kamada and Kawai, 1989] was used. The process arranges the network nodes such that correlated nodes are closer together and weakly correlated nodes are further apart. The distance was calculated based on the absolute values of correlation coefficients. The graphs' edges were then thresholded at r ≥ |0.4|. Degree centrality, the number of edges of a node that connect it to other nodes, was also calculated [Hagmann et al., 2008].
RESULTS
Monkey OCM and vPM Network Identification
Voxelwise correlation with the time series from the left FEF seed at the group level revealed strong positive functional connectivity with multiple brain areas (Fig. 1) that were in agreement with previous results of task‐based [Baker et al., 2006; Ford et al., 2009; Koyama et al., 2004; Vincent et al., 2007] and resting‐state [Hutchison et al., 2011, in press; Vincent et al., 2007] OCM network investigations of the macaque brain. There were no significant negative correlations. The strongest positive correlations were found in the ipsilateral and contralateral aPFC, FEF, SMA, PCC, IP, V4, MST, and PGM (see Supporting Information Fig. 3 for individual connectivity maps). To explore the dynamics of the OCM RSN, sixteen cortical seeds within this network (as described in Methods section) were chosen for further analysis (Supporting Information Fig. 1).
Figure 1.
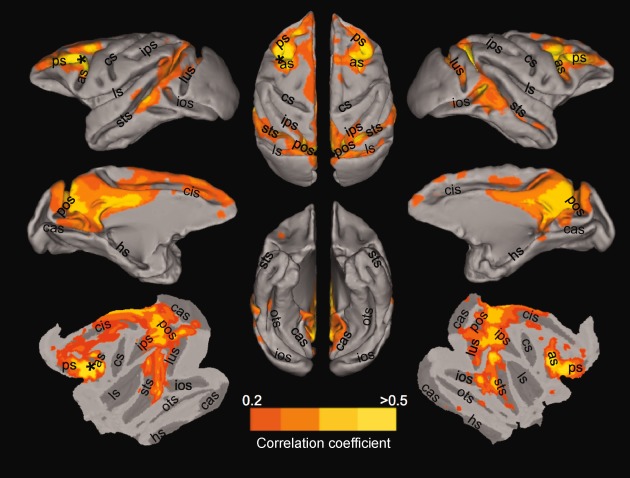
Group‐averaged “oculomotor” network following correlation analysis of isoflurane‐anesthetized macaques (N = 6) with a seed placed in the anterior bank of the arcuate sulcus corresponding to the left frontal eye fields (FEF; black asterisks). The lateral, medial, and flattened cortical views of the left (Column 1) and right (Column 3) hemisphere in addition to the dorsal and ventral views (Column 2) are overlaid with thresholded correlation maps normalized to the space of the F99 template [van Essen, 2004]. No negative correlations were present at r < −0.2. Labels indicate prominent sulci. as, arcuate sulcus; cas, calcarine sulcus; cis, cingulate sulcus; cs, central sulcus; hs, hippocampal sulcus; ios, inferior occipital sulcus; ips, intraparietal sulcus; ls, lateral sulcus, lus, lunate sulcus; ots, occipito‐temporal sulcus; sf, sylvian fissure; sts, superior temporal sulcus; pos, parieto‐occipital sulcus; ps, principal sulcus. [Color figure can be viewed in the online issue, which is available at http://wileyonlinelibrary.com.]
Voxelwise correlation with the time series from the left ventral motor area (area 1/F1) seed at the group level revealed strong positive functional connectivity with homologous structures in both hemispheres (Supporting Information Fig. 4) that closely matched the vPM RSN revealed by independent component analysis of the same data set [Hutchison et al., 2011]. The strongest positive correlations were found across somatosensory cortex (areas 2/1), the para‐auditory cortex, the lateral secondary somatosensory cortex (S2E), and the ventral‐cadual subdivision of the arm, neck, and face/mouth area (area 6/F4) [Paxinos et al., 1999]. Similar to the OCM network, there were no significant negative correlations.
Group pairwise cross correlation of all seeds revealed strong intranetwork connectivity of both the OCM and vPM networks (Fig. 2). The networks were independent of one another and seeds of both networks were not correlated with WM control seeds. All seed time courses were found to be stationary and not possess a unit root (Dickey–Fuller test, P > 0.05) suggesting a stable mean and variance over time.
Figure 2.
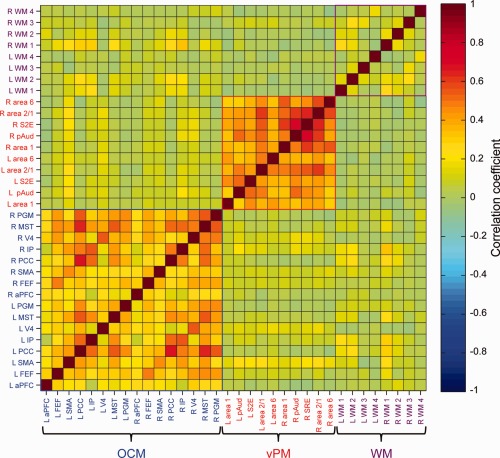
Average pairwise correlation matrix of resting‐state BOLD time‐courses from 16 “oculomotor” (OCM) network, 10 ventral premotor (vPM) network, and eight white matter (WM) seeds for isoflurane‐anesthetized macaques (N = 6). Abbreviations are indicated in the text. [Color figure can be viewed in the online issue, which is available at http://wileyonlinelibrary.com.]
Human OCM Network Identification
To validate the methodology, test interspecies similarities, and rule out anesthesia as the cause of the observed results, we investigated the OCM RSN in the awake human brain. Voxelwise correlation with the time series from the left FEF seed at the group level revealed strong positive functional connectivity with multiple distributed brain areas (Fig. 3). The RSN encompassed multiple areas that have been shown to be modulated during OCM tasks [Brown et al., 2004, 2007; DeSouza et al., 2003; Luna et al., 1998] and closely resembled the previously identified OCM/dorsal attention network in resting‐state investigations [Beckmann et al., 2005; Damoiseaux et al., 2006]. The strongest positive correlations were found in the ipsilateral and contralateral DLPFC, vPM, FEF, SEF, IPS, AIP, PGM, V4, and V1. There were no significant negative correlations (see Supporting Information Fig. 5 for individual human connectivity maps). Similar to the analysis of the monkey scans, 16 seeds were selected from the group map (Supporting Information Fig. 2; see Material and Methods section for details). Group pairwise cross correlation of all seeds revealed strong intranetwork connectivity of the OCM (Fig. 4) with none to weak connectivity with WM control seeds.
Figure 3.
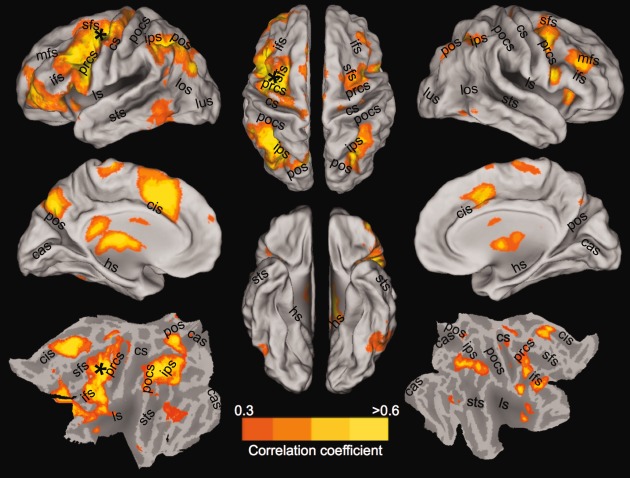
Group‐averaged “oculomotor” network following correlation analysis of awake human subjects (N = 12) with a seed placed in the left frontal eye fields (black asterisks). The lateral, medial, and flattened cortical views of the left (Column 1) and right (Column 3) hemisphere in addition to the dorsal and ventral views (Column 2) are overlaid with thresholded correlation maps normalized to the space of the PALS‐B12 template [van Essen, 2005]. No negative correlations were present at r < −0.3. Labels indicate prominent sulci. Note that the correlation threshold differs between human and monkey maps shown in Figure 1. cas, calcarine sulcus; cis, cingulate sulcus; cs, central sulcus; ifs, inferior frontal sulcus; ls, lateral sulcus; lus, lunate sulcus; pos, parieto‐occipital sulcus; pocs, posterior central sulcus; prcs, precentral sulcus; sfs, superior frontal sulcus; sts, superior temporal sulcus. [Color figure can be viewed in the online issue, which is available at http://wileyonlinelibrary.com.]
Figure 4.
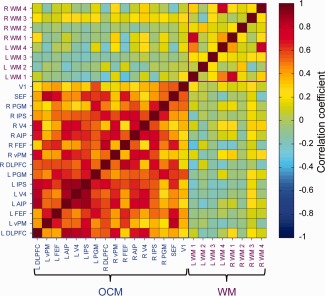
Average pairwise correlation matrix of resting‐state BOLD time‐courses from 16 “oculomotor” (OCM) network and eight white matter (WM) seeds for awake human subjects (N = 12). Abbreviations are indicated in the text. [Color figure can be viewed in the online issue, which is available at http://wileyonlinelibrary.com.]
Transient Network States
To assess the stability of the OCM RSN's spatial architecture, five time points were selected across the duration of the scan and analyzed. For a window size of 60 s (Fig. 5; for window sizes of 30 s, 120 s, and 240 s, see Supporting Information Figs. 6–8, respectively), comparison of the cross‐correlation matrices (Column 1), voxelwise FEF correlation maps (Columns 2 and 3), and graph representations (Column 4, thresholded at r ≥ 0.4) demonstrated large, apparent differences in connectivity profiles within a single scan (M2, Scan 2) not captured in the single‐subject average (bottom row). The pairwise correlation matrix revealed periods of strong synchronization (50–110 s) and at other times, an almost complete breakdown of the network (268–328 s). Changing network architecture can also be observed in the graph representation (Column 4) of the OCM RSN. Node arrangement, network inclusion, and degree centrality all vary at the different time points. Beyond the seeds defined by the group averaged FEF correlation map, the voxelwise plots showed strongly (both negatively and positively) correlated cortical areas with the left FEF that were not captured when using the average time‐course (Fig. 5). During the first selected time window, the entire anterior cingulate cortex and PFC are synchronized with the left FEF. Primary visual areas are also transiently correlated at multiple time points. Negatively correlated regions that approach r = −1 occur throughout the scan between nodes of the OCM network and also distributed throughout the cortex. The unique spatial profiles do not emerge in the average or at longer time windows. Spontaneous changes in network connectivity are particularly evident when visualizing all successive sliding window increments. We visualize these dynamics in Supporting Information Movies 1 and 2, which show pairwise seed correlations and voxelwise left FEF seed correlations, respectively, for all window sizes across time. Changes in network states, including strong synchronization (26–86 s), network breakdown (102–162 s), and transient anticorrelated regions (280–340 s) can also be seen in awake human subjects (Fig. 6; Subject 7).
Figure 5.
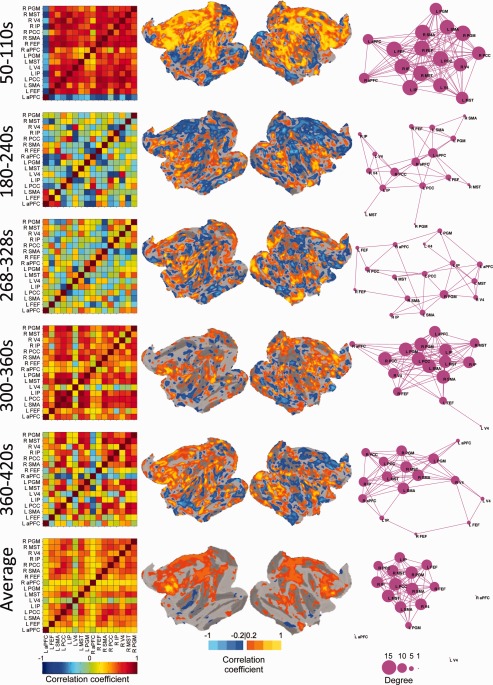
Network changes across time with a sliding‐window correlation size of 60 s for a representative isoflurane‐anesthetized monkey (M2, Scan 2). The top five rows represent a single windowed correlation between the times. The bottom row displays the average for the entire run. Column 1 shows the pairwise correlation matrix of “oculomotor” network seeds in the same fashion as the blue bounded box in Figure 2. Columns 2 and 3 display the flattened cortical views of the left and right hemisphere, respectively, overlaid with voxelwise correlation maps for the left FEF seed normalized to the space of the F99 template [van Essen, 2004]. Column 4 displays the graph representation of the functional “oculomotor” network connectivity in which each seed represents a node and pairwise correlation r < 0.4 represented by an edge. The size of the node represents its degree centrality. For window sizes of 30, 120, and 240, see Supporting Information Figs. 6–8, respectively. For all time points of pairwise correlations, see Supporting Information Movie 1. For all time points of voxelwise left FEF correlation see Supporting Information Movie 2. [Color figure can be viewed in the online issue, which is available at http://wileyonlinelibrary.com.]
Figure 6.
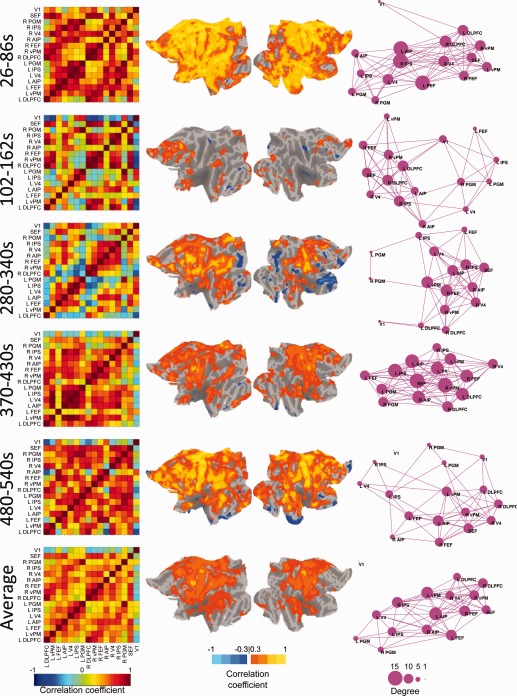
Network changes across time with a sliding‐window correlation size of 60 s for a representative awake human subject (S7). The top five rows represent a single windowed correlation between the times. The bottom row displays the average for the entire run. Column 1 shows the pairwise correlation matrix of “oculomotor” network seeds in the same fashion as the blue bounded box in Figure 4. Columns 2 and 3 display the flattened cortical views of the left and right hemisphere, respectively, overlaid with voxelwise correlation maps for the left FEF seed normalized to the space of the PALS‐B12 template [van Essen, 2005]. Column 4 displays the graph representation of the functional “oculomotor” network connectivity in which each seed represents a node and pairwise correlation r < 0.4 represented by an edge. The size of the node represents its degree centrality. [Color figure can be viewed in the online issue, which is available at http://wileyonlinelibrary.com.]
Fluctuating Connectivity Dynamics During Awake and Anaesthetized States
The Supporting Information movies demonstrate ongoing changes in the spatial connectivity profiles over time. To further assess and quantify these changes, we examined the temporal correlation strength between seeds over time. We calculated the time series of the left FEF seed and of the left IP (A), left MST (B), right FEF (C), left PCC (D), as illustrated for a representative monkey in Figure 7 (M2, Scan 2). Below the time series plots, the sliding window correlation values for all window lengths are shown. Considerable time resolved variations of functional correlations are apparent when compared with the whole scan average correlation value shown as a dashed line. All OCM RSN nodes show slow fluctuations of connectivity strength that dissipate at longer window sizes. To quantify the change in the frequency profiles of the correlation waveforms across the different time windows we calculated fast‐Fourier transforms (FFTs) (Fig. 7, third row of each frame). Bar graphs (bottom right of each frame) represent the percentage of data points that showed positive correlations (+, red), and anticorrelations (−, blue). Consistent with Glover and Chang 2010 anticorrelations decreased as a function of increasing window size and failed to be apparent at larger window sizes. But at smaller window sizes, negative correlations accounted for >30% of the observed data points. The larger variance of the pairwise correlations at short time windows could be influenced by noise or random variability that may increase with fewer points in the short truncation windows. To test for this possibility, we quantified the variability and plot the confidence values for the correlation coefficients for the four areas presented in Figure 7 and the left FEF (Supporting Information Fig. 9). The highest variances are found for near‐zero correlation values, regardless of window size. The confidence values for the large positive and negative excursions stay similar across different window sizes.
Figure 7.
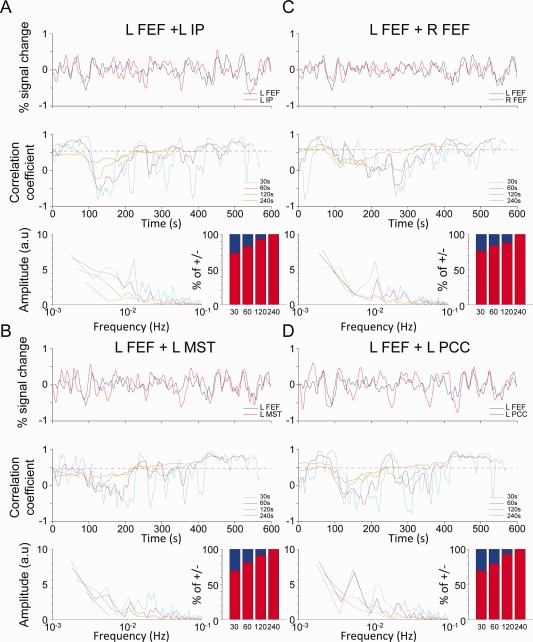
Time‐series and sliding‐window correlation coefficients between the left frontal eye fields (FEF) and “oculomotor” network seeds (A) left intraparietal cortex (IP), (B) left middle superior temporal cortex (MST), (C) right FEF, and (D) left posterior cingulate cortex (PCC) shown for one representative isoflurane‐anesthetized monkey (M2, Scan 2). The top panel shows the BOLD time series of the left FEF seed (blue) and the comparative seed (red). The middle panel shows the sliding‐window coefficients for 30 s (cyan), 60 s (pink), 120 s (green), and 240 s (orange) windows. For each of the correlation time courses the bottom panel shows the fast‐Fourier transform (right side) and the percentage of time of above and below 0. [Color figure can be viewed in the online issue, which is available at http://wileyonlinelibrary.com.]
Similar temporal dynamics were observed for the human data across all nodes (Fig. 8; Subject 7). The results illustrate that like the anesthetized monkey, the correlation time courses are nonstationary and for time dependent analysis with windows of <60 s periods, positive functional correlations alternated with prominent anticorrelations that were entirely missed when assessed with longer time windows.
Figure 8.
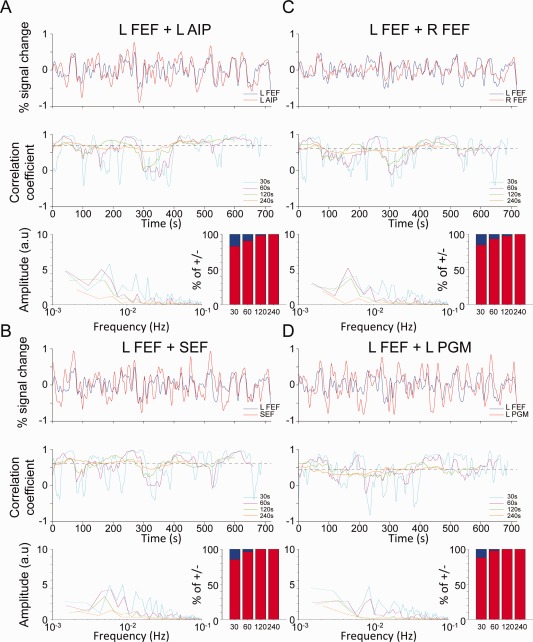
Time‐series and sliding‐window correlation coefficients between the left frontal eye fields (FEF) and “oculomotor” network seeds (A) left intraparietal cortex (IP), (B) left middle superior temporal cortex (MST), (C) right FEF, and (D) left posterior cingulate cortex (PCC) shown for one representative awake human subject (S7). The top panel shows the BOLD time series of the left FEF seed (blue) and the comparative seed (red). The middle panel shows the sliding‐window coefficients for 30 s (cyan), 60 s (pink), 120 s (green), and 240 s (orange) windows. For each of the correlation time courses the bottom panel shows the fast‐Fourier transform (right side) and the percentage of time of above and below 0. [Color figure can be viewed in the online issue, which is available at http://wileyonlinelibrary.com.]
Hypersynchronization
To further illustrate the fluctuating values of the correlations, Figure 9 displays for the four sliding window lengths the pairwise correlations of the OCM network seeds across all possible shifts of the truncation windows for the second scan of the same representative monkey (for all monkeys and Scan 1, see Supporting Information Fig. 10). Each of the 16 seed regions was correlated with the 15 other seed regions. The lines where each seed was correlated with itself are removed, resulting in 120 lines [(16 × 16 − 16)/2] in each subplot of Figure 9. These plots reveal substantial changes in the correlation strength over time. In particular, there are periods of enhanced coherence between seed regions that we have tentatively labeled “hypersynchronization” (see below) alternating with incoherent periods. These fluctuations are not observed at longer time windows.
Figure 9.
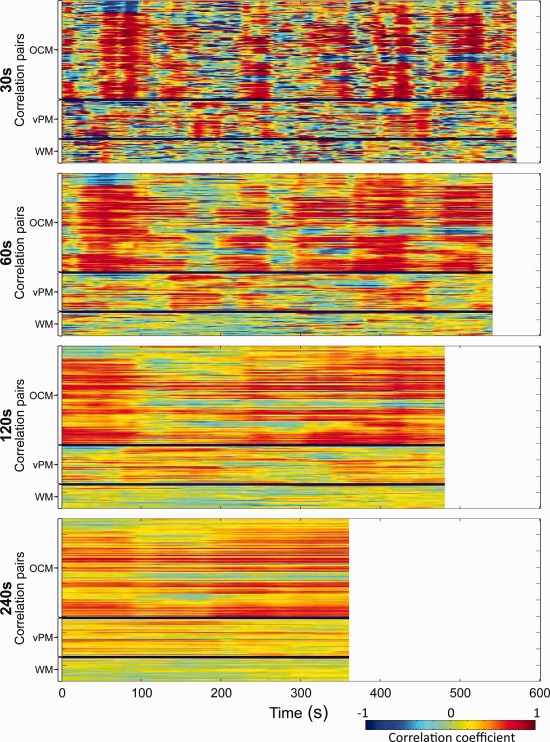
Sliding‐window pairwise correlations of “oculomotor” network (OCM), ventral premotor network (vPM), and white matter (WM) seeds over time for a representative isoflurane‐anesthetized macaques (M2, Scan 2). Every vertical line of each image represents the unfolded pairwise correlation matrix as seen in Figure 2 averaged across 30 s (Row 1), 60 s (Row 2), 120 s (Row 3), and 240 s (Row 4) windows for the entire scan. Plots for all monkeys and both scans are shown in Supporting Information Figure 10. [Color figure can be viewed in the online issue, which is available at http://wileyonlinelibrary.com.]
Hypersynchronization was quantified for the OCM, vPM, and WM areas by calculating the average pairwise correlation values across all seeds within each network for all monkeys (Fig. 10; 60 s sliding window; for Scan 1, see Supporting Information Fig. 11). For the RSNs, periods of hypersynchrony had average correlation values greater than +0.6 whereas incoherent periods approached 0. The average network connectivity time courses were not significantly correlated, showing different correlation peaks and hypersynchrony durations. Histograms display the amount of time in seconds spent at binned correlational values. WM values typically centered around 0 whereas vPM and OCM networks had mean correlation values that were moderate to strong. Within‐network seeds display strong negative correlations, however the mean connectivity typically does not drop below 0 even with a 30 s window. Hypersynchronization was observed for most animals with the exception of M4 (Scan 2), however, Scan 1 of the same monkey showed the greatest synchronization across seeds encompassing both OCM an vPM nodes (though not WM).
Figure 10.
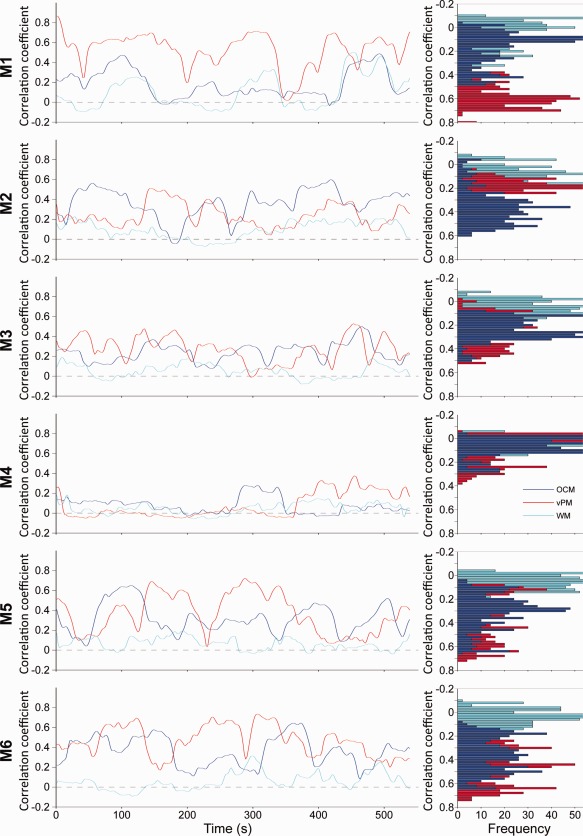
Average pairwise correlation values across all “oculomotor” network (OCM, red), ventral premotor network (vPM, blue), and white matter (WM, cyan) seeds over time for all monkeys (M1–M6, Scan 2) with a sliding window of 60 s. To the right of each plot shows the frequency distribution of the correlation coefficients for each of the three time series. For Scan 1, see Supporting Information Figure 11. [Color figure can be viewed in the online issue, which is available at http://wileyonlinelibrary.com.]
Periods of hypersynchrony were not exclusive to the anesthesia state, as all awake human subjects also exhibited strong network specific synchrony over a period of 12 min (Fig. 11; for all subjects see Supporting Information Fig. 12). As the time window was increased the effects were no longer evident.
Figure 11.
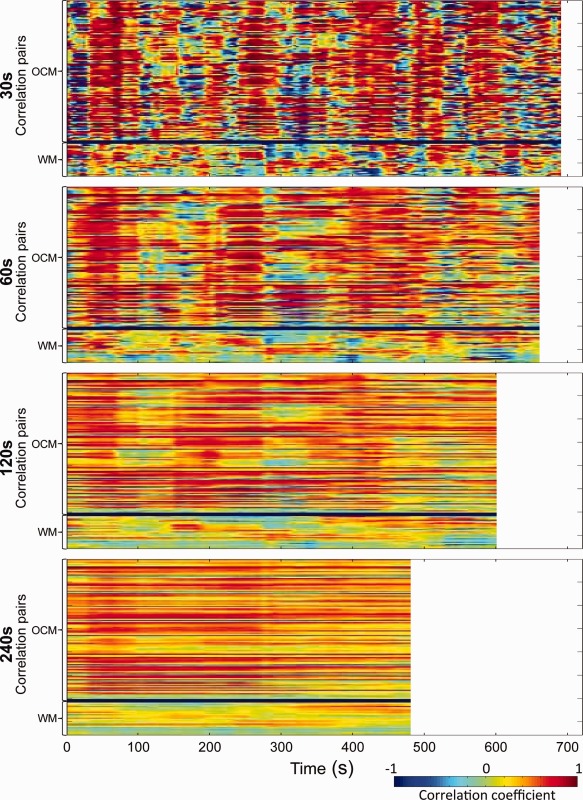
Sliding‐window pairwise correlations of “oculomotor” network seeds over time for a representative awake human subject (S7). Every vertical line of each image represents the unfolded pairwise correlation matrix as seen in Figure 2 averaged across 30 s (Row 1), 60 s (Row 2), 120 s (Row 3), and 240 s (Row 4) windows for the entire scan. Plots for all subjects are shown in Supporting Information Figure 12. [Color figure can be viewed in the online issue, which is available at http://wileyonlinelibrary.com.]
DISCUSSION
Dynamic RSN Connectivity Occurs in the Absence of Cognition
Ongoing brain activity changes in the absence of stimuli or behavior was historically characterized as background “noise” in both electrophysiological and imaging fields. Evidence from both fields is now changing this view, demonstrating that the spontaneous modulations of activity are highly organized across a range of temporal and spatial scales with profiles and magnitudes similar to task‐evoked patterns [for reviews see Bullock, 2003; Ringach, 2009, 2010; Sadaghiani et al., 2010; Vogels et al., 2005].
The primary aim of this study was to test the hypothesis that stimulus‐independent fluctuations of functional connectivity within RSN nodes measured using BOLD‐fMRI were not solely a consequence of conscious brain processes [Christoff et al., 2009; Gilbert et al., 2007; Mason et al., 2007; Paus et al., 1997] or subject motion [van Dijk et al., 2012] during image acquisition, factors that confounded previous studies [Britz et al., 2010; Chang and Glover, 2010; Mantini et al., 2007; Musso et al., 2010; Sato et al., 2006]. To eliminate these confounding variables as the origin of the temporal characteristics, we examined the network connectivity patterns over time between nodes of the macaque OCM RSN during anesthesia with isoflurane, thereby precluding such processes related to conscious thought, mind wandering, memory formation, or changes in arousal and attention [Brown et al., 2010; Veselis, 2001]. In addition to the anesthesia, an implanted head post to mount the subject's head in a stable position prevented any possible movement related artifacts. Under these conditions, a sliding‐window correlation analysis revealed that, even in an anesthetized brain state, RSN functional connectivity was dynamically changing across time, a property that could not be captured with whole‐scan metrics that only compute the mean connectivity value. Individual seed‐pair correlations of the macaque and human OCM RSN showed oscillatory‐like behavior in which the correlation strength fluctuated between strong positive and strong negative correlations reliably within subjects, and reproducible across subjects and species. Evidenced by the FFT of the correlation time courses, as the window size increased, the amplitude and number of frequency peaks diminished. This effect is the result of averaging the periods of positive and negative synchrony within the same period, effectively canceling out the alternating patterns and eliminating the frequency dynamics. Averaging across longer time windows will result in positive values simply due to the increased amount of time the network seeds are positively correlated compared with being anticorrelated (Figs. 7 and 8, insets). Averaging across the entire scan occasionally failed to detect brain areas that become synchronous with the “core” RSN for brief times throughout the scan, though not consistently enough to survive averaging. This can be seen for example, in the voxelwise plots (Column 2, 3) of Figure 5 (as well as the Supporting Information movies), where at multiple windows such as 268–328 s (Row 3) and 360–420 s (Row 5), primary visual cortex (V1) is strongly correlated with the left FEF seed, though does not emerge as a network node in the single‐subject average (Row 6). Additionally, seed‐pair correlations at the network level showed periods of strong positive synchronization across the entire network that occurred multiple times throughout the scan in all animals and all human subjects that we have tentatively labeled “hypersynchronization.” The hypersynchronous periods were network specific in that the nodes of the OCM and vPM RSNs both exhibited periods of hypersynchrony, albeit at different time points and durations.
Taken together, the findings support each of the three hypotheses investigated. First, in agreement with previous work, RSN connectivity was found to be dynamic over time and functional connectivity profiles dependent on the temporal scale that was used [Britz et al., 2010; Chang and Glover, 2010; de Pasquale et al., 2010; Honey et al., 2007; Majeed et al., 2009; Musso et al., 2010; Sato et al., 2006]. Second, the present work offers preliminary evidence that much like RSN organization [Biswal et al., 1995; Beckmann et al., 2005; Hutchison et al., 2010, 2011; Jonckers et al., 2011; Vincent et al., 2007], dynamic relationships within the networks are also a conserved brain property across mammals. Third, and most importantly, the network dynamics persisted regardless of the use of anesthesia, thereby supporting the notion that RSN connectivity variations are a result of ongoing, spontaneous brain activity and not solely a consequence of conscious processing. It is important to note that although we identified fluctuating network connectivity in the absence of conscious cognitive processes, we do not intend to exclude ongoing brain dynamics in the participation of cognition and behavior (or conversely, the modulation of spontaneous activity by conscious processes, context, and behavior). In fact, the results from converging methods have implied that the intrinsic neural and hemodynamic fluctuations represent an essential property of normal brain functioning [for reviews see Bullock, 2003; Ringach, 2009, 2010; Sadaghiani et al., 2010; Vogels et al., 2005].
Electrophysiological Correlates
The periods of metastable RSN synchronization observed in this study could represent the hemodynamic correlate of “microstates” [Britz et al., 2010; Musso et al., 2010], a fingerprint of specific electrophysiological processes [Lehmann et al., 2006] with power contributions arising from multiple frequency bands [Mantini et al., 2007]. Functionally, the microstate is likely reflecting groups of neurons in separate cortical areas linked into a large‐scale network that conjointly subserve a unified cognitive, mental, or perceptual function [Bressler and Tognoli, 2006; Felleman and van Essen, 1991; Friston, 2002; Fuster, 2006]. Network areas forming a microstate are thereby assumed to be coordinated with a unique spatiotemporal pattern. Similar to this proposal the RS‐fMRI signals characterize not only a unique spatial distribution, but a multicomponent temporal signature [Baria et al., 2011; Hutchison et al., 2010; Mantini et al., 2007; Majeed et al., 2009], albeit at a much lower frequency range (0.01–0.1 Hz) owing to convolution with the hemodynamic response function. The observed fluctuation of spatiotemporal connectivity patterns could then represent changing microstates—a cycling of varying network topologies through the brain's functional repertoire allowing for a plastic and flexible framework necessary for ongoing cognitive processes [Friston, 2000; Kelso, 1995; Rabinovich et al., 2008; Tognoli and Kelso, 2009; Sporns, 2010, p. 172].
Previous work across multiple spatial scales and modalities has implicated spontaneous brain activity as a source of variability in evoked responses [Arieli et al., 1996; Azouz and Gray, 1999; Becker et al., 2011; Fiser et al., 2004; Fox et al., 2006b], perception [Hesselmann et al., 2008b; Sadaghiani et al., 2009; Sapir et al., 2005; van Dijk et al., 2008], and behavior [Hesselmann et al., 2008a]. Most relevant to the present work, Fox et al. 2006a demonstrated that ongoing activity fluctuations within a widely distributed human RSN (“dorsal motor”) could account for trial‐to‐trial variability of the evoked hemodynamic responses to a task (finger‐related movement). The linear superposition and neuronal basis of this phenomenon was later confirmed by Becker et al. 2011, reinforcing that evoked responses cannot be fully understood in isolation from ongoing activity. The present findings, in addition to the previous work [Chang and Glover, 2010; de Pasquale et al., 2010; Sato et al., 2006], suggest that intranetwork RSN connectivity fluctuations might be another key element that may account for parts of the variability of evoked responses, perception, and behavior. Further, if the spontaneous activity fluctuations are considered as predictive representations as in a Bayesian framework [Pouget et al., 2003; Körding and Wolpert, 2006; Sadaghiani et al., 2010] in which ongoing cortical activity represents a continuous top–down prediction or expectation, then selecting the correct network state could represent the critical factor for higher order complex tasks requiring large‐scale integration of brain areas [Buckner and Vincent, 2007; Engel et al., 2001].
It is more difficult to speculate on the underlying cause and functional significance of the “hypersynchronized” periods of both species seen in Figures 9, 10, 11, 9, 10, 11. These persisted for tens of seconds and had strong correlation strengths (r > 0.6) across all network nodes. Additionally, the confidence values for the strong correlation periods were very high. The lowest confidence values were found when the mean correlation value was near zero. The periods of hypersynchronization most often occurred independently of other RSNs and WM. The network‐specific alternating patterns of enhanced synchrony share similar characteristics with the electrophysiological “slow rhythm” (0.2–0.4 Hz) [Haider and McCormick, 2009; Steriade et al., 1993a, 1993b]. The slow rhythm oscillates between two different levels of subthreshold membrane potentials. The UP state is distinguished by barrages of both excitatory and inhibitory postsynaptic potentials, and the firing of both excitatory and inhibitory neurons, whereas the DOWN state is characterized by periods of hyperpolarization and quiescence [Contreras et al., 1996; Lampl et al., 1999; Stern et al., 1997; Steriade et al., 1993b]. Slow rhythms are generated and maintained in distributed populations of neurons throughout the neocortex and engage neurons throughout the brain [Isomura et al., 2006]. Studies typically cite their role in coordinating other sleep rhythms [Achermann and Borbély, 1997; Contreras et al., 1996; Steriade et al., 1993c] and memory consolidation [Lee and Wilson, 2002; Mölle et al., 2004]. Given that hypersynchronization was also observed in awake human RSNs it would suggest that the phenomenon is not a result of anesthesia. The presence and functional relevance of slow rhythms in cortical activation during wakefulness has not yet been fully explored [Destexhe et al., 2007; Sporns, 2010, p. 156]. Nir et al. 2008 have reported slow (<0.1 Hz) spontaneous fluctuations of neuronal activity [local field potential (LFP) gamma power modulations) in the auditory cortex of awake human subjects. Bilateral single‐unit, LFP, and intracranial electrocorticography (ECoG) also revealed significant interhemispheric correlations between the homologous areas that increased during rapid eye movement (REM) and Stage 2 sleep [Nir et al., 2008]. In a related study, He et al. 2008 compared the “correlation structure” of the sensorimotor network of humans recorded by ECoG and BOLD independently. Slow cortical potentials (<0.5 Hz) were found to best correspond with RS‐BOLD fluctuation profiles across wakefulness, slow‐wave sleep, and REM sleep, whereas gamma frequency power showed a similar correlation structure albeit only during wakefulness and REM sleep. The results of these studies point toward slow cortical oscillations as a possible electrophysiological correlate of “hypersynchrony.” Given that the responsiveness of the cortex to sensory stimuli is generally increased during UP states and decreased during DOWN states [Contreras et al., 1996; Steriade et al., 1993b] the slow fluctuations of synchronization (UP states) could represent a dynamically stable network organization exploited to express selective functional relationships.
This study only allows us to infer the electrophysiological correlate(s) of the nonstationary relationships and “hypersynchronization” based on their resemblance to known phenomena. Obtaining direct evidence would require simultaneous electrophysiological and RS‐fMRI recordings. Beyond establishing a link between neural activity and the hemodynamic BOLD activity [Logothetis et al., 2001], previous work using EEG‐fMRI has attempted to directly derive the electrophysiological correlate of RS‐fMRI fluctuations [Britz et al., 2010; He et al., 2008; Laufs, 2008, 2010; Liu et al., 2011; Mantini et al., 2007; Musso et al., 2010; Nir et al., 2007; Shmuel and Leopold, 2008] and in what may prove synonymous, the hemodynamic manifestations of temporal EEG dynamics [Goldman et al., 2002; Laufs et al., 2003b; Moosman et al., 2003; Michels et al., 2010; Olbrich et al., 2009; Ritter et al., 2009; Sammer et al., 2007; Wu et al., 2010]. It has been established in anesthetized monkeys that slow fluctuations in the power of band‐limited oscillations (particularly gamma) can be directly linked to the ongoing RS‐fMRI fluctuations [Shmuel and Leopold, 2008]. In humans, RSNs were assigned a unique electrophysiological signature that involved a combination of EEG power variations in the delta, theta, alpha, beta, and gamma range [Laufs et al., 2003a; Mantini et al., 2007; for review see Laufs, 2008]. This was later confirmed by two independent studies showing that transient multifrequency EEG events (microstates) can be used as regressors to elicit BOLD activation patterns consistent with at least some RSNs [Britz et al., 2010; Musso et al., 2010]. The studies however, did not explore the temporal properties of the within‐network connectivity. This presents a promising avenue for future research and will be critical in resolving controversies related to time‐scale discrepancies between electrophysiological activity (microstates, slow rhythms, frequency specific power changes) and the RSN fluctuations.
Anticorrelations
The role of anticorrelations within RSNs remains unclear and controversial [Cole et al., 2010; Fox et al., 2005; Murphy et al., 2009], though it has been suggested that they subserve a “differentiating role,” segregating neuronal processes that have competing representations [Fox et al., 2005]. In agreement with previous work [Chang and Glover, 2010], the strength of negative correlations was found to depend strongly on the time window used to analyze functional connectivity. Using the whole scan metrics, the correlation coefficients typically do not drop below −0.3, however at shorter time windows, the negative correlations approached −0.8 at high confidence values, suggesting active suppressive interactions between anticorrelated network nodes. Empirical investigations of anticorrelations remain underrepresented in a field that is dominated by interpretations of positive connectivity among seeds, however, the present results calls on a revaluation of their possible roles in complex brain networks.
Evolutionarily Preserved Mechanism
Resting‐state fluctuations and their assembly into spatial network patterns appear to be a ubiquitous property of mammalian brain organization. Mice, rats, monkeys, and humans [Biswal et al., 1995; Jonckers et al., 2011; Lu et al., 2007; Vincent et al., 2007], all show robust and reproducible RSNs. This study could now put forward that dynamics within this networks are also a shared feature of mammalian brain systems, at the very least between humans and non‐human primates. Brain rhythms and cortical synchrony have been suggested as an indicator of complexity that parallels evolutionary branching; invertebrates lack EEG oscillations, amphibians show cortical coherence albeit less than mammals, and humans seem to possess the greatest range of frequency patterns [Bullock, 2003]. Synchronization, network organization, and ongoing fluctuations would then represent an evolved and adaptive mechanism serving “higher order” cognitive functioning.
RSN networks have been shown to persist under light and deep sleep [Horovitz et al., 2008, 2009], sedation [Greicius et al., 2008], and various forms of anesthesia [Lu et al., 2007; Hutchison et al., 2010; Zhao et al., 2008]. This is not to say however, that quantifiable differences do not exist between the different states. Changes in connectivity have been reported within and across both normal and disease states [Greicius, 2008; Horovitz et al., 2009; Vanhaudenhuyse et al., 2010]. This makes direct qualitative comparisons of the anesthetized monkeys and awake human subjects problematic because, although qualitative assessment does indicate preserved temporal characteristics, any variations may not be a result of species difference but a consequence of the anesthesia. The mechanisms of action for isoflurane remain poorly understood, but it has been demonstrated to disrupt functional thalamocortical connectivity [Alkire et al., 2000; Arhem et al., 2003; Steriade, 2001], in addition to causing vasodilation that can potentially affect cerebrovascular activity [Farber et al., 1997]. The comparatively low dose used in the present work (1%) does not seem to affect spatial RSN properties as our previous work has shown RSNs closely resembling known task‐based networks and homologous human RSNs [Hutchison et al., 2011, in press]. A greater level of understanding and further experimentation will be necessary to truly elucidate between species differences in dynamics.
Controls and Limitations
There has been recent evidence suggesting a possible link between resting‐state and spontaneous OCM behavior in awake human subjects [Ramot et al., 2011]. The authors admittedly could actually not delineate causal relationships between the two phenomena, i.e., whether the eye movements were controlled by the spontaneous BOLD fluctuations, if the eye movements were actually generated by the fluctuations, or if both were driven by a third, common input. We visually inspected the raw monkey data to determine if there were shifts in eye movements during the resting‐state scans of which none were apparent. Importantly, the eyes were kept closed throughout the duration of the scanning. Finally, the vPM network served as an independent control as the fluctuating dynamics were not correlated with the OCM RSN activity and therefore, would indicate the effects could not solely be a result of residual eye movements.
Heart rate, blood pressure, and breathing rate (monitored for monkeys) were not recorded during image acquisition. This prevents us from modeling the changing physiological parameters in reference to the network fluctuations. However, we do not believe physiological artifacts to be the origin of the RSN dynamics. RS‐BOLD signals are dominated by lower frequencies (<0.1 Hz) with minimal (>10%) contribution of higher frequent cardiac and respiratory oscillations (>0.3 Hz, higher in the monkey) to the correlation coefficient [Cordes et al., 2001]. Contributions from these signals is further diminished through low‐pass temporal filtering. Global gray matter (data not shown), WM seeds, vPM RSN, and OCM RSN were all found to have unique temporal profiles excluding a common artifactual source. Within‐network seeds also showed unique time‐courses and correlation fluctuation profiles suggesting node specific activity. Finally, the findings were reproduced using two different scanners (Seimmas and Agilent), at two different field strengths (3 T and 7 T), with different acquisition parameters across two different species, one of which was anesthetized.
Decreasing the window size will increase the number of spurious correlations that occur when calculating the correlation coefficients over time. This has been shown to change in proportion to the square root of the sampling time [van Dijk et al., 2009]. This is a concern for the present work as the correlation coefficients are compared across window sizes. It was found, however, that the highest statistical reliability occurred at the points of highest correlation and the highest variances were found for near‐zero correlation values. This was also true of the mean correlation signal in which “hypersynchronous” states were statistically significant (P < 1.7 × 10⁻⁴, 1.8 × 10⁻⁴, 2.1 × 10⁻⁴, 2.8 × 10⁻⁴, for 30 s, 60 s, 120 s, and 240 s, respectively; corrected for multiple comparisons using Bonferroni correction; data not shown). This property was observed across all seeds and subjects. In addition, correlations between seed regions are run independently of one another. It is improbable that states of “hypersynchrony” would result from spurious correlations, as these would be randomly distributed across time and not occurring between multiple seed regions simultaneously.
Implications for Future Work
Current RS‐fMRI analysis techniques such as cross‐correlation or independent component analysis [both techniques have been previously applied to the current data set, see Hutchison et al., 2011, in press] assume stationarity of functional connectivity over the entire length of the scan, offering a limited, averaged view of the network relationships. Evidence is now suggesting that these techniques can be insensitive to robust spatiotemporal dynamics of the RSNs [Britz et al., 2010; Chang and Glover, 2010; Musso et al., 2010; Mantini et al., 2007; Sato et al., 2006] that disappear at analysis windows greater than 4 min in length [van Dijk et al., 2009]. The observation of RSN changes does not diminish the significance of studies assuming static network contributions, but suggests that there are statistically reliable and potentially meaningful dynamics that could be examined within these same datasets. This is in addition to new insights that may be gained by examining the transient inclusion of new network nodes into the stereotypical RSN. There is however, one major caveat. For RSNs determined from long observation windows, one can be confident that the static maps reflect all of the “core” nodes in a network. However, RSNs derived from short time windows may not show all nodes in a network as some of these may have transiently zero correlation as shown in our data. Until the nature of these dynamic RSNs are understood, it seems prudent to use observation windows of several minutes to ensure capture all the nodes of a RSN.
The results suggest nonstationary relationships between brain areas; however, the sliding‐window technique used to reveal this still assumes stationarity, albeit on a smaller temporal scale. Window sizes below 30 s (15 vol) did not result in significant correlations and suggest a minimum window size is necessary. However, more sophisticated complex network measures investigating possible nonlinear interactions and their manifestations [Friston, 1997; Werner, 2007], as well as consideration of multiple RSNs will be needed to truly characterize the underlying dynamics and elucidate the processes that govern them.
The time‐varying changes of the RSNs may offer insight into the large‐scale network behavior that is difficult to achieve with other methodological approaches that do not share the same level of spatial resolution or brain coverage as fMRI. Additional work will have to focus on identifying activity profiles, transition states, and task‐related changes to the dynamic behavior using novel analysis strategies—particularly at the group level [Chang and Glover, 2010; Deco et al., 2011; Sato et al., 2006]. RS‐fMRI has emerged as a possible diagnostic tool in clinical contexts [Auer, 2008; Greicius, 2008] and, given the wealth of information provided by dynamic alterations and emphasis at the single subject level, presents an exciting future direction for clinical applications.
CONCLUSIONS
The present findings indicate that ongoing fluctuations of resting‐state functional connectivity are an intrinsic property of mammalian brain organization and not simply a consequence of conscious, cognitive processing. This fundamental feature of temporal brain dynamics may be exploited to assemble and modulate state‐ or task‐dependent representations critical for cognition and behavior. Multimodal investigations will be necessary to elucidate the electrophysiological correlates of this phenomenon, but the results suggest that important network information and dynamics are missed when using average functional connectivity as the single network measure.
Supporting information
Supporting Information Figure 1
Supporting Information Figure 2
Supporting Information Figure 3
Supporting Information Figure 4
Supporting Information Figure 5
Supporting Information Figure 6
Supporting Information Figure 7
Supporting Information Figure 8
Supporting Information Figure 9
Supporting Information Figure 10
Supporting Information Figure 11
Supporting Information Figure 12
Supporting Information Movie 1
Supporting Information Movie 2
Acknowledgments
We thank S. Hughes and B. Soper for technical assistance during monkey data collection and J. Gallivan and J. Culham for the human data.
REFERENCES
- Achermann P, Borbély AA (1997): Low‐frequency (<1 Hz) oscillations in the human sleep electroencephalogram. Neuroscience 81:213–222. [DOI] [PubMed] [Google Scholar]
- Alkire MT, Haier RJ, Fallon JH (2000): Toward a unified theory of narcosis: Brain imaging evidence for a thalamocortical switch as the neurophysiologic basis of anesthetic‐induced unconsciousness. Conscious Cogn 9:370–386. [DOI] [PubMed] [Google Scholar]
- Amiez C, Kostopoulos P, Champod A‐S, Petrides M (2006): Local morphology predicts functional organization of the dorsal premotor region in the human brain. J Neurosci 26:2724–2731. [DOI] [PMC free article] [PubMed] [Google Scholar]
- Arhem P, Klement G, Nilsson J (2003): Mechanisms of anesthesia: Towards integrating network, cellular, and molecular level modeling. Neuropsychopharmacology 28 (Suppl 1):S40–S47. [DOI] [PubMed] [Google Scholar]
- Arieli A, Sterkin A, Grinvald A, Aertsen A (1996): Dynamics of ongoing activity: Explanation of the large variability in evoked cortical responses. Science 273:1868–1871. [DOI] [PubMed] [Google Scholar]
- Auer DP (2008): Spontaneous low‐frequency blood oxygenation level‐dependent fluctuations and functional connectivity analysis of the “resting” brain. Magn Reson Imaging 26:1055–1064. [DOI] [PubMed] [Google Scholar]
- Azouz R, Gray CM (1999): Cellular mechanisms contributing to response variability of cortical neurons in vivo. J Neurosci 19:2209–2223. [DOI] [PMC free article] [PubMed] [Google Scholar]
- Baker JT, Patel GH, Corbetta M, Snyder LH (2006): Distribution of activity across the monkey cerebral cortical surface, thalamus and midbrain during rapid, visually guided saccades. Cereb Cortex 16:447–459. [DOI] [PubMed] [Google Scholar]
- Baria AT, Baliki MN, Parrish T, Apkarian AV (2011): Anatomical and functional assemblies of brain BOLD oscillations. J Neurosci 31:7910–7919. [DOI] [PMC free article] [PubMed] [Google Scholar]
- Becker R, Reinacher M, Freyer F, Villringer A, Ritter P (2011) How ongoing neuronal oscillations account for evoked fMRI variability. J Neurosci 31:11016–11027. [DOI] [PMC free article] [PubMed] [Google Scholar]
- Beckmann CF, DeLuca M, Devlin JT, Smith SM (2005): Investigations into resting‐state connectivity using independent component analysis. Philos Trans R Soc Lond B Biol Sci 360:1001–1013. [DOI] [PMC free article] [PubMed] [Google Scholar]
- Bianciardi M, Fukunaga M, van Gelderen P, Horovitz SG, de Zwart JA, Duyn JH (2009): Modulation of spontaneous fMRI activity in human visual cortex by behavioral state. Neuroimage 45:160–168. [DOI] [PMC free article] [PubMed] [Google Scholar]
- Biswal B, Yetkin FZ, Haughton VM, Hyde JS (1995): Functional connectivity in the motor cortex of resting human brain using echo‐planar MRI. Magn Reson Imaging 34:537–541. [DOI] [PubMed] [Google Scholar]
- Bressler SL, Tognoli E (2006): Operational principles of neurocognitive networks. Int J Psychophysiol 60:139–148. [DOI] [PubMed] [Google Scholar]
- Britz J, Van De Ville D, Michel CM (2010): BOLD correlates of EEG topography reveal rapid resting‐state network dynamics. Neuroimage 52:1162–1170. [DOI] [PubMed] [Google Scholar]
- Brown MRG, DeSouza JFX, Goltz HC, Ford K, Menon RS, Goodale MA, Everling S (2004): Comparison of memory‐ and visually guided saccades using event‐related fMRI. J Neurophysiol 91:873–889. [DOI] [PubMed] [Google Scholar]
- Brown MRG, Vilis T, Everling S (2007) Frontoparietal activation with preparation for antisaccades. J Neurophysiol 98:1751–1762. [DOI] [PubMed] [Google Scholar]
- Brown EN, Lydic R, Schiff ND (2010): General anesthesia, sleep, and coma. N Engl J Med 363:2638–2650. [DOI] [PMC free article] [PubMed] [Google Scholar]
- Bruce CJ, Goldberg ME (1985): Primate frontal eye fields. I. Single neurons discharging before saccades. J Neurophysiol 53:603–635. [DOI] [PubMed] [Google Scholar]
- Buckner RL, Vincent JL (2007): Unrest at rest: Default activity and spontaneous network correlations. Neuroimage 37:1091–1096. [DOI] [PubMed] [Google Scholar]
- Bullock TH (2003): Have brain dynamics evolved? Should we look for unique dynamics in the sapient species? Neural Comput 15:2013–2027. [DOI] [PubMed] [Google Scholar]
- Chang C, Glover GH (2010): Time‐frequency dynamics of resting‐state brain connectivity measured with fMRI. Neuroimage 50:81–98. [DOI] [PMC free article] [PubMed] [Google Scholar]
- Christoff K, Gordon AM, Smallwood J, Smith R, Schooler JW (2009): Experience sampling during fMRI reveals default network and executive system contributions to mind wandering. Proc Natl Acad Sci USA 106:8719–8724. [DOI] [PMC free article] [PubMed] [Google Scholar]
- Cole DM, Smith SM, Beckmann CF (2010): Advances and pitfalls in the analysis and interpretation of resting‐state FMRI data. Front Syst Neurosci 4:8. [DOI] [PMC free article] [PubMed] [Google Scholar]
- Contreras D, Timofeev I, Steriade M (1996): Mechanisms of long‐lasting hyperpolarizations underlying slow sleep oscillations in cat corticothalamic networks. J Physiol (Lond) 494 ( Pt 1):251–264. [DOI] [PMC free article] [PubMed] [Google Scholar]
- Cordes D, Haughton VM, Arfanakis K, Carew JD, Turski PA, Moritz CH, Quigley MA, Meyerand ME (2001): Frequencies contributing to functional connectivity in the cerebral cortex in“ resting‐state” data. Am J Neuroradiol 22:1326–1333. [PMC free article] [PubMed] [Google Scholar]
- Damoiseaux JS, Rombouts SARB, Barkhof F, Scheltens P, Stam CJ, Smith SM, Beckmann CF (2006): Consistent resting‐state networks across healthy subjects. Proc Natl Acad Sci USA 103:13848–13853. [DOI] [PMC free article] [PubMed] [Google Scholar]
- de Pasquale F, Della Penna S, Snyder AZ, Lewis C, Mantini D, Marzetti L, Belardinelli P, Ciancetta L, Pizzella V, Romani GL, Corbetta M (2010): Temporal dynamics of spontaneous MEG activity in brain networks. Proc Natl Acad Sci USA 107:6040–6045. [DOI] [PMC free article] [PubMed] [Google Scholar]
- Deco G, Jirsa VK, McIntosh AR (2011): Emerging concepts for the dynamical organization of resting‐state activity in the brain. Nat Rev Neurosci 12:43–56. [DOI] [PubMed] [Google Scholar]
- DeSouza JFX, Menon RS, Everling S (2003): Preparatory set associated with pro‐saccades and anti‐saccades in humans investigated with event‐related FMRI. J Neurophysiol 89:1016–1023. [DOI] [PubMed] [Google Scholar]
- Destexhe A, Hughes SW, Rudolph M, Crunelli V (2007): Are corticothalamic “up” states fragments of wakefulness? Trends Neurosci 30:334–342. [DOI] [PMC free article] [PubMed] [Google Scholar]
- Engel AK, Fries P, Singer W (2001): Dynamic predictions: Oscillations and synchrony in top–down processing. Nat Rev Neurosci 2:704–716. [DOI] [PubMed] [Google Scholar]
- Esposito F, Bertolino A, Scarabino T, Latorre V, Blasi G, Popolizio T, Tedeschi G, Cirillo S, Goebel R, Di Salle F (2006): Independent component model of the default‐mode brain function: Assessing the impact of active thinking. Brain Res Bull 70:263–269. [DOI] [PubMed] [Google Scholar]
- Farber NE, Harkin CP, Niedfeldt J, Hudetz AG, Kampine JP, Schmeling WT (1997): Region‐specific and agent‐specific dilation of intracerebral microvessels by volatile anesthetics in rat brain slices. Anesthesiology 87:1191–1198. [DOI] [PubMed] [Google Scholar]
- Felleman DJ, Van Essen DC (1991): Distributed hierarchical processing in the primate cerebral cortex. Cereb Cortex 1:1–47. [DOI] [PubMed] [Google Scholar]
- Fiser J, Chiu C, Weliky M (2004): Small modulation of ongoing cortical dynamics by sensory input during natural vision. Nature 431:573–578. [DOI] [PubMed] [Google Scholar]
- Ford KA, Goltz HC, Brown MRG, Everling S (2005): Neural processes associated with antisaccade task performance investigated with event‐related FMRI. J Neurophysiol 94:429–440. [DOI] [PubMed] [Google Scholar]
- Ford KA, Gati JS, Menon RS, Everling S (2009): BOLD fMRI activation for anti‐saccades in nonhuman primates. Neuroimage 45:470–476. [DOI] [PubMed] [Google Scholar]
- Fox MD, Snyder AZ, Vincent JL, Corbetta M, Van Essen DC, Raichle ME (2005): The human brain is intrinsically organized into dynamic, anticorrelated functional networks. Proc Natl Acad Sci USA 102:9673–9678. [DOI] [PMC free article] [PubMed] [Google Scholar]
- Fox MD, Corbetta M, Snyder AZ, Vincent JL, Raichle ME (2006a): Spontaneous neuronal activity distinguishes human dorsal and ventral attention systems. Proc Natl Acad Sci USA 103:10046–10051. [DOI] [PMC free article] [PubMed] [Google Scholar]
- Fox MD, Snyder AZ, Zacks JM, Raichle ME (2006b): Coherent spontaneous activity accounts for trial‐to‐trial variability in human evoked brain responses. Nat Neurosci 9:23–25. [DOI] [PubMed] [Google Scholar]
- Fox MD, Raichle ME (2007): Spontaneous fluctuations in brain activity observed with functional magnetic resonance imaging. Nat Rev Neurosci 8:700–711. [DOI] [PubMed] [Google Scholar]
- Fransson P (2006): How default is the default mode of brain function? Further evidence from intrinsic BOLD signal fluctuations. Neuropsychologia 44:2836–2845. [DOI] [PubMed] [Google Scholar]
- Friston KJ (1997): Transients, metastability, and neuronal dynamics. Neuroimage 5:164–71. [DOI] [PubMed] [Google Scholar]
- Friston KJ (2000): The labile brain. I. Neuronal transients and nonlinear coupling. Philos Trans R Soc Lond, B Biol Sci 355:215–236. [DOI] [PMC free article] [PubMed] [Google Scholar]
- Friston KJ (2002): Beyond phrenology: What can neuroimaging tell us about distributed circuitry? Annu Rev Neurosci 25:221–250. [DOI] [PubMed] [Google Scholar]
- Fuster JM (2006): The cognit: A network model of cortical representation. Int J Psychophysiol 60:125–132. [DOI] [PubMed] [Google Scholar]
- Gilbert SJ, Dumontheil I, Simons JS, Frith CD, Burgess PW (2007): Comment on “Wandering minds: The default network and stimulus‐independent thought.” Science 317:43; author reply 43. [DOI] [PubMed] [Google Scholar]
- Goldman RI, Stern JM, Engel J Jr, Cohen MS (2002): Simultaneous EEG and fMRI of the alpha rhythm. Neuroreport 13:2487–2492. [DOI] [PMC free article] [PubMed] [Google Scholar]
- Greicius M (2008): Resting‐state functional connectivity in neuropsychiatric disorders. Curr Opin Neurol 21:424–430. [DOI] [PubMed] [Google Scholar]
- Greicius MD, Kiviniemi V, Tervonen O, Vainionpää V, Alahuhta S, Reiss AL, Menon V (2008): Persistent default‐mode network connectivity during light sedation. Hum Brain Mapp 29:839–847. [DOI] [PMC free article] [PubMed] [Google Scholar]
- Greicius MD, Supekar K, Menon V, Dougherty RF (2009): Resting‐state functional connectivity reflects structural connectivity in the default mode network. Cereb Cortex 19:72–78. [DOI] [PMC free article] [PubMed] [Google Scholar]
- Hagmann P, Cammoun L, Gigandet X, Meuli R, Honey CJ, Wedeen VJ, Sporns O (2008): Mapping the structural core of human cerebral cortex. PLoS Biology 6:e159. [DOI] [PMC free article] [PubMed] [Google Scholar]
- Haider B, McCormick DA (2009): Rapid neocortical dynamics: Cellular and network mechanisms. Neuron 62:171–189. [DOI] [PMC free article] [PubMed] [Google Scholar]
- He BJ, Snyder AZ, Zempel JM, Smyth MD, Raichle ME (2008): Electrophysiological correlates of the brain's intrinsic large‐scale functional architecture. Proc Natl Acad Sci USA 105:16039–16044. [DOI] [PMC free article] [PubMed] [Google Scholar]
- Hesselmann G, Kell CA, Eger E, Kleinschmidt A (2008a): Spontaneous local variations in ongoing neural activity bias perceptual decisions. Proc Natl Acad Sci USA 105:10984–10989. [DOI] [PMC free article] [PubMed] [Google Scholar]
- Hesselmann G, Kell CA, Kleinschmidt A (2008b): Ongoing activity fluctuations in hMT+ bias the perception of coherent visual motion. J Neurosci 28:14481–14485. [DOI] [PMC free article] [PubMed] [Google Scholar]
- Honey CJ, Kötter R, Breakspear M, Sporns O (2007): Network structure of cerebral cortex shapes functional connectivity on multiple time scales. Proc Natl Acad Sci USA 104:10240–10245. [DOI] [PMC free article] [PubMed] [Google Scholar]
- Honey CJ, Sporns O, Cammoun L, Gigandet X, Thiran JP, Meuli R, Hagmann P (2009): Predicting human resting‐state functional connectivity from structural connectivity. Proc Natl Acad Sci USA 106:2035–2040. [DOI] [PMC free article] [PubMed] [Google Scholar]
- Horovitz SG, Fukunaga M, de Zwart JA, van Gelderen P, Fulton SC, Balkin TJ, Duyn JH (2008): Low frequency BOLD fluctuations during resting wakefulness and light sleep: A simultaneous EEG‐fMRI study. Hum Brain Mapp 29:671–682. [DOI] [PMC free article] [PubMed] [Google Scholar]
- Horovitz SG, Braun AR, Carr WS, Picchioni D, Balkin TJ, Fukunaga M, Duyn JH (2009): Decoupling of the brain's default mode network during deep sleep. Proc Natl Acad Sci USA 106:11376–11381. [DOI] [PMC free article] [PubMed] [Google Scholar]
- Hutchison RM, Mirsattari SM, Jones CK, Gati JS, Leung LS (2010): Functional networks in the anesthetized rat brain revealed by independent component analysis of resting‐state fMRI. J Neurophysiol 103:3398–3406. [DOI] [PubMed] [Google Scholar]
- Hutchison RM, Leung LS, Mirsattari SM, Gati JS, Menon RS, Everling S (2011): Resting‐state networks in the macaque at 7 T. Neuroimage 56:1546–1555. [DOI] [PubMed] [Google Scholar]
- Hutchison RM, Womelsdorf T, Gati JS, Leung LS, Menon RS, Everling S: Resting‐state connectivity identifies distinct functional networks in macaque cingulate cortex. Cereb Cortex (in press). [DOI] [PubMed] [Google Scholar]
- Hutchison RM, Gallivan JP, Culham JC, Gati JS, Menon RS, Everling S: Functional connectivity of the frontal eye fields in humans and macaque monkeys investigated with resting‐state fMRI. J Neurophysiol (in press). [DOI] [PubMed] [Google Scholar]
- Isomura Y, Sirota A, Ozen S, Montgomery S, Mizuseki K, Henze DA, Buzsáki G (2006): Integration and segregation of activity in entorhinal–hippocampal subregions by neocortical slow oscillations. Neuron 52:871–882. [DOI] [PubMed] [Google Scholar]
- Johnston K, Everling S (2008): Neurophysiology and neuroanatomy of reflexive and voluntary saccades in non‐human primates. Brain Cogn 68:271–283. [DOI] [PubMed] [Google Scholar]
- Jonckers E, Van Audekerke J, De Visscher G, Van der Linden A, Verhoye M (2011): Functional connectivity fMRI of the rodent brain: Comparison of functional connectivity networks in rat and mouse. PLoS One 6:e18876. [DOI] [PMC free article] [PubMed] [Google Scholar]
- Kamada T, Kawai S (1989): An algorithm for drawing general undirected graphs. Inf Process Lett 31:7–15. [Google Scholar]
- Kelly C, Uddin LQ, Shehzad Z, Margulies DS, Castellanos FX, Milham MP, Petrides M (2010): Broca's region: Linking human brain functional connectivity data and non‐human primate tracing anatomy studies. Eur J Neurosci 32:383–398. [DOI] [PMC free article] [PubMed] [Google Scholar]
- Kelso JAS (1995): Dynamic Patterns: The Self‐Organization of Brain and Behavior. The MIT Press. [Google Scholar]
- Kiviniemi VJ, Haanpää H, Kantola J‐H, Jauhiainen J, Vainionpää V, Alahuhta S, Tervonen O (2005): Midazolam sedation increases fluctuation and synchrony of the resting brain BOLD signal. Magn Reson Imaging 23:531–537. [DOI] [PubMed] [Google Scholar]
- Klassen LM, Menon RS (2004): Robust automated shimming technique using arbitrary mapping acquisition parameters (RASTAMAP). Magn Reson Med 51:881–887. [DOI] [PubMed] [Google Scholar]
- Körding KP, Wolpert DM (2006): Bayesian decision theory in sensorimotor control. Trends Cogn Sci 10:319–326. [DOI] [PubMed] [Google Scholar]
- Koyama M, Hasegawa I, Osada T, Adachi Y, Nakahara K, Miyashita Y (2004): Functional magnetic resonance imaging of macaque monkeys performing visually guided saccade tasks: Comparison of cortical eye fields with humans. Neuron 41:795–807. [DOI] [PubMed] [Google Scholar]
- Lampl I, Reichova I, Ferster D (1999): Synchronous membrane potential fluctuations in neurons of the cat visual cortex. Neuron 22:361–374. [DOI] [PubMed] [Google Scholar]
- Laufs H, Krakow K, Sterzer P, Eger E, Beyerle A, Salek‐Haddadi A, Kleinschmidt A (2003a): Electroencephalographic signatures of attentional and cognitive default modes in spontaneous brain activity fluctuations at rest. Proc Natl Acad Sci USA 100:11053–11058. [DOI] [PMC free article] [PubMed] [Google Scholar]
- Laufs H, Kleinschmidt A, Beyerle A, Eger E, Salek‐Haddadi A, Preibisch C, Krakow K (2003b): EEG‐correlated fMRI of human alpha activity. Neuroimage 19:1463–1476. [DOI] [PubMed] [Google Scholar]
- Laufs H (2008): Endogenous brain oscillations and related networks detected by surface EEG‐combined fMRI. Hum Brain Mapp 29:762–769. [DOI] [PMC free article] [PubMed] [Google Scholar]
- Laufs H (2010): Multimodal analysis of resting state cortical activity: What does EEG add to our knowledge of resting state BOLD networks? Neuroimage 52:1171–1172. [DOI] [PubMed] [Google Scholar]
- Lee AK, Wilson MA (2002): Memory of sequential experience in the hippocampus during slow wave sleep. Neuron 36:1183–1194. [DOI] [PubMed] [Google Scholar]
- Lehmann D, Faber PL, Gianotti LRR, Kochi K, Pascual‐Marqui RD (2006): Coherence and phase locking in the scalp EEG and between LORETA model sources, and microstates as putative mechanisms of brain temporo‐spatial functional organization. J Physiol Paris 99:29–36. [DOI] [PubMed] [Google Scholar]
- Liu X, Zhu X‐H, Zhang Y, Chen W (2011): Neural origin of spontaneous hemodynamic fluctuations in rats under burst‐suppression anesthesia condition. Cereb Cortex 21:374–384. [DOI] [PMC free article] [PubMed] [Google Scholar]
- Logothetis NK, Pauls J, Augath M, Trinath T, Oeltermann A (2001): Neurophysiological investigation of the basis of the fMRI signal. Nature 412:150–157. [DOI] [PubMed] [Google Scholar]
- Lu H, Zuo Y, Gu H, Waltz JA, Zhan W, Scholl CA, Rea W, Yang Y, Stein EA (2007): Synchronized delta oscillations correlate with the resting‐state functional MRI signal. Proc Natl Acad Sci USA 104:18265–18269. [DOI] [PMC free article] [PubMed] [Google Scholar]
- Luna B, Thulborn KR, Strojwas MH, McCurtain BJ, Berman RA, Genovese CR, Sweeney JA (1998): Dorsal cortical regions subserving visually guided saccades in humans: An fMRI study. Cereb Cortex 8:40–47. [DOI] [PubMed] [Google Scholar]
- Majeed W, Magnuson M, Keilholz SD (2009): Spatiotemporal dynamics of low frequency fluctuations in BOLD fMRI of the rat. J Magn Reson Imaging 30:384–393. [DOI] [PMC free article] [PubMed] [Google Scholar]
- Mantini D, Perrucci MG, Del Gratta C, Romani GL, Corbetta M (2007): Electrophysiological signatures of resting state networks in the human brain. Proc Natl Acad Sci USA 104:13170–13175. [DOI] [PMC free article] [PubMed] [Google Scholar]
- Margulies DS, Vincent JL, Kelly C, Lohmann G, Uddin LQ, Biswal BB, Villringer A, Castellanos FX, Milham MP, Petrides M (2009): Precuneus shares intrinsic functional architecture in humans and monkeys. Proc Natl Acad Sci USA 106:20069–20074. [DOI] [PMC free article] [PubMed] [Google Scholar]
- Mason MF, Norton MI, Van Horn JD, Wegner DM, Grafton ST, Macrae CN (2007): Wandering minds: The default network and stimulus‐independent thought. Science 315:393–395. [DOI] [PMC free article] [PubMed] [Google Scholar]
- Michels L, Bucher K, Lüchinger R, Klaver P, Martin E, Jeanmonod D, Brandeis D (2010): Simultaneous EEG‐fMRI during a working memory task: Modulations in low and high frequency bands. PLoS One 5:e10298. [DOI] [PMC free article] [PubMed] [Google Scholar]
- Mölle M, Marshall L, Gais S, Born J (2004): Learning increases human electroencephalographic coherence during subsequent slow sleep oscillations. Proc Natl Acad Sci USA 101:13963–13968. [DOI] [PMC free article] [PubMed] [Google Scholar]
- Moosmann M, Ritter P, Krastel I, Brink A, Thees S, Blankenburg F, Taskin B, Obrig H, Villringer A (2003): Correlates of alpha rhythm in functional magnetic resonance imaging and near infrared spectroscopy. Neuroimage 20:145–158. [DOI] [PubMed] [Google Scholar]
- Murphy K, Birn RM, Handwerker DA, Jones TB, Bandettini PA (2009): The impact of global signal regression on resting state correlations: Are anti‐correlated networks introduced? Neuroimage 44:893–905. [DOI] [PMC free article] [PubMed] [Google Scholar]
- Musso F, Brinkmeyer J, Mobascher A, Warbrick T, Winterer G (2010): Spontaneous brain activity and EEG microstates. A novel EEG/fMRI analysis approach to explore resting‐state networks. Neuroimage 52:1149–1161. [DOI] [PubMed] [Google Scholar]
- Nir Y, Fisch L, Mukamel R, Gelbard‐Sagiv H, Arieli A, Fried I, Malach R (2007): Coupling between neuronal firing rate, gamma LFP, and BOLD fMRI is related to interneuronal correlations. Curr Biol 17:1275–1285. [DOI] [PubMed] [Google Scholar]
- Nir Y, Mukamel R, Dinstein I, Privman E, Harel M, Fisch L, Gelbard‐Sagiv H, Kipervasser S, Andelman F, Neufeld MY, Kramer U, Arieli A, Fried I, Malach R (2008): Interhemispheric correlations of slow spontaneous neuronal fluctuations revealed in human sensory cortex. Nat Neurosci 11:1100–1108. [DOI] [PMC free article] [PubMed] [Google Scholar]
- Ogawa S, Menon RS, Tank DW, Kim SG, Merkle H, Ellermann JM, Ugurbil K (1993): Functional brain mapping by blood oxygenation level‐dependent contrast magnetic resonance imaging. A comparison of signal characteristics with a biophysical model. Biophys J 64:803–812. [DOI] [PMC free article] [PubMed] [Google Scholar]
- Olbrich S, Mulert C, Karch S, Trenner M, Leicht G, Pogarell O, Hegerl U (2009): EEG‐vigilance and BOLD effect during simultaneous EEG/fMRI measurement. Neuroimage 45:319–332. [DOI] [PubMed] [Google Scholar]
- Paus T (1996): Location and function of the human frontal eye‐field: A selective review. Neuropsychologia 34:475–483. [DOI] [PubMed] [Google Scholar]
- Paus T, Zatorre RJ, Hofle N, Caramanos Z, Gotman J, Petrides M, Evans AC (1997): Time‐related changes in neural systems underlying attention and arousal during the performance of an auditory vigilance task. J Cogn Neurosci 9:392–408. [DOI] [PubMed] [Google Scholar]
- Paxinos G, Huang X‐F, Toga AW (1999): The Rhesus Monkey Brain in Stereotaxic Coordinates, 1st ed. Academic Press. [Google Scholar]
- Pouget A, Dayan P, Zemel RS (2003): Inference and computation with population codes. Annu Rev Neurosci 26:381–410. [DOI] [PubMed] [Google Scholar]
- Rabinovich MI, Huerta R, Varona P, Afraimovich VS (2008): Transient cognitive dynamics, metastability, and decision making. PLoS Comput Biol 4:e1000072. [DOI] [PMC free article] [PubMed] [Google Scholar]
- Raichle ME (2010): Two views of brain function. Trends Cogn Sci 14:180–190. [DOI] [PubMed] [Google Scholar]
- Ramot M, Wilf M, Goldberg H, Weiss T, Deouell LY, Malach R (2011): Coupling between spontaneous (resting state) fMRI fluctuations and human oculo‐motor activity. Neuroimage 58:213–225. [DOI] [PubMed] [Google Scholar]
- Ringach DL (2009): Spontaneous and driven cortical activity: Implications for computation. Curr Opin Neurobiol 19:439–444. [DOI] [PMC free article] [PubMed] [Google Scholar]
- Ritter P, Moosmann M, Villringer A (2009): Rolandic alpha and beta EEG rhythms' strengths are inversely related to fMRI‐BOLD signal in primary somatosensory and motor cortex. Hum Brain Mapp. 30:1168–1187. [DOI] [PMC free article] [PubMed] [Google Scholar]
- Sadaghiani S, Hesselmann G, Kleinschmidt A (2009): Distributed and antagonistic contributions of ongoing activity fluctuations to auditory stimulus detection. J Neurosci 29:13410–13417. [DOI] [PMC free article] [PubMed] [Google Scholar]
- Sadaghiani S, Hesselmann G, Friston KJ, Kleinschmidt A (2010): The relation of ongoing brain activity, evoked neural responses, and cognition. Front Syst Neurosci 4:20. [DOI] [PMC free article] [PubMed] [Google Scholar]
- Sammer G, Blecker C, Gebhardt H, Bischoff M, Stark R, Morgen K, Vaitl D (2007): Relationship between regional hemodynamic activity and simultaneously recorded EEG‐theta associated with mental arithmetic‐induced workload. Hum Brain Mapp 28:793–803. [DOI] [PMC free article] [PubMed] [Google Scholar]
- Sapir A, d' Avossa G, McAvoy M, Shulman GL, Corbetta M (2005): Brain signals for spatial attention predict performance in a motion discrimination task. Proc Natl Acad Sci USA 102:17810–17815. [DOI] [PMC free article] [PubMed] [Google Scholar]
- Sato JR, Junior EA, Takahashi DY, de Maria Felix M, Brammer MJ, Morettin PA (2006): A method to produce evolving functional connectivity maps during the course of an fMRI experiment using wavelet‐based time‐varying Granger causality. Neuroimage 31:187–196. [DOI] [PubMed] [Google Scholar]
- Shirer WR, Ryali S, Rykhlevskaia E, Menon V, Greicius MD (2012): Decoding subject‐driven cognitive States with whole‐brain connectivity patterns. Cereb Cortex 22:158–165. [DOI] [PMC free article] [PubMed] [Google Scholar]
- Shmuel A, Leopold DA (2008): Neuronal correlates of spontaneous fluctuations in fMRI signals in monkey visual cortex: Implications for functional connectivity at rest. Hum Brain Mapp 29:751–761. [DOI] [PMC free article] [PubMed] [Google Scholar]
- Smith SM, Fox PT, Miller KL, Glahn DC, Fox PM, Mackay CE, Filippini N, Watkins KE, Toro R, Laird AR, Beckmann CF (2009): Correspondence of the brain's functional architecture during activation and rest. Proc Natl Acad Sci USA 106:13040–13045. [DOI] [PMC free article] [PubMed] [Google Scholar]
- Sporns O (2010): Networks of the Brain, 1st ed. The MIT Press. [Google Scholar]
- Squire L, Zola‐Morgan S (1991): The medial temporal lobe memory system. Science 253:1380–1386. [DOI] [PubMed] [Google Scholar]
- Steriade M, Contreras D, Curró Dossi R, Nuñez A (1993a): The slow (<1 Hz) oscillation in reticular thalamic and thalamocortical neurons: Scenario of sleep rhythm generation in interacting thalamic and neocortical networks. J Neurosci 13:3284–3299. [DOI] [PMC free article] [PubMed] [Google Scholar]
- Steriade M, Nuñez A, Amzica F (1993b): A novel slow (<1 Hz) oscillation of neocortical neurons in vivo: Depolarizing and hyperpolarizing components. J Neurosci 13:3252–3265. [DOI] [PMC free article] [PubMed] [Google Scholar]
- Steriade M, Nuñez A, Amzica F (1993c): Intracellular analysis of relations between the slow (<1 Hz) neocortical oscillation and other sleep rhythms of the electroencephalogram. J Neurosci 13:3266–3283. [DOI] [PMC free article] [PubMed] [Google Scholar]
- Stern EA, Kincaid AE, Wilson CJ (1997): Spontaneous subthreshold membrane potential fluctuations and action potential variability of rat corticostriatal and striatal neurons in vivo. J Neurophysiol 77:1697–1715. [DOI] [PubMed] [Google Scholar]
- Steriade M (2001): Impact of network activities on neuronal properties in corticothalamic systems. J Neurophysiol 86:1–39. [DOI] [PubMed] [Google Scholar]
- Sun FT, Miller LM, Rao AA, D'Esposito M (2007): Functional connectivity of cortical networks involved in bimanual motor sequence learning. Cereb Cortex 17:1227–1234. [DOI] [PubMed] [Google Scholar]
- Tognoli E, Kelso JAS (2009): Brain coordination dynamics: True and false faces of phase synchrony and metastability. Prog Neurobiol 87:31–40. [DOI] [PMC free article] [PubMed] [Google Scholar]
- van Dijk H, Schoffelen J‐M, Oostenveld R, Jensen O (2008): Prestimulus oscillatory activity in the alpha band predicts visual discrimination ability. J Neurosci 28:1816–1823. [DOI] [PMC free article] [PubMed] [Google Scholar]
- van Dijk KRA, Hedden T, Venkataraman A, Evans KC, Lazar SW, Buckner RL (2009): Intrinsic functional connectivity as a tool for human connectomics: theory, properties, and optimization. J Neurophys 103:297–321. [DOI] [PMC free article] [PubMed] [Google Scholar]
- van Dijk KRA, Sabuncu MR, Buckner RL (2012): The influence of head motion on intrinsic functional connectivity MRI. Neuroimage 59:431–438. [DOI] [PMC free article] [PubMed] [Google Scholar]
- van Essen DC, Dickson J, Harwell J, Hanlon D, Anderson CH, Drury HA (2001): An integrated software system for surface‐based analyses of cerebral cortex. J Am Med Inform Assoc. 8:443–459. [DOI] [PMC free article] [PubMed] [Google Scholar]
- van Essen DC (2004): Surface‐based approaches to spatial localization and registration in primate cerebral cortex. Neuroimage 23 (Suppl 1):S97–107. [DOI] [PubMed] [Google Scholar]
- van Essen DC (2005): A population‐average, landmark‐ and surface‐based (PALS) atlas of human cerebral cortex. Neuroimage 28:635–662. [DOI] [PubMed] [Google Scholar]
- Vanhaudenhuyse A, Noirhomme Q, Tshibanda LJ‐F, Bruno M‐A, Boveroux P, Schnakers C, Soddu A, Perlbarg V, Ledoux D, Brichant J‐F, Moonen G, Maquet P, Greicius MD, Laureys S, Boly M (2010): Default network connectivity reflects the level of consciousness in non‐communicative brain‐damaged patients. Brain 133:161–171. [DOI] [PMC free article] [PubMed] [Google Scholar]
- Veselis RA (2001): Anesthesia—A descent or a jump into the depths? Conscious Cogn 10:230–235. [DOI] [PubMed] [Google Scholar]
- Vincent JL, Patel GH, Fox MD, Snyder AZ, Baker JT, Van Essen DC, Zempel JM, Snyder LH, Corbetta M, Raichle ME (2007): Intrinsic functional architecture in the anaesthetized monkey brain. Nature 447:83–86. [DOI] [PubMed] [Google Scholar]
- Vogels TP, Rajan K, Abbott LF (2005): Neural network dynamics. Annu Rev Neurosci 28:357–376. [DOI] [PubMed] [Google Scholar]
- Werner G (2007): Metastability, criticality and phase transitions in brain and its models. Biosystems 90:496–508. [DOI] [PubMed] [Google Scholar]
- Wu L, Eichele T, Calhoun VD (2010): Reactivity of hemodynamic responses and functional connectivity to different states of alpha synchrony: A concurrent EEG‐fMRI study. Neuroimage 52:1252–1260. [DOI] [PMC free article] [PubMed] [Google Scholar]
- Wurtz RH, Goldberg ME (1989): The Neurobiology of Saccadic Eye Movements. Amsterdam: Elsevier. [Google Scholar]
- Zhao F, Zhao T, Zhou L, Wu Q, Hu X (2008): BOLD study of stimulation‐induced neural activity and resting‐state connectivity in medetomidine‐sedated rat. NeuroImage 39:248–260. [DOI] [PMC free article] [PubMed] [Google Scholar]
Associated Data
This section collects any data citations, data availability statements, or supplementary materials included in this article.
Supplementary Materials
Supporting Information Figure 1
Supporting Information Figure 2
Supporting Information Figure 3
Supporting Information Figure 4
Supporting Information Figure 5
Supporting Information Figure 6
Supporting Information Figure 7
Supporting Information Figure 8
Supporting Information Figure 9
Supporting Information Figure 10
Supporting Information Figure 11
Supporting Information Figure 12
Supporting Information Movie 1
Supporting Information Movie 2