ABSTRACT
A preovulatory surge (PS) of luteinizing hormone (LH) and progesterone triggers follicle ovulation, which is the first step of egg production and is orchestrated by the hypothalamo-pituitary-gonadal (HPG) axis. In the HPG axis, hypothalamic peptides, gonadotropin releasing hormone, and gonadotropin inhibitory hormone, control the production of follicle stimulating hormone and LH by the pituitary, which subsequently regulate ovarian production of estradiol and progesterone, respectively. The goal of this study was to characterize the HPG axis function of average egg producing hens by assessing plasma hormone profiles and hypothalamic, pituitary, and follicle gene expression outside and during the PS (n = 3 per group). Results were analyzed by a one-way ANOVA using the mixed models procedure of SAS. Plasma estradiol was not affected by the PS (P > 0.05), but plasma progesterone levels increased 8-fold during the PS when compared to basal progesterone levels (P < 0.05). HPG axis gene expression related to ovulation stimulation (e.g., GNRH, GNRHR, and LHB) was down-regulated during the PS; whereas gene expression related to follicle development (e.g., FSHB) was up-regulated during the PS. Additionally, in the hypothalamus and pituitary, estradiol receptor expression was up-regulated during the PS, whereas progesterone receptor expression was down-regulated during the PS. In the follicle cells, gene expression pertaining to progesterone (e.g., STAR), androgen (e.g., HSD17B1), and estradiol (e.g., CYP19A1) production was up-regulated during the PS. Prior to this study, the HPG axis had yet to be characterized during the PS in the turkey hen. This study showed that the PS significantly impacted gene expression in the hypothalamus, pituitary, and ovarian follicles. These results provide a foundation for further research into the regulation of ovulation and egg production in turkey hens.
Keywords: egg production, ovulation, hypothalamo-pituitary-gonadal axis, steroid hormone, gene expression
INTRODUCTION
Egg production in birds begins with follicle ovulation from the ovary followed by the addition of the albumen, shell membranes, and shell within the specialized segments of the oviduct. Hormonal inputs from the hypothalamus, pituitary, and ovary control the timing of follicle ovulation, and ultimately the timing of egg production (Johnson, 2014). While a preovulatory surge (PS) of luteinizing hormone (LH) and progesterone is necessary for each daily ovulation, additional hormonal inputs play a role in follicle development and steroid production (Yang et al., 1997). The main neuroendocrine axis that regulates reproductive activity is the hypothalamo-pituitary-gonadal (HPG) axis; however, this axis has yet to be characterized during the PS in the turkey hen.
The HPG axis consists of the hypothalamus, pituitary, and a single ovary in avian species (Decuypere et al., 2002). The hypothalamus regulates pituitary gonadotropin production through the release of either gonadotropin releasing hormone (GNRH) or gonadotropin inhibitory hormone (GNIH) to stimulate or inhibit production, respectively. GNRH action, in the pituitary, is mediated through GNRH receptor III (GNRHR), whereas, GNIH action is elicited through gonadotropin inhibitory hormone receptors (GNIHR1 and GNIHR2), both of which are present on pituitary gonadotrophs (Bédécarrats et al., 2016). In response to hypothalamic releasing factors, the pituitary secretes the gonadotropins, follicle stimulating hormone (FSH) and LH. The ovarian follicles express FSH receptors (FSHR) and LH receptors (LHCGR). In response to pituitary gonadotropins, ovarian follicles respond with the production of steroid hormones. Steroid hormones, specifically progesterone and estradiol, can prompt various feedback loops through binding of progesterone receptors (PGR) or estradiol receptors (ESR1 and ESR2), present in the hypothalamus and pituitary (Kawashima et al., 1987).
Follicles within the ovary range in maturation from immature primordial follicles to mature preovulatory follicles, with the preovulatory follicles arranged in a hierarchical ovulation order (termed F1 to F10 based on follicle size) (Johnson and Woods, 2009). The follicle wall of preovulatory follicles contain 3 cell types that play specialized roles in steroid production: (1) granulosa cells producing progesterone; (2) theca interna cells producing androgens; and (3) theca externa cells producing estrogen (Porter et al., 1989). During follicle maturation through the preovulatory hierarchy, progesterone production increases, while androgen and estradiol production decreases (Porter et al., 1991). During steroidogenesis, cholesterol is converted to progesterone through the actions of steroidogenic acute regulatory protein (STAR), cholesterol side chain cleavage enzyme (CYP11A1), and 3β-hydroxysteroid dehydrogenase (HSD3B1). Progesterone can be further converted to 2 androgens, androstenedione and testosterone, by the enzymes 17, 20 lyase (CYP17A1) and 17β-hydroxysteroid dehydrogenase (HSD17B1). Lastly, androgens can be converted to estradiol by aromatase (CYP19A1) (Robinson and Etches, 1986).
Despite the central role of the PS in egg production, there is little information regarding HPG axis function during the PS in turkey hens. This study examined turkey hens sampled outside or during the PS to (1) define the plasma concentrations of progesterone and estradiol and (2) characterize the expression of key HPG axis genes in the reproductive tissues, namely the hypothalamus, pituitary, and the follicular cells of the F1 and F5 ovarian follicles.
MATERIALS AND METHODS
Hen Selection
Females from a commercial line (Hybrid Turkey, Kitchener, Ontario) were housed at the Beltsville Agricultural Research Center (BARC) in individual cages. Turkey hens were maintained under standard poultry management practices with artificial lighting (14L:10D) and were provided feed ad libitum to NRC standards. Hens were sampled at 35 wk of age. Daily egg records were used to calculate each hen's number of eggs per day (EPD) by dividing the total number of eggs produced by the number of days in production. Females with an EPD between 0.68 and 0.72 were classified as average egg production hens (AEPH) and were used for sampling. The timing of the PS was determined for each hen using hourly egg records. Using the time of egg lay, the prior PS was estimated to occur 34 h (8 h from the PS to follicle ovulation and 26 h from ovulation to egg lay) before the egg was laid. During a laying sequence, hens will maintain an ovulation interval of 26 h. Based on the calculated timing of the PS, the subsequent PS could be predicted for the next egg of the sequence. All hens were sampled during the second day of the hen's sequence and were sampled with a hard-shelled egg in the reproductive tract. The hypothalamus, pituitary, F1 follicle, and F5 follicle were isolated from 3 AEPH outside of the PS and from 3 AEPH during the PS for a total of 6 hens. Hens were confirmed to be outside or during the PS by plasma progesterone levels. Blood samples were taken from the wing vein immediately before tissue sampling and fractionated by centrifugation. Plasma samples were stored at −20°C prior to assessment through radioimmunoassays (RIAs) as described below. The hypothalamus and pituitary were snap frozen in liquid nitrogen as whole tissues for RNA extraction, whereas the F1 and F5 follicles were processed to isolate the 3 cell types from the follicle wall as described below. Isolated tissues and cells were stored at −80°C prior to RNA extraction. All animal procedures were approved by the Institutional Animal Care and Use Committee at BARC and at the University of Maryland.
RIAs
The RIAs used for progesterone and estradiol were coated tube kits (MP Biomedicals, Solon, OH). For the progesterone and estradiol RIAs, plasma samples were ether extracted prior to the assay. All protocols were performed as directed by the manufacturer. All samples were assayed in duplicate. The standard curve was assessed for linearity as well as parallelism using serial plasma dilutions. The intraassay coefficients of variation were determined by pools run every 30 samples and were 4.45% for progesterone and 6.05% for estradiol. All samples were measured in a single RIA for each hormone.
Cell Isolation
All cell isolation procedures were performed using Minimum Essential Medium, Spinner modification (SMEM) supplemented with 0.1% bovine serum albumen, 100-U/mL penicillin G, and 100-μg/mL streptomycin sulfate (0.1% BSA and P/S).
Follicle cell-type isolation was achieved using an adapted published method (Porter et al., 1989). Briefly, the F1 and F5 follicles were drained of yolk through a small incision made at the stigma of each follicle. After the yolk was drained, the follicle wall was inverted. The granulosa layer was peeled off using curved forceps and placed into 20 mL of SMEM (0.1% BSA and P/S) with 1 mg/mL of trypsin. The granulosa layer was incubated for 15 min at 37°C in a shaking water bath and triturated every 5 min using a flame-polished, siliconized Pasteur pipet. At the end of incubation, the granulosa cells were centrifuged (20 × g for 10 min), re-suspended in 10 mL of SMEM (0.1% BSA and P/S), filtered through nylon mesh (70 μm), and held at 37°C prior to Percoll suspension.
The theca interna layer was isolated by clamping the inverted follicle wall across the stigma opening to close off access to the theca externa layer. The clamped follicle was placed into 20 mL of SMEM (0.1% BSA and P/S) with 1 mg/mL of trypsin and incubated for 15 min at 37°C in a shaking water bath. The clamped follicle was removed from the SMEM and placed in a glass petri dish, where the theca interna cells were gently scraped from the follicle wall using a scalpel blade. The separated cells were returned to 20 mL of SMEM (0.1% BSA and P/S) with 1 mg/mL of trypsin and incubated at 37°C for an additional 10 min, with trituration every 5 min. At the end of incubation, the theca interna cells were centrifuged (20 × g for 10 min), re-suspended in 10 mL of SMEM (0.1% BSA and P/S), filtered through nylon mesh (70 μm), and held at 37°C prior to Percoll suspension.
The theca externa layer was dispersed by mincing the remaining clamped follicle and placing the minced pieces into 20 mL of SMEM (0.1% BSA and P/S) with 1 mg/mL of trypsin. The theca externa pieces were incubated at 37°C in a shaking water bath for 30 min, with trituration using Pasteur pipettes of decreasing inlet sizes every 5 min to dissociate the tissue pieces. At the end of incubation, the theca externa cells were centrifuged (20 × g for 10 min), re-suspended in 10 mL of SMEM (0.1% BSA and P/S), filtered through nylon mesh (70 μm), and held at 37°C prior to Percoll suspension.
Percoll suspensions (50%) were used to remove red blood cells and extra material from each of the 3 cell-type suspensions. For each cell type, the dispersed cells were layered onto a Percoll suspension and centrifuged (20 × g for 15 min). After centrifugation, the follicle cells migrated at the interface of the Percoll suspension, while red blood cells and extra material migrated to the bottom of the Percoll suspension. The follicle cells were collected from the interface using a Pasteur pipette and suspended in 10 mL of SMEM (0.1% BSA and P/S). Cells were washed twice in 10 mL of SMEM (0.1% BSA and P/S) to remove Percoll (20 × g for 10 min), pelleted (1,000 × g for 10 min at 4°C), and snap frozen in liquid nitrogen for RNA extraction.
RT-qPCR
Total RNA was isolated from hypothalamus, pituitary, granulosa, theca interna, and theca externa cells from the F1 and F5 follicles with RNeasy Mini kits (Qiagen, Valencia, CA), including on-column deoxyribonuclease digestion, and quantified with Quant-iT RiboGreen RNA Quantitation Reagent (Invitrogen, Carlsbad, CA). Reverse transcription reactions (20 μL) for the hypothalamus and pituitary samples were performed on 1 μg total RNA with M-MLV reverse transcriptase (Thermo Fisher Scientific, Waltham, MA) and an oligo dT primer (Thermo Fisher Scientific. Waltham, MA). Reactions were diluted to 100 μL prior to PCR analysis. Reverse transcription reactions (20 μL) for the granulosa, theca interna, and theca externa samples of the F1 and F5 follicles were performed on 200 ng total RNA with SuperScript III (Thermo Fisher Scientific, Waltham, MA) and an anchored oligo-dT primer (5′-CGGAATTCTTTTTTTTTTTTTTTTTTTTV-3′). Reactions for the granulosa and theca externa cells were diluted to 200 μL prior to PCR analysis, while reactions for theca interna cells were not diluted prior to PCR analysis. For all reverse transcription reactions, a pool of total RNA was made and the reaction conducted without reverse transcriptase (No RT) as a control for genomic DNA contamination.
Expression levels of primary genes of the HPG axis were quantified by RT-qPCR. Primers (Integrated DNA Technologies, Skokie, IL) used in the PCR reactions were designed using NCBI primer BLAST Software (NCBI, Bethesda, MD) to target a 3’ region of the transcript and to span an intron. Primers were also designed to amplify all known splice variants. Primers were designed to have a melting temperature (Tm) of 58 to 60°C, a GC content (GC%) of 40 to 60%, a length of 18 to 30 nucleotides, and to yield product of a length of 90 to 250 nucleotides. Amplification efficiencies between 0.9 and 1.1 were attained for each primer pair. To determine amplification efficiency, 2-fold serial dilutions of pooled cDNA were analyzed by RT-qPCR. Amplification efficiency was calculated as the absolute value of the slope of the linear regression line that resulted after plotting Ct versus log2-transformed template. Additionally, primers were validated by dissociation curve analysis, gel electrophoresis, and sequencing of PCR products. Primer sequences are listed in Table 1.
Table 1.
Primers for RT-qPCR.
| Symbol | ID1 | Forward primer | Reverse primer |
|---|---|---|---|
| GNRH1 | 00861 | TGGCAATCTGCTTGGCTCA | CCAGGGCATTCAGCCTTC |
| GNIH | 10628 | CAGTGGCGTTTCTAACACC | ACTCCTCTGCTTTTCCTCC |
| GNRHR2 | 09590 | TCCCAGGAGGGAACTTCAC | TTCATGCGTGCCTTGGAG |
| GNIHR1 | 05314 | TCTGTCTCCGCCTCTGTTTT | GACAGTTAGGGTGATGGC |
| GNIHR2 | 10074 | ACCTGGCTGTCAGCGATTTA | TCCTTGGACCATCCCACTC |
| LHB3 | GGAGAAGGACGAATGTCCC | CCCCATAAGTGCAGGACG | |
| FSHB | 01649 | GTGGTGCTCAGGATACTGCT | AGATTCAGGATGGTCACC |
| CGA | 13689 | CACACACCAAGGACAGCTC | CTCCCCTAGCTTGCACTCT |
| PGR | 15180 | ACCAAGTTCCTTGCTGACC | CCTGGTAGCAATTTTGACC |
| ESR1 | 12692 | ATCCACCGTGTTCTGGACA | TCGTAGAGCGGAACCACA |
| ESR2 | 13507 | TCACAGATGCTCTGGTGTG | GAGTGTGTGCGCATTCAA |
| LHCGR | 05659 | ATCCACAGCCATGCCTTCAA | TTTATCCAGAGGCGGCAG |
| FSHR | 05711 | ACATTCCCACCAATGCCACA | ATCTGAGGCTTGGAAGGT |
| STAR | 02130 | ATCTCCTACCAACACCTGCG | GGACATCTCCATCTCGCTG |
| CYP11A1 | 02665 | GTTGGGTGTCTACGAGAGC | CTCCTTGTTCAGGGTCAG |
| HSD3B14 | TGCTGGAAGAAGATGAGGC | TCACGTTGACTTCCCAGA | |
| CYP17A1 | 10364 | GCTGAAGAAGGGGAAGGCT | GAAGGAGAGGGGCAGTG |
| HSD17B1 | 06940 | CTGCCACTACTGCGGAAAT | TTTGGAAAGCTCCTGCCT |
| CYP19A1 | 06571 | TGGATCAGCGGTGAAGAAA | CTTCCAGTGTGCTGGGTT |
| GAPDH | 14005 | GGACACTTCAAGGGCACTG | TAACACGCTTAGCACCAC |
| PGK1 | 06196 | CAAAGGCCCTTGAGAGTCC | ATGCCATTCCACCACCAAT |
| TUBB2B | 04168 | GATCTTCCGACCCGACAAC | GAGTGGGTCAACTGGAAG |
Ensembl turkey genome assembly (https://useast.ensembl.org/Meleagris_gallopavo/Info/Index) gene identification preceded by ENSMGAG000000.
GNRHR refers to the sequence encoding GNRHR-III.
The sequence for LHB is not on the assembled turkey genome and primers were designed based on the sequence in GenBank (accession No. L35519.1).
The sequence for HSD3B1 is not on the assembled turkey genome and primers were designed based on the NCBI reference sequence (RefSeq. XM_01,072,6543.2).
PCR reactions (15 μL) contained 1 μL of cDNA, 0.4 μM of each primer, PCR buffer (50 mM KCl, 10 mM Tris–HCl, 0.1% triton-X-100), 0.12 U/μL Taq Polymerase, 0.2 μM dNTPs, 40 nM fluorescein (Invitrogen, Waltham, MA), and SYBR Green I Nucleic Acid Gel Stain diluted 1:10,000 (Invitrogen, Waltham, MA). All reactions were carried out using CFX Connect Real-Time PCR System (Bio-Rad, Hercules, CA). The PCR cycling conditions were as follows: initial denaturation at 95°C for 3 min followed by 40 cycles of 95°C for 15 s, 60°C for 30 s, and 72°C for 30 s. Dissociation curve analysis and gel electrophoresis were conducted to ensure that a single PCR product of appropriate size was amplified in each reaction and was absent from the no RT and water controls. Data were normalized to housekeeping genes and analyzed by the 2−ΔΔ Ct method. For the hypothalamus, GAPDH was used for normalization. For the pituitary, PGK1 was used for normalization. For all of the follicle cell types, BTUB was used for normalization. All PCR reactions for each gene in a given tissue were analyzed in a single run within a 96-well plate, allowing accurate performance of relative quantification without the need to include a reference control sample in each plate.
Statistics
All data were analyzed using SAS software (SAS Institute, Cary, NC). Normalized RT-qPCR data were log2 transformed before statistical analysis. An ANOVA using the mixed models procedure (PROC MIXED) was conducted to compare the plasma hormone concentrations and log2 transformed gene expression between the two hen groups (e.g., outside and inside of the PS). The least squares means for each group were compared using the test of least significant difference (PDIFF statement) when this indicated an overall significance level of P < 0.05. Data are presented relative to basal expression for the hypothalamus and pituitary. For the granulosa, theca interna, and theca externa layers, data are presented relative to basal expression of the F1 follicle to visualize mRNA expression differences due to the PS as well as mRNA expression differences across the F1 and F5 follicles.
RESULTS
An 8-fold increase (P < 0.05) in plasma progesterone levels was detected for hens sampled during the PS compared to hens sampled outside of the PS (Figure 1A); however, plasma estradiol levels were similar (P > 0.05) for both hen groups (Figure 1B).
Figure 1.
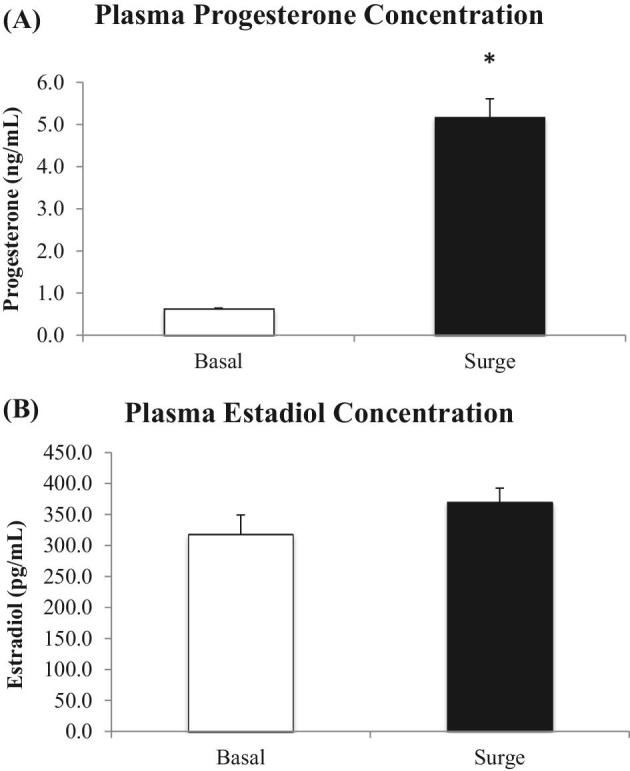
Plasma progesterone and estradiol hormone profiles in hens sampled outside (basal) and inside (surge) of the preovulatory surge (PS). Significant steroid plasma concentration differences are denoted with an asterisk.
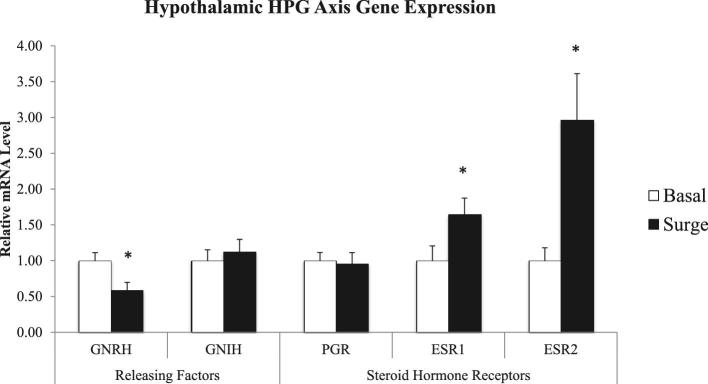
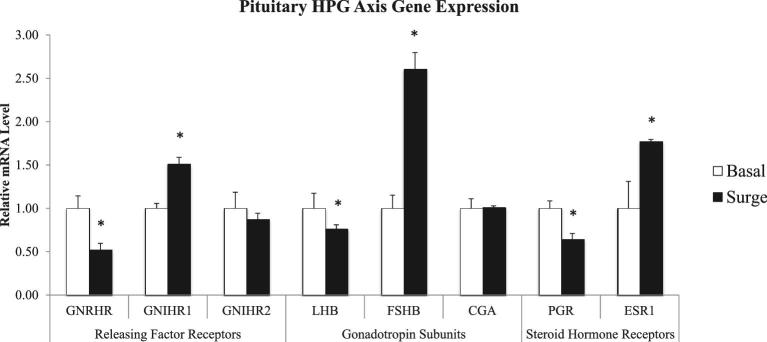
Hypothalamic expression of the main stimulatory releasing factor and of 2 of the steroid hormone receptors differed significantly (P < 0.05) between hens sampled outside and during the PS (Figure 2). For hens sampled during the PS, GNRH was down-regulated, while ESR1 and ESR2 were up-regulated in comparison to hens sampled outside of the PS. Pituitary genes encoding releasing factor receptors, steroid hormone receptors, and gonadotropin subunits were differentially expressed between the two groups of hens (P < 0.05) (Figure 3). Both GNRHR and PGR were down-regulated during the PS; whereas GNIHR1 and ESR1 were up-regulated during the PS. Hens exhibited higher FSHB expression and lower LHB expression during of the PS compared to outside of the PS.
Figure 2.
Hypothalamic gene expression of hypothalamo-pituitary-gonadal (HPG) axis releasing factors and steroid hormone receptors in hens samples outside (basal) and inside (surge) of the preovulatory surge (PS). Normalized data are presented relative to basal expression for each gene. Significance is denoted with an asterisk.
Figure 3.
Pituitary gene expression of hypothalamo-pituitary-gonadal (HPG) axis releasing factor receptors, gonadotropin subunits, and steroid hormone receptors in hens samples outside (basal) and inside (surge) of the preovulatory surge (PS). Normalized data are presented relative to basal expression for each gene. Significance is denoted with an asterisk.
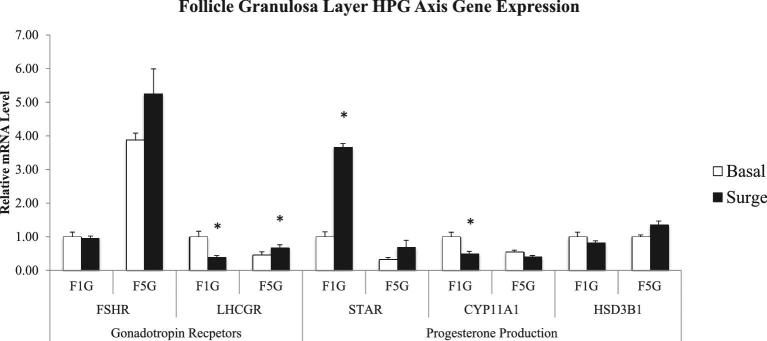
In the granulosa cell layer, expression of 1 gonadotropin receptor and 2 of the key genes involved in progesterone production were altered significantly during the PS in the two types of follicles sampled (P < 0.05) (Figure 4). During the PS, LHCGR expression was down-regulated in the F1 granulosa cells but was up-regulated in the F5 granulosa cells. Expression of STAR was increased during the PS in the F1 granulosa cells, in comparison to expression outside of the PS. In contrast, expression of CYP11A1 was decreased during the PS in the F1 granulosa cells, when compared to expression outside of the PS.
Figure 4.
Follicle granulosa layer gene expression related to gonadotropin action and progesterone production in the hypothalamo-pituitary-gonadal axis comparing the expression of hens samples outside (basal) and inside (surge) of the preovulatory surge (PS). Normalized data are presented relative to basal expression of the F1 follicle for each gene. Significance is denoted with an asterisk.
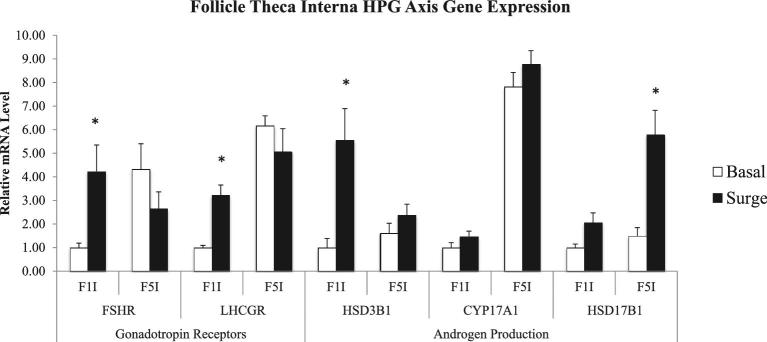
The PS impacted the theca interna cell layer expression of both gonadotropin receptors and of genes involved in androgen production (P < 0.05) (Figure 5). In the F1 theca interna cells, FSHR and LHCGR expression were up-regulated during the PS. HSD3B1 expression in the F1 theca interna cells as well as HSD17B1 expression in the F5 theca interna cells were increased during the PS in comparison to expression outside of the PS.
Figure 5.
Follicle theca interna layer gene expression related to gonadotropin action and androgen production in the hypothalamo-pituitary-gonadal (HPG) axis comparing the expression of hens samples outside (basal) and inside (surge) of the preovulatory surge (PS). Normalized data are presented relative to basal expression of the F1 follicle for each gene. Significance is denoted with an asterisk.
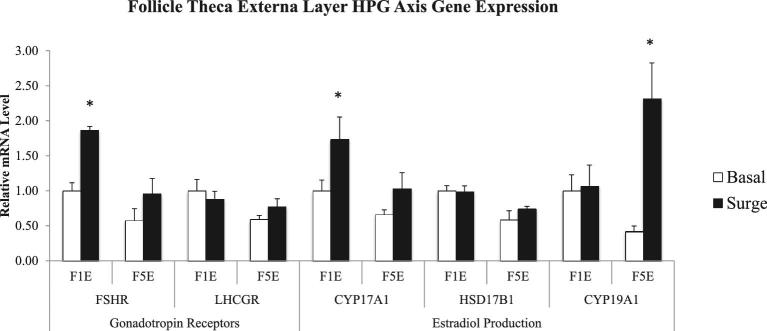
In the theca externa layer, the PS significantly impacted the expression of both gonadotropin receptors as well as genes involved in estradiol production (P < 0.05) (Figure 6). In the F1 theca externa cells, FSHR expression was up-regulated during the PS relative to outside of the PS. In the F5 theca externa cells, LHCGR expression was up-regulated during the PS, when compared to expression outside of the PS. Regarding the expression of the enzymes involved in estradiol production, no significant differences were seen in the theca externa cells of the F1 follicle between the two hen groups (P > 0.05). However, in the F5 theca externa cells, significant differences were seen in the expression of CYP19A1, with CYP19A1 showing up-regulation during the PS in comparison to expression outside of PS (P < 0.05).
Figure 6.
Follicle theca externa layer gene expression related to gonadotropin action and estradiol production in the hypothalamo-pituitary-gonadal (HPG) axis comparing the expression of hens samples outside (basal) and inside (surge) of the preovulatory surge (PS). Normalized data are presented relative to basal expression of the F1 follicle for each gene. Significance is denoted with an asterisk.
DISCUSSION
This study provided novel insights regarding the mRNA expression of key HPG axis genes during the PS of hormones that triggers ovulation. In each of the tissues examined, the PS impacted the HPG axis. The PS altered HPG axis gene expression, unveiling aspects of ovulation regulation at the molecular level. The gene expression results are summarized in Figure 7.
Figure 7.
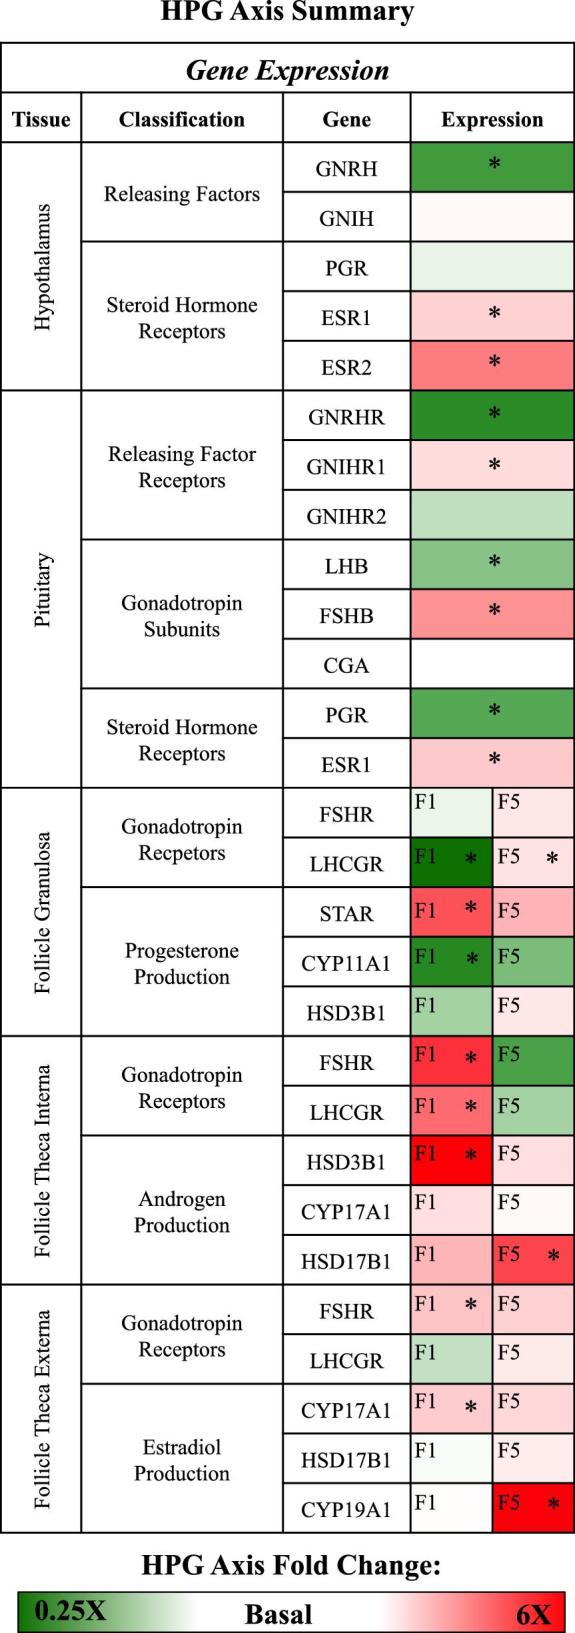
Summary of relative hypothalamo-pituitary-gonadal (HPG) axis gene expression changes during the preovulatory surge (PS). Red, white, and green represent increased expression, no change in expression, and decreased expression during the PS, respectively. The legend at the bottom of the figure displays how the color intensity relates to the fold change difference seen during the PS. Significant changes in gene expression are denoted by an asterisk.
Plasma concentrations of progesterone both outside and inside of the PS were consistent with previous studies conducted in turkey hens (Yang et al., 1997). Plasma levels of progesterone and estradiol were also similar to levels seen in studies in laying chickens (Johnson and Tienhoven, 1980) as well as in broiler chickens (Liu et al., 2004). As in previous studies, the PS did not impact estradiol levels. An 8-fold increase from 0.6 to 5.2 ng/mL in progesterone levels confirmed that hens were sampled correctly outside and during the PS. Progesterone levels in turkeys were consistent with levels seen in chickens; however, several studies have pointed out functional differences in the role of progesterone between these 2 species. For instance, exogenous progesterone in chicken hens was capable of inducing ovulation, whereas exogenous progesterone was not capable of inducing ovulation in turkey hens (Yang et al., 1998; Johnson et al., 1985). This insight indicates that the regulation and feedback for ovulation may include different factors in chickens and in turkeys.
In the hypothalamus, GNRH mRNA levels were decreased during the PS. This study is the first to quantify GNRH mRNA expression during the PS in any avian species. A previous study demonstrated that plasma levels of GNRH in chicken hens did not change during the PS (Contijoch and Advis, 1993); however, given the apparent differences in the feedback loop for ovulation between the chicken and the turkey, this contrast is not surprising. Similar studies in mammals showed increased expression levels of GNRH mRNA as well as increased GNRH plasma concentrations during the PS (Christian and Moenter, 2010). Physiological reproductive differences between mammalian and avian species most likely account for the discrepancies in GNRH mRNA levels seen during the PS.
Another important finding of this study is that expression of estradiol receptors within the hypothalamus and pituitary were up-regulated during the PS. Estradiol receptors have been shown to be capable of steroid hormone binding in the hypothalamus and pituitary of chickens (Kawashima et al., 1993). Increased expression of estrogen receptors in the hypothalamus and pituitary during the PS may indicate a feedback mechanism in neuropeptide or gonadotropin regulation. Transcripts for pituitary gonadotropins also were affected by the PS. For example, LHB mRNA levels decreased during the PS but FSHB mRNA levels increased. High plasma LH concentrations are associated with the PS; however, transcript regulation does not always coincide with plasma concentrations. While a decrease in pituitary mRNA levels for LHB during the PS was also seen in chickens, an increased in GNRHR mRNA (GNRH receptor III, specifically) and a decreased in FSHB mRNA was also reported (Lovell et al., 2005). Those data are in direct contrast with the current findings for the turkey, where a decrease in GNRHR mRNA and a two-fold increase in FSHB mRNA were observed. Several key functional differences have been established between chicken and turkey HPG axis progesterone feedback activity for ovulation to occur that may be contributing to the inconsistencies of pituitary mRNA expression between species (Bacon and Liu, 2004).
For the turkey, minimal information was previously known in regards to the mRNA expression of gonadotropin receptors and steroid metabolism genes in the F1 and F5 follicles during the PS. Previous studies have focused on granulosa layer gene expression changes during movement through the follicular hierarchy. The expression changes between the F1 and F5 follicles in the current study are consistent with these previous studies (Johnson and Bridgham, 2001; Li and Johnson, 1993; Woods and Johnson, 2005). In the follicle cells, mRNA levels during the PS were consistent with increased progesterone production in the F1 granulosa, increased androgen production in the F5 theca interna, and increased estradiol production in the F5 theca externa. The F1 granulosa, F5 theca interna, and F5 theca externa are responsible for progesterone, androgen, and estradiol production, respectively, and their steroidogenic related gene expression was significantly impacted by the PS. Increased expression of STAR mRNA during the PS had been previously reported in chicken F1 granulosa cells (Johnson et al., 2002) and were also seen in the present study. Transport of cholesterol into the mitochondrial membrane is the rate-limiting step of steroidogenesis (Bauer et al., 2000). Upregulation of STAR during the PS is indicative of an increased potential for progesterone production. HSD17B1 and CYP19A1 mRNA were also up-regulated in the F5 theca interna and theca externa, respectively, signifying an increased potential for androgen and estradiol production.
Each component of the HPG axis showed differential expression during the PS, indicating that gene regulation is globally impacted at both the central and ovarian components of the axis. In the hypothalamus, the PS coincided with a decrease in mRNA expression of the main HPG axis stimulatory factor and with an increase in estrogenic receptor mRNA expression. In the pituitary, lower mRNA levels were seen during the PS for receptors that stimulate the HPG axis and higher mRNA levels were seen for receptors that inhibit the HPG axis. Additionally, in the pituitary, gonadotropin subunit expression showed opposite trends, with LHB expression decreasing during the PS and FSHB expression increasing during the PS. Follicle cells showed increased expression of STAR, HSD17B1, and CYP19A1 in the F1 granulosa, F5 theca interna, and F5 theca externa, which are associated with progesterone, androgen, and estradiol production, respectively. Increased pituitary FSHB expression in combination with increased F5 theca interna HSD17B1 and F5 theca externa CYP19A1 expression during the PS might indicate that the PS initiates increased responsiveness of the smaller preovulatory follicles to pituitary FSH that, in turn, would potentially stimulate their maturation. Understanding the gene expression changes during the PS in the hypothalamus, pituitary, and ovarian cells allows for further studies examining the role of these gene expression changes in the regulation of ovulation. Determining the impact of HPG axis dysregulation on egg production levels would also be instrumental in improving the reproductive efficiency of the turkey hen.
ACKNOWLEDGMENTS
This project was supported by Agriculture and Food Research Initiative Competitive Grant no. 2019-67015-29472 from the USDA National Institute of Food and Agriculture and by funding from MAES Grant no. 4390750 from the College of Agriculture and Natural Resources at the University of Maryland, College Park.
REFERENCES
- Bacon W. L., Liu H. K.. 2004. Progesterone injection and egg production in turkey hens. Biol. Reprod. 71:878–886. [DOI] [PubMed] [Google Scholar]
- Bauer M. P., Bridgham J. T., Langenau D. M., Johnson A. L., Goetz F. W.. 2000. Conservation of steroidogenic acute regulatory (StAR) protein structure and expression in vertebrates. Mol. Cell. Endocrinol. 168:119–125. [DOI] [PubMed] [Google Scholar]
- Bédécarrats G. Y., Baxter M., Sparling B.. 2016. An updated model to describe the neuroendocrine control of reproduction in chickens. Gen. Comp. Endocrinol. 227:58–63. [DOI] [PubMed] [Google Scholar]
- Christian C. A., Moenter S. M.. 2010. The neurobiology of preovulatory and estradiol-induced gonadotropin-releasing hormone surges. Endocr. Rev. 31:544–577. [DOI] [PMC free article] [PubMed] [Google Scholar]
- Contijoch A. M., Advis J. P.. 1993. Median eminence and anterior pituitary degradation of luteinizing hormone releasing hormone in hens undergoing changes in luteinizing hormone secretion. Poult. Sci. 72:1756–1763. [DOI] [PubMed] [Google Scholar]
- Decuypere E., Bruggeman V., Onagbesan O., Safi M.. 2002. Endocrine physiology of reproduction in the female chicken: old wine in new bottles. Avian Poult. Biol. Rev. 13:145–153. [Google Scholar]
- Johnson A. L. 2014. Reproduction in the female. Pages 635–665 in Sturkie's Avian Physiology: 6th ed Scanes C., ed. Elsvier, Waltham, MA. [Google Scholar]
- Johnson A. L., Bridgham J. T.. 2001. Regulation of steroidogenic acute regulatory protein and luteinizing hormone receptor messenger ribonucleic acid in hen granulosa cells. Endocrinology. 142:3116–3124. [DOI] [PubMed] [Google Scholar]
- Johnson A. L., Solovieva E. V., Bridgham J. T.. 2002. Relationship between steroidogenic acute regulatory protein expression and progesterone production in hen granulosa cells during follicle development. Biol. Reprod. 67:1313–1320. [DOI] [PubMed] [Google Scholar]
- Johnson A. L., Van Tienhoven A.. 1980. Plasma concentrations of six steroids and LH during the ovulatory cycle of the hen, gallus domesticus. Biol. Reprod. 23:386–393. [DOI] [PubMed] [Google Scholar]
- Johnson A. L., Woods D. C.. 2009. Dynamics of avian ovarian follicle development: cellular mechanisms of granulosa cell differentiation. Gen. Comp. Endocrinol. 163:12–17. [DOI] [PubMed] [Google Scholar]
- Johnson P. A., Johnson A. L., Van Tienhoven A.. 1985. Evidence for a positive feedback interaction between progesterone and luteinizing hormone in the induction of ovulation in the hen, Gallus domesticus. Gen. Comp. Endocrinol. 58:478–485. [DOI] [PubMed] [Google Scholar]
- Kawashima M., Kamiyoshi M., Tanaka K.. 1987. Presence of estrogen receptors in the hen hypothalamus and pituitary. Endocrinology 120:582–588. [DOI] [PubMed] [Google Scholar]
- Kawashima M., Kamiyoshi M., Tanaka K.. 1993. Estrogen receptor binding in the hen hypothalamus and pituitary during the ovulatory cycle. Poult. Sci. 72:839–847. [DOI] [PubMed] [Google Scholar]
- Li Z., Johnson A. L.. 1993. Regulation of P450 cholesterol side-chain cleavage messenger ribonucleic acid expression and progesterone production in hen granulosa cells. Biol. Reprod. 49:463–469. [DOI] [PubMed] [Google Scholar]
- Liu H. K., Lilburn M. S., Koyyeri B., Anderson J. W., Bacon W. L.. 2004. Preovulatory surge patterns of luteinizing hormone, progesterone, and estradiol-17β in broiler breeder hens fed ad libitum or restricted fed. Poult. Sci. 83:823–829. [DOI] [PubMed] [Google Scholar]
- Lovell T. M., Knight P. G., Gladwell R. T.. 2005. Variation in pituitary expression of mRNAs encoding the putative inhibin co-receptor (betaglycan) and type-I and type-II activin receptors during the chicken ovulatory cycle. J. Endocrinol. 186:447–455. [DOI] [PubMed] [Google Scholar]
- Porter T. E., Hargis B. M., Silsby J. L., El Halawani M. E.. 1991. Characterization of dissimilar steroid productions by granulosa, theca interna and theca externa cells during follicular maturation in the turkey (Meleagris gallopavo). Gen. Comp. Endocrinol. 84:1–8. [DOI] [PubMed] [Google Scholar]
- Porter T. E., Hargis B. M., Silsby J. L., El Halawani M. E.. 1989. Differential steroid production between theca interna and theca externa cells: a three-cell model for follicular steroidogenesis in avian species. Endocrinology 125:109–116. [DOI] [PubMed] [Google Scholar]
- Robinson F. E., Etches R. J.. 1986. Ovarian steroidogenesis during foillicular maturation in the domestic fowl (Gallus Domesticus). Biol. Reprod. 35:1096–1105. [DOI] [PubMed] [Google Scholar]
- Woods D. C., Johnson A. L.. 2005. Regulation of follicle-stimulating hormone-receptor messenger RNA in hen granulosa cells relative to follicle selection. Biol. Reprod. 72:643–650. [DOI] [PubMed] [Google Scholar]
- Yang J., Long D. W., Bacon W. L.. 1997. Changes in plasma concentrations of luteinizing hormone, progesterone, and testosterone in turkey hens during the ovulatory cycle. Gen. Comp. Endocrinol. 106:281–292. [DOI] [PubMed] [Google Scholar]
- Yang J., Long D. W., Bacon W. L.. 1998. Effect of exogenous progesterone on luteinizing hormone secretion in domestic turkey hens at different reproductive states. Gen. Comp. Endocrinol. 110:337–345. [DOI] [PubMed] [Google Scholar]


