

Abstract
Neuroimaging studies investigating somatosensory‐based object recognition in humans have revealed activity in the lateral occipital complex, a cluster of regions primarily associated with visual object recognition. To date, determining whether this activity occurs during or subsequent to recognition per se, has been difficult to assess due to the low temporal resolution of the hemodynamic response. To more finely measure the timing of somatosensory object recognition processes we employed high density EEG using a modified version of a paradigm previously applied to neuroimaging experiments. Simple geometric shapes were presented to the right index finger of 10 participants while the ongoing EEG was measured time locked to the stimulus. In the condition of primary interest participants discriminated the shape of the stimulus. In the alternate condition they judged stimulus duration. Using traditional event‐related potential analysis techniques we found significantly greater amplitudes in the evoked potentials of the shape discrimination condition between 140 and 160 ms, a timeframe in which LOC mediated perceptual processes are believed to occur during visual object recognition. Scalp voltage topography and source analysis procedures indicated the lateral occipital complex as the likely source behind this effect. This finding supports a multisensory role for the lateral occipital complex during object recognition. Hum Brain Mapp, 2010. © 2010 Wiley‐Liss, Inc.
Keywords: somatosensory, object recognition, LOC, EEG, multisensory
INTRODUCTION
When a person recognizes an object by touch alone, functional imaging studies consistently show activation in cerebral cortical areas associated with vision. In particular, the lateral occipital complex (LOC), a cluster of regions specialized for visual object recognition [Amedi et al., 2001, 2002; Malach et al., 1995], has been found to respond similarly to objects whether they are seen or felt [Amedi et al., 2001; Deibert et al., 1999; James et al., 2002; Stilla and Sathian, 2008; Stoesz et al., 2003; Zhang et al., 2004]. These findings have led some to suggest that the recognition of an object, whether perceived with the eyes or the hands, may be mediated within the LOC [Amedi et al., 2001]. This hypothesis is unconventional because it confers a multisensory role on a region long held to be unisensory. Alternatively, a somewhat more trivial explanation is that the observed activity in LOC reflects a specifically visual process such as visualizing the object after recognition has taken place within the somatosensory system. Knowledge of the time at which visual areas become active during somatosensory object processing is key to mediating between these two views.
The sole measure employed to assess this issue to date has been the hemodynamic response. This measure has a temporal resolution on the order of seconds that precludes resolution of the timing of activity across cortical regions at the time scale necessary to make a distinction between perceptual and postperceptual processes. With high‐density electroencephalographic (EEG) recordings, however, one can measure the net activity of ensembles of neurons on the order of milliseconds. Unfortunately, electrophysiological measurements have rarely been applied to somatosensory object recognition in humans, so very little information is available to make predictions regarding the timing within this system. However, the temporal trajectory of visual object recognition has been extensively studied with EEG providing a useful temporal framework for the interpretation of somatosensory‐based object recognition.
Event‐related potential (ERP) studies have delineated two successive processing stages of visual object recognition that have been localized to the LOC [Di Russo et al., 2002; Murray et al., 2002; Sehatpour et al., 2006, 2008]. The first of these occurs between ∼120 and 230 ms during the timeframe of the visual N1 component. Activity at this time is sensitive to feature combinations which have become highly familiar through extensive exposure and for which recognition is relatively automatic such as when viewing faces [Bentin et al., 1996], identifying boundaries [Foxe et al., 2005; Murray et al., 2002, 2004, 2006], and categorizing objects [Proverbio et al., 2007; Rossion et al., 2000, 2002; Tanaka and Curran, 2001]. The second timeframe occurs from ∼230 to 350 ms with stimuli for which object identity is not immediately obvious, such as fragmented or very briefly presented drawings of objects [Bar et al., 2006; Doniger et al., 2000, 2001; Sehatpour et al., 2006, 2008]. In this timeframe the response tends to become more negative as missing information is added to an incomplete or ambiguous object rendering it more recognizable. This differential response is referred to as the Ncl, for negativity associated with closure. Several studies have demonstrated prefrontal activity during this later timeframe and have provided evidence for a functional network between visual and frontal cortices, with prefrontal regions hypothesized to mediate matching between degraded sensory information and stored representations [Bar et al., 2006; Sehatpour et al., 2008]. Effective connectivity data from fMRI studies have lead to the argument that a similar process underlies LOC involvement during somatosensory object recognition, with prefrontal activity acting as an intermediary in matching information between somatosensory cortices and the LOC. This is referred to as the “perceptual imagery” hypothesis [Deshpande et al., 2008, 2009; Lacey et al., 2009; Peltier et al., 2007].
Taken together, these findings provide an outline for the timing of visual object recognition and a temporal context within which to interpret the role of LOC activity during somatosensory object recognition. Activation of the LOC during the timeframe spanning the visual N1, from 120 to 230 ms, and the Ncl, from 230 to 350 ms, would tie it temporally to measures of object recognition processes in vision and thus indicate a perceptual role. Evidence of prefrontal activity during this period would, in addition, lend support to models of sensory‐prefrontal interactions underlying somatosensory object recognition processes, but would not in itself arbitrate between a perceptual versus postperceptual interpretation. Finally, the onset of LOC activity subsequent to 350 ms would be difficult to justify as indicating perceptual processing.
To resolve between activity during and subsequent to known object recognition timeframes, high‐density scalp recordings were made while participants performed a categorization task of tactile stimuli. In the condition of primary interest, participants were asked to identify the shape of stimuli presented to the surface of the index finger. This was compared against a control condition in which participants categorized the durations of the same stimulus set. Given the well‐characterized timing of visual object recognition processes, we regarded a modulation of activity over visual cortical regions between 120 and 350 ms as evidence for the mediation of somatosensory‐based object recognition within visual cortical areas.
MATERIALS AND METHODS
Participants
Twelve participants volunteered and were paid for their time. All were neurologically normal adults aged 19–38 with normal or corrected‐to‐normal visual acuity. Data from two participants were excluded due to excessive noise in the data. The 10 participants included in the final dataset had a mean age of 23.6 (standard deviation ±6.0). Four were female. All reported that they were right‐handed. The Institutional Review Board of the City College of New York approved the experimental procedure and each participant provided written informed consent.
Stimuli
Three shapes, a square, a trapezoid, and a parallelogram, were presented to the right index fingerpad using a computer‐controlled, pneumatically driven stimulator (see Fig. 1). Each stimulus was presented for one of three stimulus durations, 400, 600, or 800 ms. The mean stimulus onset asynchrony (SOA) was 9.35 s with a standard deviation of 2.89 s. The nine stimuli (3 shapes × 3 durations) were presented in pseudorandom order with targets occurring 8% of the time and the remaining stimuli presented equiprobably. Catch trials in which no stimulus was presented occurred on 20% of the trials. The target for the Shape condition was the parallelogram. The target for the Duration condition was 400 ms. A partition obstructed participants from viewing both the stimuli and stimulator. In addition, to mask the noise of the stimulator, ambient white noise (∼70 dB SPL) was present in the room and participants wore earplugs.
Figure 1.
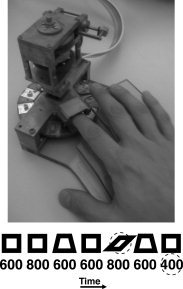
Experimental apparatus and paradigm. A custom made mechanical device, pictured on top, lifted a set of shapes embedded on a disk to the index fingerpad of each participant. The three shapes, pictured below, were a square, a trapezoid, and a parallelogram. One shape was presented for each trial for three possible durations, 400, 600, and 800 ms. The schematic illustrates the time series of trials with shapes and durations occurring pseudorandomly. The dashed circles indicate the target stimuli for each condition.
Task
Participants were seated comfortably and rested their right hand, palm down, on a platform connected to the stimulator (see Fig. 1). First they were trained to identify the three shapes and the three durations in separate blocks. The experimenter never explicitly identified the name of the shape (e.g., square) or duration (e.g., 400 ms). Rather participants learned to identify each as shape one, two, and three, and duration one, two, and three. The training session lasted as long as required for the participant to achieve 75% accuracy within short training blocks of 34 trials, generally three to five blocks. During the experimental sessions, participants were instructed to attend to either the shape or duration features throughout a block of trials. Each block contained a total of 62 trials. Six blocks served for each condition. During the experiment conditions were alternated after every two blocks for the first eight blocks and then after every block for the remaining four. The order of blocks was counterbalanced so that half the participants began with the Duration condition and the other half with the Shape condition. Participants were instructed to respond with a button press using their left index finger only when a target in the attended feature was recognized.
Measurement
High‐density EEG recordings were made from a custom‐designed 160‐channel electrode cap with Biosemi ActiveTwo electrodes. A filter bandpass of 0.05–45 Hz and a sample rate of 512 Hz were used. Data were rereferenced to an average reference following acquisition. An artifact rejection criterion of ±100 μV was used to exclude eye blinks, periods of high EMG, and other noise transients. From the remaining artifact‐free trials, averages were computed for each participant and each condition with a mean of 195 trials per average. Only nontarget trials were considered in the analysis to avoid contamination by motor‐related neural activity associated with making a response. Epochs were 700 ms in duration, with a prestimulus interval of 100 ms and a poststimulus length of 600 ms. Baseline was defined as the average voltage over the period from 100 ms prior to stimulus onset. Individual subject averages were visually inspected to insure that clean recordings were obtained and no artifacts were still included. Noisy channels were replaced with linear interpolations from clean channels sparingly. Varying finger thickness resulted in small variations (mean: 18 ms, standard deviations: ±24 ms) in the timing of the stimulus trigger with respect to stimulus onset. To reflect a common stimulus onset time across participants individual averages were aligned to the midpoint (mean: 65 ms) between the initial maximum and minimum deflections in the evoked potential (i.e., the first two components) for each participant.
Statistical Analyses
Mean amplitudes for each timeframe of interest, corresponding to the peaks of the somatosensory evoked potential, namely 30–50, 90–110, and 140–160 ms, were calculated across all channels, resulting in 160 samples for each of the 10 participants and each of the two conditions. To circumvent the problem of Type II errors, a cluster based nonparametric test that controls for multiple comparisons was employed [Maris and Oostenveld, 2007]. A within‐subjects two‐tailed dependent sample t‐test was computed for each channel between the Shape and Duration conditions. Tests that resulted in a P‐value below 0.05 were selected and grouped into clusters if a neighboring channel also had a P‐value less than 0.05 and a t‐value of the same valence. Cluster level statistical values were computed by summing over the individual t‐values within the cluster. The cluster‐based approach increases the sensitivity of the test. It is justified because voltages measured at the scalp which have been generated by the same underlying neural sources have a large degree of correlation [Maris and Oostenveld, 2007]. The probabilities of the cluster level t‐values were computed by comparing them against a random partition distribution generated with the Monte Carlo method. This was accomplished by placing all samples from each participant into a single group of 320 (160 from each condition) and randomly assigning them to two groups of 160. The same procedure that was performed for the comparison statistic above was performed for each random partitioning. After a thousand partitions were constructed and tests computed, a distribution of these test values was derived. The original comparison test value was then compared against the proportion of test values in the random partition distribution that exceeded it.
RESULTS
Behavior
Participants performed well in both conditions, with a mean hit rate of 90% for the Duration condition and 87% for the Shape condition. Comparison of d‐prime scores from the signal detection analysis resulted in mean scores of 2.83 for the Shape condition and 3.45 for the Duration condition. These differences in performance were statistically significant (F(1,9) = 9.26, P < 0.01). Although this discrepancy was disappointing, as the task demands for each condition were designed to be equivalent, several factors lead us to conclude that these small differences in behavioral performance did not drive the differences observed in the electrophysiological data. First and foremost, three participants were more accurate in correctly identifying shape targets and these three also showed the same direction of effect in the electrophysiology as the seven who performed better identifying duration targets. Second, the spatial distribution of the electrophysiological effects did not resemble previous effects of attention reported in the literature [Eimer and Forster, 2003], suggesting that the small difference in task difficulty did not result in the differential allocation of attention across the two conditions.
Electrophysiology
The somatosensory evoked potential (SEP) resulting from stimulation during both the discrimination of stimulus shape and duration was characterized by four major topographical distributions with similar timing within a 600 ms measurement window (see Fig. 2). These distributions were of maximal amplitude at 40, 100, 150, and 300 ms, respectively. Both the timing and spatial configuration of each were consistent with previous SEP studies [Allison et al., 1992; Eimer and Driver, 2000; Mauguiere et al., 1997]. At 40 and 100 ms, the foci of activity were contralateral to the side of stimulation, in close agreement with previous studies showing generators mainly residing in contralateral primary somatosensory cortex during this time [Allison et al., 1992] (see Fig. 2). By 150 ms the topography was clearly bilateral, with a scalp distribution that was consistent with intracranial evidence for bilateral contributions from secondary somatosensory areas after 100 ms [Allison et al., 1992; Frot and Mauguiere, 1999]. In the Shape condition there was also a distinct posterior distribution that was considerably larger than in the Duration condition.
Figure 2.
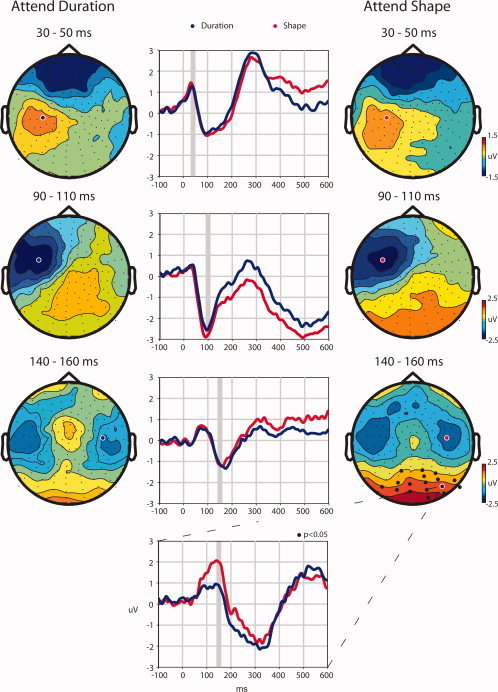
Spatiotemporal evolution of somatosensory evoked potential. The left column shows the topographical distributions of the Duration condition and the right column the Shape condition for three time windows, 30–50 ms, 90–110 ms, and 140–160 ms, one for each row. The center column shows the evoked potential for channels selected to illustrate the focus of activity for each timeframe. The Duration condition is represented by blue lines and the Shape condition is represented by red. Similarly, channels selected for display are indicated on the topographical maps by blue circles with white borders for the Duration condition and red circles with white borders for the Shape condition. The bottom waveform illustrates the greater response over posterior scalp observed for the Shape condition during the 140–160‐ms timeframe at a channel where significant differences were found, which is indicated by a white border around a black dot on the topographical map for the Shape condition during the 140–160‐ms timeframe. Gray boxes indicate the time interval represented in the corresponding topographical maps. The black circles on the topographical maps mark the position of the channels that were found to be significantly different between conditions (P < 0.05) after a multiple comparisons correction.
To test for differences between Shape and Duration conditions the mean amplitudes from each channel were calculated for four 20‐ms time bins that were centered around the maximal response of each of the stable topographical configurations (30–50, 90–110, 140–160, and 290–310 ms). Each comparison (between conditions per time bin) was then submitted to a nonparametric statistical test developed to control for multiple comparisons (see Materials and Methods). With a criterion of P < 0.05 no significant differences were found between conditions during the timeframes centered at 40 and 100 ms. The 150‐ms timeframe, however, resulted in significantly greater amplitudes during the Shape condition for a cluster of 18 channels over posterior scalp (P = 0.032, Monte Carlo distribution) (see Fig. 2). The posterior focus of this effect is highly consistent with greater visual cortical involvement during the Shape condition. In line with our main hypothesis, the timing of this activity fell within the established timeframe of early visual object recognition. In contrast our data failed to support the involvement of prefrontal areas in this timeframe. Since the main hypothesis was confirmed by analysis of the earlier timeframes, further analysis of the later timeframe was rendered immaterial and is not reported here.
Source Localization
To model the neural generators that produced the scalp distributions during the 150‐ms timeframe, source analysis was performed using the current dipole source analysis algorithm implemented in the BESA 5.1 software package [Scherg, 1990]. First, the presumed contributions from bilateral somatosensory cortices were modeled by freely fitting (orientation and location were unconstrained) a pair of symmetric dipoles to the Duration condition. The Duration condition was selected to minimize contributions from the posterior activity that occurred in the same timeframe, and was most prominent in the Shape condition. This resulted in bilateral dipoles in the vicinity of the secondary somatosensory area SII that accounted for 74% of the variance in the signal (Talairach coordinates, ±58, −36, 13) (adding either a single dipole or another pair of symmetrical dipoles only improved the model by 5%. Moreover the positions of these dipoles were outside Talairach brain space). Area SII has been identified in several human intracranial studies as a likely source of electrical activity at the scalp during this timeframe [Allison et al., 1992; Frot and Mauguiere, 1999]. When the same solution was applied to the Shape condition, however, it accounted for only 50% of the variance. We reasoned that this reduction in goodness of fit reflects that the somatosensory dipoles do not account for the posterior distribution observed in the Shape condition. Two additional dipoles were positioned using a specific pair of LOC coordinates (Talairach, −47, −61, −5 and 51, −56, −7) which have been termed the LOtv subregion, with “tv” standing for tactile‐visual [Amedi et al., 2005]. These locations have been consistently identified as areas of significant activation in imaging experiments investigating somatosensory object recognition. The locations of these were fixed while orientation was freely fitted during minimization. These dipoles explained an additional 38% of the variance of the signal in the Shape condition, bringing the total explained variance to 88%. When applied to the Duration condition, however, this same procedure only explained an additional 2% of the signal variance. Figure 3 shows the mean effect for the posterior cluster of 18 channels in which significant differences were found during the 150‐ms timeframe and illustrates the fit of the SII‐LOtv model for both conditions at these locations.
Figure 3.
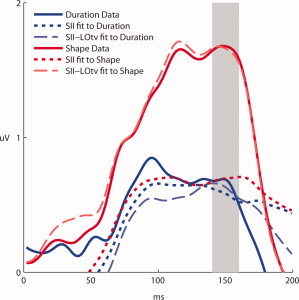
Mean effect and model. Solid colored lines show the mean response for each condition at channels resulting in significant differences between 140 and 160 ms. Short dashed lines represent the models generated for each condition within the same timeframe by dipoles situated within somatosensory area SII. Long dashed lines show the models after dipoles in the LOtv sub‐region were added, an area consistently identified in neuroimaging experiments probing the locus of activity during the tactile discrimination of shapes. Red lines represent the Shape condition and blue lines Duration. The gray bar highlights the timeframe in which a significant effect was calculated and the models were generated, 140–160 ms.
The SII‐LOtv dipole model also provided an explanation for the small but visible differences that did not reach statistical significance following correction in this same timeframe, for a central cluster of channel sites. Figure 4 shows a topographical map of the Duration condition subtracted from the Shape condition during the 150‐ms timeframe. This map shows a posterior locus of positive differences and a central locus of negative differences. Although the posterior distribution resulted in significant differences after the correction for multiple comparisons, channels in the central distribution did not. Gray circles in Figure 4 indicate channels where individual t‐tests not corrected for multiple comparisons resulted in differences with P < 0.05 criteria. The similar temporal profiles of the posterior and central distributions and the opposing signs suggest that they result from, in large part, the same underlying neural generator configuration. Indeed, the bilateral LOtv dipoles from the model generated a similar distribution with a central spread of negative voltages and a posterior spread of positive voltages. Figure 4 also indicates that this pattern emerged earlier, around 90 ms; although this difference was significant at the 0.05 level, it did not survive the correction for multiple tests during the 90–110‐ms timeframe. Though one must of course remain tentative about these uncorrected results, they are consistent with LOC contributions beginning as early as 90 ms.
Figure 4.
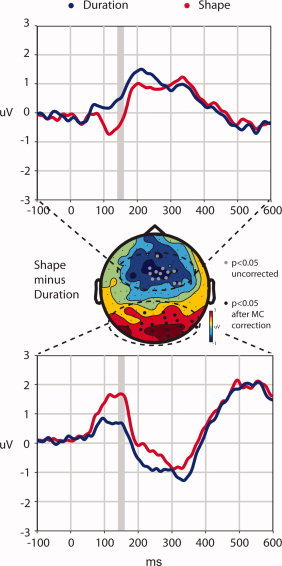
Topographical distribution of the difference. The topographical head map was generated by subtracting the mean voltages of the Duration condition from the mean voltages of the Shape condition over the 140–160‐ms timeframe. The black circles, identical to Figure 2, mark the position of the channels that were found to be significantly different between conditions (P < 0.05) after a multiple comparisons correction. The light gray circles indicate channels which resulted in P‐values less than 0.05 after individual t‐tests, but that did not survive correction. The top graph displays mean voltage plotted against time for the non‐significant channels marked in gray. Similarly the bottom graph displays the mean voltage plotted against time for the significant channels marked in black. For both graphs the Shape condition is displayed in red and the Duration condition in blue. The gray bar in each graph highlights the timeframe in which statistics were calculated and the topographical map was generated.
DISCUSSION
We sought to determine whether visual cortical regions play an integral role during tactile shape discrimination. Using electrophysiology, we pinpointed the onset of visual cortical contributions to well within the timeframe of object recognition processes. The timing of our effect, between 140 and 160 ms, fell into the earliest timeframe in which we had assigned, a priori, an interpretation of perceptual activity. This is the timeframe of the visual N1, a component closely associated with rapid object processing and with major neural sources localized to the LOC [Foxe et al., 2005; Murray et al., 2002; Sehatpour et al., 2006, 2008]. This finding arbitrates between a perceptual versus postperceptual role for the LOC activity that has been previously identified in neuroimaging studies during somatosensory object recognition. This suggests that object recognition processes in the LOC are not constrained to information that is initially conveyed through the visual system. An implication therefore is that the LOC is a major node in an object processing network, regardless of the initial sensory input. In other words, the object processing role of the LOC appears to be multisensory.
While one might be tempted to extend these results to say that object recognition in the LOC is amodal, a review of the neuroimaging literature by Amedi et al. indicates that a specific subregion of the LOC is recruited when tactile stimuli are used (termed the LOtv for tactile‐visual) [Amedi et al., 2005]. Nevertheless, along with much that has developed recently within the field of multisensory research [Foxe and Schroeder, 2005; Ghazanfar and Schroeder, 2006], the early recruitment of an area in the ventral visual stream during touch perception offers cause for a significant reassessment of the degree to which the neocortex is understood to be compartmentalized according to sensory systems during information processing. Further, it is in line with the notion that higher‐order processing areas may be more process‐driven than modality‐driven [Foxe and Molholm, 2009; Pascual‐Leone and Hamilton, 2001]. For example, the LOtv subregion has also been found to be activated by auditory stimuli when a “soundscape” algorithm is used to substitute auditory for visual shape information [Amedi et al., 2007], though again, the absence of meaningful timing information makes it difficult to interpret the role of the LOtv in this case.
The evidence of somatosensory information having access to treatment in putatively visual processing regions during an object recognition timeframe adds to a growing body of research supporting a multisensory organization underlying object recognition processes. For example, several experiments have demonstrated the enhancement of an object's representation in two sensory systems when attention is applied to only one [Fiebelkorn et al., 2009; in press; Molholm et al., 2007], indicating that multisensory representations are intrinsically linked. Furthermore several imaging studies, though notably lacking specific timing information, have provided data that are consistent with a primary role of the LOC during somatosensory object recognition. For example, James et al. demonstrated that feeling an unfamiliar object before seeing it primes the response of the LOC just as effectively as initially seeing it [James et al., 2002], indicating that whether through the somatosensory or visual sensory modality, prior experience with the object results in the same degree of activation of the LOC. Additionally, Amedi et al. addressed the hypothesis of visualization underlying the visual cortical activity elicited under somatosensory object recognition tasks by demonstrating that greater activity is measured from the LOC when people feel objects than when they imagine them [Amedi et al., 2001]. Analyses of neuroimaging data have also indicated functional connectivity between somatosensory cortex and the LOC during shape processing [Deshpande et al., 2008; Peltier et al., 2007]. Finally, there have been several cases reported in which patients with lesions in the vicinity of the LOC exhibited agnosia for objects encountered both visually and by touch while non‐object‐related tactile discrimination capabilities were preserved [Feinberg et al., 1986; James et al., 2005; Morin et al., 1984]. Interestingly, a recent report described a lesion patient with visual agnosia but not tactile agnosia [Allen and Humphreys, 2009]. The lesion, located in the LOC, spared the dorsal portion where the LOtv subregion is located.
On the basis of effective connectivity data from fMRI studies it has been suggested that frontal areas may mediate the activity in visual cortical regions observed during somatosensory‐based object processing [Deshpande et al., 2008, 2009; Lacey et al., 2009; Peltier et al., 2007]. Our data however do not provide support for this model. There was no indication of differential activity over frontal scalp regions for the Shape condition compared to the Duration condition. The involvement of prefrontal activity that is suggested by effective connectivity studies may therefore reflect later processing or engagement by different somatosensory‐based object recognition tasks. Of course, our analyses only considered differential effects between the Shape and Duration conditions and it is possible that prefrontal regions were equally involved in both tasks. Further, there is the possibility that even though there was no indication of frontal differences in the present data, with more participants such differences might be observed, or, that the activity previously seen in fMRI studies comes from regions generating closed electrical fields that are not measurable with scalp electrodes.
CONCLUSION
The measurement of early responses from visual cortical regions during the perception of tactile shapes provides compelling evidence for an instrumental role for the LOC during somatosensory object recognition. This finding arbitrates between competing explanations in neuroimaging studies. From these data we conclude that tactile shape discrimination involves a multisensory network, and suggest that so‐called object recognition regions in visual cortex may not be constrained to recognizing objects presented in the visual sensory modality, but rather serve a more general multisensory object recognition function.
Acknowledgements
The authors thank Ian Fiebelkorn, Dr. Simon Kelly, and Naresh Jegadeesh for their considerable help during this project.
REFERENCES
- Allen HA, Humphreys GW ( 2009): Direct tactile stimulation of dorsal occipito‐temporal cortex in a visual agnosic. Curr Biol 19: 1044–1049. [DOI] [PubMed] [Google Scholar]
- Allison T, Mccarthy G, Wood CC ( 1992): The relationship between human long‐latency somatosensory evoked‐potentials recorded from the cortical surface and from the scalp. Electroencephalogr Clin Neurophysiol 84: 301–314. [DOI] [PubMed] [Google Scholar]
- Amedi A, Malach R, Hendler T, Peled S, Zohary E ( 2001): Visuo‐haptic object‐related activation in the ventral visual pathway. Nat Neurosci 4: 324–30. [DOI] [PubMed] [Google Scholar]
- Amedi A, Jacobson G, Hendler T, Malach R, Zohary E ( 2002): Convergence of visual and tactile shape processing in the human lateral occipital complex. Cereb Cortex 12: 1202–1212. [DOI] [PubMed] [Google Scholar]
- Amedi A, von Kriegstein K, van Atteveldt NM, Beauchamp MS, Naumer MJ ( 2005): Functional imaging of human crossmodal identification and object recognition. Exp Brain Res 166: 559–571. [DOI] [PubMed] [Google Scholar]
- Amedi A, Stern WM, Camprodon JA, Bermpohl F, Merabet L, Rotman S, Hemond C, Meijer P, Pascual‐Leone A ( 2007): Shape conveyed by visual‐to‐auditory sensory substitution activates the lateral occipital complex. Nat Neurosci 10: 687–689. [DOI] [PubMed] [Google Scholar]
- Bar M, Kassam KS, Ghuman AS, Boshyan J, Schmid AM, Dale AM, Hamalainen MS, Marinkovic K, Schacter DL, Rosen BR, Halgren E ( 2006): Top‐down facilitation of visual recognition. Proc Natl Acad Sci USA 103: 449–454. [DOI] [PMC free article] [PubMed] [Google Scholar]
- Bentin S, Allison T, Puce A, Perez E, McCarthy G ( 1996): Electrophysiological studies of face perception in humans. J Cogn Neurosci 8: 551–565. [DOI] [PMC free article] [PubMed] [Google Scholar]
- Deibert E, Kraut M, Kremen S, Hart J Jr ( 1999): Neural pathways in tactile object recognition. Neurology 52: 1413–1417. [DOI] [PubMed] [Google Scholar]
- Deshpande G, Hu X, Stilla R, Sathian K ( 2008): Effective connectivity during haptic perception: A study using Granger causality analysis of functional magnetic resonance imaging data. Neuroimage 40: 1807–1814. [DOI] [PMC free article] [PubMed] [Google Scholar]
- Deshpande G, Hu X, Lacey S, Stilla R, Sathian K ( 2010): Object familiarity modulates effective connectivity during haptic shape perception. Neuroimage 49: 1991–2000. [DOI] [PMC free article] [PubMed] [Google Scholar]
- Di Russo F, Martinez A, Sereno MI, Pitzalis S, Hillyard SA ( 2002): Cortical sources of the early components of the visual evoked potential. Hum Brain Mapp 15: 95–111. [DOI] [PMC free article] [PubMed] [Google Scholar]
- Doniger GM, Foxe JJ, Murray MM, Higgins BA, Snodgrass JG, Schroeder CE, Javitt DC ( 2000): Activation timecourse of ventral visual stream object‐recognition areas: High density electrical mapping of perceptual closure processes. J Cogn Neurosci 12: 615–621. [DOI] [PubMed] [Google Scholar]
- Doniger GM, Foxe JJ, Schroeder CE, Murray MM, Higgins BA, Javitt DC ( 2001): Visual perceptual learning in human object recognition areas: A repetition priming study using high‐density electrical mapping. Neuroimage 13: 305–313. [DOI] [PubMed] [Google Scholar]
- Eimer M, Driver J ( 2000): An event‐related brain potential study of cross‐modal links in spatial attention between vision and touch. Psychophysiology 37: 697–705. [PubMed] [Google Scholar]
- Eimer M, Forster B ( 2003): Modulations of early somatosensory ERP components by transient and sustained spatial attention. Exp Brain Res 151: 24–31. [DOI] [PubMed] [Google Scholar]
- Feinberg TE, Rothi LJ, Heilman KM ( 1986): Multimodal agnosia after unilateral left hemisphere lesion. Neurology 36: 864–867. [DOI] [PubMed] [Google Scholar]
- Fiebelkorn IC, Foxe JJ, Molholm S ( 2010): Dual mechanisms for the cross‐sensory spread of attention: How much do learned associations matter? Cereb Cortex 20: 109–120. [DOI] [PMC free article] [PubMed] [Google Scholar]
- Foxe JJ, Molholm S ( 2009): Ten years at the multisensory forum: Musings on the evolution of a field. Brain Topogr 21: 149–154. [DOI] [PubMed] [Google Scholar]
- Foxe JJ, Schroeder CE ( 2005): The case for feedforward multisensory convergence during early cortical processing. Neuroreport 16: 419–423. [DOI] [PubMed] [Google Scholar]
- Foxe JJ, Murray MM, Javitt DC ( 2005): Filling‐in in schizophrenia: A high‐density electrical mapping and source‐analysis investigation of illusory contour processing. Cereb Cortex 15: 1914–1927. [DOI] [PubMed] [Google Scholar]
- Frot M, Mauguiere F ( 1999): Timing and spatial distribution of somatosensory responses recorded in the upper bank of the sylvian fissure (SII area) in humans. Cereb Cortex 9: 854–863. [DOI] [PubMed] [Google Scholar]
- Ghazanfar AA, Schroeder CE ( 2006): Is neocortex essentially multisensory? Trends Cogn Sci 10: 278–285. [DOI] [PubMed] [Google Scholar]
- James TW, Humphrey GK, Gati JS, Servos P, Menon RS, Goodale MA ( 2002): Haptic study of three‐dimensional objects activates extrastriate visual areas. Neuropsychologia 40: 1706–1714. [DOI] [PubMed] [Google Scholar]
- James TW, James KH, Humphrey GK, Goodale MA ( 2005): Do visual and tactile object representations share the same neural substrate? In: Heller MA, Ballesteros S, editors. Touch and Blindness: Psychology and Neuroscience. Mahway, NJ: Lawrence Erlbaum, pp. 139–149. [Google Scholar]
- Lacey S, Tal N, Amedi A, Sathian K ( 2009): A putative model of multisensory object representation. Brain Topogr 21: 269–274. [DOI] [PMC free article] [PubMed] [Google Scholar]
- Malach R, Reppas JB, Benson RR, Kwong KK, Jiang H, Kennedy WA, Ledden PJ, Brady TJ, Rosen BR, Tootell RB ( 1995): Object‐related activity revealed by functional magnetic resonance imaging in human occipital cortex. Proc Natl Acad Sci USA 92: 8135–8139. [DOI] [PMC free article] [PubMed] [Google Scholar]
- Maris E, Oostenveld R ( 2007): Nonparametric statistical testing of EEG‐ and MEG‐data. J Neurosci Methods 164: 177–190. [DOI] [PubMed] [Google Scholar]
- Mauguiere F, Merlet I, Forss N, Vanni S, Jousmaki V, Adeleine P, Hari R ( 1997): Activation of a distributed somatosensory cortical network in the human brain. A dipole modelling study of magnetic fields evoked by median nerve stimulation. Part I: Location and activation timing of SEF sources Electroencephalogr Clin Neurophysiol 104: 281–289. [DOI] [PubMed] [Google Scholar]
- Molholm S, Martinez A, Shpaner M, Foxe JJ ( 2007): Object‐based attention is multisensory: Co‐activation of an object's representations in ignored sensory modalities. Eur J Neurosci 26: 499–509. [DOI] [PubMed] [Google Scholar]
- Morin P, Rivrain Y, Eustache F, Lambert J, Courtheoux P ( 1984): Visual and tactile agnosia. Rev Neurol (Paris) 140: 271–277. [PubMed] [Google Scholar]
- Murray MM, Wylie GR, Higgins BA, Javitt DC, Schroeder CE, Foxe JJ ( 2002): The spatiotemporal dynamics of illusory contour processing: Combined high‐density electrical mapping, source analysis, and functional magnetic resonance imaging. J Neurosci 22: 5055–5073. [DOI] [PMC free article] [PubMed] [Google Scholar]
- Murray MM, Foxe DM, Javitt DC, Foxe JJ ( 2004): Setting boundaries: Brain dynamics of modal and amodal illusory shape completion in humans. J Neurosci 24: 6898–6903. [DOI] [PMC free article] [PubMed] [Google Scholar]
- Murray MM, Imber ML, Javitt DC, Foxe JJ ( 2006): Boundary completion is automatic and dissociable from shape discrimination. J Neurosci 26: 12043–12054. [DOI] [PMC free article] [PubMed] [Google Scholar]
- Pascual‐Leone A, Hamilton R ( 2001): The metamodal organization of the brain. Prog Brain Res 134: 427–445. [DOI] [PubMed] [Google Scholar]
- Peltier S, Stilla R, Mariola E, LaConte S, Hu X, Sathian K ( 2007): Activity and effective connectivity of parietal and occipital cortical regions during haptic shape perception. Neuropsychologia 45: 476–483. [DOI] [PubMed] [Google Scholar]
- Proverbio AM, Del Zotto M, Zani A ( 2007): The emergence of semantic categorization in early visual processing: ERP indices of animal vs. artifact recognition. BMC Neurosci 8: 24. [DOI] [PMC free article] [PubMed] [Google Scholar]
- Rossion B, Gauthier I, Tarr MJ, Despland P, Bruyer R, Linotte S, Crommelinck M ( 2000): The N170 occipito‐temporal component is delayed and enhanced to inverted faces but not to inverted objects: An electrophysiological account of face‐specific processes in the human brain. Neuroreport 11: 69–74. [DOI] [PubMed] [Google Scholar]
- Rossion B, Gauthier I, Goffaux V, Tarr MJ, Crommelinck M ( 2002): Expertise training with novel objects leads to left‐lateralized facelike electrophysiological responses. Psychol Sci 13: 250–257. [DOI] [PubMed] [Google Scholar]
- Scherg M ( 1990): Fundamentals of Dipole Source Potential Analysis. Auditory Evoked Magnetic Fields and Electric Potentials. Basel: Karger. [Google Scholar]
- Sehatpour P, Molholm S, Javitt DC, Foxe JJ ( 2006): Spatiotemporal dynamics of human object recognition processing: An integrated high‐density electrical mapping and functional imaging study of “closure” processes. Neuroimage 29: 605–618. [DOI] [PubMed] [Google Scholar]
- Sehatpour P, Molholm S, Schwartz TH, Mahoney JR, Mehta AD, Javitt DC, Stanton PK, Foxe JJ ( 2008): A human intracranial study of long‐range oscillatory coherence across a frontal‐occipital‐hippocampal brain network during visual object processing. Proc Natl Acad Sci USA 105: 4399–4404. [DOI] [PMC free article] [PubMed] [Google Scholar]
- Stilla R, Sathian K ( 2008): Selective visuo‐haptic processing of shape and texture. Hum Brain Mapp 29: 1123–1138. [DOI] [PMC free article] [PubMed] [Google Scholar]
- Stoesz MR, Zhang M, Weisser VD, Prather SC, Mao H, Sathian K ( 2003): Neural networks active during tactile form perception: Common and differential activity during macrospatial and microspatial tasks. Int J Psychophysiol 50: 41–49. [DOI] [PubMed] [Google Scholar]
- Tanaka JW, Curran T ( 2001): A neural basis for expert object recognition. Psychol Sci 12: 43–47. [DOI] [PubMed] [Google Scholar]
- Zhang M, Weisser VD, Stilla R, Prather SC, Sathian K ( 2004): Multisensory cortical processing of object shape and its relation to mental imagery. Cogn Affect Behav Neurosci 4: 251–259. [DOI] [PubMed] [Google Scholar]