

Abstract
Reconstruction of white matter (WM) fiber tracts based on diffusion tensor imaging (DTI) is increasingly being used in clinical and research settings to study normal and pathological WM tissue as well as the maturation of this WM tissue. Such fiber tracking (FT) methodology, however, is highly dependent on the manual delineation of anatomical landmarks and the algorithm settings, often rendering the reproducibility and reliability questionable. Predefining these regions of interest on a fractional anisotropy (FA) atlas in standard space has already been shown to improve the reliability of FT results. In this paper, we constructed a new DTI atlas, which contains the complete diffusion tensor information in ICBM152 coordinates. From this high‐dimensional DTI atlas, and using robust FT protocols, we reconstructed a large number of WM tracts. Subsequently, we created tract masks from these fiber tract bundles and evaluated the atlas framework by comparing the reproducibility of the results obtained from our standardized tract masks with regions‐of‐interest labels from the conventional FA‐based WM atlas. Finally, we assessed laterality and age‐related WM changes in 42 normal subjects aged 0 to 18 years using these tractography‐derived tract segmentations. In agreement with previous literature, we observed an FA increase with age, which was mainly due to the decrease of perpendicular diffusivity. In addition, major functional pathways in the language, motor, and limbic system, showed a significant asymmetry in terms of the observed diffusion metrics. Hum Brain Mapp, 2010. © 2009 Wiley‐Liss, Inc.
Keywords: DTI template, brain atlas framework, white matter maturation, laterality
INTRODUCTION
Diffusion tensor imaging (DTI) is a relatively new MR modality and has increasingly been used over the last 5 years. The DTI technique, which is sensitive to the Brownian motion of water, enables the measurement of restricted and/or hindered movement of water molecules as they diffuse in the brain. Due to the highly organized nature of the white matter (WM), the main diffusion orientation will generally coincide with the orientation of the axons in this tissue. Therefore, DTI can characterize the orientation and integrity of WM fibers in vivo and in a noninvasive manner [Basser et al.,1994]. Recently, WM has been shown to be implicated in a wide spectrum of neurological disorders, including amyotrophic lateral sclerosis, multiple sclerosis, leucodystrophies, cerebrovascular disease and brain tumors [Kinoshita et al.,2008; Nitkunan et al.,2008; Sage et al.,2007, 2009]. Whereas conventional radiological techniques often lack appropriate contrast to precisely delineate WM components, DTI offers exciting opportunities to assess the impact of diseases on specific WM regions quantitatively. Also, in the diagnosis and follow‐up of pediatric brain pathologies this new MRI technique could play a crucial role. In contrast to conventional MRI in young children, in which it can be difficult to interpret findings due to changing T1 and T2 relaxation times, DTI can provide more reliable anatomical contrasts [Paus et al.,2001] yielding a promising tool to study various developmental brain diseases, such as periventricular leukomalacia, focal cortical dysplasia and developmental delay [Filippi et al.,2003; Nagae et al.,2007]. Because DTI is becoming part of many standard clinical MRI protocols, the availability of normative data is essential for the interpretation of such pathological findings.
The analysis of DTI data is complex as different techniques are available, each one characterized by their own advantages and limitations. For instance, region‐of‐interest (ROI) analysis of DTI data is a commonly used way to detect diffusion parameter alterations [Snook et al.,2007; Yoon et al.,2008]. However, both intra‐ and interoperator variability in the delineation of these ROIs often make reproducibility and reliability questionable. Moreover, the ROI‐based method uses a priori hypotheses, i.e. target and control brain regions are selected based on (anatomical) expectation. Analysis of the entire brain using multiple 3D ROIs may be feasible, but can be very time consuming for practical use [Snook et al.,2007].
Another approach to analyze DTI data is fiber tractography (FT), which allows the virtual reconstruction of entire WM tract pathways. However, as in the ROI‐based analysis of DTI data, the interpretation of FT results depends on the ROI placement and algorithm settings [Aoki et al.,2007].
To reduce operator variability and to investigate a broad range of ROIs, one could use standardized ROIs on spatially normalized images. An important prerequisite for a reliable ROI analysis with standardized ROIs, is that after diffusion tensor (DT) image alignment to a common space, anatomical structures should correspond nearly perfectly. In order to achieve maximal correspondence between the DTI dataset and the reference space, both the application of an appropriate coregistration procedure and reorientation of the DT elements after coregistration (tensor reorientation, TR) is generally required [Alexander et al.,2001; Park et al.,2003; Van Hecke et al.,2007]. Additionally, the choice of the reference space or template may also be important. One of the most widely used templates is the MNI atlas [Evans et al.,1994], which consists of the linear registration of a large number of T1‐weighted MR images. This atlas is characterized by poor WM contrast, which renders accurate coregistration of DTI images very difficult.
Recently, Mori et al. described the first population‐averaged stereotaxic WM atlas (so called ICBM81 atlas), using a 12 mode affine normalization process to the MNI152 space, driven by the average diffusion‐weighted images (aDWIs) of 81 normal subjects [Mori et al.,2008]. TR was applied based on the deformation field of the registered aDWIs. The ICBM81 atlas was then generated by linear averaging of the tensor elements. Compared to the MNI atlas, the ICBM81 atlas provides far better WM contrast, which was shown to improve the normalization of DTI data significantly [Mori et al.,2008]. Additionally, standardized ROIs were generated by manual delineation, yielding a WM parcellation map (WMPM) of this ICBM81 atlas [Mori et al.,2008].
A common approach for TR, also used for the construction of the ICBM81, is to apply the transformation matrix of scalarly registered images to the tensors. However, this has the disadvantage that not all diffusion information is used to drive the coregistration process.
In this work, we developed a new population‐averaged stereotaxic WM atlas using a nonrigid coregistration technique in which the complete DT information is used to drive the coregistration process. By also performing TR based on this nonrigid coregistration, the quality of WM alignment is further improved [Van Hecke et al.,2007]. Using robust FT protocols, we reconstructed a large number of WM structures and assessed both the inter‐ and intrarater reproducibility of these protocols in our DTI atlas framework. To further validate this framework, we also compared our results with the findings from the standardized ICBM81 ROIs. Subsequently, we created tract masks from these fiber tract bundles and used these tractography‐based segmentations to investigate laterality and age‐related WM changes in 42 healthy subjects aged 0 to 18 years. We observed fractional anisotropy (FA) increase with age, which was mainly due to the decrease of perpendicular diffusivity and showed a significant asymmetry in terms of the observed diffusion values for several WM fiber structures.
MATERIALS AND METHODS
Subjects
Seventy‐eight subjects were included in the study. They were subdivided into three groups. In the first group of healthy volunteers, 36 young male right‐handed adults aged between 19 and 24 years (mean, 22.2 ± 2 years) were included. This group will be referred to as “group 1” in the remainder of the study. The second group of healthy volunteers consists of 20 children aged between 9 and 17 years (mean, 12.3 ± 2.5 years). Three left‐handed and 17 right‐handed children were included (10 males and 10 females). This group will be referred to as “group 2” in the remainder of the study. None of the subjects in these two groups had a history of psychiatric disease or neurological injury. Twenty‐two subjects, aged between 4 months and 9.9 years (mean 4.8 ± 3.3 years, 9 males and 13 females) were included in the “group 3”. Note that we aimed at acquiring MRI data from a population with a wide age range, including the very young children in the third group. Unfortunately, in very young children, sedation is mostly required to avoid excessive head motion. Therefore, ethically, we could not rely on healthy volunteers to provide MRI data for this young age group. As an alternative, we have included a selection of young pediatric subjects that were referred to our centre for clinical MRI examination under sedation (i.e. “group 3”). The clinical indications for the MRI examination were headaches, tics, behavioral pathologies, and febrile convulsions. Subjects from this group were only included in the study if they had a negative history of head trauma, developmental delay, or prematurity and if the cerebral anatomy observed on conventional MR images was normal.
The study was approved by the local Ethical Board, and informed consent was obtained from all subjects or parents/guardians if the subject was younger than 18 years of age.
Data Acquisition
Groups 1 and 2 underwent MRI examination on a 3T system (Philips, Best, The Netherlands). The DTI data were acquired using a single shot spin echo, echo planar imaging sequence with the following parameters: 68 contiguous sagittal slices, slice thickness = 2.2 mm, repetition time (TR) = 11043 ms, echo time (TE) = 55 ms, field‐of‐view (FOV) = 220 × 220 mm2, matrix size = 112 × 109, pixel size = 1.96 × 2.0 mm2, acquisition time = 10 min 34 s. Diffusion gradients were applied in 45 noncollinear directions (b = 800 s/mm2) and one nondiffusion‐weighted image was acquired. Two identical DTI datasets were consecutively acquired per subject to increase the signal‐to‐noise ratio, bringing the total acquisition time to 21 min and 8 s.
Because of the need for sedation, group 3 was scanned on a 1.5T system (Philips, Best, The Netherlands) for practical reasons. The DTI data were acquired using a single shot spin echo, echo planar imaging sequence with following parameters: 40 contiguous sagittal slices, slice thickness = 3.3 mm, TR = 6419 ms, TE = 68 ms, FOV = 230 × 230 mm2, matrix size = 80 × 68, pixel size = 2.8 × 2.8 mm2, acquisition time = 7 min and 17 s. Diffusion gradients were applied in 32 noncollinear directions (b = 1000 s/mm2) and one nondiffusion‐weighted image was acquired. To increase signal to noise ratio, imaging was repeated two times, bringing the total acquisition time to 14 min and 34 s.
Data Processing
An overview of the different steps of the data processing is shown in Figure 1. In summary, the DWI data were first transferred to an offline workstation. Motion and eddy current correction of these data were performed with an affine registration by maximizing the normalized mutual information between the images using FSL‐FLIRT software (FMRIB Software Library, University of Oxford, Oxford, UK) [Jenkinson et al.,2002]. Additionally, the b‐matrix was corrected for the rotational component of the motion correction to ensure that errors in the diffusion weighting that originate from these rotations could be minimized [Leemans and Jones,2009]. All these preprocessing steps have been implemented in a software tool called CATNAP (Coregistration, Adjustment, and Tensor‐solving—a Nicely Automated Program) [Landman et al.,2006].
Figure 1.
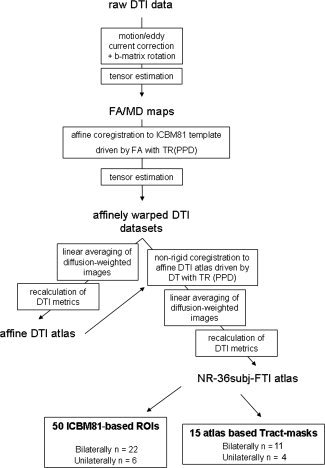
Flow chart of the different steps for the construction of the DTI atlas.
The DTs were estimated with a linear least squares fitting approach from which scalar maps were calculated: the FA, mean diffusivity (MD), parallel diffusivity (PD, corresponding to the first eigenvalue λ1 and radial diffusivity (RD), defined as the average of the second and third eigenvalue (λ2 and λ3, respectively). These maps were computed with the diffusion MRI toolbox “ExploreDTI” [Leemans et al.,2009].
DTI Atlas Construction
The DTI atlas was constructed in three steps using all the DTI data of group 1 as follows (Fig. 1). First, the DTI data sets were aligned to the ICBM81 FA template [Mori et al.,2008] using an affine coregistration methodology [Maes et al.,1997]. This affine registration was driven by the FA information from the DTI data sets of the individual subjects and included the preservation of the complete diffusion information, that is, the preservation of principal direction (PPD) [Alexander et al.,2001]. This PPD TR was incorporated to realign the diffusion information with the underlying microstructure. For a full description of this registration procedure, we refer to the article published by Leemans et al. [2005]. In the second step, the affinely registered DT components of the 36 subjects in group 1 were linearly averaged, after which the eigenvectors and eigenvalues and the different DTI measures, such as FA and MD, were recalculated. Doing so, we generated an affine DTI atlas with complete diffusion information. More detailed information can be found in the work of Jones et al. [2002]. Finally, the affinely registered DTI datasets were coregistered to the affine DTI atlas using a recently developed nonrigid coregistration technique [Van Hecke et al.,2007]. In this DT‐driven coregistration approach, the images are modeled as a viscous fluid, and PPD TR is performed after the final transformation. Subsequently, the DWIs are recalculated from these reoriented DTs to obtain the correct diffusion signals in each voxel. A final DTI atlas in ICBM81 space was computed by averaging the recalculated DWIs, from which the DTs are estimated [Van Hecke et al.,2007]. The resulting atlas will be referred to as the NR‐36subj‐FTI atlas in the remainder of the study.
To assess the registration quality difference between the affine and nonrigid algorithms used in our atlas construction methodology and to assess whether the NR‐36subj‐FTI atlas could outperform the affine DTI atlas, we calculated coefficient of variance (COV) maps. The COV maps were computed (by dividing the standard deviation map of FA by the mean FA map of all subjects) after both affine and nonrigid registration to the affine DTI atlas and the NR‐36subj‐FTI atlas, yielding 4 COV maps. Because we were interested in the registration accuracy of the WM, a WM mask was used, defined as all voxels having an FA larger than 0.2 in the FA map of the affine or nonrigid template.
Fiber Tractography on the DTI Atlas
Because all DT information was incorporated in the NR‐36subj‐FTI atlas, we could perform FT on this atlas. Deterministic streamline FT was performed using the diffusion MRI toolbox “ExploreDTI” [Leemans et al.,2009]. For all tract reconstructions, the algorithm settings were as follows: the FA threshold to stop tracking = 0.2, the angle threshold = 30°, and the minimal fiber length = 20 mm. These algorithm settings were chosen based on both previous reports [Basser et al.,2000; Mukherjee et al.,2008; Van Hecke et al.,2008] and own experience.
For the ROI definition, we used the protocols of Wakana et al. [2007] and Stieltjes et al. [2001], which have already been shown to yield reproducible and reliable tract reconstructions. In doing so, we delineated the following 11 WM tracts with the protocols of Wakana et al. [2007]: hippocampal part of cingulum (CGH), cingulated gyrus part of cingulum (CGC), corticospinal tract (CST), anterior thalamic radiation (ATR), superior longitudinal fasciculus (SLF), temporal component of SLF (SLFt), inferior longitudinal fasciculus (ILF), inferior fronto‐occipital fasciculus (IFO), uncinate fasciculus (UNC), forceps major (Fmajor), and forceps minor (Fminor). Using the ROI definition protocols of Stieltjes et al. [2001], we reconstructed the medial lemniscus (ML), superior cerebellar peduncle (SCP), and medial cerebellar peduncle (MCP). Note that for the corpus callosum (CC), no robust ROI definition protocol is currently available. We therefore reconstructed the CC using our own definition protocol with two ROIs and tested its reproducibility. In this protocol, the seed ROI defines the CC on the midsagittal plane. A second “AND” ROI on the axial slice on the superior edge of the CC is defined including the entire axial slice, as shown in Figure 2. As bilateral WM tracts were reconstructed separately, we obtained a total of 22 bilateral and 4 unilateral tract reconstructions.
Figure 2.
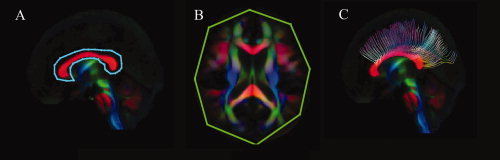
ROI definition protocol for the reconstruction of the corpus callosum (CC). The first seed ROI (blue) delineates the outer border of the CC on the mid‐sagittal slice (A). For the second “AND” ROI (green), the entire axial plane at the superior edge of the CC is selected (B). The resulting fiber tract reconstruction is shown in (C).
Assessment of Intra‐ and Interrater Reproducibility
To assess the reproducibility of the measurements, FT was performed by three independent, experienced observers repeating the 26 tracking protocols on our NR‐36subj‐FTI atlas three times, yielding nine reconstructions for each tract of interest. To calculate measures of reproducibility [κ‐values (κ‐values)], a binary version of each individual tract reconstruction was generated. Subsequently, for each combination of the nine available tract reconstructions, we performed the following calculation: two individual binary tracts were summed to generate a combined image that contained four groups of voxels: (1) voxels that were not part of the tract reconstruction in either mask (this number of voxels is denoted as “nn”), (2) voxels that were part of the tract reconstruction in only one of the two masks (represented as “p” and “np”), and (3) voxels that were part of the tract reconstruction in both masks (pp).
Subsequently, expected values E(.) for each class were calculated using the following equations (with N = total number of voxels)
| (1) |
| (2) |
| (3) |
| (4) |
κ‐values reflecting the reproducibility were then calculated as follows:
| (5) |
| (6) |
| (7) |
The intrarater reproducibility (denoted as “κ1”) is calculated by averaging the κ‐values for each of the pair‐wise combinations. The interrater reproducibility was assessed by calculating κ‐values for the pair‐wise combinations of the last tracking result of each rater. From these values, an average kappa across the three raters (denoted as “κ2”) was then calculated. To interpret these κ‐values, we adopted the criteria set by Landis and Koch [1977], in which κ = [0.11–0.2] reflects “slight,” κ = [0.21–0.4] “fair,” κ = [0.41–0.60] “moderate,” κ = [0.61–0.80] “substantial,” and κ = [0.81–1.0] “almost perfect” agreement.
Effects of Age and Hemispherical Differences
We investigated potential effects of age and laterality on diffusion measures using our own created tract masks (see further) and validated our results with the ICBM81 WMPM, which consists of 50 ROIs [Mori et al.,2008]. First, new tract masks were derived from those voxels that were present in at least six of the nine tract reconstructions, which were obtained by three reconstructions by three observers (Fig. 3). Subsequently, these new tract masks and the 50 ICBM81 ROIs were overlaid on the DTI data of groups 2 and 3, which were all nonrigidly coregistered to the NR‐36subj‐FTI atlas [Van Hecke et al.,2007]. From the tract masks, mean FA, MD, PD, and RD values were determined for these subjects.
Figure 3.
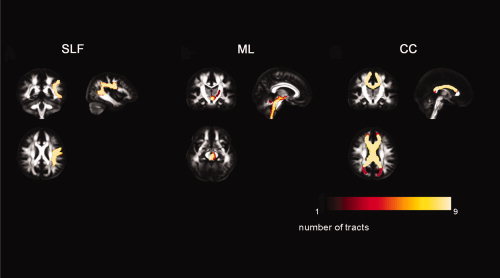
The variability in the reconstruction of the superior longitudinal fasciculus (SLF), medial lemniscus (ML), and corpus callosum (CC). The masks of each of the nine tract reconstructions were spatially overlaid, yielding an informative map in which the values of the voxels represent the number of times the voxel was part of a tract reconstruction (0 = never part of the reconstruction; 9 = each time part of the reconstruction). These color‐coded maps are shown on the FA map of the NR‐36subj‐FTI atlas. The color bar illustrates the colors corresponding to values 1–9.
To assess potential laterality effects, that is, asymmetries between bilateral WM tracts, we calculated the asymmetry index (AI) of FA for all bilateral tracts/ROIs as follows [Bonekamp et al.,2007]:
In this formula, right‐sided and left‐sided asymmetry is determined by a negative and a positive AI, respectively.
Statistical Analysis
Normality of the distribution for the different metrics was investigated with the Kolmogorov–Smirnov (KS) test. Because the MD, FA, PD, and RD values were not normally distributed (KS test of all tracts P < 0.05), nonparametric statistics were used for all further analyses.
To detect age‐related differences in MD, FA, PD, or RD, a linear regression analysis was performed with age as independent variable. In these tests, statistical significance threshold was set to P < 0.05 after Bonferroni correction for multiple testing (n = 26 for the tract masks and n = 50 for the ICBM81 ROIs). Consequently, the Bonferroni corrected thresholds of statistical significance were set to P < 0.0019 and P < 0.001 for the tract masks and ICBM81 ROIs, respectively.
Significance of interhemispheric differences in FA and MD was determined with a Mann–Whitney U test after correcting for age (note that significant age related findings were observed—see “Results” section). This correction was achieved by investigating the regression residuals, that is, by subtracting the second‐order polynomial fit for the FA/MD values versus age from these values. The significance threshold was Bonferroni corrected for multiple comparisons (n = 11 for the fiber tract masks and n = 22 for the ICBM81 derived ROIs). Consequently, the Bonferroni corrected significance thresholds were set to P < 0.0045 and P < 0.0023 for the tract masks and the ICBM81 ROIs, respectively.
RESULTS
Qualitative Assessment of the Atlas
Figure 4 shows representative axial sections of the ICBM‐DTI‐81 atlas (Fig. 4A) together with the corresponding sections of the NR‐36subj‐FTI atlas (Fig. 4B). Major WM tracts can be observed in both the ICBM‐DTI‐81 atlas [Mori et al.,2008] and the NR‐36subj‐FTI atlas. For example, the stem of the UNC (red arrow), the cingulum (yellow), a branch of the SLF (orange), and the subcortical WM of the superior temporal gyrus (white) can clearly be identified. Furthermore, because the NR‐36subj‐FTI atlas contains the complete diffusion information, additional orientational information, such as the DT ellipsoids (Fig. 4C) and whole brain FT results (Fig. 4D) can be visualized.
Figure 4.
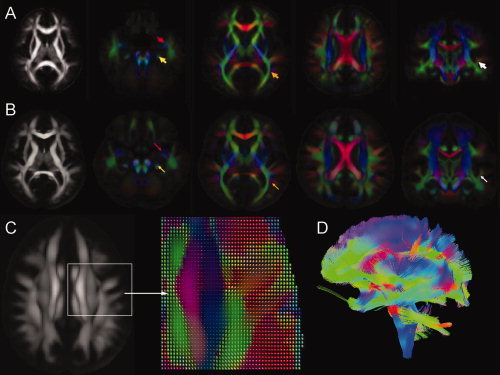
Representative axial slices of the ICBM81 template (A) and the NR‐36subj‐FTI atlas (B). Color‐encoded orientation maps at four different slices are shown (red = left–right direction; green = anterior–posterior; blue = inferior–superior; color intensity is scaled by the FA values). Arrows are indicating major WM tracts in both atlases: uncinate fasciculus (red), cingulum (yellow), a branch of the superior longitudinal fasciculus (orange), and the subcortical WM of the superior temporal gyrus (white). Figure (C) shows the DT ellipsoids in the NR‐36subj‐FTI reflecting the predominant direction of diffusion. In Figure 4D, a whole‐brain FT of the NR‐36subj‐FTI atlas was performed.
Quantitative Assessment of the Atlas: COV Maps
Figure 5 shows the FA maps (Fig. 5A,B), the WM masks (Fig. 5C,D), and the COV maps of FA after the affine (Fig. 5E,F) and nonrigid registration step (Fig. 5G,H), for both the affine DTI atlas (left column) and the NR‐36subj‐FTI atlas (right column).
Figure 5.
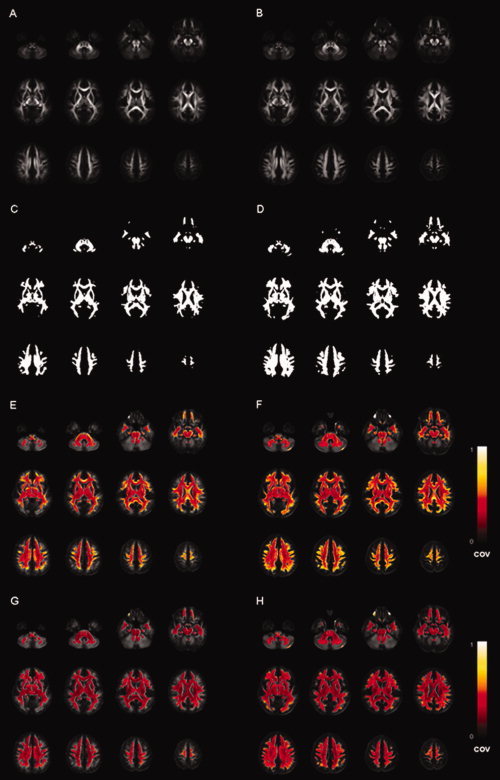
The FA maps (A, B), the WM masks (i.e., voxels with FA > 0.2 in the corresponding atlas) (C, D) and the coefficient of variance (COV) maps of FA after affine (E, F) and nonrigid registration (G, H), when using the affine DTI atlas (left column) or the NR‐36subj‐FTI atlas (right column), respectively. The color bar indicates the colors corresponding to values of the COV between 0 and 1.
When comparing the FA maps of the affine DTI atlas (Fig. 5A) and the NR‐36subj‐FTI atlas (Fig. 5B), the FA map of the NR‐36subj‐FTI atlas includes more detailed WM structure, especially in the peripheral WM. This can also be appreciated in the WM masks (Fig. 5C,D), as the WM mask generated from the NR‐36subj‐FTI atlas (Fig. 5D) contains more voxels that survive an FA threshold of 0.2.
Concerning the coregistration approach, for both templates, the COV was significantly smaller when using the nonrigid compared (Fig. 5E,F) to the affine coregistration approach (Fig. 5G,H).
Fiber Tractography on the Atlas and Assessment of Intra‐ and Interrater Reproducibility
All WM tracts were reconstructed three times by all observers using the specified ROI definition protocols. Figure 6 shows the resulting tract masks of the 11 bilateral and 4 unilateral tracts. Within these tract masks, only those voxels that were present in at least six of the nine reconstructions were included.
Figure 6.
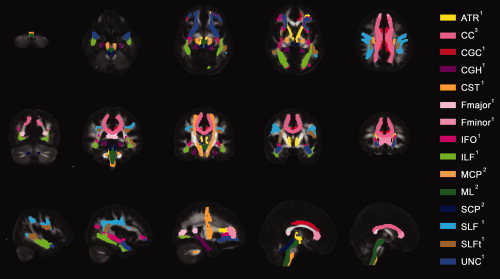
Color representation of the 11 bilateral and 4 unilateral tract reconstructions from the ROI definition protocols of Wakana et al (indicated by “1”), Stieltjes et al. (indicated by “2”) and our own ROI definition protocol for the corpus callosum (CC) (indicated by “3”) overlaid on the FA map of the NR‐36subj_FTI atlas. Five representative axial, coronal and sagittal slices are shown. WM tracts reconstructed with the protocols of Wakana et al.: hippocampal part of cingulum (CGH), cingulated gyrus part of cingulum (CGC), corticospinal tract (CST), anterior thalamic radiation (ATR), superior longitudinal fasciculus (SLF), temporal component of SLF (SLFt), inferior longitudinal fasciculus (ILF), inferior fronto‐occipital fasciculus (IFO), uncinate fasciculus (UNC), forceps major (Fmajor), and forceps minor (Fminor). WM tracts reconstructed with the protocols of Stieltjes et al.: medial lemniscus (ML), superior cerebellar peduncle (SCP), and medial cerebellar peduncle (MCP). Visualization of the CC was omitted in some slices to ameliorate the visualization of other tracts.
Figure 3 shows the variability of the left SLF, the left ML, and the CC over the three different reconstructions by three observers. The voxels were color‐coded according to the number of times each voxel was part of the tract reconstruction in the nine subsequent reconstructions. Very little variation was seen for the SLF and the CC, whereas the reconstructions of the ML—although limited mostly to the periphery—showed larger variability.
Table I shows κ‐values for intra‐ and interrater reproducibility for all reconstructed tracts. Generally, high κ‐values were found for the different WM tract reconstructions. For the 11 WM tracts that were reconstructed with the ROI definition protocols by Wakana [2007], κ‐values were always higher than 0.6 and even mostly higher than 0.7, which qualifies the reproducibility of these tracts as at least “substantial” [Landis and Koch, 1977]. For the WM tracts in the brainstem that were reconstructed using the ROI definition protocols by Stieltjes et al. [2001], κ‐values were also higher than 0.6, except for the SCP for which an interrater reproducibility (κ2) of only 0.49 was found. The reproducibility of the ML and MCP can thus be qualified as “substantial,” whereas the reproducibility of the SCP is only ‘moderate’ [Landis and Koch, 1977]. Finally, for the CC, which was delineated using our own ROI definition protocol, a κ2‐value of 0.96 was obtained, which qualifies the reproducibility of this tract as “almost perfect” [Landis and Koch, 1977].
Table I.
κ‐Values for intra and interrater reproducibility of 15 major white matter tracts
| ATRa | CCb | CGCa | CGHa | CSTa | Fminora | Fmajora | IFOa | ILFa | MCP_totc | MLc | SCPc | SLFa | SLFta | UNCa | |
|---|---|---|---|---|---|---|---|---|---|---|---|---|---|---|---|
| Intrarater 1 (κ1) | 0.752 | 0.999 | 0.808 | 0.824 | 0.844 | 0.729 | 0.871 | 0.978 | 0.742 | 0.803 | 0.596 | 0.507 | 0.825 | 0.871 | 0.914 |
| Intrarater 2 (κ1) | 0.718 | 0.997 | 0.888 | 0.861 | 0.810 | 0.838 | 0.953 | 0.845 | 0.738 | 0.808 | 0.798 | 0.691 | 0.895 | 0.855 | 1.000 |
| Intrarater 3 (κ1) | 0.810 | 0.986 | 0.790 | 0.927 | 0.971 | 1.000 | 0.901 | 0.817 | 0.484 | 0.853 | 0.810 | 0.727 | 0.884 | 0.859 | 0.767 |
| Interrater (κ2) | 0.625 | 0.960 | 0.816 | 0.853 | 0.919 | 0.751 | 0.907 | 0.779 | 0.656 | 0.785 | 0.609 | 0.492 | 0.866 | 0.893 | 0.862 |
Reconstructed according to Wakana et al.
Reconstructed according to own protocol.
Reconstructed according to Stieltjes et al.
Effect of Age
A significant increase of FA with age could be demonstrated in all of the 26 examined tract masks as well as in all of the 50 examined ICBM81 ROIs. In Figure 7, these age‐related increases of FA in the tract masks of the 11 bilateral tract reconstructions can be clearly observed. Significant decreases of MD and RD with age were found in all WM tracts and ICBM81 ROIs (Figs. 8 and 9). In addition, a decrease of PD with age can be observed, but is less pronounced than the concomitant RD changes (Fig. 10). This decrease of the PD only reached significance for the following tract masks: right ATR, right CGH, right CST, bilateral SLF, right SLFt, and bilateral UNC. Similarly, significant decreases of the PD were only seen for the following ICBM81 ROIs: right ALIC, right ACR, bilateral SCR, bilateral EC, right CGC, right CGH, right SLF, right SFO, right IFO, and left UNC.
Figure 7.
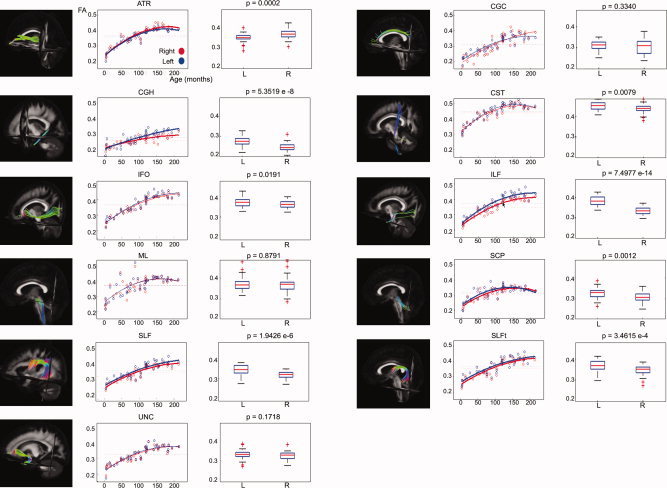
Laterality effects in terms of FA after correction for age for 11 bilateral WM tracts. For each tract, scatter plots of age (horizontal axis) with their corresponding mean FA value (vertical axis) are shown on the left side. Data from left‐sided and right‐sided tract reconstructions are shown in blue and red, respectively. Bold lines indicate a significant left–right difference in FA. Dotted lines represent the average FA value for each side. On the right side, the corresponding box plot is shown for the left (L) and right (R) tract reconstructions. The P values (Mann–Whitney U tests) are defined to be significant at P < 0.0045 (Bonferroni corrected).
Figure 8.
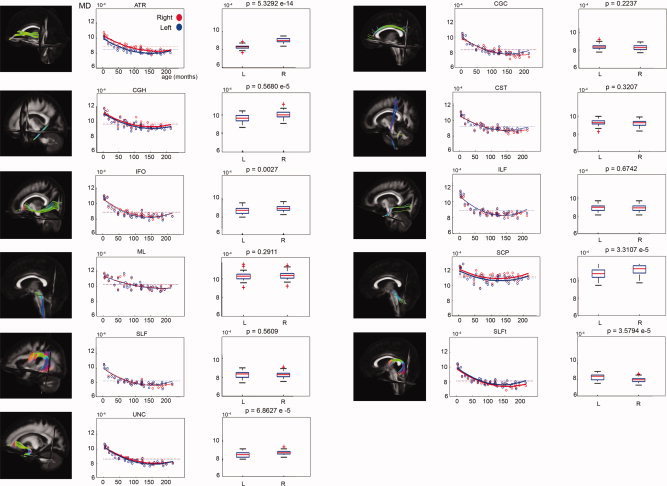
Laterality effects in terms of MD after correction for age for 11 bilateral WM tracts. For each tract, scatter plots of age (horizontal axis) with their corresponding mean MD value (vertical axis) are shown on the left side. Data from left‐sided and right‐sided tract reconstructions are shown in blue and red, respectively. Bold lines indicate a significant left–right difference in MD. Dotted lines represent the average MD value for each side. On the right side, the corresponding box plot is shown for the left (L) and right (R) tract reconstructions. The P values (Mann–Whitney U tests) are defined to be significant at P < 0.0045 (Bonferroni corrected).
Figure 9.
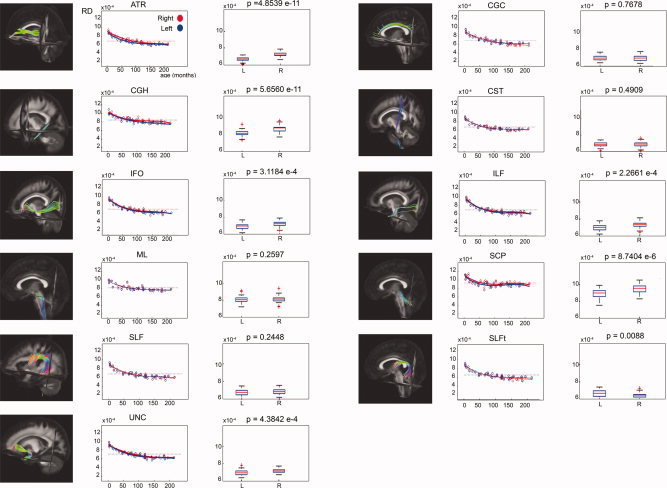
Laterality effects in terms of RD after correction for age for 11 bilateral WM tracts. For each tract, scatter plots of age (horizontal axis) with their corresponding mean RD value (vertical axis) are shown on the left side. Data from left‐sided and right‐sided tract reconstructions are shown in blue and red, respectively. Bold lines indicate a significant left–right difference in RD. Dotted lines represent the average RD value for each side. On the right side, the corresponding box plot is shown for the left (L) and right (R) tract reconstructions. The P values (Mann–Whitney U tests) are defined to be significant at P < 0.0045 (Bonferroni corrected).
Figure 10.
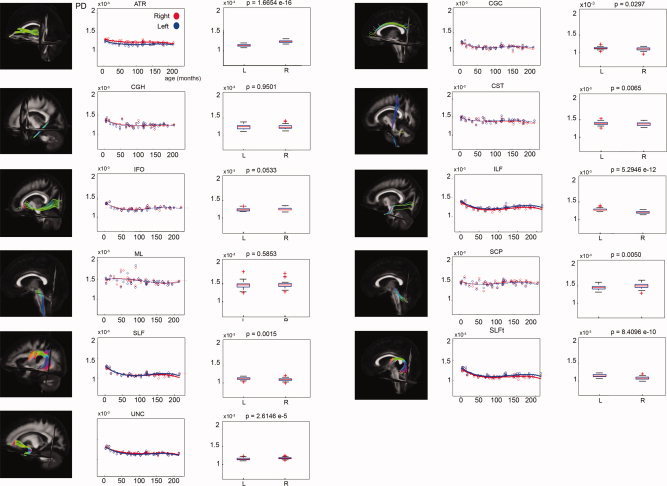
Laterality effects in terms of PD after correction for age for 11 bilateral WM tracts. For each tract, scatter plots of age (horizontal axis) with their corresponding mean PD value (vertical axis) are shown on the left side. Data from left‐sided and right‐sided tract reconstructions are shown in blue and red, respectively. Bold lines indicate a significant left–right difference in PD. Dotted lines represent the average PD value for each side. On the right side, the corresponding box plot is shown for the left (L) and right (R) tract reconstructions. The P values (Mann–Whitney U tests) are defined to be significant at P < 0.0045 (Bonferroni corrected).
Laterality Effects
Left–right asymmetries were assessed after correcting the FA‐ and MD values for age.
Table II lists the AI for the FA, the directionality of the asymmetry for FA and MD, and the corresponding P‐value of the statistical comparison in the 11 bilateral tract reconstructions. Table III provides these values for the 22 bilateral ICBM81 ROIs. The AI ranged from −0.01 to 0.07 for the tract masks and from −0.06 to 0.48 for the ICBM81 ROIs.
Table II.
Effects of side for FA and MD—Tract masks
| Side | P value* | AI | STD | |
|---|---|---|---|---|
| FA | ||||
| ATR | L < R | <0.001 | −0.023 | 0.020 |
| CGC | 0.014 | 0.043 | ||
| CGH | R < L | <0.001 | 0.059 | 0.050 |
| CST | 0.015 | 0.015 | ||
| IFO | 0.016 | 0.019 | ||
| ILF | R < L | <0.001 | 0.072 | 0.023 |
| ML | 0.003 | 0.035 | ||
| SCP | R < L | 0.001 | 0.026 | 0.035 |
| SLF | R < L | <0.001 | 0.040 | 0.018 |
| SLFt | R < L | <0.001 | 0.032 | 0.026 |
| UNC | 0.010 | 0.020 | ||
| MD | ||||
| ATR | L < R | <0.001 | ||
| CGC | ||||
| CGH | L < R | <0.001 | ||
| CST | ||||
| IFO | L < R | 0.003 | ||
| ILF | ||||
| ML | ||||
| SCP | L < R | <0.001 | ||
| SLF | ||||
| SLFt | R < L | <0.001 | ||
| UNC | L < R | <0.001 | ||
The Bonferroni corrected threshold for statistical significance was set to P < 0.0045.
Table III.
Effects of side for FA and MD—ICBM81 ROIs
| Side | P value* | AI | STD | |
|---|---|---|---|---|
| FA | ||||
| CST | 0.020 | 0.081 | ||
| ML | 0.038 | 0.104 | ||
| ICP | L > R | <0.001 | 0.092 | 0.073 |
| SCP | 0.035 | 0.073 | ||
| CP | −0.036 | 0.039 | ||
| ALIC | L > R | <0.001 | 0.090 | 0.044 |
| PLIC | L > R | <0.001 | 0.077 | 0.029 |
| RLIC | L > R | <0.001 | 0.075 | 0.069 |
| ACR | 0.027 | 0.042 | ||
| SCR | L > R | <0.001 | 0.107 | 0.048 |
| PCR | L > R | <0.001 | 0.081 | 0.045 |
| PTR | L > R | <0.001 | 0.085 | 0.054 |
| SS | L > R | <0.001 | 0.066 | 0.051 |
| EC | L > R | <0.001 | 0,069 | 0.046 |
| CGC | L > R | <0.001 | 0.476 | 0.090 |
| CGH | L > R | <0.001 | 0.102 | 0.091 |
| FX‐ST | L > R | <0.001 | 0.156 | 0.049 |
| SLF | L > R | <0.001 | 0.102 | 0.031 |
| SFO | L > R | <0.001 | 0.314 | 0.085 |
| IFO | L > R | <0.001 | 0.089 | 0.068 |
| UNC | −0.063 | 0.085 | ||
| TAP | L > R | <0.001 | 0.312 | 0.106 |
| MD | ||||
| CST | ||||
| ML | L < R | <0.001 | ||
| ICP | L < R | <0.001 | ||
| SCP | L < R | <0.001 | ||
| CP | L < R | <0.001 | ||
| ALIC | L < R | <0.001 | ||
| PLIC | ||||
| RLIC | L < R | <0.001 | ||
| ACR | ||||
| SCR | ||||
| PCR | L < R | <0.001 | ||
| PTR | ||||
| SS | ||||
| EC | L > R | <0.001 | ||
| CGC | ||||
| CGH | ||||
| FX‐ST | L < R | <0.001 | ||
| SLF | ||||
| SFO | L < R | <0.001 | ||
| IFO | L > R | 0.001 | ||
| UNC | L > R | <0.001 | ||
| TAP | L < R | <0.001 | ||
The Bonferroni corrected threshold for statistical significance was set to P < 0.0023.
Using the tract masks, 6 tracts out of 11 showed significant asymmetry of FA or MD after Bonferroni correction. Using the ICBM81 ROIs, 16 ROIs out of 22 showed significant asymmetry of FA after Bonferroni correction, whereas 13 ROIs out of 22 showed significant asymmetry of MD.
Significant left–right differences with left‐sided predominance were found with both the tract masks and the ICBM81 ROIs in CGH and SLF. Furthermore, using the tract masks, a significantly larger FA for the left ILF and left SCP was found compared to their right homologues. Similarly, left predominance of FA was found in ICP, ALIC, PLIC, RLIC, SCR, PCR, SS, EC, CGC, FX‐ST, SFO, IFO, and TAP using the ICBM81 ROIs. Discrepant left–right differences between the tract masks and ICBM81‐derived ROIs were only found in the ATR. No significant left–right differences were found for CST, ML, and UNC using either the tract masks or ICBM81 ROIs.
DISCUSSION
During the last decade, several 3D single‐subject DTI atlases have been introduced mainly to facilitate analysis for other studies in a qualitative manner [Catani and Thiebaut,2008; Hagmann et al.,2003; Makris et al.,1997; Stieltjes et al.,2001; Wakana et al.,2004]. Recently, Mori et al. described a first population‐averaged stereotaxic WM atlas that improved the reliability for quantitative group‐based investigations [Mori et al.,2008].
In this article, we combined affine and nonrigid coregistration techniques and integrated the complete DT information in the coregistration process in order to construct a DTI atlas with full diffusion information. After generating an affine DTI atlas in ICBM81 space using an affine DTI coregistration method, the final DTI atlas was constructed by nonrigidly aligning the datasets to the affine DTI atlas and calculating the population‐based average from the transformed DTI datasets [Leemans et al.,2005; Van Hecke et al.,2007]. By using a nonrigid coregistration algorithm and driving the process by the DT elements, the coregistration results were more reliable, as indicated by a lowering of the residual variance after coregistration.
Because the complete diffusion information was available in the NR‐36subj‐FTI atlas, atlas‐based FT could be performed. Using widely accepted and robust ROI definition protocols, we reconstructed 11 bilateral and 4 unilateral WM tracts from our DTI atlas [Stieltjes et al.,2001; Wakana et al.,2007] with high intra‐ and interrater reproducibility. For the CC, our own ROI selection protocol was defined and showed a high reproducibility. By using these fiber tract reconstructions as tract masks, we found significant effects of age and laterality in children that were aged between 4 months and 18 years of age. In the following paragraphs, we will discuss our findings in detail.
DTI Atlas
Comparison of fiber bundle properties between different populations requires accurate normalization of the WM structure. It has already been demonstrated that the results of such comparisons will depend on several postprocessing parameters, such as the coregistration technique [Jones et al.,2007; Zhang et al.,2007] or the choice of the reference system [Shen et al.,2005,2007].
Concerning the reference system, different types of templates have been proposed for the spatial normalization of DTI data. One of the most trivial approaches is to mathematically average all the FA maps that were included in the study to get a study‐specific FA template. The main disadvantage of this approach is that no longer orientational information is available to guide subsequent coregistration processes. Using a more sophisticated approach, Mori et al. [2008] have generated the ICBM81‐template, which has already been shown to provide a more appropriate contrast for spatial normalization of DTI images. They only used affine transformations, whereas we also incorporated nonrigid transformations in our DTI atlas construction. Additionally, instead of only using the FA to guide the coregistration process, we also used the DT elements in this respect. Previous studies have shown that incorporating all diffusion information during coregistration and applying an appropriate TR strategy can improve both the spatial and orientational alignment of DTI data, especially when nonrigid coregistration techniques are used [Alexander et al.,2001; Park et al.,2003; Van Hecke et al.,2007]. In this study, we confirmed these findings, as the residual variance after nonrigid coregistration was lower than the residual variance after affine coregistration to the NR‐36subj‐FTI atlas (see Fig. 5). Thus, by incorporating a nonrigid coregistration step in our atlas construction, we believe that the combination of nonrigid transformations and the use of DT elements for coregistration yield more reliable coregistration results, and hence, also a more reliable DTI atlas. Additionally, the NR‐36subj‐FTI atlas contains the complete diffusion information, which can be used to guide the coregistration and thus improve the reliability of the coregistration results. Finally, the NR‐36subj‐FTI atlas includes more detailed WM structure, especially in the peripheral WM (see Fig. 5B). This can also be appreciated in the WM masks, as the WM mask generated from the NR‐36subj‐FTI atlas (see Fig. 5D) contains more voxels that survive an FA threshold of 0.2. Consequently, when performing FT, the availability of additional WM points might result in longer streamlines and more‐detailed fiber tracking (FT) results.
It should be noted that other research groups have proposed alternative atlas construction methods, with some yielding subject‐based atlases [Ardekani and Sinha,2006; Guimond et al.,2000; Park et al.,2003] and others yielding population‐based atlases [Goodlett et al.,2009; Van Hecke et al.,2008]. We did not compare our atlas construction methodology to other methodologies, as this was not the scope of this study.
In the recent years, there has been an increased interest in analysis that takes into account the unique properties of specific anatomical WM structures. Recently, some interesting segmentation frameworks have been proposed [Lawes et al.,2008; Yushkevich et al.,2008].
In our analysis framework, FT was performed on the NR‐36subj‐FTI atlas and tractography‐derived tract segmentations were used to further standardize the analysis of DTI data. In this study, we used the widely accepted and robust protocols for ROI selection, which have already been demonstrated to be highly reproducible [Stieltjes et al.,2001; Wakana et al.,2007]. Because we developed our own population‐based DTI atlas, we assessed the reliability of these protocols on the NR‐36subj‐FTI atlas. The reproducibility of most reconstructed tracts was high (as determined by their κ‐values), except for the SCP, for which we found only moderate agreement between the three different observers. We also succeeded to define a robust ROI protocol for reconstructing the CC, for which we found an almost perfect agreement (κ2‐value = 0.96). Moreover, by defining the ROIs for FT on the DTI atlas and using the resulting tractography‐derived segmentations for analysis of individual subjects, we avoided variability caused by defining multiple ROIs. Note that with these tract masks voxels belonging to specific WM structures can be grouped in an automated and reproducible way. Another advantage of our NR‐36subj‐FTI atlas is that it is in ICBM152 space, which allows incorporation of the ICBM81 WMPM [Mori et al.,2008]. This WMPM provides a ROI‐based tool to further evaluate a large number of WM structures. The tractography‐derived segmentations and the WMPM may be used as complementary analysis tools for DTI data.
Effects of Age in WM Maturation
As a first application of the DTI atlas framework, we extracted the FA, MD, PD, and RD values using the tract masks in a normal population of children and adolescents aged 4 months to 18 years and investigated the potential effects of age in WM maturation. Here, we also calculated the diffusion values for the 50 ICBM81 ROIs that were derived from the WMPM. Overall, our findings confirmed previous reports [Hermoye et al.,2006]. We found an FA increase and MD decrease with age in all investigated WM structures, which were most pronounced during the first months of life. Eigenvalue analysis mainly showed a reduction of diffusion perpendicular to the fiber tracts (λ2 and λ3), whereas diffusion parallel to the tracts (λ1) remains fairly constant over time. Hence, increases in FA do not seem to be caused by an increase in the parallel eigenvalue, but rather by a decrease in the perpendicular eigenvalues. This reduction of perpendicular diffusivity is consistent with a progressive organization of fibers into fascicles and/or true myelination, corresponding to the ensheatment of oligodendroglial processes around the axons [van der Knaap et al.,1991]. This observation has also been described previously [Mukherjee et al.,2002; Snook et al.,2005,2007; Suzuki et al.,2003].
Laterality in WM Maturation
In a second application, we investigated potential laterality effects of diffusion measures in a normal population of children and adolescents aged 4 months to 18 years. We found a significant left–right asymmetry, even after Bonferroni correction, in 6 of the 11 bilateral tract masks and in 16 of the 22 bilateral ICBM81 ROIs. Most of the observed asymmetries showed leftward predominance, as demonstrated by a positive AI, with exception of the ATR. Significant left‐sided predominance was found for both the tract masks and ICBM81 ROIs in CGH and SLF, as previously reported by several authors [Bonekamp et al.,2007; Buchel et al.,2004; Park et al.,2004; Schmithorst et al.,2002; Wakana et al.,2007]. The CGH and SLF are known to be implicated in the language networks, more specifically by connecting two important cortical language areas, that is, Brocca's area and Wernicke's area. Lesions in these WM regions lead to different aphasic syndromes [Catani and Mesulam,2008; Catani et al.,2007; Friederici, in press]. As the language function is known to be left‐lateralized in 90–95% of right‐handed subjects [Vikingstad et al.,2000], the finding of asymmetry of the WM tracts involved in language may reflect this functional specialization. Other pathways important for language specialization, such as the ILF and SFO, were also found to be left‐lateralized in this study, confirming previous findings [Bonekamp et al.,2007; Wakana et al.,2007]. Although left‐sided language specialization seems to be the most evident explanation for the left‐sided predominance of SLF, ILF, and SFO, other hemispheric specializations such as visual processing of reading, auditory tonal discrimination, and working memory might also be implicated.
Like language ability, handedness is likely to be associated with a left‐sided asymmetry of the cerebral cortex (gray matter) and connectivity (WM) [Witelson and Nowakowski,1991]. In this context, it should be noted that we did not observe any significant asymmetry favoring the left CST over its full length using the tract masks. However, we did find a localized asymmetry in the ALIC/PLIC and RLIC, favoring left over right, which is concordant with findings of previous studies [Buchel et al.,2004; Eluvathingal et al.,2007]. Correlation studies of DTI‐based asymmetry metrics with neuropsychological testing and/or functional imaging parameters may provide further insights in these laterality effects.
Limitations
A first potential limitation of this study is that the data from the youngest age group (group 3) were obtained from young pediatric subjects that were referred to our centre for clinical MRI examination under sedation. Neither sedation of healthy infants nor the imaging of nonsedated infants was possible in this study: the former was ethically inconceivable, and the latter would have yielded large motion artefacts. To minimize the inclusion of abnormal cases, we carefully inspected both conventional T1‐ and T2‐weighted anatomical images and the clinical history of each patient. However, despite these efforts, we cannot completely rule out the possibility of including abnormal cases in our study population.
Another potential limitation of this study is that we were obligated to use different MRI scanners with different magnetic field strengths. In a study of Huismans et al. [Huisman et al.,2006], the impact of the magnetic field strength on DTI metrics was evaluated. MD values for gray matter and WM were lower at 3T compared to 1.5T with a maximum percent change of 9.79%. FA values were higher at 3T compared to 1.5T with a maximum percent change of 11.15%. We recognize that these field strength variances could be a confounding factor in our interpretation of age‐related differences in FA, MD, RD, and PD. However, our obtained diffusion metrics from both field strengths seem to be very similar to previously described DTI studies with children [Barnea‐Goraly et al.,2005; Bonekamp et al.,2007; Dubois et al.,2008; Hermoye et al.,2006; Lebel et al.,2008; Snook et al.,2005]. Moreover, we point out that the differences in FA between the youngest and the oldest children varied between the 37 and 76% and the decrease in MD varied between the 10 and 26%. These changes are much larger than the changes that can be explained by changes in magnetic field strength. A confirmation of our results with DTI data obtained with the same protocol on the same MRI system will be the subject of further studies to validate these age‐related findings.
CONCLUSION
In conclusion, we have developed a DTI atlas, which contains the full diffusion information and which is located in ICBM152 coordinate space. On this atlas, 15 major WM tracts could be reconstructed with high reproducibility, which were then used as tract masks to study laterality effects and WM maturation in a group of young children and adolescents. Characteristic signatures of each tract were revealed, mainly showing FA increases and MD decreases. In particular, we found the decrease of perpendicular diffusivity to be the main component of the observed FA increase. We also demonstrated WM tract asymmetries for major functional pathways related to language and for WM structures in the limbic system. The use of these tract masks offers an automated and reproducible approach of grouping voxels that belong to specific WM structures and is complementary to the more conventional ROI evaluation. As such, this novel atlas‐based framework will also be useful in studying individuals with developmental, cognitive, and/or behavioral disorders in an objective and standardized way, which—in a clinical setting—is of paramount importance.
Acknowledgements
We thank our healthy volunteers for their willingness to participate in this study.
REFERENCES
- Alexander DC, Pierpaoli C, Basser PJ, Gee JC ( 2001): Spatial transformations of diffusion tensor magnetic resonance images. IEEE Trans Med Imaging 20: 1131–1139. [DOI] [PubMed] [Google Scholar]
- Aoki S, Masutani Y, Abe O ( 2007): Magnetic resonance diffusion tractography in the brain—Its application and limitation. Brain Nerve 59: 467–476. [PubMed] [Google Scholar]
- Ardekani S, Sinha U ( 2006): Statistical representation of mean diffusivity and fractional anisotropy brain maps of normal subjects. J Magn Reson Imaging 24: 1243–1251. [DOI] [PubMed] [Google Scholar]
- Barnea‐Goraly N, Menon V, Eckert M, Tamm L, Bammer R, Karchemskiy A, Dant CC, Reiss AL ( 2005): White matter development during childhood and adolescence: A cross‐sectional diffusion tensor imaging study. Cereb Cortex 15: 1848–1854. [DOI] [PubMed] [Google Scholar]
- Basser PJ, Mattiello J, LeBihan D ( 1994): MR diffusion tensor spectroscopy and imaging. Biophys J 66: 259–267. [DOI] [PMC free article] [PubMed] [Google Scholar]
- Basser PJ, Pajevic S, Pierpaoli C, Duda J, Aldroubi A ( 2000): In vivo fiber tractography using DT‐MRI data. Magn Reson Med 44: 41–50. [DOI] [PubMed] [Google Scholar]
- Bonekamp D, Nagae LM, Degaonkar M, Matson M, Abdalla WM, Barker PB, Mori S, Horska A ( 2007): Diffusion tensor imaging in children and adolescents: Reproducibility, hemispheric, and age‐related differences. Neuroimage 34: 733–742. [DOI] [PMC free article] [PubMed] [Google Scholar]
- Buchel C, Raedler T, Sommer M, Sach M, Weiller C, Koch MA ( 2004): White matter asymmetry in the human brain: A diffusion tensor MRI study. Cereb Cortex 14: 945–951. [DOI] [PubMed] [Google Scholar]
- Catani M, Mesulam M ( 2008): The arcuate fasciculus and the disconnection theme in language and aphasia: History and current state. Cortex 44: 953–961. [DOI] [PMC free article] [PubMed] [Google Scholar]
- Catani M, Thiebaut DS ( 2008): A diffusion tensor imaging tractography atlas for virtual in vivo dissections. Cortex 44: 1105–1132. [DOI] [PubMed] [Google Scholar]
- Catani M, Allin MP, Husain M, Pugliese L, Mesulam MM, Murray RM, Jones DK ( 2007): Symmetries in human brain language pathways correlate with verbal recall. Proc Natl Acad Sci USA 104: 17163–17168. [DOI] [PMC free article] [PubMed] [Google Scholar]
- Dubois J, Dehaene‐Lambertz G, Perrin M, Mangin JF, Cointepas Y, Duchesnay E, Le Bihan D, Hertz‐Pannier L ( 2008): Asynchrony of the early maturation of white matter bundles in healthy infants: Quantitative landmarks revealed noninvasively by diffusion tensor imaging. Hum Brain Mapp 29: 14–27. [DOI] [PMC free article] [PubMed] [Google Scholar]
- Eluvathingal TJ, Hasan KM, Kramer L, Fletcher JM, Ewing‐Cobbs L ( 2007): Quantitative diffusion tensor tractography of association and projection fibers in normally developing children and adolescents. Cereb Cortex 17: 2760–2768. [DOI] [PMC free article] [PubMed] [Google Scholar]
- Evans AC, Collins DL, Mills SR, Brown ED, Kelly RL, Peters TM ( 1994): 3D statistical neuroanatomical models from 305 MRI volumes. Proc IEEE Nucl Sci Symp Med Imaging Conf 3: 1813–1817. [Google Scholar]
- Filippi CG, Lin DD, Tsiouris AJ, Watts R, Packard AM, Heier LA, Ulug AM ( 2003): Diffusion‐tensor MR imaging in children with developmental delay: Preliminary findings. Radiology 229: 44–50. [DOI] [PubMed] [Google Scholar]
- Friederici AD ( 2009): Pathways to language: Fiber tracts in the human brain. Trends Cogn Sci 13: 175–181. [DOI] [PubMed] [Google Scholar]
- Goodlett C, Fletcher P, Gilmore J, Gerig G ( 2009): Group analysis of DTI fiber tract statistics with application to neurodevelopment. Neuroimage 45: 133–142. [DOI] [PMC free article] [PubMed] [Google Scholar]
- Guimond A, Meunier J, Thirion JP ( 2000): Average brain models: A convergence study. Computer Vision Image Understand 77: 192–210. [Google Scholar]
- Hagmann P, Thiran JP, Jonasson L, Vandergheynst P, Clarke S, Maeder P, Meuli R ( 2003): DTI mapping of human brain connectivity: Statistical fibre tracking and virtual dissection. Neuroimage 19: 545–554. [DOI] [PubMed] [Google Scholar]
- Hermoye L, Saint‐Martin C, Cosnard G, Lee SK, Kim J, Nassogne MC, Menten R, Clapuyt P, Donohue PK, Hua K, Wakana S, Jiang H, van Zijl PC, Mori S ( 2006): Pediatric diffusion tensor imaging: Normal database and observation of the white matter maturation in early childhood. Neuroimage 29: 493–504. [DOI] [PubMed] [Google Scholar]
- Huisman TA, Loenneker T, Barta G, Bellemann ME, Hennig J, Fischer JE, Il'yasov KA ( 2006): Quantitative diffusion tensor MR imaging of the brain: Field strength related variance of apparent diffusion coefficient (ADC) and fractional anisotropy (FA) scalars. Eur Radiol 16: 1651–1658. [DOI] [PubMed] [Google Scholar]
- Jenkinson M, Bannister P, Brady M, Smith S ( 2002): Improved optimization for the robust and accurate linear registration and motion correction of brain images. Neuroimage 17: 825–841. [DOI] [PubMed] [Google Scholar]
- Jones DK, Griffin LD, Alexander DC, Catani M, Horsfield MA, Howard R, Williams SC ( 2002): Spatial normalization and averaging of diffusion tensor MRI data sets. Neuroimage 17: 592–617. [PubMed] [Google Scholar]
- Jones DK, Chitnis X, Job D, Khong PL, Leung LT, Marenco S, Smith SM, Symms MR ( 2007): What happens when nine different groups analyze the same DDT‐MRI data set using voxel‐based methods? Proceedings of the ISMRM 15th Annual Meeting, Berlin.
- Kinoshita M, Hashimoto N, Goto T, Kagawa N, Kishima H, Izumoto S, Tanaka H, Fujita N, Yoshimine T ( 2008): Fractional anisotropy and tumor cell density of the tumor core show positive correlation in diffusion tensor magnetic resonance imaging of malignant brain tumors. Neuroimage 43: 29–35. [DOI] [PubMed] [Google Scholar]
- Landman BA,Farrell JA,Mori S,Van Zijl PC,Prince JL ( 2006): On the Coregistration of Diffusion Weighted Images. International Society for Magnetic Resonance in Medicine: Seattle, WA. [Google Scholar]
- Lawes I, Barrick T, Murugam V, Spierings N, Evans D, Song M, Clark C ( 2008): Atlas‐based segmentation of white matter tracts of the human brain using diffusion tensor tractography and comparison with classical dissection. Neuroimage 39: 62–79. [DOI] [PubMed] [Google Scholar]
- Lebel C, Walker L, Leemans A, Phillips L, Beaulieu C ( 2008): Microstructural maturation of the human brain from childhood to adulthood. Neuroimage 40: 1044–1055. [DOI] [PubMed] [Google Scholar]
- Leemans A, Jones DK ( 2009): The B‐matrix must be rotated when correcting for subject motion in DTI data. Magn Reson Med 61: 1336–1349. [DOI] [PubMed] [Google Scholar]
- Leemans A, Sijbers J, De Backer S, Vandervliet E, Parizel PM ( 2005): Affine coregistration of diffusion tensor magnetic resonance images using mutual information. Adv Concepts Intell Vision Syst 3708: 523–530. [Google Scholar]
- Leemans A, Jeurissen B, Sijbers J, Jones DK ( 2009): ExploreDTI: A graphical toolbox for processing analyzing, and visualizing diffusion MR data. Proceedings of the 17th Annual Meeting of International Society of Magnetic Resonance Medicine, Hawaii, USA. p 3537.
- Maes F, Collignon A, Vandermeulen D, Marchal G, Suetens P ( 1997): Multimodality image registration by maximization of mutual information. IEEE Trans Med Imaging 16: 187–198. [DOI] [PubMed] [Google Scholar]
- Makris N, Worth AJ, Sorensen AG, Papadimitriou GM, Wu O, Reese TG, Wedeen VJ, Davis TL, Stakes JW, Caviness VS, Kaplan E, Rosen BR, Pandya DN, Kennedy DN ( 1997): Morphometry of in vivo human white matter association pathways with diffusion‐weighted magnetic resonance imaging. Ann Neurol 42: 951–962. [DOI] [PubMed] [Google Scholar]
- Mori S, Oishi K, Jiang H, Jiang L, Li X, Akhter K, Hua K, Faria AV, Mahmood A, Woods R, Toga AW, Pike GB, Neto PR, Evans A, Zhang J, Huang H, Miller MI, van Zijl P, Mazziotta J ( 2008): Stereotaxic white matter atlas based on diffusion tensor imaging in an ICBM template. Neuroimage 40: 570–582. [DOI] [PMC free article] [PubMed] [Google Scholar]
- Mukherjee P, Miller JH, Shimony JS, Philip JV, Nehra D, Snyder AZ, Conturo TE, Neil JJ, McKinstry RC ( 2002): Diffusion‐tensor MR imaging of gray and white matter development during normal human brain maturation. AJNR Am J Neuroradiol 23: 1445–1456. [PMC free article] [PubMed] [Google Scholar]
- Mukherjee P, Chung SW, Berman JI, Hess CP, Henry RG ( 2008): Diffusion tensor MR imaging and fiber tractography: Technical considerations. AJNR Am J Neuroradiol 29: 843–852. [DOI] [PMC free article] [PubMed] [Google Scholar]
- Nagae LM, Hoon AH Jr, Stashinko E, Lin D, Zhang W, Levey E, Wakana S, Jiang H, Leite CC, Lucato LT, van Zijl PC, Johnston MV, Mori S ( 2007): Diffusion tensor imaging in children with periventricular leukomalacia: Variability of injuries to white matter tracts. AJNR Am J Neuroradiol 28: 1213–1222. [DOI] [PMC free article] [PubMed] [Google Scholar]
- Nitkunan A, Charlton RA, McIntyre DJ, Barrick TR, Howe FA, Markus HS ( 2008): Diffusion tensor imaging and MR spectroscopy in hypertension and presumed cerebral small vessel disease. Magn Reson Med 59: 528–534. [DOI] [PubMed] [Google Scholar]
- Park HJ, Kubicki M, Shenton ME, Guimond A, McCarley RW, Maier SE, Kikinis R, Jolesz FA, Westin CF ( 2003): Spatial normalization of diffusion tensor MRI using multiple channels. Neuroimage 20: 1995–2009. [DOI] [PMC free article] [PubMed] [Google Scholar]
- Park HJ, Westin CF, Kubicki M, Maier SE, Niznikiewicz M, Baer A, Frumin M, Kikinis R, Jolesz FA, McCarley RW, Shenton ME ( 2004): White matter hemisphere asymmetries in healthy subjects and in schizophrenia: A diffusion tensor MRI study. Neuroimage 23: 213–223. [DOI] [PMC free article] [PubMed] [Google Scholar]
- Paus T, Collins DL, Evans AC, Leonard G, Pike B, Zijdenbos A ( 2001): Maturation of white matter in the human brain: A review of magnetic resonance studies. Brain Res Bull 54: 255–266. [DOI] [PubMed] [Google Scholar]
- Sage CA, Peeters RR, Gorner A, Robberecht W, Sunaert S ( 2007): Quantitative diffusion tensor imaging in amyotrophic lateral sclerosis. Neuroimage 34: 486–499. [DOI] [PubMed] [Google Scholar]
- Sage CA, Van Hecke W, Peeters RR, Robberecht W, Sijbers J, Leemans A, Parizel PM, Marchal G, Sunaert S ( 2009): Quantitative diffusion tensor imaging in amyotrophic lateral sclerosis—Revisited. Hum Brain Mapp. Epub Apr 29. [DOI] [PMC free article] [PubMed] [Google Scholar]
- Schmithorst VJ, Wilke M, Dardzinski BJ, Holland SK ( 2002): Correlation of white matter diffusivity and anisotropy with age during childhood and adolescence: A cross‐sectional diffusion‐tensor MR imaging study. Radiology 222: 212–218. [DOI] [PMC free article] [PubMed] [Google Scholar]
- Shen S, Szameitat AJ, Sterr A ( 2005): A template effect study on voxel‐based morphometry in statistic parametric mapping. Conf Proc IEEE Eng Med Biol Soc 3: 3051–3054. [DOI] [PubMed] [Google Scholar]
- Shen, Szameitat AJ, Sterr A ( 2007): VBM lesion detection depends on the normalization template: A study using simulated atrophy. Magn Reson Imag 25: 1385–1396. [DOI] [PubMed] [Google Scholar]
- Snook L, Paulson LA, Roy D, Phillips L, Beaulieu C ( 2005): Diffusion tensor imaging of neurodevelopment in children and young adults. Neuroimage 26: 1164–1173. [DOI] [PubMed] [Google Scholar]
- Snook L, Plewes C, Beaulieu C ( 2007): Voxel based versus region of interest analysis in diffusion tensor imaging of neurodevelopment. Neuroimage 34: 243–252. [DOI] [PubMed] [Google Scholar]
- Stieltjes B, Kaufmann WE, van Zijl PC, Fredericksen K, Pearlson GD, Solaiyappan M, Mori S ( 2001): Diffusion tensor imaging and axonal tracking in the human brainstem. Neuroimage 14: 723–735. [DOI] [PubMed] [Google Scholar]
- Suzuki Y, Matsuzawa H, Kwee IL, Nakada T ( 2003): Absolute eigenvalue diffusion tensor analysis for human brain maturation. NMR Biomed 16: 257–260. [DOI] [PubMed] [Google Scholar]
- Van der Knaap MS, Valk J, Bakker CJ, Schooneveld M, Faber JA, Willemse J, Gooskens RH ( 1991): Myelination as an expression of the functional maturity of the brain. Dev Med Child Neurol 33: 849–857. [DOI] [PubMed] [Google Scholar]
- Van Hecke W, Leemans A, D'Agostino E, De Backer S, Vandervliet E, Parizel PM, Sijbers J ( 2007): Nonrigid coregistration of diffusion tensor images using a viscous fluid model and mutual information. IEEE Trans Med Imaging 26: 1598–1612. [DOI] [PubMed] [Google Scholar]
- Van Hecke W, Sijbers J, D'Agostino E, Maes F, De Backer S, Vandervliet E, Parizel PM, Leemans A ( 2008): On the construction of an inter‐subject diffusion tensor magnetic resonance atlas of the healthy human brain. Neuroimage 43: 69–80. [DOI] [PubMed] [Google Scholar]
- Vikingstad EM, George KP, Johnson AF, Cao Y ( 2000): Cortical language lateralization in right handed normal subjects using functional magnetic resonance imaging. J Neurol Sci 175: 17–27. [DOI] [PubMed] [Google Scholar]
- Wakana S, Jiang H, Nagae‐Poetscher LM, van Zijl PC, Mori S ( 2004): Fiber tract‐based atlas of human white matter anatomy. Radiology 230: 77–87. [DOI] [PubMed] [Google Scholar]
- Wakana S, Caprihan A, Panzenboeck MM, Fallon JH, Perry M, Gollub RL, Hua K, Zhang J, Jiang H, Dubey P, Blitz A, van Zijl P, Mori S ( 2007): Reproducibility of quantitative tractography methods applied to cerebral white matter. Neuroimage 36: 630–644. [DOI] [PMC free article] [PubMed] [Google Scholar]
- Witelson SF, Nowakowski RS ( 1991): Left out axons make men right: A hypothesis for the origin of handedness and functional asymmetry. Neuropsychologia 29: 327–333. [DOI] [PubMed] [Google Scholar]
- Yoon B, Shim YS, Lee KS, Shon YM, Yang DW ( 2008): Region‐specific changes of cerebral white matter during normal aging: A diffusion‐tensor analysis. Arch Gerontol Geriatr 47: 129–138. [DOI] [PubMed] [Google Scholar]
- Yushkevich P, Zhang H, Simon T, Gee J ( 2008): Structure‐specific statistical mapping of white matter tracts. Neuroimage 41: 448–461. [DOI] [PMC free article] [PubMed] [Google Scholar]
- Zhang H, Avants BB, Yushkevich PA, Woo JH, Wang S, McCluskey LF, Elman LB, Melhem ER, Gee JC ( 2007): High‐dimensional spatial normalization of diffusion tensor images improves the detection of white matter differences: An example study using amyotrophic lateral sclerosis. IEEE Trans Med Imaging 26: 1585–1597. [DOI] [PubMed] [Google Scholar]