

Abstract
Paired associative transcranial magnetic stimulation (PAS) has been shown to induce long‐term potentiation (LTP)‐like or long‐term depression (LTD)‐like change in excitability of human primary motor cortex (M1), as probed by motor evoked potential (MEP) amplitude. In contrast, little is known about PAS effects on volitional motor cortical activity. In 10 healthy subjects, movement related cortical potentials (MRCP) were recorded to index volitional motor cortical activity during preparation of simple thumb abduction (prime mover: abductor pollicis brevis, APB) or wrist extension movements (prime mover: extensor carpi radialis, ECR). PASLTP increased, PASLTD decreased, and PAScontrol did not change MEPAPB, while MEPECR, not targeted by PAS, remained unchanged in all PAS conditions. PASLTP decreased MRCP negativity during the late Bereitschaftspotential (−500 to 0 ms before movement onset), only in the APB task, and predominantly over central scalp electrodes contralateral to the thumb movements. This effect correlated negatively with the PASLTP induced increase in MEPAPB. PASLTD and PAScontrol did not affect MRCP amplitude. Findings indicate a specific interference of PAS with preparatory volitional motor cortical activity, suggestive of a net result caused by increased M1 excitability and disrupted effective connectivity between premotor areas and M1. Hum Brain Mapp, 2009. © 2009 Wiley‐Liss, Inc.
Keywords: movement related cortical potential, Bereitschaftspotential (BP), long‐term potentiation‐like plasticity, transcranial magnetic stimulation, paired associative stimulation, human motor cortex
INTRODUCTION
Transcranial magnetic stimulation (TMS) can induce long‐term changes in excitability of the human primary motor cortex (M1) [Fitzgerald et al., 2006; Ziemann et al., 2008]. Usually, these effects are demonstrated by single‐pulse or paired‐pulse TMS protocols. The most commonly used measure is motor evoked potential (MEP) amplitude, an estimate of excitability of the corticomotoneuronal projection [Hallett, 2007]. A particularly well investigated TMS protocol to induce MEP change is paired associative stimulation (PAS), in which pairs of electrical peripheral nerve stimulation and focal TMS of contralateral M1 are applied [Stefan et al., 2000; Ziemann et al., 2008]. Depending on the interval between the two stimuli, PAS induces a long‐term potentiation (LTP)‐like increase in MEP amplitude if the afferent pulse from peripheral nerve stimulation reaches M1 at the same time or a few milliseconds before TMS (PASLTP), or a long‐term depression (LTD)‐like decrease in MEP amplitude in the case of a reversed order of these events (PASLTD) [Müller et al., 2007; Wolters et al., 2003; Ziemann et al., 2004]. The changes in MEP amplitude originate at the motor cortical rather than a subcortical or spinal site [Di Lazzaro et al., 2009; Stefan et al., 2000], and the properties of this MEP change (cooperativity, duration >30 min, dependence on NMDA receptor activation) are akin to LTP and LTD as defined at the cellular level in slice or neuronal culture experiments [Cooke and Bliss, 2006; Ziemann et al., 2008]. Furthermore, the critical dependence of the direction of PAS effects on timing of electrical peripheral nerve stimulation relative to TMS is reminiscent of bidirectional spike timing‐dependent plasticity, where LTP occurs if action potentials consistently follow excitatory postsynaptic potentials, whereas LTD occurs with the reversed order of events [Caporale and Dan, 2008; Dan and Poo, 2004; Markram et al., 1997].
While the consequences of PAS and other TMS plasticity protocols on M1 excitability have been studied in detail, remarkably little is known about their effects on volitional motor cortical activity and motor behavior. The majority of studies showed, with few exceptions [Jäncke et al., 2004; Schlaghecken et al., 2003; Yoo et al., 2008], that TMS plasticity protocols do not affect simple motor behavior, such as the maximum tapping rate, in the hand contralateral to M1 stimulation [Agostino et al., 2007; Chen et al., 1997; Lee et al., 2003; Muellbacher et al., 2000; Rossi et al., 2000; Rounis et al., 2005; Sommer et al., 2002; Wassermann et al., 1996]. A likely more sensitive route of detecting subtle TMS effects despite the absence of overt changes in motor behavior is to assess volitional motor cortical activity by EEG measures such as movement related cortical potentials (MRCP) [Deecke, 2000; Deecke et al., 1969; Kornhuber and Deecke, 1965; Shibasaki and Hallett, 2006]. A 5 Hz rTMS protocol, which typically increases MEP amplitude, increased contingent negative variation amplitude during movement preparation in a warned choice reaction time task [Holler et al., 2006]. In contrast, a 1 Hz repetitive TMS (rTMS) protocol, which typically decreases MEP amplitude, decreased MRCP amplitude during preparation of thumb opposition movements [Rossi et al., 2000]. These data suggest that PAS or rTMS induced changes in MEP amplitude are coupled with changes into the same direction in volitional motor cortical activity.
However, rTMS of M1 does not only alter local excitability at the site of stimulation but also changes effective connectivity between M1 and other motor areas, in particular the dorsolateral premotor cortex (PMd) [Lee et al., 2003; Oliviero et al., 2003; Rounis et al., 2005; Strens et al., 2002], an area crucially important for preparation of voluntary movement [Chouinard and Paus, 2006; Hoshi and Tanji, 2007; Wise, 1985]. Effective connectivity analysis showed that, after 1 Hz rTMS, movement‐related coupling of PMd and supplementary motor area (SMA) with the stimulated M1 increased [Lee et al., 2003; Rounis et al., 2005], while, after 5 Hz rTMS, this coupling decreased [Rounis et al., 2005]. Therefore, effects of TMS plasticity protocols on preparatory volitional motor cortical activity may be more complex than suggested by the previous data.
Here we investigated the effects of PASLTP vs. PASLTD on MRCP amplitude. We focused particularly on the late Bereitschaftspotential (late BP), which is thought to be generated largely in the PMd and M1 contralateral to the movement, and to reflect executive preparatory motor activity closely linked to the subsequent motor action [Shibasaki and Hallett, 2006]. PAS‐induced LTP‐like and LTD‐like effects on MEP amplitude are topographically specific to the motor representation activated by TMS and median nerve stimulation [Stefan et al., 2000; Weise et al., 2006]. One aim of this study was to test if a similar representational specificity applies to the effects of PAS on MRCP amplitude. To this end, we tested MRCPs elicited by two different movement tasks, thumb abduction (targeted by TMS and median nerve stimulation) vs. wrist extension (not targeted by the median nerve stimulus). Given the so far very limited amount of knowledge of effects of TMS plasticity protocols on volitional motor cortical activity, this study is exploratory in nature. Nevertheless, very likely this work will improve our understanding of preparatory volitional motor activity in motor cortico‐cortical networks and its modification by brain stimulation. This knowledge will pertain to clinical applications for treatment of patients in whom this activity is disordered, such as in dystonia [Deuschl et al., 1995], Parkinson's disease [Touge et al., 1995], spino‐cerebellar ataxia [Lu et al., 2008], traumatic brain injury [Wiese et al., 2004], or cerebral stroke [Green et al., 1999].
METHODS
Subjects
Ten healthy subjects participated in the experiments (five men; mean age ± SD, 27.3 ± 6.7 years; range, 19–38 years). All subjects were right‐handed according to the Edinburgh Handedness Inventory [Oldfield, 1971]. All gave their written informed consent prior to the study. The experimental procedures were in accord with the Declaration of Helsinki and approved by the local Ethics Committee.
Experimental Design
Subjects were seated on a comfortable reclining chair with both arms relaxed. They participated in three different PAS protocols in separate sessions at least 1 week apart in a single‐blinded, randomized, controlled crossover design. MRCP recordings were obtained before and after the PAS intervention (see Fig. 1). Pre‐ and post‐PAS MRCP recordings consisted of six 5‐min recording blocks with a 1‐min break in between (see Fig. 1). In three of these blocks, subjects were requested to contract their right abductor pollicis brevis (APB) muscle by performing repeatedly brief thumb abduction movements, and in the other three blocks they were requested to contract their right extensor carpi radialis (ECR) muscle by performing brief wrist extension movements. The order of blocks was randomized with the constraint that each pair of blocks had to include one APB and one ECR task (labeled “A” and “B”, respectively, in Fig. 1). Movement rate was self‐paced (approximately one movement every 6 seconds). In addition, corticomotoneuronal excitability was measured by 20 single‐pulse MEPs recorded from the right APB and ECR immediately before and 10 min after the PAS intervention (see Fig. 1).
Figure 1.
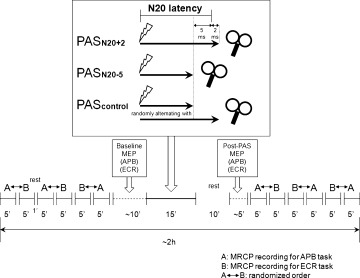
Experimental design and time line of MRCP and MEP measurements before and after one of three different paired associative stimulation protocols (PASLTP, PASLTD, PAScontrol). For details, see Methods section.
EEG and EMG Recordings
Fifty‐six Ag/AgCl scalp electrodes were used for EEG recording. One electrode was placed below the left outer canthus to record the electrooculogram (EOG). Impedance of all electrodes was kept below 5 kΩ. All electrodes were referenced to linked earlobe electrodes and raw signals were filtered with a bandpass of 0.05–70 Hz (NeuroScan® SynAmps, Neurosoft, Sterling, VA). Pairs of electrodes were taped bilaterally over the APB and ECR for surface electromyography (EMG) recording. The EMG signals were rectified and filtered at a bandpass of 30–200 Hz. EOG, EEG and EMG signals were sampled simultaneously, digitized at a rate of 2 kHz and stored for offline analysis. During the recordings, subjects were requested to fix a red spot on a screen 1.5 m in front of them and to perform the motor task with their right APB or ECR as described above.
TMS and PAS
TMS and PAS were applied while the EEG cap remained on the scalp and electrode leads disconnected from the EEG amplifiers. TMS was delivered through a focal figure‐of‐eight stimulating coil (diameter of each wing, 70 mm) connected to a Magstim 200 magnetic stimulator (Magstim Co., Carmarthenshire, Wales, UK) with a nearly monophasic current waveform. The coil was held tangential to the cap‐on‐scalp over the presumed hand area of the left M1 with the handle pointing backwards and ∼45° away from the midline. This way the induced current in the brain was directed from lateral‐posterior to medial‐anterior, an optimal current direction for exciting corticospinal neurons in M1 transsynaptically [Di Lazzaro et al., 2004]. The optimal coil position ('hot spot') was determined as the site where TMS at a slightly suprathreshold intensity produced consistently the largest MEPs in right APB. This site was marked on the scalp by a soft tip pen to assure a constant placement of the coil throughout the session. The intensity of TMS was adjusted to produce MEPs of on average 1 mV in peak‐to‐peak amplitude (MEP1mV) in the resting APB. Twenty trials were obtained with a randomly varying intertrial interval ranging from 7.5–12.5 s, to minimize anticipation of the next trial. MEPs were recorded simultaneously in the right APB and right ECR (bandpass filter 20–2 kHz; Counterpoint Mk2 Electromyograph; Dantec, Skovlunde, Denmark). The signals were then digitized at a rate of 5 kHz (CED Micro 1401; Cambridge Electronic Design, Cambridge, UK) and stored in a laboratory computer for offline‐analysis (Spike2 for Windows, Version 3.05, CED).
PAS was applied according to a protocol established previously by our group [Müller‐Dahlhaus et al., 2008b; Müller et al., 2007; Ziemann et al., 2004]. It consisted of 225 pairs of electrical stimulation of the right median nerve at the wrist followed by a single TMS pulse over the hot spot of the APB motor representation of the left M1. Pairs were delivered at a rate of 0.25 Hz (i.e. duration of PAS, 15 min). Electrical stimulation was applied through a bipolar electrode (cathode proximal), using constant current square wave pulses (duration, 1 ms) at an intensity of three times the perceptual threshold. The intensity of TMS was adjusted to produce MEP1mV when given without conditioning median nerve stimulation. Three PAS protocols were applied, which differed with respect to the interstimulus interval (ISI) between median nerve and M1 stimulation (see Fig. 1): In PASLTP, the ISI equaled the individual N20‐latency of the median nerve somatosensory‐evoked cortical potential plus 2 ms. In PASLTD, the ISI was set to the individual N20‐latency minus 5 ms. In PAScontrol, ISIs randomly alternated between PASLTP and PASLTD intervals. These PAS conditions were chosen because they induced LTP‐like (PASLTP), LTD‐like (PASLTD) or no change (PAScontrol) of the stimulated M1 representation of the APB in previous studies [Müller et al., 2007]. As motor attention may significantly affect the magnitude of these PAS effects [Stefan et al., 2004], the level of attention was controlled by using a light emitting diode (LED) attached to the right wrist which flashed randomly (0.2–1 Hz) during the PAS intervention with subjects requested to count the total number of flashes and report it as correctly as possible at the end of PAS.
Data Analysis and Statistics
Statistics were performed with StatView for Windows (Version 5.0.1, SAS Institute).
MEP amplitude
Averages of MEP amplitude (in mV) were calculated in each subject from the twenty trials of each recording block in APB and ECR, and before and after PAS. Effects of PAS on MEP amplitude were then analyzed by a three‐way repeated measures analysis of variance (rmANOVA) with the within subject factors of MUSCLE (APB, ECR), PAS PROTOCOL (PASLTP, PASLTD, PAScontrol) and TIME (pre‐PAS, post‐PAS). Conditional on a significant F value, post hoc comparisons were performed using paired‐sample t‐tests with Bonferroni correction for multiple comparisons.
Motor performance
Performance of volitional movements during the MRCP recordings was assessed by the movement rate, and quantitative analysis of the rectified EMG of the voluntary EMG burst (peak amplitude and onset‐to‐peak time). These three measures were analyzed by separate three‐way rmANOVAs with the within subject effects of MUSCLE (APB, ECR), PAS PROTOCOL (PASLTP, PASLTD and PAScontrol) and TIME (pre‐PAS, post‐PAS). Conditional on a significant F value, post hoc comparisons were conducted by paired‐samples t‐tests with Bonferroni correction for multiple comparisons.
MRCP amplitude
For MRCP analysis, epochs from 2000 ms before the onset of the voluntary EMG burst (−2000 ms) to 1000 ms after EMG onset (1000 ms) were segmented. The initial 250 ms (−2000 to −1750 ms) were assigned as baseline. Onset of the voluntary EMG burst (0 ms) was marked visually in each sweep. All EEG segments were inspected for artifacts according to a preset algorithm. Forty three percent of all EEG segments were contaminated by blink artifacts in the EOG, muscle artifacts or slow potential shifts >40 μV suggestive of movement or sweating artifacts, and were discarded from further analysis. In each subject, on average 79 artifact‐free EEG segments were rectified, aligned to EMG onset, and averaged according to motor task (APB vs. ECR), PAS condition (PASLTP vs. PASLTD vs. PAScontrol) and time (pre‐PAS vs. post‐PAS). Two subcomponents of the MRCP were analyzed: the early BP from −1500 ms to −500 ms, and the late BP from −500 ms to EMG onset [Shibasaki et al., 1980; Shibasaki and Hallett, 2006]. BP amplitude was quantified by taking the mean amplitude of the EEG signal (in μV) in these two epochs. Since the major MRCP activity localizes to the central scalp [Shibasaki et al., 1980], MRCP statistics focused to the 21 electrodes covering this area (C5A, C3A, C1A, CZA, C2A, C4A, C6A, C5, C3, C1, CZ, C2, C4, C6, TCP1, C3P, C1P, PZA, C2P, C4P, TCP2, nomenclature according to the International 10–20 EEG system). Four MRCP data sets (early BP and late BP, APB task and ECR task) were analyzed separately by three‐way rmANOVAs with the within‐subject factors of ELECTRODE POSITION (21 levels), PAS PROTOCOL (PASLTP, PASLTD and PAScontrol) and TIME (pre‐PAS, post‐PAS). Conditional on a significant F value, post hoc paired‐sample t‐tests were performed using Bonferroni correction for multiple comparisons.
Mapping of PAS effects on MRCP amplitude
For each PAS protocol and motor task, and separately for the early BP and the late BP a scalp current source density (CSD) map was calculated based on the voltage difference post‐PAS vs. pre‐PAS at each of the 56 electrode positions (Brain Vision Analyzer Version 2.0.0.3031, Brain Products GmbH, Germany).
Relation of PAS induced change in MEP and BP amplitude
Finally, possible correlations between PAS induced changes (post‐PAS minus pre‐PAS) in BP amplitude (dependent variable) vs. changes in MEP amplitude (independent variable) were explored by linear regression analyses at those electrode locations where PAS had a significant effect on BP amplitude.
Throughout the paper, data are presented as means ± SD if not stated otherwise. For all tests a p value of <0.05 was considered significant.
RESULTS
None of the subjects experienced any noticeable adverse effects during or after the study. All subjects were highly cooperative throughout the experimental procedures.
PAS Effects on MEP Amplitude
RmANOVA showed no significant main effects but significant interactions of MUSCLE and PAS PROTOCOL (F2,18 = 5.45, P = 0.014) and MUSCLE, PAS PROTOCOL and TIME (F2,18 = 7.80, P = 0.0036). These interactions were explained by the post hoc comparisons, which showed an increase in MEP amplitude in the APB after PASLTP (P < 0.01), a decrease after PASLTD (P < 0.05), and no change after PAScontrol, whereas MEP amplitudes in the ECR did not change by any of the PAS protocols (all P > 0.05) (see Fig. 2). There were no differences in MEP amplitude in the APB prior to PAS between PAS conditions (one‐way rmANOVA: F2,9 = 0.15, P = 0.86; PASLTP: 1.02 ± 0.18 mV; PASLTD: 1.06 ± 0.24 mV; PAScontrol: 1.05 ± 0.13 mV, light gray columns in Fig. 2) which could have accounted for these differential PAS effects on MEP amplitude of the APB. In addition, there were also no significant differences in the pre‐PAS measurements of MEP amplitude in the ECR between PAS conditions (one‐way rmANOVA: F2,9 = 2.45, P = 0.11; PASLTP: 0.74 ± 0.41 mV; PASLTD: 1.03 ± 0.59 mV; PAScontrol: 0.89 ± 0.39 mV, light gray columns in Fig. 2). This absence of pre‐PAS differences supports the validity of the observed lack of differential PAS effects on MEP amplitude in the ECR.
Figure 2.
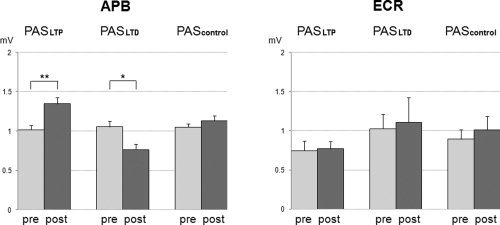
MEP amplitudes (in mV) pre‐PAS (light gray columns) vs. post‐PAS (dark gray columns, mean ± S.E.M) in the APB (left diagram) and ECR (right diagram). MEP amplitudes in the APB increased after PASLTP and decreased after PASLTD (*P < 0.05; **P < 0.01) while there were no changes in MEP amplitude in the ECR.
PAS Effects on Motor Performance
The mean movement rate across all conditions was 0.155 ± 0.03 s−1. Three‐way rmANOVA of movement rate revealed no significant main effect of MUSCLE (P = 0.054), PAS PROTOCOL (P = 0.18) or TIME (P = 0.22) or any of their interactions (all P > 0.40).
Three‐way rmANOVA of the amplitude of the voluntary EMG burst showed a main effect of TIME (F1,9 = 19.5, P = 0.0017) but no significant effects of MUSCLE (P = 0.48), or PAS PROTOCOL (P = 0.15), or any of their interactions (all P > 0.1). The effect of TIME was explained by a slight increase in EMG burst amplitude post‐PAS irrespective of MUSCLE or PAS PROTOCOL (pre‐PAS: 261.7 ± 119.3 μV; post‐PAS: 305.3 ± 145.7 μV) (see Fig. 3). RmANOVA of the onset‐to‐peak time of the EMG burst revealed a significant main effect of MUSCLE (F1,9 = 9.22, P = 0.014) but no other significant main effects (PAS PROTOCOL: P = 0.26; TIME: P = 0.69) or interactions thereof (all P > 0.05). The effect of MUSCLE was explained by longer onset‐to‐peak times in ECR compared to APB, irrespective of PAS PROTOCOL or TIME (APB: 91.4 ± 45.6 ms; ECR: 122.1 ± 42.7 ms) (see Fig. 3). The lack of specific PAS effects on movement rate, or amplitude or onset‐to‐peak time of the voluntary EMG burst is an important null finding, which largely excludes a significant role of variation in motor performance in the observed specific PAS effects on MRCP amplitude (see below).
Figure 3.
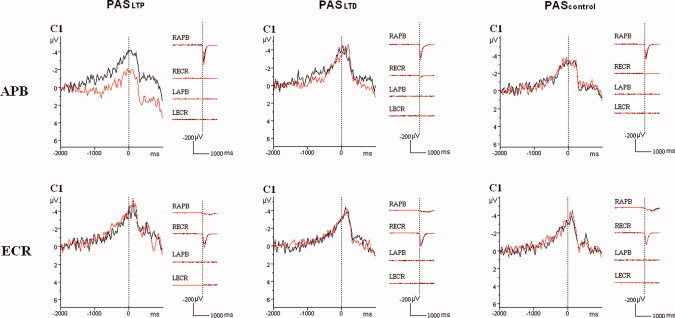
Superimposition of the grand average (n = 10 subjects) MRCP waveforms (in μV) recorded from the C1 electrode for the APB task (upper row) and the ECR task (lower row) before (black curves) and after (red curves) PASLTP (left column), or PASLTD (middle column), or PAScontrol (right column). Vertical dotted lines mark the onset of the voluntary EMG burst in the task muscle. Note the reduction of the MRCP negativity specifically after PASLTP in the APB task, but no MRCP change after PASLTD or PAScontrol or in the ECR task. In addition, the averaged rectified EMG from right and left APB (RAPB, LAPB) and ECR (RECR, LECR) are shown. Calibrations, 1000 ms and 200 μV.
PAS Effects on MRCP Amplitude
The three‐way rmANOVAs of all four MRCP data sets (early BP and late BP in ABP task, early BP and late BP in ECR task) all showed a significant main effect of ELECTRODE POSITION (all P < 0.01, Table I), reflecting the central and for the late BP predominantly left hemispheric MRCP distribution. In addition, the three‐way rmANOVA of the early BP in the APB task revealed a main effect of TIME (F1,9 = 23.7, P = 0.0009, Table I) but no other main effects or interactions thereof. The effect of TIME was explained by a decrease of the early BP negativity after PAS, irrespective of ELECTRODE POSITION or PAS PROTOCOL (pre‐PAS: −0.70 ± 0.78 μV; post‐PAS: −0.10 ± 0.78 μV). Furthermore, the three‐way rmANOVA of the late BP in the APB task demonstrated a significant interaction between PAS PROTOCOL and TIME (F2,18 = 5.53, P = 0.013, Table I) and between ELECTRODE POSITION, PAS PROTOCOL and TIME (F40,360 = 1.59, P = 0.016, Table I). Post hoc testing showed that a significant effect of TIME occurred only in the PASLTP protocol (F1,9 = 14.0, P = 0.0046) but not in the PASLTD and PAScontrol protocols (all P > 0.7). The effect of TIME in the PASLTP protocol was reflected by a decrease of the late BP negativity after PAS (pre‐PAS: −2.15 ± 1.0 μV, post‐PAS: −0.85 ± 1.15 μV). Further exploration of the triple interaction between ELECTRODE POSITION, PAS PROTOCOL and TIME by post hoc testing revealed that the late BP was significantly reduced only after PASLTP and only at the following electrodes: CZA (pre‐PAS: −2.27 ± 1.33 μV, post‐PAS: −0.72 ± 1.37 μV, P = 0.0022), C1 (pre‐PAS: −2.86 ± 1.01 μV, post‐PAS: −0.98 ± 1.01 μV, P = 0.0017), and C1P (pre‐PAS: −2.81 ± 1.26 μV, post‐PAS: −1.07 ± 1.65 μV, P = 0.0014). This PAS protocol and task specific effect is illustrated for the representative electrode C1 in Figure 3. Finally, rmANOVAs of early and late BP in the ECR task revealed no significant main effects (except on ELECTRODE POSITION) and no interactions thereof (Table I).
Table I.
Repeated measures analysis of variance (rmANOVA) of the PAS effects on the early BP and the late BP
| df | Early BP: APB | Late BP: APB | Early BP: ECR | Late BP: ECR | |||||
|---|---|---|---|---|---|---|---|---|---|
| F | P | F | P | F | P | F | P | ||
| Electrode positiona | 20,180 | 2.61 | 0.0004** | 6.25 | <0.001** | 2.43 | 0.001** | 7.01 | <0.001** |
| PAS protocolb | 2,18 | 1.62 | 0.22 | 1.19 | 0.33 | 0.45 | 0.64 | 0.50 | 0.62 |
| Timec | 1,9 | 23.74 | 0.0009** | 4.25 | 0.069 | 0.44 | 0.52 | 0.37 | 0.56 |
| Electrode position × PAS protocol | 40,360 | 1.39 | 0.07 | 1.07 | 0.37 | 0.75 | 0.86 | 0.85 | 0.73 |
| PAS protocol × time | 2,18 | 2.24 | 0.14 | 5.53 | 0.013* | 0.14 | 0.87 | 2.06 | 0.16 |
| Electrode position × time | 20,180 | 0.20 | 0.39 | 0.90 | 0.59 | 0.62 | 0.89 | 0.80 | 0.72 |
| Electrode position × PAS protocol × time | 40,360 | 1.01 | 0.46 | 1.59 | 0.016* | 0.91 | 0.63 | 0.99 | 0.50 |
P < 0.05
P < 0.01; df, degrees of freedom.
21 levels (C5A, C3A, C1A, CZA, C2A, C4A, C6A, C5, C3, C1, CZ, C2, C4, C6, TCP1, C3P, C1P, PZA, C2P, C4P, TCP2.
Three levels (PASLTP, PASLTD, and PAScontrol).
Two levels (pre‐PAS and post‐PAS).
Mapping of PAS Effects on MRCP Amplitude
Figure 4 shows the topographic distribution of the PAS induced scalp voltage change (current source density map of the voltage difference post‐PAS minus pre‐PAS). The only conspicuous change was a reduction in MRCP negativity post‐PASLTP, only in the APB task, and only for the late BP. This effect was localized over the central scalp area with slight predominance in the left hemisphere. The electrode locations with statistically significant voltages differences (CZA, C1, C1P) are indicated by blue dots.
Figure 4.
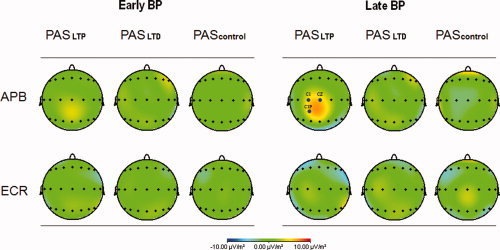
Current source density map of the PAS induced MRCP voltage change (difference of post‐PAS minus pre‐PAS). Left part of the diagram: early BP; right part of the diagram: late BP; upper row: APB task; lower row: ECR task. A PAS effect was noted only after PASLTP, only for the late BP (reduction of BP negativity) and only in the APB task. This effect was localized over the central scalp area, predominantly in the left hemisphere. Those electrodes with a statistically significant PASLTP effect are indicated by blue dots (CZA, C1, and C1P).
Relation Between PAS Effects on MEP and MRCP
Regression analysis between the PASLTP‐induced MEP change and significant PASLTP‐induced late BP change in the APB task revealed a significant negative correlation at the C1 electrode (r = −0.73, P = 0.016), but only nonsignificant trends for negative correlations at the two other electrode positions (CZA, C1P, Fig. 5). Individuals with strong MEP increase had weak change in the late BP at the C1 electrode, while those with weak MEP change or even slight MEP decrease had a strong decrease in late BP negativity (see Fig. 5).
Figure 5.
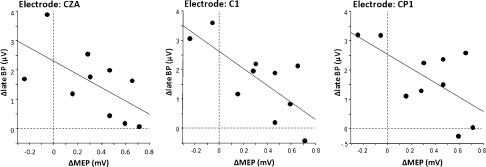
Linear regression analyses between PASLTP induced late BP change in the APB task (dependent variable, y‐axis, in μV) and PASLTP induced MEP change in the APB (independent variable, x‐axis, in mV) at those electrodes that showed a significant PASLTP effect on the late BP amplitude (cf. Fig. 4). A significant negative correlation was found at the C1 electrode (r = −0.73, P = 0.016).
DISCUSSION
PAS Effects on MEP Amplitude
The present findings are in agreement with previous reports [Kujirai et al., 2006; Kuo et al., 2007; Müller et al., 2007; Rosenkranz et al., 2007; Stefan et al., 2002; Stefan et al., 2000; Stefan et al., 2006; Weise et al., 2006; Wolters et al., 2003; Ziemann et al., 2004] by demonstrating spike‐timing dependent plasticity‐like bidirectional changes in MEP amplitude (see Fig. 2) depending on the interstimulus interval between median nerve stimulus and TMS pulse used in the PASLTP vs. PASLTD protocols. In addition, this study replicated two other important features of PAS‐induced plasticity: first, no change in MEP amplitude occurred if the interval between median nerve stimulus and TMS pulse alternated randomly between N20 + 2 and N20‐5 [Müller et al., 2007]. Therefore, this PAS protocol can be considered an ideal control condition because identical physical stimuli as in the PASLTP and PASLTD protocols are applied, and because it is impossible for the subjects to distinguish between these protocols. Second, the PASLTP and PASLTD effects were topographically specific [Stefan et al., 2000; Weise et al., 2006] because they occurred only in the APB, a hand muscle innervated by the stimulated median nerve, but not in the ECR, a more proximal muscle innervated by the nonstimulated radial nerve. This topographical specificity allowed exploring to which extent PAS effects on MRCP amplitude show similar specificity, i.e. manifestation in the APB task but not in the ECR task.
PAS Effects on Late BP Amplitude
The early BP surface negativity preceding a unimanual movement is thought to arise from increasing depolarization of the superficial layer of the apical dendrites of pyramidal neurons in a distributed cortical network consisting of the SMA and the PMd bilaterally, while the late BP close to movement onset can be largely explained by activity predominantly in the PMd and M1 contralateral to the movement [Ikeda et al., 1992; Shibasaki and Hallett, 2006; Toma et al., 2002]. While the exact relationship of the early and late BP to the intention and preparation to move is not fully understood, convergent evidence supports the view that the early BP is closely related to preparatory aspects of the forthcoming movement such as motor intention, selection or preparatory set whereas the late BP is particularly related to its executive aspects, such as amplitude, precision or complexity (for review, [Shibasaki and Hallett, 2006]).
The major novel finding of this study is a specific PAS effect on the late BP: PASLTP resulted in a decrease of the late BP negativity, only at central scalp electrodes (CZA) and electrodes over the sensorimotor cortex contralateral to the movement (C1, C1P), and only for the APB task (Table I, Figs. 3 and 4). A meaningful interpretation of this finding should take into account that PASLTP increases corticomotoneuronal excitability in M1, as reflected by increased MEP amplitude (see findings of this study, and for review [Ziemann et al., 2008]), and that a corticomotoneuronal excitability increasing 5 Hz rTMS protocol decreases movement‐related effective connectivity of PMd with M1 [Rounis et al., 2005]. In other words, output neurons in M1 became less responsive to volitional motor input from PMd. Volitional motor cortical activation engages the same or at least a significantly overlapping corticomotoneuronal system as TMS [Bawa and Lemon, 1993; Chen and Hallett, 1999; Di Lazzaro et al., 1998]. Therefore, it can be assumed that preparatory volitional motor cortical activity, if of similar magnitude before and after PASLTP, would result in an increase in the late BP negativity after PASLTP because an increased number of the more excitable M1 output neurons would become activated by the volitional motor command. In contrast, if PASLTP decreases movement‐related effective connectivity between PMd and M1 to a similar extent as 5 Hz rTMS, it can be assumed that PASLTP results in a decrease of the late BP negativity because less M1 output neurons will respond to the volitional motor command. The PASLTP induced change in the late BP negativity correlated inversely with the change in MEP amplitude, with a large positive Y‐intercept, indicating strong decrease of BP negativity with zero change in MEP amplitude (see Fig. 5). While it is clearly speculative at this stage how to best explain this relation, it should reflect a net result caused by a superimposition of the single effects on late BP amplitude. One possibility is that decreased movement‐related effective connectivity between PMd and M1 is the dominating effect (already in the absence of MEP amplitude change) and increased M1 excitability comes into play only with increasing MEP amplitude. Two previous studies support the PASLTP induced reduction in MRCP negativity: One recent near‐infrared spectroscopy demonstrated that PASLTP decreased the movement‐related oxygenated hemoglobin response in M1 (T. Murakami, personal communication), and a PET study showed that 5 Hz rTMS also decreased movement‐related regional cerebral blood flow in M1 [Rounis et al., 2005]. The present findings seem to differ from those of one other study, which reported an increase in contingent negative variation amplitude after 5 Hz rTMS [Holler et al., 2006]. However, these data cannot be directly compared to the present study as movements were made in a precued Go/No‐Go reaction time task rather than self‐paced. Finally, it is known that the BP is also generated in subcortical structures such as the basal ganglia [Rektor, 2003; Rektor et al., 2001] and the ventro‐lateral thalamus [Paradiso et al., 2004]. As TMS plasticity protocols applied to M1 can affect neuronal activity in these subcortical structures [Strafella et al., 2003], it is possible that the observed PASLTP‐induced decrease of the late BP negativity was mediated, at least in part, by actions at these subcortical sites.
Extracellular single cell recording experiments in monkeys showed that facilitatory input from premotor cortices to M1 is controlled by the level of inhibition in M1 and can be muted or strongly reduced by local administration of the GABAA receptor agonist muscimol into M1 [Shimazu et al., 2004]. Therefore, one could speculate that enhanced excitability of inhibitory interneurons in M1 after PASLTP has contributed to the reduction of the late BP. This, however, is unlikely because PASLTP does not alter short‐interval intracortical inhibition (SICI) [Rosenkranz and Rothwell, 2006; Stefan et al., 2002], an accepted measure of GABAAergic inhibition in M1 [Di Lazzaro et al., 2000; Ilic et al., 2002; Müller‐Dahlhaus et al., 2008a; Paulus et al., 2008; Ziemann et al., 1996].
The peak amplitude of the voluntary EMG burst was slightly larger post‐PAS, irrespective of PAS protocol and task (see Fig. 3). Likely, this reflects an unspecific practice effect. This does not impinge on the interpretation of the PASLTP induced decrease of the late BP negativity because stronger volitional motor output increases rather than decreases the BP negativity [Slobounov et al., 2004]. Therefore, if anything, the PASLTP induced decrease of the late BP has been underestimated.
It is not clear why PASLTD did not enhance but rather had no effect on the late BP. One possibility is that PASLTD increased movement‐related effective connectivity from SMA and PMd to M1, similar to previous observations after 1 Hz rTMS [Lee et al., 2003; Rounis et al., 2005], and that this increased responsiveness of M1 output neurons to volitional motor input largely matched the PASLTD induced decrease in the excitability of these neurons.
The present findings are partly different from those of the only other available study on interference of a TMS plasticity protocol (1 Hz rTMS) with MRCP amplitude [Rossi et al., 2000]. Those authors found a generalized, i.e. topographically nonspecific decrease of the BP after real rTMS but not after sham rTMS. It is difficult to compare those data with the present ones because BP analysis had not been segregated into early vs. late BP, and the effect of rTMS on MEP amplitude was not explored. However, there is close similarity of those findings with the present observation that the early BP in the APB task was depressed after PAS, irrespective of PAS protocol and electrode position (Table I). As this effect occurred across PAS protocols and was topographically nonspecific, it can be concluded that it was independent of PAS induced modulation of excitability in M1. This is in line with the generator sources of the early BP bilaterally in the pre‐SMA and the SMA proper that do not include M1 [Cui and Deecke, 1999; Shibasaki and Hallett, 2006]. It is therefore possible that the low‐frequency rTMS (0.25 Hz in all PAS conditions) per se was responsible for the early BP depression, while a simple order effect is unlikely because the BP remained unchanged after sham rTMS in the previous study [Rossi et al., 2000].
CONCLUSIONS
PAS of M1 can modulate volitional motor cortical processes in the late stages of movement preparation as indexed by changes in the late BP negativity. This effect is specific as it occurred only in the PASLTP protocol (not in the PASLTD and PAScontrol protocols), only in the APB task (not in the ECR task not targeted by PAS), only for the late BP (not the early BP) and only at electrode sites over or close to M1 contralateral to the hand movement. Sculpturing of MRCP by means of TMS plasticity protocols may be a potential future therapeutic application in neurological disorders with abnormal MRCPs, such as dystonia, Parkinson's disease, or stroke [Shibasaki and Hallett, 2006].
Acknowledgements
The authors thank Mr. Robert Liao for his assistance in manufacturing the LED device used in this study.
REFERENCES
- Agostino R, Iezzi E, Dinapoli L, Gilio F, Conte A, Mari F, Berardelli A ( 2007): Effects of 5 Hz subthreshold magnetic stimulation of primary motor cortex on fast finger movements in normal subjects. Exp Brain Res 180: 105–111. [DOI] [PubMed] [Google Scholar]
- Bawa P, Lemon RN ( 1993): Recruitment of motor units in response to transcranial magnetic stimulation in man. J Physiol 471: 445–464. [DOI] [PMC free article] [PubMed] [Google Scholar]
- Caporale N, Dan Y ( 2008): Spike timing‐dependent plasticity: A Hebbian learning rule. Annu Rev Neurosci 31: 25–46. [DOI] [PubMed] [Google Scholar]
- Chen R, Classen J, Gerloff C, Celnik P, Wassermann EM, Hallett M, Cohen LG ( 1997): Depression of motor cortex excitability by low‐frequency transcranial magnetic stimulation. Neurology 48: 1398–1403. [DOI] [PubMed] [Google Scholar]
- Chen R, Hallett M ( 1999): The time course of changes in motor cortex excitability associated with voluntary movement. Can J Neurol Sci 26: 163–169. [DOI] [PubMed] [Google Scholar]
- Chouinard PA, Paus T ( 2006): The primary motor and premotor areas of the human cerebral cortex. Neuroscientist 12: 143–152. [DOI] [PubMed] [Google Scholar]
- Cooke SF, Bliss TV ( 2006): Plasticity in the human central nervous system. Brain 129 (Part 7): 1659–1673. [DOI] [PubMed] [Google Scholar]
- Cui RQ, Deecke L ( 1999): High resolution DC‐EEG analysis of the Bereitschaftspotential and post movement onset potentials accompanying uni‐ or bilateral voluntary finger movements. Brain Topogr 11: 233–249. [DOI] [PubMed] [Google Scholar]
- Dan Y, Poo MM ( 2004): Spike timing‐dependent plasticity of neural circuits. Neuron 44: 23–30. [DOI] [PubMed] [Google Scholar]
- Deecke L ( 2000): The Bereitschaftspotential as an electrophysiological tool for studying the cortical organization of human voluntary action. Suppl Clin Neurophysiol 53: 199–206. [DOI] [PubMed] [Google Scholar]
- Deecke L, Scheid P, Kornhuber HH ( 1969): Distribution of readiness potential, pre‐motion positivity, and motor potential of the human cerebral cortex preceding voluntary finger movements. Exp Brain Res 7: 158–168. [DOI] [PubMed] [Google Scholar]
- Deuschl G, Toro C, Matsumoto J, Hallett M ( 1995): Movement‐related cortical potentials in writer's cramp. Ann Neurol 38: 862–868. [DOI] [PubMed] [Google Scholar]
- Di Lazzaro V, Dileone M, Pilato F, Profice P, Oliviero A, Mazzone P, Insola A, Capone F, Ranieri F, Tonali PA ( 2009): Associative motor cortex plasticity: direct evidence in humans. Cereb Cortex, doi: 10.1093/cercor/bhn255. [DOI] [PubMed] [Google Scholar]
- Di Lazzaro V, Oliviero A, Meglio M, Cioni B, Tamburrini G, Tonali P, Rothwell JC ( 2000): Direct demonstration of the effect of lorazepam on the excitability of the human motor cortex. Clin Neurophysiol 111: 794–799. [DOI] [PubMed] [Google Scholar]
- Di Lazzaro V, Oliviero A, Pilato F, Saturno E, Dileone M, Mazzone P, Insola A, Tonali PA, Rothwell JC ( 2004): The physiological basis of transcranial motor cortex stimulation in conscious humans. Clin Neurophysiol 115: 255–266. [DOI] [PubMed] [Google Scholar]
- Di Lazzaro V, Restuccia D, Oliviero A, Profice P, Ferrara L, Insola A, Mazzone P, Tonali P, Rothwell JC ( 1998): Effects of voluntary contraction on descending volleys evoked by transcranial magnetic stimulation in conscious humans. J Physiol 508: 625–633. [DOI] [PMC free article] [PubMed] [Google Scholar]
- Fitzgerald PB, Fountain S, Daskalakis ZJ ( 2006): A comprehensive review of the effects of rTMS on motor cortical excitability and inhibition. Clin Neurophysiol 117: 2584–2596. [DOI] [PubMed] [Google Scholar]
- Green JB, Bialy Y, Sora E, Ricamato A ( 1999): High‐resolution EEG in poststroke hemiparesis can identify ipsilateral generators during motor tasks. Stroke 30: 2659–2665. [DOI] [PubMed] [Google Scholar]
- Hallett M ( 2007): Transcranial magnetic stimulation: A primer. Neuron 55: 187–199. [DOI] [PubMed] [Google Scholar]
- Holler I, Siebner HR, Cunnington R, Gerschlager W ( 2006): 5 Hz repetitive TMS increases anticipatory motor activity in the human cortex. Neurosci Lett 392: 221–225. [DOI] [PubMed] [Google Scholar]
- Hoshi E, Tanji J ( 2007): Distinctions between dorsal and ventral premotor areas: Anatomical connectivity and functional properties. Curr Opin Neurobiol 17: 234–242. [DOI] [PubMed] [Google Scholar]
- Ikeda A, Luders HO, Burgess RC, Shibasaki H. ( 1992): Movement‐related potentials recorded from supplementary motor area and primary motor area. Role of supplementary motor area in voluntary movements. Brain 115 (Part 4): 1017–1043. [DOI] [PubMed] [Google Scholar]
- Ilic TV, Meintzschel F, Cleff U, Ruge D, Kessler KR, Ziemann U ( 2002): Short‐interval paired‐pulse inhibition and facilitation of human motor cortex: The dimension of stimulus intensity. J Physiol 545: 153–167. [DOI] [PMC free article] [PubMed] [Google Scholar]
- Jäncke L, Steinmetz H, Benilow S, Ziemann U ( 2004): Slowing fastest finger movements of the dominant hand with low‐frequency rTMS of the hand area of the primary motor cortex. Exp Brain Res 155: 196–203. [DOI] [PubMed] [Google Scholar]
- Kornhuber HH, Deecke L ( 1965): Hirnpotentialänderungen bei Willkür‐ bewegungen und passiven Bewegungen des Menschen: Bereitschafts‐ potential und reafferente Potentiale. Pflügers Arch Ges Physiol 284: 1–17. [PubMed] [Google Scholar]
- Kujirai K, Kujirai T, Sinkjaer T, Rothwell JC ( 2006): Associative plasticity in human motor cortex during voluntary muscle contraction. J Neurophysiol 96: 1337–1346. [DOI] [PubMed] [Google Scholar]
- Kuo M‐F, Grosch J, Fregni F, Paulus W, Nitsche MA ( 2007): Focusing effect of acetylcholine on neuroplasticity in the human motor cortex. J Neurosci 27: 14442–14447. [DOI] [PMC free article] [PubMed] [Google Scholar]
- Lee L, Siebner HR, Rowe JB, Rizzo V, Rothwell JC, Frackowiak RS, Friston KJ ( 2003): Acute remapping within the motor system induced by low‐frequency repetitive transcranial magnetic stimulation. J Neurosci 23: 5308–5318. [DOI] [PMC free article] [PubMed] [Google Scholar]
- Lu MK, Shih HT, Huang KJ, Ziemann U, Tsai CH, Chang FC, Chen YC, Lin YT, Huang WS, Lee CC, et al. ( 2008): Movement‐related cortical potentials in patients with Machado‐Joseph disease. Clin Neurophysiol 119: 1010–1019. [DOI] [PubMed] [Google Scholar]
- Markram H, Lübke J, Frotscher M, Sakmann B ( 1997): Regulation of synaptic efficacy by coincidence of postsynaptic APs and EPSPs. Science 275: 213–215. [DOI] [PubMed] [Google Scholar]
- Muellbacher W, Ziemann U, Boroojerdi B, Hallett M ( 2000): Effects of low‐frequency transcranial magnetic stimulation on motor excitability and basic motor behavior. Clin Neurophysiol 111: 1002–1007. [DOI] [PubMed] [Google Scholar]
- Müller‐Dahlhaus JF, Liu Y, Ziemann U ( 2008a): Inhibitory circuits and the nature of their interactions in the human motor cortex a pharmacological TMS study. J Physiol 586: 495–514. [DOI] [PMC free article] [PubMed] [Google Scholar]
- Müller‐Dahlhaus JF, Orekhov Y, Liu Y, Ziemann U ( 2008b): Interindividual variability and age‐dependency of motor cortical plasticity induced by paired associative stimulation. Exp Brain Res 187: 467–475. [DOI] [PubMed] [Google Scholar]
- Müller JFM, Orekhov Y, Liu Y, Ziemann U ( 2007): Homeostatic plasticity in human motor cortex demonstrated by two consecutive sessions of paired associative stimulation. Eur J Neurosci 25: 3461–3468. [DOI] [PubMed] [Google Scholar]
- Oldfield RC ( 1971): The assessment and analysis of handedness: The Edinburgh inventory. Neuropsychologia 9: 97–113. [DOI] [PubMed] [Google Scholar]
- Oliviero A, Strens LH, Di Lazzaro V, Tonali PA, Brown P ( 2003): Persistent effects of high frequency repetitive TMS on the coupling between motor areas in the human. Exp Brain Res 149: 107–113. [DOI] [PubMed] [Google Scholar]
- Paradiso G, Cunic D, Saint‐Cyr JA, Hoque T, Lozano AM, Lang AE, Chen R. ( 2004): Involvement of human thalamus in the preparation of self‐paced movement. Brain 127 (Part 12): 2717–2731. [DOI] [PubMed] [Google Scholar]
- Paulus W, Classen J, Cohen LG, Large CH, Di Lazzaro V, Nitsche M, Pascual‐Leone A, Rosenow F, Rothwell JC, Ziemann U ( 2008): State of the art: Pharmacologic effects on cortical excitability measures tested by transcranial magnetic stimulation. Brain Stimulation 1: 151–163. [DOI] [PubMed] [Google Scholar]
- Rektor I. 2003. Intracerebral recordings of the Bereitschaftspotential and related potentials in cortical and subcortical structures in human subjects In: Jahanshahi M, Hallett M, editors. The Bereitschafts‐ Potential. Movement‐Related Cortical Potentials. New York: Kluver Academic/Plenum Publishers; pp 61–77. [Google Scholar]
- Rektor I, Bares M, Kubova D ( 2001): Movement‐related potentials in the basal ganglia: A SEEG readiness potential study. Clin Neurophysiol 112: 2146–2153. [DOI] [PubMed] [Google Scholar]
- Rosenkranz K, Kacar A, Rothwell JC ( 2007): Differential modulation of motor cortical plasticity and excitability in early and late phases of human motor learning. J Neurosci 27: 12058–12066. [DOI] [PMC free article] [PubMed] [Google Scholar]
- Rosenkranz K, Rothwell JC ( 2006): Differences between the effects of three plasticity inducing protocols on the organization of the human motor cortex. Eur J Neurosci 23: 822–829. [DOI] [PubMed] [Google Scholar]
- Rossi S, Pasqualetti P, Rossini PM, Feige B, Ulivelli M, Glocker FX, Battistini N, Lucking CH, Kristeva‐Feige R ( 2000): Effects of repetitive transcranial magnetic stimulation on movement‐ related cortical activity in humans. Cereb Cortex 10: 802–808. [DOI] [PubMed] [Google Scholar]
- Rounis E, Lee L, Siebner HR, Rowe JB, Friston KJ, Rothwell JC, Frackowiak RS ( 2005): Frequency specific changes in regional cerebral blood flow and motor system connectivity following rTMS to the primary motor cortex. Neuroimage 26: 164–176. [DOI] [PubMed] [Google Scholar]
- Schlaghecken F, Munchau A, Bloem BR, Rothwell J, Eimer M ( 2003): Slow frequency repetitive transcranial magnetic stimulation affects reaction times, but not priming effects, in a masked prime task. Clin Neurophysiol 114: 1272–1277. [DOI] [PubMed] [Google Scholar]
- Shibasaki H, Barrett G, Halliday E, Halliday AM ( 1980): Components of the movement‐related cortical potential and their scalp topography. Electroencephalogr Clin Neurophysiol 49: 213–226. [DOI] [PubMed] [Google Scholar]
- Shibasaki H, Hallett M ( 2006): What is the Bereitschaftspotential? Clin Neurophysiol 117: 2341–2356. [DOI] [PubMed] [Google Scholar]
- Shimazu H, Maier MA, Cerri G, Kirkwood PA, Lemon RN ( 2004): Macaque ventral premotor cortex exerts powerful facilitation of motor cortex outputs to upper limb motoneurons. J Neurosci 24: 1200–1211. [DOI] [PMC free article] [PubMed] [Google Scholar]
- Slobounov S, Hallett M, Newell KM ( 2004): Perceived effort in force production as reflected in motor‐related cortical potentials. Clin Neurophysiol 115: 2391–2402. [DOI] [PubMed] [Google Scholar]
- Sommer M, Kamm T, Tergau F, Ulm G, Paulus W ( 2002): Repetitive paired‐pulse transcranial magnetic stimulation affects corticospinal excitability and finger tapping in Parkinson's disease. Clin Neurophysiol 113: 944–950. [DOI] [PubMed] [Google Scholar]
- Stefan K, Kunesch E, Benecke R, Cohen LG, Classen J. ( 2002): Mechanisms of enhancement of human motor cortex excitability induced by interventional paired associative stimulation. J Physiol 543 (Part 2): 699–708. [DOI] [PMC free article] [PubMed] [Google Scholar]
- Stefan K, Kunesch E, Cohen LG, Benecke R, Classen J. ( 2000): Induction of plasticity in the human motor cortex by paired associative stimulation. Brain 123 (Part 3): 572–584. [DOI] [PubMed] [Google Scholar]
- Stefan K, Wycislo M, Classen J ( 2004): Modulation of associative human motor cortical plasticity by attention. J Neurophysiol 92: 66–72. [DOI] [PubMed] [Google Scholar]
- Stefan K, Wycislo M, Gentner R, Schramm A, Naumann M, Reiners K, Classen J ( 2006): Temporary occlusion of associative motor cortical plasticity by prior dynamic motor training. Cereb Cortex 16: 376–385. [DOI] [PubMed] [Google Scholar]
- Strafella AP, Paus T, Fraraccio M, Dagher A ( 2003): Striatal dopamine release induced by repetitive transcranial magnetic stimulation of the human motor cortex. Brain 126 (Part 12): 2609–2615. [DOI] [PubMed] [Google Scholar]
- Strens LH, Oliviero A, Bloem BR, Gerschlager W, Rothwell JC, Brown P ( 2002): The effects of subthreshold 1 Hz repetitive TMS on cortico‐cortical and interhemispheric coherence. Clin Neurophysiol 113: 1279–1285. [DOI] [PubMed] [Google Scholar]
- Toma K, Matsuoka T, Immisch I, Mima T, Waldvogel D, Koshy B, Hanakawa T, Shill H, Hallett M ( 2002): Generators of movement‐related cortical potentials: fMRI‐constrained EEG dipole source analysis. Neuroimage 17: 161–173. [DOI] [PubMed] [Google Scholar]
- Touge T, Werhahn KJ, Rothwell JC, Marsden CD ( 1995): Movement‐related cortical potentials preceding repetitive and random‐ choice hand movements in Parkinson's disease. Ann Neurol 37: 791–799. [DOI] [PubMed] [Google Scholar]
- Wassermann EM, Grafman J, Berry C, Hollnagel C, Wild K, Clark K, Hallett M ( 1996): Use and safety of a new repetitive transcranial magnetic stimulator. Electroencephalogr Clin Neurophysiol 101: 412–417. [PubMed] [Google Scholar]
- Weise D, Schramm A, Stefan K, Wolters A, Reiners K, Naumann M, Classen J ( 2006): The two sides of associative plasticity in writer's cramp. Brain 129: 2709–2721. [DOI] [PubMed] [Google Scholar]
- Wiese H, Stude P, Nebel K, Osenberg D, Volzke V, Ischebeck W, Stolke D, Diener HC, Keidel M ( 2004): Impaired movement‐related potentials in acute frontal traumatic brain injury. Clin Neurophysiol 115: 289–298. [DOI] [PubMed] [Google Scholar]
- Wise SP ( 1985): The primate premotor cortex: Past, present, and preparatory. Annu Rev Neurosci 8: 1–19. [DOI] [PubMed] [Google Scholar]
- Wolters A, Sandbrink F, Schlottmann A, Kunesch E, Stefan K, Cohen LG, Benecke R, Classen J ( 2003): A temporally asymmetric Hebbian rule governing plasticity in the human motor cortex. J Neurophysiol 89: 2339–2345. [DOI] [PubMed] [Google Scholar]
- Yoo WK, You SH, Ko MH, Tae Kim S, Park CH, Park JW, Hoon Ohn S, Hallett M, Kim YH ( 2008): High frequency rTMS modulation of the sensorimotor networks: Behavioral changes and fMRI correlates. Neuroimage 39: 1886–1895. [DOI] [PubMed] [Google Scholar]
- Ziemann U, Ilic TV, Pauli C, Meintzschel F, Ruge D ( 2004): Learning modifies subsequent induction of LTP‐like and LTD‐like plasticity in human motor cortex. J Neurosci 24: 1666–1672. [DOI] [PMC free article] [PubMed] [Google Scholar]
- Ziemann U, Lönnecker S, Steinhoff BJ, Paulus W ( 1996): The effect of lorazepam on the motor cortical excitability in man. Exp Brain Res 109: 127–135. [DOI] [PubMed] [Google Scholar]
- Ziemann U, Paulus W, Nitsche MA, Pascual‐Leone A, Byblow WD, Berardelli A, Siebner HR, Classen J, Cohen LG, Rothwell JC ( 2008): Consensus: Motor cortex plasticity protocols. Brain Stimul 1: 164–182. [DOI] [PubMed] [Google Scholar]