

Abstract
Creativity has been proposed to be either the result of solely right hemisphere processes or of interhemispheric interactions. Little information is available, however, concerning the neuronal foundations of creativity. In this study, we introduced a new artistic task, designing a new tool (a pen), which let us quantitatively evaluate creativity by three indices of originality. These scores were analyzed in combination with brain activities measured by functional magnetic resonance imaging (fMRI). The results were compared between subjects who had been formally trained in design (experts) and novice subjects. In the experts, creativity was quantitatively correlated with the degree of dominance of the right prefrontal cortex over that of the left, but not with that of the right or left prefrontal cortex alone. In contrast, in novice subjects, only a negative correlation with creativity was observed in the bilateral inferior parietal cortex. We introduced structure equation modeling to analyze the interactions among these four brain areas and originality indices. The results predicted that training exerts a direct effect on the left parietal cortex. Additionally, as a result of the indirect effects, the activity of the right prefrontal cortex was facilitated, and the left prefrontal and right parietal cortices were suppressed. Our results supported the hypothesis that training increases creativity via reorganized intercortical interactions. Human Brain Mapp 2009. © 2008 Wiley‐Liss, Inc.
Keywords: fMRI, structural equation modeling (SEM), creativity, hemispheric laterality
INTRODUCTION
Creativity is generally considered to be the ability of an individual to generate original, novel ideas by breaking established mental habits of thinking. On the basis of social, psychological, and clinical studies, various hypotheses for the roots of creativity have been proposed [Amabile, 1983; Atchley, et al., 1999; Bogen and Bogen, 1969; Chavez‐Eakle et al., 2007; Csikszentmihalyi, 1996; Dietrich, 2004; Eysenck, 1993; Gruber, 1981; Guilford, 1950; Hoppe, 1988; Martindale, 1999; Mednick, 1962; Molle et al., 1996; Petsche, 1996; Sternberg and Lubart, 1999; Torrance, 1982; Ward et al., 1999; Zeki, 2001]; however, little is known about the brain mechanisms that underlie creative thinking.
Creativity can be categorized into types, such as psychological creativity and historic creativity [Boden, 1994], or into various phases, such as the association of previously unrelated elements, i.e., integration [Chavez‐Eakle et al., 2007], incubation [Boden, 1994; Torrance and Safter, 1999], sudden insight, and conscious combinations of elements. Because of the multiple aspects of creativity, studies examining the psychological or neural mechanism of creativity must focus on specific characteristics or specific parts of the creative process. To evaluate the creativity objectively, various psychological tests for measuring creativity have been devised, including the Torrance Tests of Creative Thinking (TTCT) and Guilford's evaluation of divergent thinking [Guilford, 1968]. Modified forms of these tests have also been regularly used, and many of these tasks include verbal components. For example, the divergent thinking test requires subjects to think of as many different uses of a tool shown to them, and they usually think of such tasks in words. Therefore, using similar tests includes unavoidably verbal components in creativity.
The results of several previous psychological studies have shown hemispheric dominance in creativity such that creativity is solely the result of right hemisphere processes [Torrance, 1982] or that interhemispheric interactions are crucial for creativity [Atchley et al., 1999; Carlsson et al., 2000; Hoppe, 1988; Katz, 1986; Martindale et al., 1984; Molle et al., 1996; Petsche, 1996]. However, the psychological assessment of hemispheric dominance is indirect, and the results have been sometimes contradictory. One reason for this may be ascribed to the differences in the creative tasks that were used in each study. In addition, psychological studies are limited in that they cannot assess the dominant cortical hemisphere directly. Neurophysiological measurements are better equipped for the direct assessment of the dominant hemisphere. In an electroencephalogram (EEG) study, Martindale et al. [ 1984, 1990] observed greater activity in the right hemisphere than in the left hemisphere in the parietotemporal region while performing a creative task; however, Fink and Neubauer [ 2006] did not report a left‐right difference in alpha synchronization but observed an anteroposterior difference. Two groups recently used positron emission tomography (PET) to study the brain activity associated with verbal creativity, but obtained different results. Bekhtereva et al. [ 2000, 2004] found that the left hemisphere was responsible for linguistic creativity, while Carlsson et al. [ 2000] reported that both hemispheres were involved in highly creative subjects but that the left hemisphere was dominant in low‐creative subjects. In addition, using both fMRI and EEG, Jung‐Beeman et al. [ 2004] found high activity in the right hemisphere anterior superior temporal gyrus when subjects solved a verbal task based on insight. The disagreement among the three groups may be due to the different verbal creative tasks that each group used. Bekhtereva et al. [ 2000, 2004] used more elaborate task procedures, such as composing a story using a list of words, while Carlsson et al. [ 2000] used divergent thinking and Jung‐Beeman et al. [ 2004] applied “problem solving” presented with words. Another reason for the different results might be that creative tasks involving a verbal component activate more complicated networks and information processing than other types of creativity, such as artistic creativity. For artistic creativity, both EEG studies and patient studies have consistently identified a specific role of the right frontal area. Bhattacharya and Petsche [ 2002, 2005] showed that in artists, even at the stage of visual perception or visual memory, without a creative task, the EEG of the right hemisphere showed greater synchrony than the left hemisphere. Conversely, they found that hemispheric asymmetry was less significant in nonartists, indicating that the right hemisphere has a specific function in professional artists. Clinical studies have also reported that artistic creativity has emerged in patients after damage to the left prefrontal area [Finkelstein et al., 1991; Mendez, 2004; Miller et al., 1998, 2000] and suggested that the decrease in activity of the left prefrontal area led to the emergence of the patients' artistic creativity.
For these reasons, we tried to measure artistic creativity separately from verbal creativity. To do so, we created a new task by designing a new tool (a pen). Generally, when professional designers start to conceptualize a new idea, they begin searching for clues for their new designs through visual information from nature or from existing designs and use pictorial representations, such as sketches [Purcell and Gero, 1998]. As this process requires no verbal component, we used this feature of conceptualization of designs to visualize the brain network involved in “artistic creativity.” To measure brain activity, we used fMRI and examined blood oxygenated level‐dependent (BOLD) signal changes when subjects tried to conceptualize a new pen design.
Professionally trained individuals in a particular field show clear differences in brain activity compared to amateur subjects [Hanakawa et al., 2003; Ouchi et al., 2005]. Therefore, we compared design‐major and non‐design‐major students to elucidate the change in neural networks implemented by design training. For this analysis, we used structure equation modeling (SEM), which has been applied to small sample data (less than 100) for neural network analysis, such as connectivity analysis of the mouse brain [Bruchey et al., 2007; McIntosh and Gonzalez‐Lima, 1994a, 1995; Puga et al., 2007] or PET/fMRI studies of the human brain [Buchel and Friston, 1997; Darling et al., 2007; Koechlin et al., 2003b; McIntosh and Gonzalez‐Lima, 1994b; Nyberg et al., 1996; Stein et al., 2007; Zhuang et al., 2005]. We found that professional training reorganized brain activation patterns, which was correlated with increased creativity.
METHODS
Subjects
All subjects were undergraduate or graduate students at the University of Tsukuba. The intelligence levels of subjects were similar, as they had similar scores on the “Center Entrance Examination” administered by the Japanese government. The design‐major (designated as “expert”) subjects were undergraduate and graduate students in the Department of Art and Design who had received at least 2 years of artistic training (20–28 years old; average training period after admission to the university was 5.9 ± 3.9 years; 8 men and 12 women). The novice subjects (8 men and 12 women) were students of disciplines other than art (4 information science, 4 engineering, 3 medicine, 2 psychology, 2 biology, 2 sociology, 1 physics, 1 philosophy, and 1 economics); these subjects had the same age distribution as the experts, but had not received any artistic training. The study protocol was approved by the ethics committees of the National Institute of Advanced Industrial Science and Technology and the University of Tsukuba, and was performed in accordance with the ethical standards laid down in the 1964 Declaration of Helsinki. All subjects provided written informed consent prior to participating in the experiments.
Experimental Tasks
We chose the task of “designing new pens” for evaluating creativity because the intended purpose of a pen is clear and it is easy to design, even for artistic novices. The visual stimuli were black‐and‐white photographs [4° (width) × 3.4° (height)] of pens projected on a screen, and subjects viewed the images through a reflecting mirror. Fifteen pictures (one pen per picture) were presented at the center of a subject's visual field for 4 seconds in a random order followed by a fixation point (1° × 1° cross) for 12 seconds (see Fig. 1). In the designing task, each subject was instructed to try to think about new designs for pens as they looked at photographs of each pen while they were inside the MRI scanner and to refrain from designing during fixation point presentation. They were also instructed to draw the designs after the MRI session with reference to the original pen with which they were inspired. As a control task, a simple viewing task was not appropriate because expert subjects had a tendency to think of new designs whenever they saw visual objects. Instead, we used a “counting task” in which subjects were instructed to count the total number of pens during one session, which involved the presentation of 15 pictures, and they were asked to state the number after the session. The control task always preceded the designing task, and the instructions about the design task were given after finishing the counting task to avoid designing activity during the control. We did not mix the counting and designing tasks in one session because it was impossible to switch between the two tasks.
Figure 1.
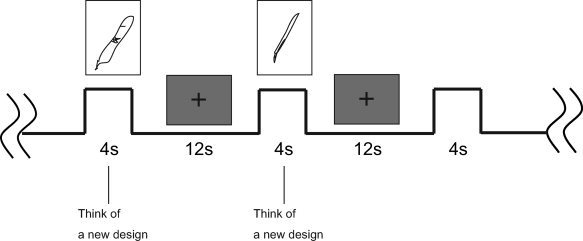
Task sequence. Following to 4 s presentation of a picture of pen, a fixation cross was presented for 12 s. Subjects were asked to think about new designs during pen presentation.
Evaluation of Creativity
Creativity is generally agreed to include two defining characteristics: “the ability to produce work that is both novel (i.e., original, unexpected) and appropriate (i.e., useful, adaptive concerning task constraints)” [Diertich, 2004; Sternberg and Lubart, 1999, p. 3]. In the pen‐designing task, it is easy even for novices to consider both aspects. The design of our new task also fits well with the model of a creative task proposed by Damasio [ 2001], which states that the following subprocesses are necessary for artistic creativity: generation of representational diversity, manipulation of representational diversity, and recognition of novel representation. With the external stimulus (presentation of a pen) one creates images (generation) and working memory can hold, rearrange, and restructure these representations (manipulation). The originality of each design was evaluated (recognition) by four professional designers according to the Japanese GOOD DESIGN award criteria (http://www.g-mark.org/). They graded the work on a scale from 1 to 10, with 10 being the best, depending on how original a new design was compared to the picture used to initiate the subjects' creativity. (We designated this grade as the “Originality Score,” or OS.) They were not told whether the designs were created by experts or novices. Although the aesthetic perception (recognition) may be primarily subjective, the creative artists seemed to possess similar standards for recognizing the originality of pen designs. The reliability of the OS as a creativity scale was tested in a reliability analysis, which gave Cronbach's alpha of 0.707 (>0.7) among the four professional designers. Therefore, designing new pens met all three criteria (generation, manipulation, and recognition) and was a suitable task for measuring artistic creativity. This presumption was also validated by the result that design‐major students had higher scores on the originality indices than novice subjects, as expected.
The average score of the four referees for a single new design was designated as “the originality score for a new pen design,” or OSpen. To quantify each subject's creativity, we defined three indices: #1; the highest OSpen achieved by a subject, #2; the productivity or number of designs produced by a subject, and #3; the OSsub or the originality score for an individual subject, which was calculated by adding the OSpen of all designs created by each subject, and represented the combined outcome of the subject's productivity and the originality of each product. We did not use the average OSpen as an index because it was not correlated with the BOLD signal change.
fMRI Data Acquisition
A time‐course series of 79 volumes was acquired with T2*‐weighted, gradient echo, echo planar imaging (EPI) sequences with a 3.0 T MRI system (Signa Horizon; General Electric Medical Systems, Milwaukee, WI) equipped with a standard birdcage head coil. Each volume consisted of 16 to 18 slices with a slice thickness of 6.0 mm (2.0 mm gap). The TR was 3,200 ms, the TE was 30 ms, and the flip angle was 90°. The digital in‐plane resolution was 64 × 64 pixels. For anatomical information, high‐resolution T2‐weighted images of the same slices of EPI scans were acquired with a spin echo sequence, with a 20‐cm field of view (256 × 256 matrix, 16–18 slices, TR 5,000 ms, TE 98 ms).
fMRI Data Analysis
The image data were analyzed using Statistical Parametric Mapping 2 (SPM2; Wellcome Department of Imaging Neuroscience, London, UK; http://www.fil.ion.ucl.ac.uk) implemented in MATLAB (MathWorks, Natick, MA). An interpolation method was applied to every MRI slice image to correct for the temporal offset between the slices acquired in each volume of the scanned brain. The first four volumes of each fMRI run were discarded due to unsteady magnetization, and the remaining 75 volumes were used for the statistical analysis. To correct for the head motions of each subject during MRI, the images were realigned to the last EPI volume, which was co‐registered with the subjects' high‐resolution T2‐weighted anatomical images, which were spatially normalized to the SPM2 template [Montreal Neurological Institute (MNI)] space. Then, normalization parameters were applied to the EPI images and all of the EPI images were normalized spatially into the MNI brain template. All of the normalized EPI images were smoothed using an isotropic Gaussian kernel (8 mm3 full‐width at half‐maximum) to increase the signal‐to‐noise ratio in the images and to facilitate inter‐subject group analyses. A 32‐second temporal high‐pass filter was applied to the data to remove low‐frequency noise. Significant increases in the hemodynamic response related to regional brain activity for designing or counting during each trial consisting of the presentation of pens and the fixation point were detected as voxel‐wise t‐statistics using the general linear model implemented in SPM2 [Friston et al., 1995]. The results for each subject were used for the group analysis using a random‐effect model of two separate one‐sample t‐tests (one for each experimental task: design or counting task). All results for the random‐effect models were corrected for multiple comparisons (FDR corrected, P < 0.05). First, we compared the design tasks of expert and novel subjects directly, or between design and counting tasks, but no statistically significant result was observed. Therefore, we performed region of interest (ROI) analysis.
ROI Analysis
For regions in which significant activation was detected, ROIs were defined by the anatomical parcellation of the normalized brain [Tzourio‐Mazoyer et al., 2002], i.e., the inferior frontal gyrus (IFG) pars triangularis gyrus (prefrontal cortex; PFC), inferior parietal region (parietal cortex; PC), inferior temporal cortices (IT), anterior cingulate (including paracingulate) gyri (AC), and hippocampus. The mean BOLD signal changes within each ROI were estimated, and the values were compared between the two ROIs, including the left and right matching ROIs, by two‐tailed t‐test.
Statistical Analysis
The relationship between BOLD signal changes and creativity indices were analyzed using Pearson's correlation coefficient for OSsub and productivity, as these indices followed normal distributions (P > 0.05, by K‐S test), and the Spearman correlation analysis for the highest score (highest OSpen), as it did not follow a normal distribution (P < 0.05, by K‐S test).
For the models of artistic creativity, we used Structural Equation Modeling (SEM). The models were estimated by a maximum likelihood method using Amos software (SPSS, Tokyo, Japan). First, to measure the effects of training on brain activities and on regional brain interactions while designing new pens, structural models were computed for a combined data of expert and novice subjects by minimizing the difference between observed and predicted covariances of standardized signal changes. In this case, the training period of each expert subject was used as the training factor. We then applied multiple model analysis by dividing the novice and expert groups and removing the training factor to compare the coefficients of each path between the two groups. For specifying the best‐fit model, we referred to the following fit indices: GFI, goodness of fit index; CFI, comparative fit index; RMSEA, root mean square error of approximation.
RESULTS
Comparison of the Three Indices of Creativity Between the Expert and Novice Groups
As a factor that influences creativity, the training period was calculated for design‐major students as the number of years since admission to the undergraduate design course of our university, and was found to be 5.90 (mean) ± 3.92 (SD) years (n = 20) (in the rest of this paper, “the mean ± SD” is used).
In terms of productivity, the expert subjects produced 3.59 ± 1.74 (n = 20) new designs, while the novice subjects produced 2.68 ± 1.74 (n = 20). The difference between the two groups was not significant (P = 0.081, P > 0.05, two‐tailed t‐test). However, when the highest OSpen by a subject was compared between the expert and the novice groups, the expert group (5.77 ± 1.81) showed higher scores than the novice group (4.51 ± 1.28; P = 0.015, P < 0.05, two‐tailed t‐test). In terms of the OSsub, which was a combination of productivity and average OSpen of a subject, the expert group (15.6 ± 7.9) showed a significantly higher score than the novice group (8.8 ± 6.9) (P < 0.001, two‐tailed t‐test). Thus, the creativity represented by the three indices was higher in the expert group than in the novice group.
fMRI Analysis
We observed a general tendency that activated areas were more limited in the expert group than in the novice group. The commonly activated regions among the novice and expert groups during the design task were the right inferior frontal gyrus (IFG) (parts of BA8, 9, 44, and 45) of the prefrontal cortex, bilateral occipital cortices (BA37), right inferior parietal cortices (PC) (BA19), bilateral inferior temporal cortices (BA21, 22), and bilateral hippocampus (Table I, Fig. 2). The major differences between the two groups during the design task were found in the PFC, PC, and the anterior cingulate cortex (AC). In the expert group, a right and left hemispheric difference was obvious; only the right PFC and PC were activated in the expert group, whereas in the novice group, bilateral PFC and PC were activated (Fig. 2A). The AC did not show any activation in the expert group.
Table I.
Regional activation by design and counting tasks in expert and novice subjects
| Cluster size | P value (corrected) | SPM{Z} | x | y | Z (mm) | Area | |
|---|---|---|---|---|---|---|---|
| Expert design | 855 | 0 | 6.65 | −30 | −60 | −18 | Left fusiform gyrus |
| 0 | 6 | −27 | −81 | 12 | Left middle/occipital gyrus | ||
| 952 | 0 | 5.71 | 27 | −75 | 36 | Right middle/occipital gyrus | |
| 0 | 5.51 | 36 | −54 | −18 | Right fusiform gyrus | ||
| 35 | 0 | 4.84 | −18 | −27 | −3 | Left hippocampus | |
| 183 | 0 | 4.84 | 45 | 15 | 27 | Right inferior frontal gyrus | |
| 80 | 0 | 4.56 | 33 | −54 | 54 | Right inferior parietal gyrus | |
| 19 | 0.001 | 4.3 | 42 | 3 | 48 | Right precentral gyrus | |
| 28 | 0.001 | 4.03 | 24 | −27 | 3 | Right thalamus | |
| 0.002 | 3.82 | 18 | −30 | −3 | Right hippocampus | ||
| 16 | 0.004 | 3.6 | −36 | 6 | 33 | Left precentral gyrus | |
| Expert count | 1194 | 0 | 5.96 | 36 | −63 | −12 | Right fusiform gyrus |
| 1029 | 0.001 | 4.76 | −30 | −42 | −18 | Left fusiform gyrus | |
| 136 | 0.001 | 4.67 | 45 | 9 | 27 | Right inferior frontal gyrus | |
| 61 | 0.002 | 4.37 | 9 | −30 | 27 | Right thalamus | |
| 96 | 0.002 | 4.31 | 3 | 9 | 48 | Right anterior cingulate gyrus | |
| 66 | 0.003 | 4.07 | −39 | 3 | 27 | Left inferior frontal gyrus | |
| 34 | 0.004 | 3.9 | 18 | −27 | 0 | Right thalamus | |
| 121 | 0.004 | 3.89 | −18 | 21 | −6 | Left putamen | |
| Novice DESIGN | 1739 | 0 | 6.75 | 33 | −69 | −15 | Right fusiform gyrus |
| 1549 | 0 | 6.44 | −30 | −51 | −15 | Left fusiform gyrus | |
| 321 | 0 | 5.43 | 45 | 9 | 30 | Right inferior frontal gyrus | |
| 64 | 0 | 5.28 | −15 | −30 | 0 | Right thalamus | |
| 246 | 0 | 5.08 | −3 | 9 | 48 | Left supplemental motor area/anterior cingulate gyrus | |
| 125 | 0 | 4.46 | −39 | 3 | 30 | Left inferior frontal gyrus | |
| 27 | 0 | 4.14 | −39 | −12 | 48 | Left precentral gyrus | |
| 76 | 0.001 | 3.99 | 45 | 0 | 51 | Right precentral gyrus | |
| Novice count | 33 | 0.001 | 3.85 | 18 | −66 | 6 | Right calcarin/lingual gyrus |
| 4597 | 0 | 7.11 | −24 | −63 | −12 | Left fusiform gyrus | |
| 605 | 0 | 5.4 | 51 | 27 | 18 | Right inferior frontal gyrus | |
| 632 | 0 | 4.88 | −39 | 6 | 36 | Left precentral/inferior frontal gyrus | |
| 121 | 0 | 4.81 | −18 | −30 | −3 | Left hippocampus | |
| 138 | 0 | 4.31 | 21 | −27 | 0 | Right thalamus | |
| 322 | 0.001 | 4.08 | 9 | 6 | 54 | Right supplemental motor area/cingulate gyrus | |
| 30 | 0.006 | 3.3 | 51 | −30 | 48 | Right spuramarginal/inferior parietal gyrus | |
| 48 | 0.007 | 3.21 | 45 | −6 | 45 | Right precentral/inferior frontal gyrus | |
| 21 | 0.013 | 3 | 9 | −33 | 27 | Right posterior cingulate gyrus |
The activated points of local maximum in each cluster are listed in reference to Talairach coordinates, with corrected P values and values of SPM (Z).
Figure 2.
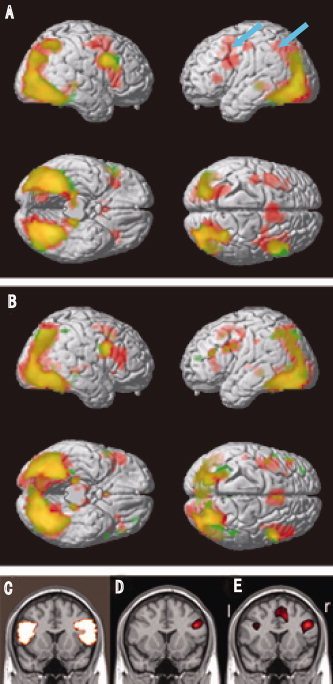
Activated brain regions during (A) the designing task and (B) the counting task (control). Red areas indicate activation in the novice group, and green areas indicate activation in the expert group. Yellow areas were activated in both groups. Blue arrows indicate the left PFC and PC region. (C) A frontal section in which ROI of the inferior frontal gyrus pars triangularis of the prefrontal cortex (PFC) was outlined. (D) and (E) Active regions with the design task are shown in red for the (D) expert and (E) novice groups, respectively. The “l” and “r” in (E) indicate the left and right sides, respectively.
In the control task (counting task), no significant differences were observed between the two groups. (Fig. 2B). Thus, we observed a general tendency of decreased activity of the left hemisphere in the expert group during the design task. However, voxel‐based analysis did not reveal statistical differences between the expert and novice groups, apart from the difference in the AC. Contrasts between the design task and the counting task in either group did not show significant differences. Therefore, we used ROI analysis to evaluate the activity differences between the left and right corresponding brain areas in both groups.
Laterality by ROI Analysis
A comparison of the mean voxel intensities between matching ROIs of the left and right sides revealed several areas that showed laterality (Figs. 2 and 3). The right sides of the PFC and PC showed clear dominance to the left sides (P < 0.01 for PFC, P < 0.05 for PC, n = 20) during the designing task in the expert group, but not in the novice group. An interesting observation was that, during the design task, the expert group showed a negative BOLD signal change in the PC, whereas a positive BOLD signal change was observed in this region in the novice group (see Fig. 3). The difference in the BOLD signal changes in the left PC between the expert and novice groups was statistically significant.
Figure 3.
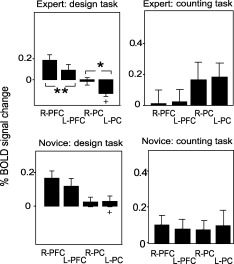
Comparison of the % BOLD signal change between the left and right cortices by ROI analysis in the design and counting tasks (control). PFC, prefrontal cortex; PC, parietal cortex. ** indicates a statistical difference of P < 0.01; * indicates a statistical difference of P < 0.05 by t‐test. The error bars show the standard deviation. Note that significant right and left differences in the PFC and PC were observed in the designing task of the expert group.
In the control counting task, no ROI showed a significant difference in activation between novice and expert subjects (Figs. 2B and 3) or in laterality.
Correlation Between Three Indices of Creativity and the Brain Activation Pattern
To further confirm the relationship between individual brain areas and creativity, we used a correlation analysis between the three creativity indices and BOLD signal changes of each ROI, or of the difference between two ROIs (left‐right, or prefrontal‐parietal, etc.). The expert and novice groups showed different correlation patterns (Table II, Fig. 4). In the expert group, all three indices of creativity showed correlations with [right PFC activity‐left PFC activity] (Table II, Fig. 4), but not with right PFC or left PFC activity per se. This result indicated that the direct or indirect interaction between the right and left PFC might contribute to producing highly original designs in the expert group. In contrast, these correlations were not observed in the novice group. Instead, we found the inverse correlation of three creativity indices with BOLD signal changes of the right PC or with that of the left PC (Table II and Fig. 4), which were not observed in expert subjects.
Table II.
Correlation between three creative indices and bold signal change in design task
| Brain areas | Expert | Novice | ||||
|---|---|---|---|---|---|---|
| WithOSsub | With productivity | With the highest score | With OSsub | With productivity | With the highest score | |
| L prefrontal | r = 0.022 | r = 0.043 | r = 0.076 | r = −0.229 | r = −0.268 | r = −0.007 |
| P = 0.926 | P = 0.857 | P = 0.749 | P = 0.332 | P = 0.254 | P = 0.974 | |
| R prefrontal | r = 0.350 | r = 0.340 | r = 0.360 | r = −0.256 | r = −0.329 | r = 0.016 |
| P = 0.131 | P = 0.142 | P = 0.114 | P = 0.276 | P = 0.157 | P = 0.944 | |
| [R‐L] prefrontal | r = 0.539 a | r = 0.488 b | r = 0.454 b | r = −0.016 | r = −0.056 | r = 0.011 |
| P = 0.014 | P = 0.029 | P = 0.044 | P = 0.945 | P = 0.816 | P = 0.962 | |
| L parietal | r = −0.093 | r = −0.066 | r = −0.07 | r = −0.593 a | r = −0.600 a | r = −0.492 b |
| P = 0.696 | P = 0.783 | P = 0.754 | P = 0.006 | P = 0.005 | P = 0.028 | |
| R parietal | r = −0.225 | r = −0.301 | r = −0.277 | r = −0.514 b | r = −0.573 a | r = −0.287 |
| P = 0.339 | P = 0.197 | P = 0.235 | P = 0.02 | P = 0.008 | P = 0.218 | |
| [R‐L] parietal | r = −0.140 | r = −0.228 | r = −0.262 | r = 0.195 | r = 0.131 | r = 0.319 |
| P = 0.557 | P = 0.333 | P = 0.263 | P = 0.410 | P = 0.581 | P = 0.169 | |
| R prefrontal − | r = 0.395 | R = 0.428 | r = 0.159 | r = 0.081 | r = 0.046 | r = 0.158 |
| R parietal | P = 0.085 | P = 0.06 | P = 0.504 | P = 0.736 | P = 0.847 | P = 0.506 |
| L prefrontal − | r = 0.059 | r = 0.065 | r = 0.181 | r = 0.214 | r = 0.175 | r = 0.147 |
| L parietal | P = 0.804 | P = 0.758 | P = 0.443 | P = 0.365 | P = 0.460 | P = 0.535 |
| Anterior cingulate | r = −0.085 | r = −0.038 | r = −0.004 | r = 0.026 | r = −0.009 | r = −0.012 |
| P = 0.721 | P = 0.874 | P = 0.984 | P = 0.915 | P = 0.970 | P = 0.959 | |
| L inferior temporal | r = 0.200 | r = 0.173 | r = 0.134 | r = 0.304 | r = −0.377 | r = −0.144 |
| P = 0.399 | P = 0.465 | P = 0.574 | P = 0.192 | P = 0.192 | P = 0.546 | |
| R inferior temporal | r = 0.111 | r = 0.130 | r = 0.186 | r = −0.077 | r = −0.183 | r = 0.082 |
| P = 0.642 | P = 0.585 | P = 0.434 | P = 0.747 | P = 0.439 | P = 0.730 | |
| [R‐L] inferior temporal | r = 0.104 | r = −0.059 | r = 0.151 | r = −0.200 | r = −0.261 | r = −0.326 |
| P = 0.662 | P = 0.806 | P = 0.525 | P = 0.397 | P = 0.267 | P = 0.161 | |
| R hippocampus | r = 0.059 | r = 0.100 | r = 0.056 | r = 0.419 | r = 0.420 | r = 0.037 |
| P = 0.803 | P = 0.674 | P = 0.813 | P = 0.066 | P = 0.065 | P = 0.874 | |
| L hippocampus | r = 0.048 | r = 0.067 | r = 0.098 | r = 0.363 | r = 0.272 | r = 0.130 |
| P = 0.839 | P = 0.777 | P = 0.679 | P = 0.116 | P = 0.246 | P = 0.582 | |
| R‐L hippocampus | r = −0.034 | r = 0.075 | r = 0.004 | r = 0.071 | r = 0.196 | r = −0.192 |
| P = 0.886 | P = 0.753 | P = 0.984 | P = 0.766 | P = 0.407 | P = 0.415 | |
Indicates a statistical difference of P < 0.01.
Indicates a statistical difference of P < 0.05 by Pearson for OSsub and productivity, and by Spearman for the highest score.
Figure 4.
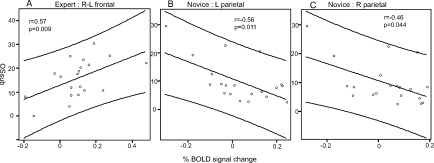
Correlations between individual originality scores (OSsub) and BOLD signal changes in the regions indicated. (A) A correlation in the right PFC—left PFC in expert subjects. (B) and (C) Correlations in the left PC and right PC in novice subjects, respectively. The axis indicates OSsub or productivity, and the abscissa indicates the % BOLD signal change. The “r” indicates the correlation coefficient with P‐value.
None of the other brain regions that were activated by the design task (listed in Tables I and II) showed significant correlations with creativity indices in either group. Although the AC showed a high activity in novice subjects, this region was not correlated with the creativity indices and may represent the difficulty of the design task for novice subjects [Fincham and Anderson, 2006]. Thus, the regions that are responsible for artistic creativity were narrowed down to the PFC and PC.
In novice subjects, the suppression of the PC seemed to be the major basis for creating new designs of high originality. These areas were also the target of modification by training, as significant suppression was observed in expert subjects. Based on these observations, we postulated that, after the design training, brain regions that are involved in yielding high creativity indices shifted from the PC to the PFC. Using structure equation modeling, we explored models that could explain the observation.
Structure Equation Modeling
We formulated a number of models based on our results and currently available anatomical data. We presumed that (1) “training” and “innate” factors have effects on creativity and brain activity, (2) an innate factor is manifested as brain activity in novice subjects, (3) a “training” factor is indicated quantitatively as “years after the admission to the university” (We did not include pre‐admission training, as we did not know the quality of previous training), and (4) brain activities of the PC and PFC affect the two indices of creativity: the highest score and productivity, which in turn affect OSsub. Under these presumptions, we compared a number of models and selected the one with GFI > 0.95, other fit indices > 0.95 and RMSEA < 0.01.
Figure 4A shows the best‐fit model that included a training factor (GFI: 0.94, NFI: 0.95, RMSEA < 0.001). The arrow from training is directed only to the left PC because effects of training on other brain areas were not statistically significant, and models including other paths from training (including those to the PFCs) did not clear the above criteria or resulted in inferior fit indices. In this model, the training exerts a negative “direct” effect on the left PC (−0.36), which means that training decreases the activity of the left PC. The PFC and right PC, however, do not receive a direct effect from training, but training had a positive effect (as the “total” effects) on right PFC (0.03) via indirect paths. Other brain regions, such as the left PFC (−0.03) and right PC (−0.12), received only negative effects from training as the total effects. These predictions are in accordance with fMRI observations that, in the expert group, right PFC activity was high, whereas activities of the other three regions were suppressed (see Fig. 5), as compared to novice subjects.
Figure 5.
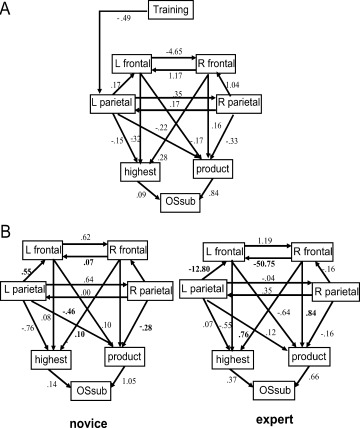
Structural Equation Modeling. (A) Shows the best fit model with the training factor based on presumptions (see text of results). The paths with coefficients are shown (covariance or variance of errors are not shown). (B) Indicates multiple group analysis for the novice and expert groups.
Another prediction of this model is that left parietal activity has a “negative” effect on the highest OSpen; therefore, if left PC activity is low, the subjects would show a high score in the highest OSpen. This is in accord with the behavioral result that the “the highest score” was significantly higher in the expert group, who had low (negative) left PC activity, than in novice subjects, who had high (positive) left PC activity (see Fig. 5).
We then applied multiple group analysis to this model without the training factor for comparison of novice and expert groups. Figure 5B shows the best‐fit model, in which GFI was 0.92, CFI was 1.0, and RMSEA was <0.001. The major difference between novice and expert subjects was observed in the path from the right PFC to the left PFC. The coefficient of this path was small and positive in novice subjects but became prominently negative in expert subjects, which suggests suppression of the left PFC by the right PFC, and thus can account for the low left PFC activity in this group.
DISCUSSION
In the expert group, all three indices of creativity were correlated with [right PFC activity‐left PFC activity] (Table II, Fig. 4A), but not with the right PFC or left PFC activity per se. This suggests that a direct or indirect interaction between the right and left PFC contributed in producing highly original designs in the expert group. In contrast, in the novice group, whereas the tendency of right PFC dominance was neither statistically significant nor correlated with creativity, the right PC and left PC showed inverse correlations with creativity.
To explain this phenomenon, SEM elucidated a possible change in recruited neural networks after training. SEM predicted that training decreases the activity of the left PC directly, which had a negative correlation with creativity. Then, suppression of the left PC by training in turn feeds positive signals to the right PFC as the “total” effect. Training also suppresses the activity of the right PC and left PFC indirectly. Therefore, right PFC activity overrides left PFC activity, and the activities of both sides of the PC decrease. These predictions are in accordance with fMRI observations that, in the expert group, right PFC activity was high, whereas the activities of the other three regions were suppressed.
SEM
SEM is generally applied for samples over 100, although it has been applied successfully to small sample data (n = 7 to 83) for neural network analysis, such as connectivity analysis of the rodent brain [McIntosh and Gonzalez‐Lima, 1994a; Puga et al., 2007] and PET/fMRI studies of the human brain [Darling et al., 2007; Koechlin et al., 2003; McIntosh and Gonzalez‐Lima, 1994b, 1995; Nyberg et al., 1996; Stein et al., 2007; Zhuang et al., 2005]. Buchel and Friston [ 2000] stated that “in terms of neuronal systems, a measure of covariance represents the degree to which the activities of two or more regions are related (i.e., functional connectivity). The study of variance‐covariance structures here is much simpler than in many other fields; the interaction of the dependent variables (regional activity of brain areas) is anatomically determined and the activation of each region can be directly measured with functional brain imaging. This represents a major difference to ‘classical’ structural equation modeling in the behavioral sciences, where models are often hypothetical.” In addition, the following points may validate the application of SEM to our results. With small samples, computed values may not fit the chi‐square distribution, and so the chi‐square test is thought to be inaccurate [Bearden et al., 1982]; however, our models were estimated using a general least squares method, which performs better with smaller sample sizes [Bentler and Yuan, 1999; Hu and Bentler 1998; Lei, 2007]. In addition, although our sample size was small (n = 40), the following indices showed a good fit: (1) NFI showed a good fit of 0.9, although it tends to underestimate the fit of models with small samples [Bearden et al., 1982]; (2) IFI is an index adjusted for “too small samples” [Bollen, 1989] and was 1.02 (good fit) for our model; and (3) CFI is good for estimating model fit, even in small samples [Bentler and Yuan 1989].
Function of the PFC‐PC Network in Creative Artistic Tasks
Creativity requires cognitive abilities, such as working memory, sustained attention, cognitive flexibility, and judgment of propriety, which are typically ascribed to the PFC. Many studies have emphasized the central role that the PFC must play in creativity [e.g., Ashby et al., 1999; Bechtereva et al., 2000, 2004; Carlsson, 2000; Damasio, 2001; Kornhuber, 1993; Martindale, 1999].
Functionally, the PFC is divided into dorsolateral (DL) and ventromedial (VM) regions [see review by Wood and Grafman, 2003]. The DLPFC has reciprocal connections with brain regions that are associated with motor control (basal ganglia, premotor cortex, and supplementary motor area), performance monitoring (cingulate cortex), and higher‐order sensory processing (association area and parietal cortex). Many researchers agree that the function of the lateral PFC is broadly one of “executive control,” i.e., scheduling and optimizing subsidiary processes implemented by posterior cortical or subcortical regions [Fuster, 2001; Miller and Cohen, 2001; Smith and Jonides, 1999; Wood and Grafman, 2003]. Inhibition is postulated to be a mechanism by which the PFC exerts its effects in implementing executive control and is reported to be necessary for motor control in human and animal models [Aron et al., 2004; Fassbender et al., 2004; Garavan et al., 1999; Roberts and Wallis, 2000; Rubia et al., 2003]. In a Go/NoGo task, successful motor response inhibition was related to the right inferior prefrontal cortex, while failure to inhibit was associated with activation in the bilateral inferior parietal cortex [Rubia et al., 2003]. Furthermore, these studies specifically pointed out the involvement of the right IFG in response inhibition [see review by Aron et al., 2004]. The ability to shift between modes of thinking, which is ascribed to a function of the DL‐PFC [Garavan et al., 1999; Konishi et al., 1998; Monchi et al., 2001], is a prerequisite for creativity because the inhibitory control is thought to suppress interfering stimuli for activating appropriate memories and for initiating appropriate reactions.
To perform flexible shifting for creativity, working memory is essential [Damasio, 2001]; this allows holding knowledge in the mind that is relevant to the task (e.g., pictures of pens that one has seen during MRI), as well as long‐term memory (e.g., notions about the functions of a pen), which may be needed as references.
Hemispheric laterality has been discussed in terms of the memory system for both working memory and long‐term memory. Tulving et al. [ 1996] proposed that episodic memory “encoding” is predominantly a left‐hemispheric function, while episodic “retrieval” is predominantly a right‐hemisphere function (task‐type selective). In contrast, Kelley et al. [ 1998] showed that the difference in the left and right PFC did not depend on task type (encoding vs. retrieval), but on the nature of the stimuli to be remembered (face vs. words), and the right PFC seemed to encode faces. Several studies have reported that the face‐encoding region for both working and long‐term memory was in the right VL‐PFC [Braver, 2001; Nakamura et al., 1999; Smith and Jonides, 1999]. The possibility exists that not only faces, but also other pictorial memories, are processed mainly in the right PFC because previous studies on artistic creativity all point to right hemispheric dominance, particularly of the frontal area [Bhattacharya and Petsche, 2002; Finkelstein et al., 1991; Mendez, 2004; Miller et al., 1998, 2000].
The regions that showed correlations with creativity in our experiment included the right IFG. The professional design training may have facilitated right PFC dominance during the creative design task by decreasing the activity of the left PFC through inhibitory control. The stronger the suppression to eliminate interfering information is, the greater the creativity for original designs becomes. This inhibitory effect might be qualitatively equivalent to the damage of the left prefrontal area in patients whose artistic creativity has increased [Finkelstein et al., 1991; Mendez, 2004; Miller et al., 1998; Miller et al., 2000].
In the PFC, transcallosal fiber connections have been reported anatomically in rodents and primates [Carr and Sesack, 1998; Soloway et al., 2002]. Using a visual memory retrieval task in monkeys, Hasegawa et al. [ 1998] showed that both sides of the PFC communicated through the anterior part of the corpus callosum. In rodent studies, these transcallosal fibers synapse on GABA neurons in the contralateral PFC [Carr and Sesack, 1998]. Therefore, in the expert, highly creative subjects, a transcallosal inhibitory pathway may exert inhibitory control from right to left in the PFC.
To design a new pen, the subjects had to use mental imagery and spatial transformation. These cognitive processes, as shown in many previous studies, elicit activation in a frontoparietal network. Ishai et al. [ 2000] and Mechelli et al. [ 2004] reported that during visual imagery, when subjects generated mental images of objects from long term memory, effects in occipito‐temporal cortex were mediated by backward connections from prefrontal, or from superior parietal cortex, to occipito‐temporal cortex. In their case, while temporo‐occipital activation by visual imagery clearly showed left hemispheric dominance, left and right PFC (or PC) showed similar level of activity with no obvious dominance in laterality. In simple imagery task as they used, right PFC dominance may not be required, however, under the load of creative task, right PFC dominance might emerge as it requires response inhibition of unwanted visual memories and the inhibition is exerted through right IFG [Aron et al., 2004].
A previous report suggested that activity in the parietal cortex reflects general visuospatial processing necessary for discriminating the transformed views of stimuli. The inverse correlation of the activity of the PC with creativity in the novice group suggested that while the task is unfamiliar (before training) to subjects, the decrease of activity in bilateral PC regions might be crucial for yielding designs with a high originality score. As this region is known to function during mental manipulation of objects [Seurinck et al., 2005], the low creative novice subjects may be trying to create new designs merely by “modifying” pictures that they were observing. Literatures that addresses the possible cerebral localization of mental rotation contains mixed results in terms of the laterality of the PC; while most of the reports showed right PC (or hemisphere) dominance [see Cohen, 1996; Ditunno and Mann, 1990; Harris et al., 2000], others showed left PC dominance [Alivisatos et al., 1997] or the involvement of the PC bilaterally [Jordan, 2001], in which case a more complex rotation task such as three‐dimensional objects, elicited greater activation of the alpha band or ERP in the right PC [Milivojevic, 2003; Roberts and Bell, 2003]. We found a negative correlation between the activities of both side of the PC with creativity, indicating that visuospatial processing, such as mental rotation of an object in the PC, is somehow interfering with the creative process leading to new designs. The activity of this region (particularly on the left side) was suppressed in the expert group, and the SEM analysis indicated that the left PC was the primary site of the effect of training; the inhibition of activity of the left PC seemed to occur first and as training progressed, the inhibition was extended to the right PC and left PFC.
Our findings support hypotheses that creativity is the outcome of processes that involve multiregional interhemispheric interactions, and delineate the effect of training on parietofrontal network, which results in the increase of creativity.
Acknowledgements
We thank Dr. M. Masu, Dr. M. Shidara, Dr. B. Richmond, Dr. Hattori, and Dr. P. McCaffery for their comments.
REFERENCES
- Alivisatos B,Petrides M ( 1997): Functional activation of the human brain during mental rotation. Neuropsychologia 35: 111–118. [DOI] [PubMed] [Google Scholar]
- Amabile T ( 1983): The social psychology of creativity. Springer‐Verlag, New York. [Google Scholar]
- Aron RA,Robbins TW,Poldrack RA ( 2004): Inhibition and the right inferior frontal cortex. Trends Cog Sci 8: 170–177. [DOI] [PubMed] [Google Scholar]
- Ashby GF,Isen AM,Turken AU ( 1999): A neuropsychological theory of positive affect and its influence on cognition. Psychol Rev 106: 529–550. [DOI] [PubMed] [Google Scholar]
- Atchley RA,Keeney M,Burgess C ( 1999): Cerebral hemispheric mechanisms linking ambiguous word meaning retrieval and creativity. Brain Cogn 40: 479–99. [DOI] [PubMed] [Google Scholar]
- Bearden WO,Sharma S,Teel JE ( 1982): sample size effects on chi square and other statistics used in evaluating causal models. J Marketing Res 19: 425–430. [Google Scholar]
- Bechtereva NP,Starchenko MG,Klyucharev VA,Vorobiev VA,Pakhomov SV,Medvedev SV ( 2000): The study of the brain's organization of creativity: 2. A positron emission tomography data. Hum Physiol 26: 121–127. [Google Scholar]
- Bechtereva NP,Korotkov AD,Pakhomov SV,Roudas MS,Starchenko MG,Medvedev SV ( 2004): PET study of brain maintenance of verbal creative activity. Int J Psychophysiol 53: 11–20. [DOI] [PubMed] [Google Scholar]
- Bentler PM,Yuan K‐H ( 1999): Structural equation modeling with small samples: Test statistics. Multivariate Behav Res 34: 181–197. [DOI] [PubMed] [Google Scholar]
- Bhattacharya J,Petsche H ( 2002): Shadows of artistry: cortical synchrony during perception and imagery of visual art. Cogn Brain Res 13: 179–186. [DOI] [PubMed] [Google Scholar]
- Bhattacharya J,Petsche H ( 2005): Drawing on mind's canvas: Differences in cortical integration patterns between artists and non‐artists. Human Brain Mapp 26: 1–14. [DOI] [PMC free article] [PubMed] [Google Scholar]
- Boden MA. ( 1994): Dimensions of Creativity. Boston, MA: The MIT Press. [Google Scholar]
- Bogen JE,Bogen GM ( 1969): The other side of the brain. 3. The corpus callosum and creativity. Bull Los Angeles Neurol Soc 34: 191–220. [PubMed] [Google Scholar]
- Bollen KA ( 1989): A new incremental fit index for general structure equation models. Sociol Methods Res 17: 303–316. [Google Scholar]
- Braver TS,Barch DM,Kelley WM,Buckner RL,Cohen NJ,Miezin FM,Snyder AZ,Ollinger JM,Akbudak E,Conturo TE,Petersen SE ( 2001): Direct Comparison of Prefrontal Cortex Regions Engaged by Working and Long‐Term Memory Tasks. NeuroImage 14: 48–59. [DOI] [PubMed] [Google Scholar]
- Bruchey AK,Shumake J,Gonzalez‐Lima F ( 2007): Network model of fear extinction and renewal functional pathways. Neuroimage 145: 423–437. [DOI] [PMC free article] [PubMed] [Google Scholar]
- Buchel C,Friston KJ ( 1997): Modulation of connectivity in visual pathways by attention: cortical interactions evaluated with structural equation modeling and fMRI. Cerebral Cortex 7: 768–778. [DOI] [PubMed] [Google Scholar]
- Buchel C,Friston KJ ( 2000): Assessing interactions among neuronal systems uisng functional neuroimaging. Neural Networks 13: 871–882. [DOI] [PubMed] [Google Scholar]
- Carlsson I,Wendt PE,Risberg J ( 2000): On the neurobiology of creativity. Differences in frontal activity between high and low creative subjects. Neuropsychologia 38: 873–85. [DOI] [PubMed] [Google Scholar]
- Carr DB,Sesack SR ( 1998): Callosal terminals in the rat prefrontal cortex: Synaptic targets and association with GABA‐immunoreactive structures. Synapse 29: 193–205. [DOI] [PubMed] [Google Scholar]
- Chavez‐Eakle RA,Graff‐Guerrero A,Garcia‐Reyna J‐C,Vaugier V,Cruz‐Fuentes C ( 2007): Cerebral blood flow associated with creative performance: A comparative study. Neuroimage 38: 519–528. [DOI] [PubMed] [Google Scholar]
- Cohen MS,Kosslyn SM,Breiter HC,DiGirolamo GJ,Thompson WL,Anderson AK,Bookheimer SY,Rosen BR,Belliveau JW. ( 1996): Changes in cortical activity during mental rotation: A mapping study using functional MRI. Brain 119: 89–100. [DOI] [PubMed] [Google Scholar]
- Csikszentmihalyi M ( 1996): Creativity, flow and the psychology of discovery and invention. HarperPerennial, New York. [Google Scholar]
- Darling WG,Seits RJ,Peltier S,Tellmann L,Butler AJ. ( 2007): Visual cortex activation in kinesthetic guidance of reaching. Exp Brain Res. Published online. [DOI] [PubMed] [Google Scholar]
- Damasio AR ( 2001): Some notes on brain,imagination and creativity In: Pfenninger KH, editors. The Origins of Creativity. Oxford: Oxford University Press; pp 59–68. [Google Scholar]
- Dietrich A ( 2004): The cognitive neuroscience of creativity. Psychonomic Bull Rev 11: 1011–1026. [DOI] [PubMed] [Google Scholar]
- Ditunno P,Mann VA ( 1990): Right hemisphere specialization for mental rotation in normals and brain damaged subjects. Cortex 26: 177–188. [DOI] [PubMed] [Google Scholar]
- Eysenck HJ ( 1993): Creativity and Personality: Suggestions for a Theory Psychological Inquiry 4: 147–178. [Google Scholar]
- Fassbender C,Murphy K,Foxe JJ,Wylie GR,Javitt DC,Robertson IH,Garavan H ( 2004): A topography of executive functions and their interactions revealed by functional magnetic resonance imaging. Cog Brain Res 20: 132–143. [DOI] [PubMed] [Google Scholar]
- Fincham JM,Anderson JR ( 2006): Distinct roles of the anterior cingulate and prefrontal cortex in the acquisition and performance of a cognitive skill. Proc Natl Acad Sci USA 103: 12941–12946. [DOI] [PMC free article] [PubMed] [Google Scholar]
- Fink A,Neubauer AC ( 2006): EEG alpha oscillations during the performance of verbal creativity tasks: Differential effects of sex and verbal intelligence. Int J Psychophysiol 62: 46–53. [DOI] [PubMed] [Google Scholar]
- Finkelstein Y,Vardi J,Hod I ( 1991): Impulsive artistic creativity as a presentation of transient cognitive alterations. Behav Med 17: 91–94. [DOI] [PubMed] [Google Scholar]
- Friston KJ,Holmes AP,Poline JB,Grasby PJ,Williams SC,Frackowiak RS,Turner R ( 1995): Analysis of fMRI time‐series revisited. Neuroimage 2: 45–53. [DOI] [PubMed] [Google Scholar]
- Fuster JM ( 2001): The prefrontal cortex—An update: Time is of the essence. Neuron 30: 319–333. [DOI] [PubMed] [Google Scholar]
- Garavan H,Ross TJ,Stein EA ( 1999): Right hemispheric dominance of inhibitory control: An even‐related functional MRI study. Proc Natl Acad Sci USA 96: 8301–8306. [DOI] [PMC free article] [PubMed] [Google Scholar]
- Gruber HE ( 1981): Cognitive psychology, scientific creativity, and the case study method. Boston Studies in the Philosophy of Science 34: 295–332. [Google Scholar]
- Guillford JP ( 1950): Creativity. Am Psychol 5: 444–454. [DOI] [PubMed] [Google Scholar]
- Guilford JP ( 1968): Intelligence has three facets: There are numerous intellectual abilities, but they fall neatly into a rational system. Science 160: 615–620. [DOI] [PubMed] [Google Scholar]
- Hanakawa T,Honda M,Okada T,Fukuyama H,Shibasaki H ( 2003): Neural correlates underlying mental calculation in abacus experts: A functional magnetic resonance imaging study. Neuroimage 19: 296–307. [DOI] [PubMed] [Google Scholar]
- Harris IM,Egan GF,Sonkkila C,Tochon‐Danguy HJ,Paxinos G,Watson DG ( 2000): Selective right parietal lobe activation during mental rotation. A parametric PET study. Brain 123: 65–73. [DOI] [PubMed] [Google Scholar]
- Hasegawa I,Fukushima T,Ihara T,Miyashita Y ( 1998): Callosal window between prefrontal cortices: Cognitive interaction to retrieve long‐term memory. Science 281: 814–818. [DOI] [PubMed] [Google Scholar]
- Hoppe KD ( 1988): Hemispheric specialization and creativity. Psychiatr Clin North Am 11: 303–15. [PubMed] [Google Scholar]
- Hu LT,Bentler PM ( 1998): Fit indices in covariance structure modeling: Sensitivity to underparameterized model misspecification. Psychol Methods 3: 424–453. [Google Scholar]
- Ishai A,Ungerleider LG,Haxby JV ( 2000): Distributed neural systems for the generation of visual images. Neuron 28: 979–990. [DOI] [PubMed] [Google Scholar]
- Jordan K,Heinze H‐J,Lutz K,Kanowski M,Jäncke L ( 2001): Cortical activations during the mental rotation of different visual objects. Neuroimage 13: 143–152. [DOI] [PubMed] [Google Scholar]
- Jung‐Beeman M,Bowden EM,Haberman J,Frymiare JL,Arambel‐Liu S,Greenblatt R,Reber PJ,Kounios J ( 2004): Neural activity ahen people solve verbal problems with insight. PLoS Biol 2: 500–510. [DOI] [PMC free article] [PubMed] [Google Scholar]
- Katz AN ( 1986): The relationships between creativity and cerebral hemisphericity for creative architects, scientists, and mathematicians. Empirical Stud Arts 4: 97–108. [Google Scholar]
- Kelley WM,Miezin FM, McDermott, KB Buckner RL,Raichle ME,Cohen NJ,Ollinger JM,Akbudak E,Conturo TE,Snyder AZ,Petersen SE ( 1998): Hemispheric specialization in human dorsal frontal cortex and medial temporal lobe for verbal and nonverbal memory encoding. Neuron 20: 927–936. [DOI] [PubMed] [Google Scholar]
- Koechlin E,Ody C,Kouneiher F ( 2003): The architecture of cognitive control in the human prefrontal cortex. Science 302: 1181–1185. [DOI] [PubMed] [Google Scholar]
- Kornhuber HH ( 1993): Prefrontal cortex and homo‐sapiens—On creativity and reasoned will. Neurol Psychiatry Brain Res 2: 1–6. [Google Scholar]
- Lei PW ( 2007): Evaluating estimation methods for ordinal data in structural equation modeling. Qual Quant. Published Online. [Google Scholar]
- Martindale C ( 1999): The biological basis of creativity In: Sternberg RJ,editor. Handbook of Creativity. Cambridge: Cambridge University Press. [Google Scholar]
- Martindale C,Hines D,Mitchell L,Covello E ( 1984): EEG alpha asymmetry and creativity. Person Indiv Differ 5: 77–86. [Google Scholar]
- McIntosh AR,Gonzalez‐Lima F. ( 1994a): Network interactions among limbic cortices, basal forebrain, and cerebellum differentiate a tone conditioned as a Pavlovian excitor or inhibitor: Fluorodeoxyglucose mapping and covariance structural modeling. J Neurophysiol 72: 1717–1733. [DOI] [PubMed] [Google Scholar]
- McIntosh AR,Gonzalez‐Lima F. ( 1994b): Structural equation modeling and its application to nework analysis in functional brain mapping. Human Brain Mapp 2: 2–22. [Google Scholar]
- McIntosh AR,Gonzalez‐Lima F ( 1995): Functional network interactions between parallel auditory pathways during Pavlovian conditioned inhibition. Brain Res 683: 228–241. [DOI] [PubMed] [Google Scholar]
- Mechelli A,Price CJ,Friston KJ,Ishai A ( 2004): Where bottom‐up meets top‐down: neuronal interactions during perception and imagery. Cerebral Cortex 14: 1256–1265. [DOI] [PubMed] [Google Scholar]
- Mendez MF ( 2004): Dementia as a window to the neurology of art. Med Hypotheses 63: 1–7. [DOI] [PubMed] [Google Scholar]
- Milivojevic B,Johnson BW,Hamm JP,Corballis MC ( 2003): Non‐identical neural mechanisms for two types of mental transformation: event‐related potentials during mental rotation and mental paper folding. Neuropsychol 41: 1345–1356. [DOI] [PubMed] [Google Scholar]
- Miller BL,Boone K,Cummings JL,Read SL,Mishkin F ( 2000): Functional correlates of musical and visual ability in frontotemporal dementia. Br J Psychiatry 176: 458–463. [DOI] [PubMed] [Google Scholar]
- Miller EK,Cohen JD ( 2001): An integrative theory of prefrontal cortex functions. Annu Rev Neurosci 24: 167–202. [DOI] [PubMed] [Google Scholar]
- Miller BL,Cummings J,Mishkin F,Boone K,Prince F,Ponton M,Cotman C ( 1998): Emergence of artistic talent in frontotemporal dementia. Neurology 51: 978–982. [DOI] [PubMed] [Google Scholar]
- Molle M,Marshall L,Lutzenberger W,Pietrowsky R,Fehm HL,Born J ( 1996): Enhanced dynamic complexity in the human EEG during creative thinking. Neurosci Lett 208: 61–64. [DOI] [PubMed] [Google Scholar]
- Monchi O,Petrides M,Petre V,Worsley V,Dagher A ( 2001): Wisconsin card sorting revisited:distinct neural circuits participating in different stages of the task identified by event‐related functional magnetic resonance imaging. J Neurosci 21: 7733–7741. [DOI] [PMC free article] [PubMed] [Google Scholar]
- Nakamura K,Kawashima R,Ito K,Sugiura M,Kato T,Nakamura A,Hatano K,Nagumo S,Kubota K,Fukuda H,Kojima S ( 1999): Activation of the right inferior frontal cortex during assessment of facial emotion. J Neurophysiol 82: 1610–1614. [DOI] [PubMed] [Google Scholar]
- Nyberg L,McIntosh AR,Cabeza R,Nilsson L‐G,Houle S,Habib R,Tulving E ( 1996): Network Analysis of Positron Emission Tomography Regional Cerebral Blood Flow Data: Ensemble Inhibition during Episodic Memory Retrieval. J Neurosci 16: 3753–3759. [DOI] [PMC free article] [PubMed] [Google Scholar]
- Ouchi Y,Kanno T,Yoshikawa E,Futatsubashi M,Okada H,Torizuka T,Kaneko M ( 2005): Neural substrates in judgement process while playing go: a comparison of amateurs with professionals. Cogn Brain Res 23: 164–170. [DOI] [PubMed] [Google Scholar]
- Petsche H ( 1996): Approaches to verbal, visual and musical creativity by EEG coherence analysis. Int J Psychophysiol 24: 145–59. [DOI] [PubMed] [Google Scholar]
- Puga F,Barrett DW,Bastida C,Gonzalez‐Lima F ( 2007): Functional networks underlying latent inhibition learning in the mouse brain. Neuroimage 38: 171–183. [DOI] [PMC free article] [PubMed] [Google Scholar]
- Purcell AT,Gero JS ( 1998): Drawings and the design process: A review of protocol studies in design and other disciplines and related research in cognitive psychology. Design Stud 19: 389–430. [Google Scholar]
- Roberts JE,Bell MA. ( 2003): Two‐ and three‐dimensional mental rotation tasks lead to different parietal laterality for men and women. Internat J Psychophysiol 50: 235–246. [DOI] [PubMed] [Google Scholar]
- Roberts AC,Wallis JD ( 2000): Inhibitory control and affective processing in the prefrontal cortex: Neuropsychological studies in the common marmoset. Cerebral cortex 10: 252–262. [DOI] [PubMed] [Google Scholar]
- Rubia K,Smith AB,Brammer MJ,Taylor E ( 2003): Right inferior prefrontal cortex mediates response inhibition while mesial prefrontal cortex is responsible for error detection. Neuroimage 20: 351–358. [DOI] [PubMed] [Google Scholar]
- Seurinck R,Vingerhoets G,Vandemaele P,Deblaere K,Achten E ( 2005): Trial pacing in mental rotation tasks. Neuroimage 25: 1187–1196. [DOI] [PubMed] [Google Scholar]
- Soloway AS,Pucak ML,Melchitzky DS,Lewis DA ( 2002): Dendritic morphology of callosal and ipsilateral projection neurons in monkey prefrontal cortex. Neuroscience 109: 461–471. [DOI] [PubMed] [Google Scholar]
- Smith EE,Jonides J ( 1999): Storage and executive processes in the frontal lobes. Science 283: 1657–1661. [DOI] [PubMed] [Google Scholar]
- Stein JL,Wiedholz LM,Bassett DS,Weinberger DR,Zink CF,Mattay VS,Meyer‐Lindenberg A ( 2007): A validated network of effective amygdala connectivity. Neuroimage 36: 736–745. [DOI] [PubMed] [Google Scholar]
- Sternberg RJ,Lubert TI ( 1999): The concept of creativity: Prospects and paradigms In: Sternberg RJ, editor. Handbook of Creativity. Cambridge: Cambridge University Press. [Google Scholar]
- Torrance EP ( 1982): Hemisphericity and creative functioning. J Res Dev Education 15: 29–37. [Google Scholar]
- Torrance EP,Safter HT ( 1999): Making the creative leap beyond. Buffalo,NY: Creative Education Foundation PRESS. [Google Scholar]
- Tulving E,Markowitsch HJ,Craik FIM,Habib R,Houle S. ( 1996): Novelty and familiarity activations in PET studies of memory encoding and retrieval. Cereb Cortex 6: 71–79. [DOI] [PubMed] [Google Scholar]
- Tzourio‐Mazoyer N,Landeau B,Papathanassiou D,Crivello F,Etard O,Delcroix N,Mazoyer B,Joliot M ( 2002): Automated anatomical labeling of activations in SPM using a macroscopic anatomical parcellation of the MNI MRI single‐subject brain. Neuroimage 15: 273–289. [DOI] [PubMed] [Google Scholar]
- Ward TB,Finke RA,Smith SM ( 1999): Creativity and the mind: Discovering the genius within. Plenum, New York. [Google Scholar]
- Wood JN,Grafman J ( 2003): Human prefrontal cortex : Processing and representational perspectives. Nature Rev Neurosci 4: 139–147. [DOI] [PubMed] [Google Scholar]
- Zeki S ( 2001): Artistic creativity and the brain. Science 293: 51–52. [DOI] [PubMed] [Google Scholar]
- Zhuang J,LaConte S,Peltier S,Zhang K,Hu X ( 2005): Connectivity exploration with structural equation modeling: an fMRI study of bimanual motor coordination. Neuroimage 25: 462–470. [DOI] [PubMed] [Google Scholar]