

Abstract
Voxel‐based analyses (VBA) are increasingly being used to detect white matter abnormalities with diffusion tensor imaging (DTI) in different types of pathologies. However, the validity, specificity, and sensitivity of statistical inferences of group differences to a large extent depend on the quality of the spatial normalization of the DTI images. Using high‐dimensional nonrigid coregistration techniques that are able to align both the spatial and orientational diffusion information and incorporate appropriate templates that contain this complete DT information may improve this quality. Alternatively, a hybrid technique such as tract‐based spatial statistics (TBSS) may improve the reliability of the statistical results by generating voxel‐wise statistics without the need for perfect image alignment and spatial smoothing. In this study, we have used (1) a coregistration algorithm that was optimized for coregistration of DTI data and (2) a population‐based DTI atlas to reanalyze our previously published VBA, which compared the fractional anisotropy and mean diffusivity maps of patients with amyotrophic lateral sclerosis (ALS) with those of healthy controls. Additionally, we performed a complementary TBSS analysis to improve our understanding and interpretation of the VBA results. We demonstrate that, as the overall variance of the diffusion properties is lowered after normalizing the DTI data with such recently developed techniques (VBA using our own optimized high‐dimensional nonrigid coregistration and TBSS), more reliable voxel‐wise statistical results can be obtained than had previously been possible, with our VBA and TBSS yielding very similar results. This study provides support for the view of ALS as a multisystem disease, in which the entire frontotemporal lobe is implicated. Hum Brain Mapp, 2009. © 2009 Wiley‐Liss, Inc.
Keywords: diffusion tensor imaging, voxel‐based analysis, amyotrophic lateral sclerosis, brain, white matter, coregistration, template, DTI atlas, tract‐based spatial statistics
INTRODUCTION
Diffusion tensor imaging (DTI) is a relatively new imaging technique that can be used to investigate the microstructural properties of biological tissue [Basser and Pierpaoli, 1996; Basser et al., 1994]. The orientation and integrity of white matter (WM) fibers can be demonstrated in vivo, because it can be assumed that the orientation and magnitude of the local diffusion process—and the corresponding local diffusion tensor field—are related to the orientation of the underlying fiber pathways [Beaulieu, 2002].
Moreover, DTI provides quantitative metrics of the diffusion process, such as the fractional anisotropy (FA), i.e., a normalized measure of the degree of anisotropy, and the mean diffusivity (MD), i.e., the mean amount of diffusion. These metrics have already been shown to be sensitive markers for studying a wide range of WM pathologies, such as stroke [Pierpaoli et al., 2001; Werring et al., 2001], multiple sclerosis [Reich et al., 2008], schizophrenia [Kyriakopoulos et al., 2008; Seok et al., 2007], and several other WM disorders [Borroni et al., 2007; Thomas et al., 2005; Wieshmann et al., 1999], including amyotrophic lateral sclerosis (ALS) [Abe et al., 2004; Agosta et al., 2007; Ciccarelli et al., 2006, 2008; Ellis et al., 1999; Sach et al., 2004; Sage et al., 2007; Toosy et al., 2003; Wang et al., 2006; Zhang et al., 2007].
ALS is a neurodegenerative disorder, characterized by the progressive injury and cell death of lower motorneurons (LMN) in the spinal cord and brain stem and of upper motorneurons (UMN) in the motor and premotor cortex. Patients experience progressive weakening of the muscles with accompanying wasting and brisk reflexes, thereby losing control of voluntary movement. Although the cardinal signs of ALS are motor impairments, recent evidence suggests that ALS is not an isolated motorneuron disorder, but that ALS is a multisystem disease, in which widespread extramotor neuropathology can be found [Abrahams et al., 2005; Lomen‐Hoerth et al., 2002; Phukan et al., 2007; Sage et al., 2007; Turner et al., 2009]. The etiology of ALS remains poorly understood. In 10% of cases, it is a familial mostly autosomal dominant disorder, whereas in the remaining 90% (sporadic ALS) the primary pathogenic process remains unknown.
Previous DTI studies investigating ALS have demonstrated significant changes of diffusion parameters in the brain of patients with ALS [Abe et al., 2004; Agosta et al., 2007; Ciccarelli et al., 2006, 2008; Ellis et al., 1999; Sach et al., 2004; Sage et al., 2007; Toosy et al., 2003; Wang et al., 2006; Zhang et al., 2007]. However, in these studies different approaches and methodologies have been used, leading to conflicting and inconclusive results. Moreover, in most previous reports attention was mostly confined to parts of the corticospinal tract (CST), although in a number of studies the focus was extended to the whole brain and brainstem [Abe et al., 2004; Ciccarelli et al., 2008; Sach et al., 2004; Sage et al., 2007; Zhang et al., 2007]. The common finding of previous studies is that there is a reduction of FA in the CST, which is thought to reflect the neuronal degeneration of the UMN. Significant correlations of diffusion parameters with measures of disease duration or progression and disease severity have been established in some of the previous studies [Ciccarelli et al., 2008; Ellis et al., 1999; Sage et al., 2007; Wang et al., 2006]. However, in other studies these correlations could not be confirmed [Agosta et al., 2007; Ciccarelli et al., 2008; Toosy et al., 2003].
In our previous study [Sage et al., 2007], reduced FA and elevated MD was found throughout the brain WM in a voxel‐based analysis (VBA) of patients with ALS. Additionally, we also demonstrated these effects in the rostral parts of the CST by a spatial interpolation of fiber tractography (FT) reconstructions of the CST.
However, we were not able to fully explain some discrepancies between the analysis of the tract data and the VBA and suggested that analysis of tract data may be more sensitive to detect such differences compared with a VBA. Also, we did not use the information of the diffusion data to its full extent for the registration of the images and we were thus not able to completely rule out possible false‐positive or false‐negative results due to suboptimal registration of the images.
Since the publication of this study [Sage et al., 2007], there has been a rapid evolution in the development of different techniques that can be used for both pre‐ and postprocessing of DTI data.
For instance, for the preprocessing of DTI data, it has recently been demonstrated that the b‐matrix should be corrected to account for the rotational component of the motion correction to optimally estimate the diffusion tensor (DT) [Landman et al., 2007b; Leemans and Jones, 2009].
Another area in which a lot of progress has been made is the coregistration and/or spatial normalization of DTI images, which is particularly challenging compared with aligning scalar images, because each voxel contains the multivalued, directional diffusion information. Additionally, the alignment of the DT field with the underlying microstructure has to be preserved after coregistration, which requires a tensor reorientation (TR) strategy [Alexander et al., 2001]. In older studies, a common approach for coregistration or spatial normalization of DT images was to either use scalar images derived from the DTI data (e.g., FA maps) for the coregistration or to apply the transformation parameters that were found from the transformation of a T1‐ or T2‐weighted image to a reference space to the DTI images [Kyriakopoulos et al., 2008; Sage et al., 2007]. The disadvantage of the first approach is that not all the diffusion information is used to drive the coregistration process. For the latter, the coregistration result will be strongly affected by the complex difference in geometrical distortions between the DTI and T1/T2 acquisitions and by the severe lack of WM contrast in the reference T1‐ or T2‐weighted images, rendering it nonoptimal. Several studies have shown that incorporating all diffusion information during coregistration and applying an appropriate TR strategy can improve both the spatial and orientational alignment of DTI data [Alexander et al., 2001; Park et al., 2003; Van Hecke et al., 2007]. Although a substantial number of nonrigid coregistration algorithms has been proposed [Alexander et al., 1999; Guimond et al., 2000; Park et al., 2003; Van Hecke et al., 2007; Zhang et al., 2006], only a few have been evaluated using data of clinical studies. In most studies, evaluation and validation of the proposed algorithm is done using synthetic or phantom data or using data of a limited number of young, healthy subjects [Alexander et al., 2001; Leemans et al., 2005a; Van Hecke et al., 2007]. To our knowledge, the only other studies that have used clinical data for the evaluation and validation of their coregistration algorithms were a WM asymmetry study by Park et al. [2004] and an ALS study by Zhang et al. [2007].
Finally, different approaches have been developed to create appropriate DTI templates. In previous studies, the most commonly used template is the Montreal Neurological Institute (MNI) template [Borroni et al., 2007; Seok et al., 2007]. The disadvantages of this template are that it does not contain any DT information and that it is not study specific. Because large deformation fields may be required to warp the datasets of the subject group to this template, image alignment inaccuracies may be introduced that affect the accuracy of the VBA results. This is especially the case when studying young children, older populations, or neurodegenerative diseases in which brain atrophy becomes relevant.
A first approach to generate a template that contains diffusion information is to average all FA maps that were included in the study, which yields a population‐specific FA‐template. The main disadvantage of this approach is that these templates no longer contain orientational information that may be used to guide subsequent coregistration processes. Using a more sophisticated approach, Mori et al. [2008] have generated a WM‐specific atlas in stereotaxic coordinates by using the ICBM‐152 as a reference template for their atlas‐building procedure from which they also derived WM parcellation maps. An FA template, such as this ICBM81‐template, will already provide a more appropriate contrast for coregistration and/or spatial normalization of DTI images, but it still does not contain any orientational information. Also, as the data used for this template were acquired in young healthy subjects, correct coregistration to this template may be hampered when using data of very young, older, or diseased populations. A study investigating brain atrophy has already shown that the statistical results of a VBA depend on the choice of the template [Shen et al., 2005, 2007]. Similarly for DTI, the reliability of VBA results may be improved by the use of a population‐based DT atlas, which is more representative of the population studied. In this view, several DTI atlas‐building approaches have been proposed with some yielding subject‐based atlases [Ardekani and Sinha, 2006; Guimond et al., 2000; Park et al., 2003] and others yielding population‐based atlases [Van Hecke et al., 2008] or group‐based atlases [Goodlett et al., 2006; Studholme and Cardenas, 2004]. In the case of subject‐based atlases, a single subject is used as a reference dataset for atlas construction, whereas for population‐based atlases, no reference dataset has to be selected a priori, as all datasets will contribute evenly to the final atlas.
An alternative approach to perform voxel‐wise statistical testing on DTI variables has recently been proposed by Smith et al. [2006]. In this approach, which was coined tract‐based spatial statistics (TBSS), tract skeletons are generated which represent the centers of all tracts common to the study population. By first aligning all subjects' DTI data to a common reference space, values of DTI metrics can be projected onto the skeleton. This approach avoids both the need for perfect alignment of the DTI data and for setting the correct filter size for spatial smoothing [Jones et al., 2005], as no additional smoothing is required before performing statistics on these skeletons. Therefore, the TBSS approach may be more powerful and accurate to find differences in DTI variables between different groups than a VBA.
All the abovementioned improvements in the pre‐ and postprocessing of DTI data may contribute to improve the reliability of VBA. An important prerequisite for such studies is that after alignment of the DT images to a reference space, spatially overlapping voxels of different subjects correspond to the same anatomical structures. As a suboptimal registration approach was used in our previous study, we believe it is crucial to reperform our previously reported study, in which DTI data of 28 ALS patients were compared with DTI data of 26 age‐ and sex‐matched healthy controls, with state‐of‐the‐art DTI processing methods to provide the most accurate VBA results. Furthermore, we also performed TBSS on our data to compare the statistical results obtained with VBA and TBSS.
MATERIALS AND METHODS
Subjects
We examined 28 ALS patients (14 male, 14 female), of which 21 had laboratory supported definite ALS and 7 had laboratory supported probable ALS as defined by the El Escorial criteria [Brooks et al., 2000]. The mean age of these patients was 58.9 ± 11.8 years, ranging from 35 to 78 years, and the mean time from symptom onset to the time of scanning was 14.6 ± 8.2 months, ranging from 4 to 34 months. The mean score on the revised ALS functional rating scale [Cedarbaum et al., 1999] was 39.7 ± 6.3, ranging from 17 to 48. A more extensive description of the patient characteristics has been published elsewhere [Sage et al., 2007]. Patients were included in the study if there was no history of other neurological and/or vascular diseases. Patients with evidence of dementia of whatever type or of behavioral or cognitive changes were excluded.
Twenty‐six healthy age‐ and sex‐matched controls (11 male, 15 female) were concurrently examined. Their mean age was 53.7 ± 11.8 years, ranging from 35 to 77 years, and were included if there was no history of any other neurological and/or vascular disease.
Informed consent was obtained from all participants in accordance with the Declaration of Helsinki and the study was approved by the local ethical committee.
Data Acquisition
All patients and controls underwent MR examination on a 3T scanner (Intera, Philips, Best, The Netherlands) with an eight channel phased‐array head coil. A DTI SE‐EPI (DW single shot spin‐echo echoplanar imaging), with a data acquisition matrix = 112 × 112, field of view (FOV) = 220 × 220 mm2, repetition time = 7,916 ms, echo time = 68 ms, parallel imaging factor 2.5, 68 contiguous sagittal slices (slice thickness = 2.2 mm; voxel size = 2 × 2 × 2.2 mm3) covering the entire brain and the brainstem, was acquired. A pair of diffusion gradients was applied along 16 noncollinear directions with a b‐value of 800 s/mm2. Additionally, one set of images with no diffusion weighting (b = 0 s/mm2) was acquired. Three signal averages were used resulting in a scan time of 8:58 min. A T1‐weighted coronal 3D‐TFE (three‐dimensional turbo field echo; 182 contiguous coronal slices covering the whole brain and brainstem; FOV = 250 mm; echo time = 4.6 ms; repetition time = 9.7 ms; slice thickness = 1.2 mm; matrix size = 256 × 256; voxel size = 0.98 × 0.98 × 1.2 mm3; scan duration = 6:21 min) was consequently acquired.
Data Processing
An overview of the different steps of the data processing for the original and the new VBA and for the TBSS analysis is shown in Figure 1.
Figure 1.

Flow chart of the different steps of the data processing for the original and the new voxel‐based analysis and the tract‐based spatial statistics analysis. FA, fractional anisotropy; MD, mean diffusivity; FSL, FMRIB Software Library; FNIRT, FMRIB's Nonlinear Registration Tool; S(n)PM, Statistical (non‐) Parametric Mapping; MNI, Montreal Neurological Institute; VBA, voxel‐based analysis; TBSS, tract‐based spatial statistics.
For an extensive description of the preprocessing steps applied in the original analysis, our previous publication can be referred [Sage et al., 2007]. In short, after motion and eddy current correction of the DW images, FA and MD maps were generated using FSL‐dtifit software (FMRIB Software Library, The University of Oxford) and were coregistered to the anatomical T1‐weighted images using SPM2 (Statistical Parametric Mapping, University College London). Spatial normalization of these maps to the MNI template (Fig. 2A) was then performed by applying the nonlinear transformation determined on the T1‐weighted anatomical images. Finally, the spatially normalized FA and MD maps were smoothed with a Gaussian kernel of FWHM 6 mm.
Figure 2.

Two templates were used for spatial normalization of the FA and MD maps. In our original approach, we registered the subject's high‐resolution anatomical T1‐weighted image to the T1‐weighted Montreal Neurological Institute template (MNI) (A), of which a midcoronal (A, upper left), midsagittal (A, upper right), and an axial slice (A, lower left) are shown. The parameters of this transformation were subsequently applied to the FA and MD maps to bring these into MNI space. For this study, we built a population‐based diffusion tensor atlas from the DTI data of all subjects included in the study (B). This atlas was used as a template for registration of the FA and MD maps for both the new voxel‐based and the tract‐based spatial statistics analysis. A midcoronal (B, upper left), midsagittal (B, upper right), and an axial (B, lower left) slice of the DTI‐based color maps are shown (colors are according to the eigenvector associated with the largest eigenvalue, with red = left–right, green = anterior–posterior, and blue = inferior–superior and intensities are scaled in proportion to the magnitude of FA). As this atlas contains full diffusion tensor information, this information can be used to drive the coregistration process and it even allows performing whole‐brain fiber tractography [Jones et al., 2002] (B, lower right).
For the new VBA and TBSS analysis, the DW images were also motion and eddy current corrected using a linear affine registration by maximizing normalized mutual information between images using FSL‐FLIRT software. Additionally, the b‐matrix was corrected for the rotational component of the motion correction to ensure that errors in the diffusion weighting that originate from these rotations could be minimized [Landman et al., 2007a; Leemans and Jones, 2009]. Again, FSL‐dtifit software was used for generating FA and MD maps. All these preprocessing steps have been implemented in a software tool called CATNAP (Coregistration, Adjustment, and Tensor‐solving—a Nicely Automated Program), which was developed by Landman et al. [2007b].
For the coregistration of the DTI data for the new VBA, we employed an algorithm based on a viscous fluid model that was optimized for the multiple DTI information components and in which image correspondence is measured by the mutual information criterion [Van Hecke et al., 2007]. This coregistration consists of a combination of an affine and a nonrigid transformation: the affine coregistration corrects for global morphological differences and the nonrigid coregistration corrects for residual local morphological differences. Different information can be used to drive the coregistration process. For the affine method, FA was used to drive the coregistration, whereas for the nonrigid approach, we used the DT components in this respect. After coregistration, TR based on the preservation of principal direction (PPD) technique is performed to realign the tensors with the underlying microstructure [Alexander et al., 2001]. To remove the effect of deformation inaccuracies on the TR result, the final deformation field is smoothed with a Gaussian kernel of FWHM 3 mm and the DW images are recalculated to generate the finally transformed datasets. The size of smoothing kernel for smoothing of the final deformation field and other parameters of the algorithm were set in accordance with those found to be optimal in previous studies [D'Agostino et al., 2003; Leemans et al., 2005a; Van Hecke et al., 2007].
To evaluate whether this new coregistration algorithm could outperform our original approach, we compared empirical cumulative distribution functions (CDFs) of the coefficient of variance (COV) of the FA, MD, the transverse diffusivity (defined as the average of the second and third eigenvalue), and of the first, second, and third eigenvalue (L1, L2, and L3, respectively). These COV maps were computed by dividing the standard deviation map by the mean map of all subjects after coregistration to the T1‐weighted MNI template (Fig. 2A) for the original approach or to a population‐based DT atlas (Fig. 2B) for the new approach. As a WM mask is used in the data analysis (defined as all voxels having an FA larger than 0.2 in the mean FA map for that analysis), we also applied such a mask to the COV maps before generating the empirical CDFs.
To further improve the quality of the spatial normalization, we constructed a population‐based DTI atlas from the DTI data of all ALS patients and healthy controls included in this study. In a first step, the DTI datasets were coregistered affinely to the ICBM‐81 FA template [Mori et al., 2008]. Next, the population‐based DT atlas was generated by following the atlas construction methodology of Van Hecke et al. [2008], yielding a DTI atlas in MNI space that contains the full diffusion tensor information (Fig. 2B). In this approach, the magnitude of the deformation fields that are needed to warp the different images to the atlas is minimized and because no single subject is chosen as an initial reference dataset, this atlas will be unbiased toward a single subject topology.
For our new VBA, all motion‐ and eddy‐current corrected DTI datasets were nonrigidly coregistered to this specific population‐based atlas [Van Hecke et al., 2008]. Finally, the resulting FA and MD maps were spatially smoothed with a Gaussian kernel of FWHM of 6 mm, which is the same size of smoothing kernel we used for the original analysis.
Additionally, voxelwise statistical analysis of the FA and MD data was carried out using TBSS [Smith et al., 2006], part of FSL (version 4.2.1) [Smith et al., 2004]. All subjects' FA data were nonlinearly registered to the population‐based DTI atlas using the nonlinear registration tool FNIRT [Andersson et al., 2007a, b], which uses a b‐spline representation of the registration warp field [Rueckert et al., 1999]. Next, the mean FA image was created and thinned to create a mean FA skeleton which represents the centers of all tracts common to the group. The threshold for the mean FA skeleton was set at a value of 0.2 and each subject's aligned FA data were then projected onto this skeleton, yielding individual FA skeletons for all subjects. The nonlinear warps, skeleton and skeleton‐projection vectors derived from the main FA analysis were used to generate similar individual MD skeletons.
Data Analysis
In our original analysis, the spatially normalized and smoothed FA and MD maps were further analyzed using SPM2. Parametric two‐sample t‐tests were performed to assess any possible differences in FA and/or MD in whole brain WM between patients with ALS and healthy controls. Furthermore, correlation analyses were performed to investigate a possible effect of the score of the patients' score on the ALSFRS on FA or MD. For all analyses, threshold for statistical significance was set at P < 0.05 corrected for multiple comparisons [family‐wise error (FWE) correction].
For this study, we have chosen to perform nonparametric statistics on the FA maps because the distribution of FA values has been suggested to deviate from the normal distribution [Jones et al., 2005; Marenco et al., 2006]. In this view, we used the two‐sample t‐test plug‐in of the SnPM toolbox that is available for SPM5 [Holmes et al., 1996; Nichols and Holmes, 2002]. We also tested the FA maps of our original analysis nonparametrically to make a comparison of results less ambiguous.
As it is generally accepted that MD values follow a normal distribution throughout the brain [e.g., Pajevic and Basser, 2003], we performed a parametric two‐sample t‐test as described in our original analysis. Finally, the correlation of the patients' score on the ALSFRS with FA or MD was reassessed for FA and MD maps generated using the new approach. Again, for all analyses, statistical significance was assumed when P < 0.05 corrected for multiple comparisons (FWE).
To compare the FA and MD skeletons of the TBSS analysis of patients with ALS to those of the healthy controls, we performed nonparametric two‐sample t‐tests using the SnPM toolbox in SPM5. The correlation of the patients' score on the ALSFRS with FA or MD was also assessed. For all analyses, the threshold for statistical significance was set at P < 0.05 corrected for multiple comparisons (FWE).
RESULTS
Coefficient of Variance
The maps of the COV of FA and MD found in the original and new VBA are shown in Figure 3. The COV was significantly smaller when using the new approach compared with the original approach. The COV was especially lowered in the periventricular WM, both for FA and MD. A reduction of residual variance after coregistration to a template was also demonstrated in the CDFs of the COV (see Fig. 4), as for all variables, a leftward shift of the CDFs of the COV could be demonstrated when using the new compared with the original approach.
Figure 3.

Maps of the coefficient of variance (COV; COV = standard deviation/mean) for FA (A) and MD (B), in which the color‐coded COV values within the applied WM mask were overlaid on coronal, axial and sagittal slices of the mean FA map for the old analysis (A/B, upper part of figure) and on the FA map of the population‐based DT atlas for the new analysis (A/B, lower part of figure). The color bar indicates the colors corresponding to values of the COV between 0 and 1.
Figure 4.
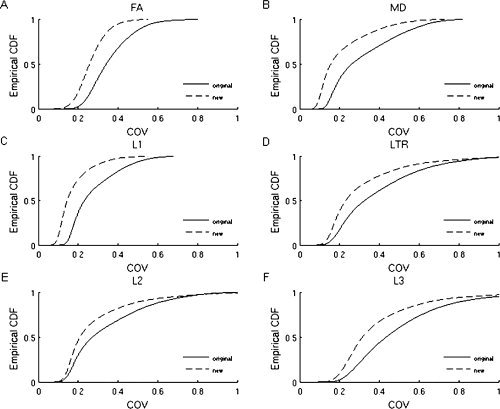
Empirical cumulative distribution functions of the coefficient of variance (COV; COV = standard deviation/mean), determined on the warped FA (A), MD (B), L1 (C), L2 (E), L3 (F), and transverse diffusivity (LTR) (D) maps used for the original (full lines) and new (dotted lines) voxel‐based analysis. The cumulative distribution function represents the value of COV to the percentage of the distribution with values less than or equal to that value. For the new analysis, the CDFs of the COV are shifted leftward for all variables, which indicates reduction of residual variance after coregistration to the population‐based diffusion tensor atlas.
VBA and TBSS Analysis of FA
Using our original approach, we found a pattern of reductions of FA in patients with ALS throughout the entire WM, including the CST, the WM underneath the premotor cortex and supplementary motor area and also extramotor WM areas, such as the (pre)frontal WM, the orbitofrontal WM, the insula, and the hippocampal formations (Fig. 5A).
Figure 5.
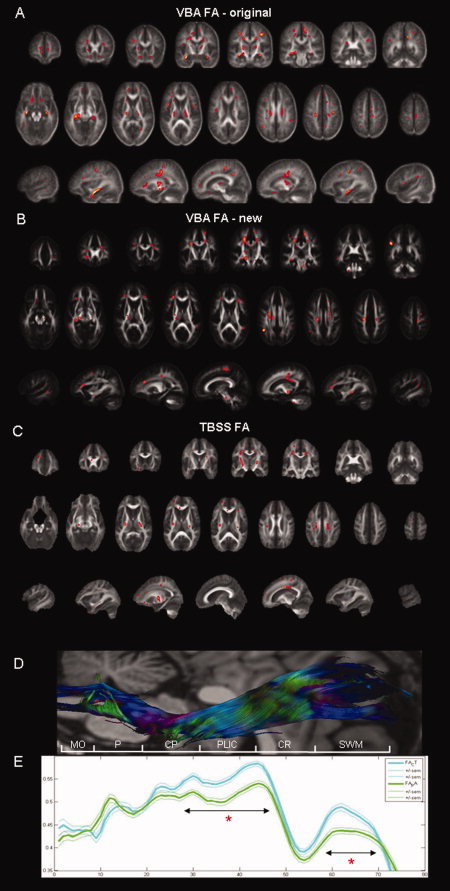
Results of the voxel‐based analysis (VBA), comparing the FA maps of ALS patients and controls that were generated for the original (A) and new (B) VBA and results of the comparison of the FA skeletons that were generated using tract‐based spatial statistics (TBSS) (C). WM regions in which a significant FA reduction could be demonstrated for ALS patients (n = 28) compared with controls (n = 26) using nonparametric statistics are shown in red on coronal/axial/sagittal slices of the mean FA map for the original VBA, of the FA map of the DTI atlas for the new VBA, and of the mean FA map of the TBSS analysis. Note that the results of the TBSS analysis have been enhanced for visualization purposes. A similar pattern of FA reductions in ALS patients that included both motor and extramotor WM areas was demonstrated. (E) In our original analysis, we assessed the WM integrity of the corticospinal tract (CST) by spatially interpolating the fiber tractography reconstructions of the corticospinal tracts, which allowed plotting the mean FA values (bold lines; thin lines indicate +/− standard error of the mean) over the entire cranio‐caudal course of the CST. This analysis showed that FA was significantly reduced in ALS patients (green) compared with controls (blue) at the level of the posterior limb of the internal capsule and the subcortical WM (indicated by double arrows and a red asterisk), which was also demonstrated in the original and new VBA, as well as in the TBSS analysis. A reconstructed mean CST (D) with DTI based color‐encoding overlaid on an anatomical image (flipped to match the x‐axes of the graphs) is shown for anatomical reference, together with a vertical bar in white indicating the anatomical structures belonging to the CST by following abbreviations: MO, medulla oblongata; P, pons; CP, cerebral peduncle; PLIC, posterior limb of the internal capsule; CR, corona radiata; SWM, subcortical WM.
In the new VBA, a similar pattern of FA reductions in the CST, beneath the premotor cortex, as well as in the (pre)frontal WM, the insula, and hippocampal formations, was observed in ALS patients compared with controls (Fig. 5B and Supporting Information Table I). Additionally, we also found this effect in the middle cerebral peduncle and the body of the corpus callosum. It should be noted, however, that not all previously reported clusters of significant FA reductions in patients with ALS compared with controls were found in the new VBA.
Comparing the FA skeletons of patients with ALS and controls in the TBSS analysis, we found a similar pattern of reduced FA within the CST, from the level of the cerebral peduncles up to the precentral gyrus, as well as in the (pre)frontal WM and the insula. Additionally, reduced FA was also demonstrated in the splenium and body of the corpus callosum and in the thalami (Fig. 5C).
For the CST, these results confirm our previously reported results of the analysis of the tract data, in which we demonstrated that the FA reduction was largely limited to the cranial parts of the CST (Fig. 5D,E).
VBA and TBSS Analysis of MD Maps
In our original analysis, a significant increase of MD in patients with ALS was restricted to the hippocampal formations, the right insula, and the pons (Fig. 6A).
Figure 6.
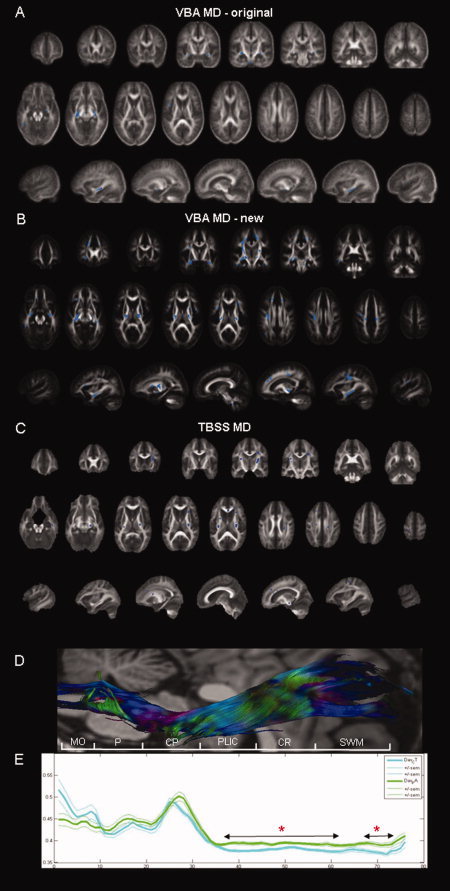
Results of the voxel‐based analysis (VBA), comparing the MD maps of patients with ALS and controls, generated for the original (A) and new (B) analysis and results of the comparison of the MD skeletons that were generated using tract‐based spatial statistics (TBSS) (C). WM regions in which a significant increase of MD could be demonstrated in patients with ALS compared with controls are shown in blue on coronal/axial/sagittal slices of the mean FA map for the original VBA, of the FA map of the DTI atlas for the new VBA and of the mean FA map of the TBSS analysis. Note that the results of the TBSS analysis have been enhanced for visualization purposes. In the original VBA, only a very limited number of clusters showed this effect, whereas in the new VBA and TBSS analysis, a more extensive pattern of significant increase in MD could be demonstrated. (E) In our original study, interpolation of the tract data of the reconstructions of the corticospinal tract (CST) showed that MD was significantly increased in patients with ALS (green) compared with controls (blue) in the cranial parts of the CST. In contradiction, no significant changes in MD within the CST were found in our original VBA. The new VBA and TBSS analysis show more congruent results, as significant MD changes in patients with ALS were found from the level of the internal capsule up to the level of the corona radiata. A reconstructed mean CST (C) with DTI based color‐encoding overlaid on an anatomical image (flipped to match the x‐axes of the graphs) is shown for anatomical reference, together with a vertical bar in white indicating the anatomical structures belonging to the CST (same abbreviations as in Fig. 5).
Using our new approach for VBA, a more extensive pattern of MD elevation can be observed (Fig. 6B). Compared with our original analysis, we found large clusters of an increase of MD within the CST, which were found from the level of the cerebral peduncles up to the corona radiata and precentral gyrus. We also found a significant increase of MD in the insula, the hippocampal formations, the temporal lobes, and the (pre)frontal WM yielding a more widespread pattern of MD changes in ALS patients compared with controls (Supporting Information Table I).
Using the TBSS approach, we found significant elevation of MD in the patients with ALS in the CST, from the level of the cerebral peduncles up to the level of the corona radiata, and in the insula, the hippocampal formations, the temporal lobe, the (pre)frontal WM, and the splenium of the corpus callosum (Fig. 6C).
For the CST, the results of our original VBA were not in agreement with the findings of the interpolation of the tract data [Sage et al., 2007]. In the latter analysis, we showed significantly increased MD in the cranial parts of the CST, which could not be confirmed in the VBA. In the new VBA and TBSS analysis, however, we showed a significant increase of MD within the cranial parts of the CST, which is now in accordance with our previously reported analysis of tract data (Fig. 6D,E).
Correlation Analysis of ALSFRS and FA
A strong positive correlation of the FA values with the patients' scores on the ALSFRS was demonstrated in our original analysis (Fig. 7A). The most prominent regions in which such a significant correlation was present bilaterally were the cranial parts of the CST and especially the (pre)frontal lobe.
Figure 7.
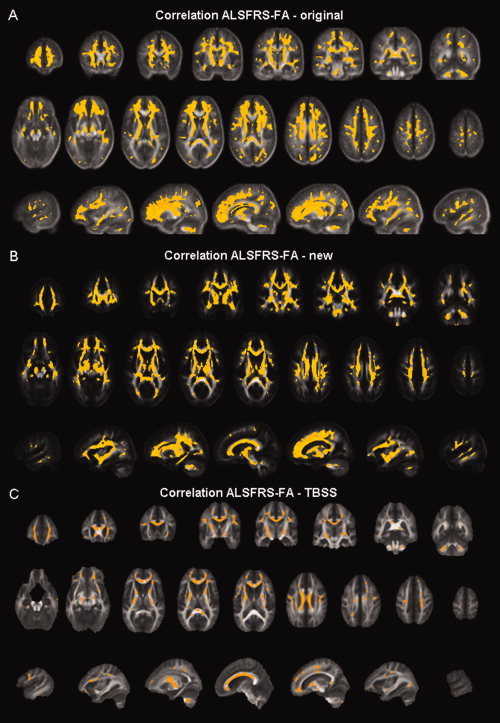
Regions showing significant positive correlation between FA values and the patients' scores on the ALS functional rating scale are shown in yellow on coronal/axial/sagittal slices of the mean FA map for the old voxel‐based analysis (A), of the FA map of the DTI atlas for the new voxel‐based analysis (B), and of the mean FA map of the tract‐based spatial statistics analysis (C). Note that the results of the TBSS analysis have been enhanced for visualization purposes. In all analyses, this correlation was present throughout the WM.
In our new VBA, a very similar pattern of positive correlation between the patients' scores on the ALSFRS and the FA values was found throughout the WM, with this correlation being present over the entire length of the CST (Fig. 7B). Again, the strongest correlation is demonstrated within the (pre)frontal lobe.
Using the TBSS approach, we found an almost identical pattern of positive correlation between the patients' scores on the ALSFRS and the FA values (Fig. 7C).
Correlation Analysis of ALSFRS and MD
In our original analysis, no significant correlation could be demonstrated of MD with the patients' scores on the ALSFRS (Fig. 8A).
Figure 8.

Regions showing significant negative correlation between MD values and the patients' scores on the ALS functional rating scale are shown in green on coronal/axial/sagittal slices of the mean FA map for the old voxel‐based analysis (VBA) (A), of the FA map of the DTI atlas for the new VBA (B) and of the mean FA map of the tract‐based spatial statistics analysis (C). Note that the results of the TBSS analysis have been enhanced for visualization purposes. No such correlation could be demonstrated in our original VBA, whereas in the new VBA and TBSS analysis, this correlation was clearly present.
However, using the new approach for VBA, a significant negative correlation of the MD values and the patients' scores on the ALSFRS was demonstrated within the CST, the hippocampal formations, the parietal and temporal lobe, and the cerebellum (Fig. 8B).
A very similar pattern of correlation between the patients' scores on the ALSFRS and the MD values was found when using the MD skeletons in the correlation analysis (Fig. 8C).
DISCUSSION
Recently, it has been demonstrated that the results of a VBA will depend on the selection of several postprocessing parameters. Not only do the results depend on the selection of the smoothing kernel [Jones et al., 2005] or the coregistration technique [Jones et al., 2007; Zhang et al., 2007], they have also been shown to depend on the choice of the reference system [Shen et al., 2005, 2007].
In this study, we have used a coregistration algorithm that was optimized for coregistration of DTI data and employed a population‐based DTI atlas to validate our previously published VBA, in which FA and MD maps of patients with ALS and healthy controls were compared. We also performed a TBSS analysis to compare the statistical results generated by different approaches for comparing DTI variables in whole‐brain WM. We demonstrate that, as the overall variance of the diffusion properties is lowered after normalizing the DTI data with such recently developed techniques (VBA using our own optimized high‐dimensional nonrigid coregistration and TBSS), more reliable voxel‐wise statistical results can be obtained than had previously been possible, with our VBA and TBSS yielding very similar results. This is especially the case for MD, for which we initially only found a few clusters of significant MD increase in patients with ALS and for which no significant correlation with the disease severity could be found. In the new VBA and TBSS analysis, a much more extensive pattern of MD changes in the brains of patients with ALS and a significant negative correlation of MD and the disease severity became evident.
In the following paragraphs, we will discuss different factors that may have influenced the results.
Processing of DTI Data
In this study, a population‐based DTI atlas is constructed that reliably contains the directional diffusion information using the nonrigid coregistration algorithm based on the viscous fluid model [Van Hecke et al., 2008]. It has been demonstrated that these population‐based DTI atlases outperform subject‐based DTI atlases in view of the registration precision [Van Hecke et al., 2008].
We choose to use all the data included in this study for generation of the population‐based DTI atlas, because our population mainly consists of older subjects and in ALS, grey matter and (to a lesser extent) WM atrophy have been found [Abrahams et al., 2005; Chang et al., 2005; Grosskreutz et al., 2006]. However, we should note that we did not find any significant grey matter or WM atrophy in our ALS patients in a voxel‐based volumetry analysis [Sage et al., 2007]. By also using patient data for the DTI atlas generation, we can take into account group‐specific variability that did not reach the significance level in the previous voxel‐based volumetry analysis. When comparing our DTI atlas to the MNI template, it seems that in our DTI atlas, the ventricles appear wider than in the MNI template and that different WM structures, such as the corpus callosum look thinner. This is in line with our expectations, because such effects have already been described in studies investigating aging in healthy subjects [Pagani et al., 2008; Walhovd et al., 2005].
Apart from the coregistration technique and the choice of template, the rotation of the b‐matrix [Landman et al., 2006; Leemans and Jones, 2009] may have contributed to the finding of different patterns of FA and MD changes or patterns of correlation between the disease severity and FA or MD. We repeated the original VBA after performing this b‐matrix correction to the motion and eddy current corrected DTI data and we found almost identical patterns of FA and MD differences between ALS patients and controls (see Supporting Information Fig. 1). Although it has been shown that the DTI reliability depends on this correction procedure, we believe that in our study, there is only a minor effect of applying this correction on the statistical results.
Furthermore, questions still remain when considering the optimal size of smoothing kernel to use for DTI studies, as was clearly demonstrated for the use of Gaussian smoothing kernels by Jones et al. [2005]. In this study, we did not explicitly assess the influence of the size of smoothing kernel on the statistical results. The size of smoothing kernel for the new VBA was set at a FWHM of 6 mm, which was the same size as we used for the original VBA.
Calculation of COV
To assess the performance of the nonrigid coregistration algorithm based on the viscous fluid model, we calculated the COV as an indicator of residual variance after coregistration to the template. Different sources of variation are contributing to the COV values found within the WM. First, natural intersubject variability will contribute to the variation measured by the COV. Second, as we included both patients with ALS and healthy controls in the COV calculations, the COV may be locally affected by patient‐control differences due to the pathology. Third, the remaining part of the variation can be explained by imperfect alignment and the presence of noise within the data. Another factor limiting the comparison of both VBA approaches is that no “gold standard” is available for these data. Therefore, it is very difficult to accurately assess the performance of different coregistration algorithms. In this study, we presume that a reduction of residual variation is beneficial to the quality of registration and that smaller residual variation leads to more reliable statistical results. The COV was generally lowered when nonrigid coregistration was used during postprocessing of the DTI images. This reduction of residual variation cannot be attributed to a reduction of intersubject variability, as we used data of the same subjects and intersubject variability will thus be equal between both analyses. We therefore conclude that using a nonrigid coregistration approach enhances the statistical results of a VBA, as has also been concluded by Zhang et al. [2007]. They demonstrated that the use of high‐dimensional methods improves both the COV of FA and the dyadic coherence (i.e., a measure that describes the variability in the dominant direction of diffusion) compared with a low‐dimensional FA registration approach. As no directional information is available for the T1‐weighted MNI template, the dyadic coherence cannot be calculated for the original approach. Therefore, this measure could not compared between the original and the new approach.
FA and MD in ALS
Different approaches and methodologies have been applied to evaluate possible changes of DTI variables in ALS. In these studies, FA has been assessed extensively, whereas fewer studies have evaluated MD.
ROI analyses have repeatedly been performed on DTI images of patients with ALS in other studies [Ellis et al., 1999; Toosy et al., 2003], but the ROI analysis technique suffers greatly from observer‐induced biases, as ROIs are placed manually on the images, at different levels of the CST. Another disadvantage of ROI analyses is that a very specific a priori hypothesis has to be formulated regarding the areas or tracts of interest. In this view, FT may be an interesting technique to semiautomatically delineate and study entire specific WM tracts. Abe et al. [2004] used the CST tract reconstructions to visualize the results of their VBA, whereas Wang et al. [2006] used the reconstructed tracts for the definitions of ROIs at the level of the posterior limb of the capsula interna. In our previous study, we interpolated the tract reconstructions to get a more detailed insight in the FA and MD values over the entire course of the CST in patients with ALS and healthy controls and found that WM was affected in the cranial parts of the CST [Sage et al., 2007]. Using probabilistic FT in ALS, Ciccarelli et al. [2006] demonstrated reduced FA and reduced connectivity measures within the CST.
To extend the view beyond a specific WM tract to the whole‐brain WM, VBA has been generally used. In our original VBA, we demonstrated a pattern of reduced FA in both motor and extramotor areas. In our new VBA and TBSS analysis, we showed largely similar patterns of FA, with FA being significantly lowered within the CST from the level of the cerebral peduncles up to the corona radiata. Regarding the CST, other VBA studies [Abe et al., 2004; Agosta et al., 2007; Sach et al., 2004] and a TBSS analysis [Ciccarelli et al., 2008] have reported very similar findings of decreased FA throughout this WM tract.
In both the new VBA and the TBSS analysis, significant FA reductions were demonstrated within the (pre)frontal WM and the insula. Such (pre)frontal WM changes were also described in previous VBA and TBSS analyses [Abe et al., 2004; Ciccarelli et al., 2008]. The FA changes within the (pre)frontal WM and insula may provide a pathological substrate for the cognitive impairment that has been described extensively in patients with ALS, with typical involvement of frontal executive functions [Abrahams et al., 2005; Chang et al., 2005; Lomen‐Hoerth et al., 2002; Phukan et al., 2007]. Most patients are reported to have mild cognitive impairment, with subtle executive deficits, of which verbal fluency is most commonly found to be impaired [Abrahams et al., 1996; Phukan et al., 2007; Ringholz et al., 2005]. Although there has been disagreement about memory deficits in ALS, in one of the largest studies of ALS so far, executive dysfunction alongside mild memory decline has been described in 47% of the included ALS patients [Ringholz et al., 2005]. In about 15% of patients with ALS in that study, frontotemporal dementia was a concomitant clinical finding. In this view, the finding of reduced FA in the temporal poles and hippocampal formations in our study may reflect such functional impairments. Only in a part of the patients, frontotemporal regions appear to be affected sufficiently to give rise to overt cognitive changes. However, we should note that none of our patients showed overt signs of cognitive impairment nor did we perform an extensive neuropsychological assessment of our patients, so we cannot directly validate this idea in our population. This finding supports the view that ALS involves the entire frontotemporal brain, even in cognitively unimpaired patients with ALS.
Furthermore, a significant decrease of FA in the corpus callosum was demonstrated in our new analyses, which was not present in our original VBA, but which has been described in other studies [Agosta et al., 2007; Bartels et al., 2008; Ciccarelli et al., 2008; Sach et al., 2004]. These reductions of FA within the body of the corpus callosum might be related to the findings of impaired transcallosal inhibition in patients with ALS and the presence of mirror movements in a number of patients [Bartels et al., 2008; Karandreas et al., 2007; Wittstock et al., 2007], because anatomically, the central part of the corpus callosum is the area of interhemispheric fibers between the motor cortices. The impairment of the corpus callosum might thus provide an additional mechanism for motor manifestations of the disease [Wittstock et al., 2007].
Finally, in our TBSS analysis, we also demonstrated significant reduction of FA within the thalami. Although this was also described by Sach et al. [2004], we did not find this effect in our new VBA. However, after checking all data processing steps of the new VBA, it appears that this discrepancy can simply be explained by the fact that large parts of the thalami were omitted by the WM mask that was applied for the VBA, the extent of which can be appreciated in Figure 3.
These consistent findings within the CST and in extramotor WM areas suggest that reduction of FA may be used as a biomarker for neurodegenerative changes in ALS [Turner et al., 2009]. In general, reduction of FA has been associated with neuronal loss with astrogliosis and myelin breakdown [Beaulieu et al., 1996]. In ALS, post‐mortem examinations have shown neuronal loss or atrophy and ubiquitin‐positive intraneuronal inclusions extending beyond the motor system in patients with ALS with and without cognitive impairment [Mackenzie and Feldman, 2003; Murray et al., 2006; Tsuchiya et al., 2002]. Also, functional imaging studies have demonstrated hypometabolism in frontal and temporal cortices [Abrahams et al., 1996; Kew et al., 1993], which further provides support for ALS as being a multisystem disease.
In the VBA and the TBSS voxel‐based correlation analyses of the FA maps, we found largely similar results for the original and the new VBA and TBSS analysis, showing a significant positive correlation with the patients' score on the ALSFRS throughout the WM (see Fig. 7). Previous reports have been inconsistent in correlating diffusion parameters with measures of disease severity or disease progression [Agosta et al., 2007; Ciccarelli et al., 2008; Ellis et al., 1999; Sage et al., 2007; Toosy et al., 2003; Wang et al., 2006]. This may be explained by the different methodologies and approaches that were used for evaluation of such correlations, but also by the different composition of the patient groups that were included in different studies. Furthermore, another factor that might limit the comparison of different studies is the intrinsic heterogeneity of the pathologic process [Agosta et al., 2007]. In this view, longitudinal follow‐up studies with large patient groups and extensive clinical, neuropsychological, and cognitive testing are needed to validate the use of FA as a possible biomarker for neurodegeneration and/or disease progression.
For the MD maps, both in the VBA and the TBSS analysis and the corresponding voxel‐based correlation analysis, more extensive patterns of MD increase in patient with ALS compared with controls were found compared with the original study. In the original VBA, the increase of MD was limited to mostly extramotor areas, such as the hippocampal formations and the insula. These results were somewhat contradictory to the results of the analysis of the FT reconstructions of the CST, in which we demonstrated a significant increase of MD within the cranial parts of the CST. We therefore suggested that an in‐depth analysis of the FT reconstructions may be more sensitive than a VBA to detect such changes. In the new VBA and TBSS analysis, however, we were able to demonstrate significant increases of MD in the cranial parts of the CST, which is in accordance with the analysis of the FT reconstructions of the CST (see Fig. 6D,E). Agosta et al. [2007] did not find any significant increases of MD within the CST, but they also reported similar MD increases in the frontal and temporal WM as we demonstrate in our new VBA and TBSS analysis. Again, these WM impairments may reflect the functional cognitive and memory impairments that are often reported in ALS patients [Abrahams et al., 1996; Phukan et al., 2007; Ringholz et al., 2005], although we cannot justify this suggestion within our population because no extensive neuropsychological testing was performed. To our knowledge, no other VBA or TBSS studies have been performed on MD maps. Neuropathologically, increase of MD has been suggested to reflect gliosis and increase of the extracellular space, which occurs as a consequence of neuronal degeneration [Pierpaoli et al., 2001].
For the voxel‐based correlation analysis, the difference between the original and the new VBA and TBSS analysis is even more striking. Whereas we did not find any clusters of significant correlation between MD and the patients' score on the ALSFRS in our original analysis, we found an extensive pattern of such significant positive correlation in our new VBA and TBSS analysis. These findings could be explained by the lower residual variance of MD after coregistration to the DT atlas, which might increase the sensitivity of the VBA. No other studies have evaluated a possible correlation between the patients' score on the ALSFRS and MD in a voxel‐wise manner. Again, longitudinal follow‐up studies with large patient groups and extensive clinical, neuropsychological, and cognitive testing are needed to validate the use of MD as a possible biomarker for neurodegeneration and/or disease progression.
Comparing the differences in results for FA and MD, we find that the effect of using improved coregistration is larger for MD than for FA. This may be explained by the fact that in the original analysis, the COV after registration to the MNI template is generally larger for MD than for FA, as shown in Figures 3 and 4. Furthermore, as can be seen in Figure 4, the first eigenvalue image alignment is improved more significantly in the new analysis than the alignment of the second and third eigenvalue. As the first and largest eigenvalue will determine the diffusion tensor to a greater extent compared with the smaller second and third eigenvalues, the use of the full diffusion tensor during coregistration will especially reduce the residual misalignment of the first eigenvalue maps. It can be demonstrated that, for anisotropic tensors, the lower COV of the first eigenvalues especially affects the COV of the MD maps, compared with the COV of the FA images (using a first order Taylor expansion). This is in agreement with our results, particularly demonstrating an increase in the sensitivity of the MD statistics, caused by an improved image alignment.
VBA Versus TBSS
In this study, we matched all possible factors between our optimized VBA and the TBSS analysis, including the nonparametric approach for statistical analysis. Although the true effect of pathology on the diffusion data is unknown for our population, the largely overlapping results for both techniques advocate that the WM areas shown to be affected are truly implicated in the disease process of ALS. The exact cause of the few discrepant findings between the TBSS and VBA approach is difficult to retrieve. Note, however, that a direct comparison between VBA and TBSS is not trivial as the results from both approaches depend on multiple factors within each processing pipeline. For instance, the implementation and settings of the applied coregistration algorithms may differ as well as the template used during these normalization procedures. In addition, spatial smoothing is generally needed in standard VBA before performing statistical analyses, which also affects the results [Jones et al., 2005]. Furthermore, different statistical approaches may be utilized, rendering the direct comparison of results obtained with different approaches and software packages rather problematic. Objective comparisons between (optimized) VBA and TBSS results in terms of sensitivity and specificity can only be achieved when characteristics, such as size, shape, position, and change in diffusion properties of the disease are known a priori for each subject's data set. In this context, recent developments in constructing synthetic DTI data sets—in which pathology characteristics can be simulated in a voxelwise framework—will contribute to such quantitative reliability analyses when evaluating the numerous steps and parameter settings of the processing pipeline in DTI‐based group analyses [Leemans et al., 2005b; Van Hecke et al., 2009]. The finding of largely overlapping results for both FA and MD in our new VBA and the TBSS analysis may suggest that a VBA can yield reliable results, as long as nonlinear coregistration with use of the of the DTI data. Furthermore, the use of a population‐based template may also enhance the VBA and TBSS results, as both the natural effects of aging and possible nondetectable atrophy were taken into account.
CONCLUSION
In conclusion, we demonstrate that by using improved coregistration and a population‐based DTI atlas for the postprocessing of DTI data, the reliability of VBA and voxel‐based correlation analyses can be improved. This is especially the case for MD, as the effect of improved coregistration will have a larger effect on the COV of MD compared with the COV of FA. The sensitivity of a VBA can be comparable with that of an in‐depth analysis of fibertractography reconstructions and TBSS analyses if the residual variance after coregistration to a template is minimized. As we find both FA and MD changes throughout the brain WM of patients with ALS, this study supports the notion of ALS being a multisystem disease in which the entire frontotemporal lobe is implicated. Moreover, as correlations of FA and MD with the disease severity were found throughout the WM, this study provides support for a potential role of FA and/or MD as a biomarker for the pathological process in ALS.
Supporting information
Additional Supporting Information may be found in the online version of this article.
Supporting Information Figure 1. Results of the original voxel‐based analysis for FA (A) and MD (C). These results were obtained using FA and MD maps that were derived from DTI data after motion and eddy current correction. If an additional b‐matrix correction for the rotational component of the motion correction is applied to the motion and eddy current corrected DTI data, the results for FA (B) and MD (D) show only very minor differences compared with the results obtained without this additional correction.
Supporting Information Table 1. Anatomical location, cluster size and statistics (T‐value and corresponding p‐value that were found in the non‐parametric two‐sample t‐tests) of significant FA reductions and MD elevations in ALS patients compared to controls in the new voxel‐based analysis. CC = corpus callosum; CST = corticospinal tract; CP = cerebral peduncle; CR = corona radiata; PLIC = posterior limb of the internal capsule; WM = white matter; L = left; R = right.
REFERENCES
- Abe O,Yamada H,Masutani Y,Aoki S,Kunimatsu A,Yamasue H,Fukuda R,Kasai K,Hayashi N,Masumoto T,Mori H,Soma T,Ohtomo K ( 2004): Amyotrophic lateral sclerosis: Diffusion tensor tractography and voxel‐based analysis. NMR Biomed 17: 411–416. [DOI] [PubMed] [Google Scholar]
- Abrahams S,Goldstein LH,Kew JJ,Brooks DJ,Lloyd CM,Frith CD,Leigh PN ( 1996): Frontal lobe dysfunction in amyotrophic lateral sclerosis. A PET study. Brain 119 (Part 6): 2105–2120. [DOI] [PubMed] [Google Scholar]
- Abrahams S,Goldstein LH,Suckling J,Ng V,Simmons A,Chitnis X,Atkins L,Williams SCR,Leigh PN ( 2005): Frontotemporal white matter changes in amyotrophic lateral sclerosis. J Neurol 252: 321–331. [DOI] [PubMed] [Google Scholar]
- Agosta F,Pagani E,Rocca MA,Caputo D,Perini M,Salvi F,Prelle A,Filippi M ( 2007): Voxel‐based morphometry study of brain volumetry and diffusivity in amyotrophic lateral sclerosis patients with mild disability. Hum Brain Mapp 28: 1430–1438. [DOI] [PMC free article] [PubMed] [Google Scholar]
- Alexander DC,Gee JC,Bajcsy R ( 1999): Elastic matching of diffusion tensor MRIs. Computer Vision Image Understand 1: 244–249. [Google Scholar]
- Alexander DC,Pierpaoli C,Basser PJ,Gee JC ( 2001): Spatial transformations of diffusion tensor magnetic resonance images. IEEE Trans Med Imag 20: 1131–1139. [DOI] [PubMed] [Google Scholar]
- Andersson JLR,Jenkinson M,Smith SA ( 2007a): Non‐linear optimization. FMRIB Technical Report TR07JA1. FMRIB Analysis Group of the University of Oxford.
- Andersson JLR,Jenkinson M,Smith SA ( 2007b): Non‐linear registration, aka Spatial normalization. FMRIB Technical Report TR07JA2. FMRIB Analysis Group of the University of Oxford.
- Ardekani S,Sinha U ( 2006): Statistical representation of mean diffusivity and fractional anistropy brain maps of mormal subjects. J Magn Resonan Imag 24: 1243–1251. [DOI] [PubMed] [Google Scholar]
- Bartels C,Mertens N,Hofer S,Merboldt KD,Dietrich J,Frahm J,Ehrenreich H ( 2008): Callosal dysfunction in amyotrophic lateral sclerosis correlates with diffusion tensor imaging of the central motor system. Neuromuscul Disord 18: 398–407. [DOI] [PubMed] [Google Scholar]
- Basser PJ,Pierpaoli C ( 1996): Microstructural and physiological features of tissues elucidated by quantitative‐diffusion‐tensor MRI. J Magn Resonan Ser B 111: 209–219. [DOI] [PubMed] [Google Scholar]
- Basser PJ,Mattiello J,Lebihan D ( 1994): MR diffusion tensor spectroscopy and imaging. Biophys J 66: 259–267. [DOI] [PMC free article] [PubMed] [Google Scholar]
- Beaulieu C ( 2002): The basis of anisotropic water diffusion in the nervous system—A technical review. NMR Biomed 15(7–8): 435–55. [DOI] [PubMed] [Google Scholar]
- Beaulieu C,Does MD,Snyder RE,Allen PS ( 1996): Changes in water diffusion due to Wallerian degeneration in peripheral nerve. Magn Reson Med 36: 627–631. [DOI] [PubMed] [Google Scholar]
- Borroni B,Brambati SM,Agosti C,Gipponi S,Bellelli G,Gasparotti R,Garibotto V,Di Luca M,Scifo P,Perani D,Padovani A ( 2007): Evidence of white matter changes on diffusion tensor imaging in frontotemporal dementia. Arch Neurol 64: 246–251. [DOI] [PubMed] [Google Scholar]
- Brooks BR,Miller RG,Swash M,Munsat TL ( 2000): El Escorial revisited: Revised criteria for the diagnosis of amyotrophic lateral sclerosis. Amyotroph Lateral Scler Other Motor Neuron Disord 1: 293–299. [DOI] [PubMed] [Google Scholar]
- Cedarbaum JM,Stambler N,Malta E,Fuller C,Hilt D,Thurmond B,Nakanishi A,Grp BAS ( 1999): The ALSFRS‐R: A revised ALS functional rating scale that incorporates assessments of respiratory function. J Neurolog Sci 169(1–2): 13–21. [DOI] [PubMed] [Google Scholar]
- Chang JL,Lomen‐Hoerth C,Murphy J,Henry RG,Kramer JH,Miller BL,Gorno‐Tempini ML ( 2005): A voxel‐based morphometry study of patterns of brain atrophy in ALS and ALS/FTLD. Neurology 65: 75–80. [DOI] [PubMed] [Google Scholar]
- Ciccarelli O,Behrens TE,Altmann DR,Orrell RW,Howard RS,Johansen‐Berg H,Miller DH,Matthews PM,Thompson AJ ( 2006): Probabilistic diffusion tractography: A potential tool to assess the rate of disease progression in amyotrophic lateral sclerosis. Brain 129(Pt 7): 1859–71. [DOI] [PubMed] [Google Scholar]
- Ciccarelli O,Behrens TE,Johansen‐Berg H,Talbot K,Orrell RW,Howard RS,Nunes RG,Miller DH,Matthews PM,Thompson AJ,Smith SM ( 2009): Investigation of white matter pathology in ALS and PLS using tract‐based spatial statistics. Hum Brain Mapp 30: 615–624. [DOI] [PMC free article] [PubMed] [Google Scholar]
- D'Agostino E,Maes F,Vandermeulen D,Suetens P ( 2003): A viscous fluid model for multimodal non‐rigid image registration using mutual information. Med Image Anal 7: 565–575. [DOI] [PubMed] [Google Scholar]
- Ellis CM,Simmons A,Jones DK,Bland J,Dawson JM,Horsfield MA,Williams SC,Leigh PN ( 1999): Diffusion tensor MRI assesses corticospinal tract damage in ALS. Neurology 53: 1051–1058. [DOI] [PubMed] [Google Scholar]
- Goodlett C,Davis B,Jean R,Gilmore J,Gerig G ( 2006): Improved correspondence for DTI population studies via unbiased atlas building. Medical Image Comput Computer‐Assist Interv Miccai Part 2 4191: 260–267. [DOI] [PubMed] [Google Scholar]
- Grosskreutz J,Kaufmann J,Fradrich J,Dengler R,Heinze HJ,Peschel T ( 2006): Widespread sensorimotor and frontal cortical atrophy in amyotrophic lateral sclerosis. BMC Neurol 6: 17. [DOI] [PMC free article] [PubMed] [Google Scholar]
- Guimond A,Meunier J,Thirion JP ( 2000): Average brain models: A convergence study. Computer Vision Image Understand 77: 192–210. [Google Scholar]
- Holmes AP,Blair RC,Watson JDG,Ford I ( 1996): Nonparametric analysis of statistic images from functional mapping experiments. J Cerebral Blood Flow Metabolism 16: 7–22. [DOI] [PubMed] [Google Scholar]
- Jones DK, Griffin LD, Alexander DC, Catani M, Horsfield MA, Howard R, Williams SC ( 2002): Spatial normalization and averaging of diffusion tensor MRI data sets. Neuroimage 17: 592–617. [PubMed] [Google Scholar]
- Jones DK,Symms MR,Cercignani M,Howard RJ ( 2005): The effect of filter size on VBM analyses of DT‐MRI data. Neuroimage 26: 546–554. [DOI] [PubMed] [Google Scholar]
- Jones DK,Chitnis X,Job D,Khong PL,Leung LT,Marenco S,Smith SM,Symms MR ( 2007): What happens when nine different groups analyze the same DT‐MRI data set using voxel‐based methods? ISMRM 15th Annual Meeting, Berlin.
- Karandreas N,Papadopoulou M,Kokotis P,Papapostolou A,Tsivgoulis G,Zambelis T ( 2007): Impaired interhemispheric inhibition in amyotrophic lateral sclerosis. Amyotrophic Lateral Sclerosis 8: 112–118. [DOI] [PubMed] [Google Scholar]
- Kew JJM,Leigh PN,Playford ED,Passingham RE,Goldstein LH,Frackowiak RSJ,Brooks DJ ( 1993): Cortical function in amyotrophic‐lateral‐sclerosis—A positron emission tomography study. Brain 116: 655–680. [DOI] [PubMed] [Google Scholar]
- Kyriakopoulos M,Vyas NS,Barker GJ,Chitnis XA,Frangou S ( 2008): A diffusion tensor imaging study of white matter in early‐onset schizophrenia. Biol Psychiatry 63: 519–23. [DOI] [PubMed] [Google Scholar]
- Landman BA,Farrell JA,Mori S,Van Zijl PCM,Prince JL ( 2006): On the Coregistration of Diffusion Weighted Images. Seattle: International Society for Magnetic Resonance Imaging in Medicine. [Google Scholar]
- Landman BA,Farrell JA,Jones CK,Smith SA,Prince JL,Mori S ( 2007a) Effects of diffusion weighting schemes on the reproducibility of DTI‐derived fractional anisotropy, mean diffusivity, and principal eigenvector measurements at 1.5T. Neuroimage 36: 1123–1138. [DOI] [PMC free article] [PubMed] [Google Scholar]
- Landman BA,Farrell JA,Nera‐Lee P,Mori S,Prince JL ( 2007b): DTI Fiber Tracking: The Importance of Adjusting DTI Gradient Tables for Motrion Correction. CATNAP—A Tool to Simplify and Accelarate DTI Analysis. Illinois: Organization for Human Brain Mapping. [Google Scholar]
- Leemans A,Jones DK: The B‐matrix must be rotated when correcting for subject motion in DTI data. Magn Resonan Med 2009. March 24 (Epub ahead of print). [DOI] [PubMed] [Google Scholar]
- Leemans A,Sijbers J,De Backer S,Vandervliet E,Parizel PM ( 2005a): Affine coregistration of diffusion tensor magnetic resonance images using mutual information. Advanced Concepts for Intelligent Vision Systems, Volume 3708 pp 523–530. [Google Scholar]
- Leemans A,Sijbers J,Verhoye M,Van der Linden A,Van Dyck D ( 2005b) Mathematical framework for simulating diffusion tensor MR neural fiber bundles. Magn Reson Med 53: 944–53. [DOI] [PubMed] [Google Scholar]
- Lomen‐Hoerth C,Anderson T,Miller B ( 2002): The overlap of amyotrophic lateral sclerosis and frontotemporal dementia. Neurology 59: 1077–1079. [DOI] [PubMed] [Google Scholar]
- Mackenzie IR,Feldman H ( 2003): The relationship between extramotor ubiquitin‐immunoreactive neuronal inclusions and dementia in motor neuron disease. Acta Neuropathol 105: 98–102. [DOI] [PubMed] [Google Scholar]
- Marenco S,Rawlings R,Rohde GK,Barnett AS,Hone RA,Pierpaoli C,Weinberger DR ( 2006): Regional distribution of measurement error in diffusion tensor imaging. Psychiatry Research: Neuroimag 147: 69–78. [DOI] [PMC free article] [PubMed] [Google Scholar]
- Mori S,Oishi K,Jiang HY,Jiang L,Li X,Akhter K,Hua KG,Faria AV,Mahmood A,Woods R,Toga AW,Pike GB,Neto PR,Evans A,Zhang J,Huang H,Miller MI,Van Zijl P,Mazziota J ( 2008): Stereotaxic white matter atlas based on diffusion tensor imaging in an ICBM template. Neuroimage 40: 570–582. [DOI] [PMC free article] [PubMed] [Google Scholar]
- Murray C,Viehman A,Lippa CF ( 2006): The corpus callosum in Pick's disease, Alzheimer's disease, and amyotrophic lateral sclerosis: Gliosis implies possible clinical consequence. Am J Alzheimers Dis Other Demen 21: 37–43. [DOI] [PMC free article] [PubMed] [Google Scholar]
- Nichols TE,Holmes AP ( 2002): Nonparametric permutation tests for functional neuroimaging: A primer with examples. Human Brain Mapp 15: 1–25. [DOI] [PMC free article] [PubMed] [Google Scholar]
- Pagani E,Agosta F,Rocca MA,Caputo D,Filippi M ( 2008): Voxel‐based analysis derived from fractional anisotropy images of white matter volume changes with aging. Neuroimage 41: 657–667. [DOI] [PubMed] [Google Scholar]
- Pajevic S,Basser PJ ( 2003): Parametric and non‐parametric statistical analysis of DT‐MRI data. J Magn Resonan 161: 1–14. [DOI] [PubMed] [Google Scholar]
- Park HJ,Kubicki M,Shenton ME,Guimond A,McCarley RW,Maier SE,Kikinis R,Jolesz FA,Westin CF ( 2003): Spatial normalization of diffusion tensor MRI using multiple channels. Neuroimage 20: 1995–2009. [DOI] [PMC free article] [PubMed] [Google Scholar]
- Park HJ,Westin CF,Kubicki M,Maier SE,Niznikiewicz M,Baer A,Frumin M,Kikinis R,Jolesz FA,McCarley RW,Shenton ME ( 2004): White matter hemisphere asymmetries in healthy subjects and in schizophrenia: A diffusion tensor MRI study. Neuroimage 23: 213–223. [DOI] [PMC free article] [PubMed] [Google Scholar]
- Phukan J,Pender NP,Hardiman O ( 2007): Cognitive impairment in amyotrophic lateral sclerosis. Lancet Neurol 6: 994–1003. [DOI] [PubMed] [Google Scholar]
- Pierpaoli C,Barnett A,Pajevic S,Chen R,Penix L,Virta A,Basser P ( 2001): Water diffusion changes in Wallerian degeneration and their dependence on white matter architecture. Neuroimage 13: 1174–1185. [DOI] [PubMed] [Google Scholar]
- Reich DS,Zackowski KM,Gordon‐Lipkin EM,Smith SA,Chodkowski BA,Cutter GR,Calabresi PA ( 2008): Corticospinal tract abnormalities are associated with weakness in multiple sclerosis. Am J Neuroradiol 29: 333–339. [DOI] [PMC free article] [PubMed] [Google Scholar]
- Ringholz GM,Appel SH,Bradshaw M,Cooke NA,Mosnik DM,Schulz PE ( 2005): Prevalence and patterns of cognitive impairment in sporadic ALS. Neurol 65: 586–590. [DOI] [PubMed] [Google Scholar]
- Rueckert D,Sonoda LI,Hayes C,Hill DL,Leach MO,Hawkes DJ ( 1999): Nonrigid registration using free‐form deformations: Application to breast MR images. IEEE Trans Med Imaging 18: 712–721. [DOI] [PubMed] [Google Scholar]
- Sach M,Winkler G,Glauche V,Liepert J,Heimbach B,Koch MA,Buchel C,Weiller C ( 2004): Diffusion tensor MRI of early upper motor neuron involvement in amyotrophic lateral sclerosis. Brain 127: 340–350. [DOI] [PubMed] [Google Scholar]
- Sage CA,Peeters RR,Gorner A,Robberecht W,Sunaert S ( 2007): Quantitative diffusion tensor imaging in amyotrophic lateral sclerosis. Neuroimage 34: 486–499. [DOI] [PubMed] [Google Scholar]
- Seok JH,Park HJ,Chun HW,Lee SK,Cho HS,Kwon JS,Kim JJ ( 2007): White matter abnormalities associated with auditory hallucinations in schizophrenia: A combined study of voxel‐based analyses of diffusion tensor imaging and structural magnetic resonance imaging. Psychiatry Res: Neuroimag 156: 93–104. [DOI] [PubMed] [Google Scholar]
- Shen S,Szameitat AJ,Sterr A ( 2005): A Template Effect Study on Voxel‐Based Morphometry in Statistic Parametric Mapping. IEEE; pp 3051–3054. [DOI] [PubMed] [Google Scholar]
- Shen S,Szameitat AJ,Sterr A ( 2007): VBM lesion detection depends on the normalization template: A study using simulated atrophy. Magn Resonan Imag 25: 1385–1396. [DOI] [PubMed] [Google Scholar]
- Smith SM,Jenkinson M,Woolrich MW,Beckmann CF,Behrens TE,Johansen‐Berg H,Bannister PR,De Luca M,Drobnjak I,Flitney DE,Niazy RK,Saunders J,Vickers J,Zhang Y,De Stefano N,Brady JM,Matthews PM ( 2004): Advances in functional and structural MR image analysis and implementation as FSL. Neuroimage 23 ( Suppl 1): S208–S219. [DOI] [PubMed] [Google Scholar]
- Smith SM,Jenkinson M,Johansen‐Berg H,Rueckert D,Nichols TE,Mackay CE,Watkins KE,Ciccarelli O,Cader MZ,Matthews PM,Behrens TE ( 2006): Tract‐based spatial statistics: Voxelwise analysis of multi‐subject diffusion data. Neuroimage 31: 1487–1505. [DOI] [PubMed] [Google Scholar]
- Studholme C,Cardenas V ( 2004): A template free approach to volumetric spatial normalization of brain anatomy. Pattern Recogn Lett 25: 1191–1202. [Google Scholar]
- Thomas B,Eyssen M,Peeters R,Molenaers G,Van Hecke P,De Cock P,Sunaert S ( 2005): Quantitative diffusion tensor imaging in cerebral palsy due to periventricular white matter injury. Brain 128: 2562–2577. [DOI] [PubMed] [Google Scholar]
- Toosy AT,Werring DJ,Orrell RW,Howard RS,King MD,Barker GJ,Miller DH,Thompson AJ ( 2003): Diffusion tensor imaging detects corticospinal tract involvement at multiple levels in amyotrophic lateral sclerosis. J Neurol Neurosurgery Psychiatry 74: 1250–1257. [DOI] [PMC free article] [PubMed] [Google Scholar]
- Tsuchiya K,Ikeda K,Mimura M,Takahashi M,Miyazaki H,Anno M,Shiotsu H,Akabane H,Niizato K,Uchihara T,Tominaga I,Nakano I ( 2002): Constant involvement of the Betz cells and pyramidal tract in amyotrophic lateral sclerosis with dementia: A clinicopathological study of eight autopsy cases. Acta Neuropathol 104: 249–259. [DOI] [PubMed] [Google Scholar]
- Turner MR,Kiernan MC,Leigh PN,Talbot K ( 2009): Biomarkers in amyotrophic lateral sclerosis. Lancet Neurol 8: 94–109. [DOI] [PubMed] [Google Scholar]
- Van Hecke W,Leemans A,D'Agostino E,De Backer S,Vandervliet E,Parizel PM,Sijbers J ( 2007): Nonrigid coregistration of diffusion tensor images using a viscous fluid model and mutual information. IEEE Trans Med Imag 26: 1598–1612. [DOI] [PubMed] [Google Scholar]
- Van Hecke W,Sijbers J,D'Agostino E,Maes F,De Backer S,Vandervliet E,Parizel PM,Leemans A ( 2008): On the construction of an inter‐subject diffusion tensor magnetic resonance atlas of the healthy human brain. Neuroimage 43: 69–80. [DOI] [PubMed] [Google Scholar]
- Van Hecke W,Leemans A,De Backer S,Poot D,Vandervliet E,Parizel PM,Sijbers J: On the construction of a ground truth methodology to evaluate VBM analysis results of diffusion tensor images. Neuroimage 2009. March 9 (Epub ahead of print). [DOI] [PubMed] [Google Scholar]
- Walhovd KB,Fjell AM,Reinvang I,Lundervold A,Dale AM,Eilertsen DE,Quinn BT,Salat D,Makris N,Fischl B ( 2005): Effects of age on volumes of cortex, white matter and subcortical structures. Neurobiol Aging 26: 1261–1270. [DOI] [PubMed] [Google Scholar]
- Wang S,Poptani H,Bilello M,Wu X,Woo JH,Elman LB,McCluskey LF,Krejza J,Melhem ER ( 2006): Diffusion tensor imaging in amyotrophic lateral sclerosis: Volumetric analysis of the corticospinal tract. AJNR Am J Neuroradiol 27: 1234–1238. [PMC free article] [PubMed] [Google Scholar]
- Werring DJ,Clark CA,Droogan AG,Barker GJ,Miller DH,Thompson AJ ( 2001): Water diffusion is elevated in widespread regions of normal‐appearing white matter in multiple sclerosis and correlates with diffusion in focal lesions. Multiple Sclerosis 7: 83–89. [DOI] [PubMed] [Google Scholar]
- Wieshmann UC,Clark CA,Symms MR,Franconi F,Barker GJ,Shorvon SD ( 1999): Reduced anisotropy of water diffusion in structural cerebral abnormalities demonstrated with diffusion tensor imaging. Magn Resonan Imag 17: 1269–1274. [DOI] [PubMed] [Google Scholar]
- Wittstock M,Wolters A,Benecke R ( 2007): Transcallosal inhibition in amyotrophic lateral sclerosis. Clin Neurophysiol 118: 301–307. [DOI] [PubMed] [Google Scholar]
- Zhang H,Yushkevich PA,Alexander DC,Gee JC ( 2006): Deformable registration of diffusion tensor MR images with explicit orientation optimization. Med Image Anal 10: 764–785. [DOI] [PubMed] [Google Scholar]
- Zhang H,Avants BB,Yushkevich PA,Woo JH,Wang S,McCluskey LF,Elman LB,Melhem ER,Gee JC ( 2007): High‐dimensional spatial normalization of diffusion tensor images improves the detection of white matter differences: An example study using amyotrophic lateral sclerosis. IEEE Trans Med Imag 26: 1585–1597. [DOI] [PubMed] [Google Scholar]
Associated Data
This section collects any data citations, data availability statements, or supplementary materials included in this article.
Supplementary Materials
Additional Supporting Information may be found in the online version of this article.
Supporting Information Figure 1. Results of the original voxel‐based analysis for FA (A) and MD (C). These results were obtained using FA and MD maps that were derived from DTI data after motion and eddy current correction. If an additional b‐matrix correction for the rotational component of the motion correction is applied to the motion and eddy current corrected DTI data, the results for FA (B) and MD (D) show only very minor differences compared with the results obtained without this additional correction.
Supporting Information Table 1. Anatomical location, cluster size and statistics (T‐value and corresponding p‐value that were found in the non‐parametric two‐sample t‐tests) of significant FA reductions and MD elevations in ALS patients compared to controls in the new voxel‐based analysis. CC = corpus callosum; CST = corticospinal tract; CP = cerebral peduncle; CR = corona radiata; PLIC = posterior limb of the internal capsule; WM = white matter; L = left; R = right.